Article

Analysis of Flood Water Level Variation in the Yichang–Chenglingji Reach of the Yangtze River after Three Gorges Project Operation

1
Changjiang Institute of Survey, Planning, Design and Research Co., Ltd., Wuhan 430010, China
2
Changjiang River Scientific Research Institute, Wuhan 430010, China
3
Hubei Provincial Key Laboratory of Basin Water Resources and Ecological Environmental Sciences, Wuhan 430010, China
*
Author to whom correspondence should be addressed.
Water 2024, 16(6), 841; https://doi.org/10.3390/w16060841
Submission received: 21 February 2024 / Revised: 12 March 2024 / Accepted: 13 March 2024 / Published: 14 March 2024

Abstract

:
Since the impoundment of the Three Gorges Project, the downstream hydrology and river dynamics have been modified. The Yichang–Chenglingji Reach (YCR), as a part of the mainstream of the Middle Yangtze River, has consequently been significantly scoured, which has resulted in stream trenching and section enlargements, without showing any obvious trend in flood level variation, however. This phenomenon can be caused by the increase in riverbed resistance due to river geomorphological change and bottomland vegetation development and the backwater effect of Dongting Lake. To investigate how these factors influence the flood water levels, this study analyzed the variations in the influencing factors based on observational data, theoretical analysis and mathematical modelling, including river channel scouring, riverbed resistance, and the influence of Dongting Lake backwater. Then, the impact of these factors on flood levels was evaluated, followed by a comparative analysis of the effects of various factors. The results show that both the flood backwater height (ΔZ) and the backwater influence range (L) are positively correlated with the outflow intensity (T) at the Chenglingji station. The backwater effect decreases gradually with increasing upstream distance, and the influence on the upstream reach can extend up to Shashi city. It was also indicated that the increase in riverbed resistance due to bottomland vegetation development and river geomorphology are dominant factors in inhibiting flood level declines in the YCR, while the backwater of Dongting Lake just affects local regions. This study can provide a better understanding of the flood level changes of the YCR and thus contribute to flood control and riverbank protection of the Yangtze River in the future.

1. Introduction

The Yangtze River is the longest river in Asia and the third longest in the world. It is an important source of water, transportation, and power generation in China [1,2,3]. However, floods occur frequently in the Yangtze River basin, threatening the survival of human beings and causing extensive damage to the environment [4,5,6]. In order to achieve sustainable development of the Yangtze River, the Three Gorges Project was initially designed and built upstream to manage flood events more effectively and alleviate downstream flooding [7,8]. It has played a critical role in reducing the risk of flooding in the downstream areas of the Yangtze River, protecting millions of people and their properties from the devastating effects of floods [6,9,10,11]. The main part of the Three Gorges Project is a massive concrete dam and an impounding reservoir. Outflow from the reservoir can be changed rapidly and consequently alters the flood characteristics in the downstream reaches of the dam. Therefore, to optimize the Three Gorges Project for flood control, it is necessary to understand how and why flood water levels are affected downstream.
Since the impoundment of the Three Gorges Project, it has profoundly modified the downstream flow-sediment regimes. The Yichang–Chenglingji Reach (YCR) of the Middle Yangtze River has been scoured due to the discharge of water [12,13,14]. River channel scouring has decreased the channel elevation and extended the discharge area [15,16]. Based on observations and findings from related research, when the river channel was scoured, the low water level in the YCR dropped obviously. Meanwhile, the flood water level variation showed no obvious trend. Similar variations in flood and low water levels have also been observed at the downstream reaches of many other hydraulic engineering projects worldwide [10,17,18,19].
Research on the impacts of climate change and human activities in the Yangtze River and Dongting Lake has been widely conducted, indicating that river dynamics and flood characteristics, such as river incision, streamflow, flood occurrence, river water surface, and water storage, can be affected by climate change [20,21,22,23]. To discuss their impacts on flood water levels in the YCR in a more straightforward way, river morphological processes and backwater for Dongting Lake should be analyzed. As is known, the maintenance of the flood water level in river channels can be caused by the increase in integrated riverbed resistance, but the resistance increase rate and how it changes over time should be identified [24,25]. Many factors, including sand grain, sand waves, and vegetation, have been considered as causes of alluvial river integrated resistance [26,27,28]. The theoretical relationship between the resistance of river channels and various morphological parameters is one of the research focuses currently [13,25,29,30,31]. Moreover, quantifying various morphological parameters remains challenging in river dynamics due to the complex and dynamic river morphological processes, difficulty in obtaining high-resolution data across large river networks, a lack of measurements in remote or inaccessible regions, limited understanding of the complex interactions among morphological parameters, and influences from natural and anthropogenic changes [32,33,34,35,36]. On the other hand, the flood level in the YCR is also affected by the backwater for Dongting Lake. Due to the mutual interference and restraint in the mainstream of the Yangtze River and the outflow from Dongting Lake, the relationship between them is complex and unstable, with this being one of the hot research topics in the academic field [37,38].
Accordingly, intensive studies on flood water levels in the middle reaches of the Yangtze River, discharge and sediment diversion in the three outlets along the Jingjiang River, river channel scouring, water level at the Chenglingji station, and water regime of Dongting Lake have been conducted. For example, Liu et al. [39] found that the backwater effect of Dongting Lake on the Yangtze River has become increasingly stronger between January and April in recent years. Mao et al. [40] revealed that although the lake outflow decreases under medium and low flow conditions, the water level tends to rise. Chai et al. [41] analyzed the variation characteristics of water levels in the Jingjiang Reach of the Yangtze River from 1991–2016 and pointed out that the variation characteristic in terms of the “high flood discharge at a high water level” before 2003 has transformed into a “middle flood discharge at a high water level” since 2009 due to the combined effects of the increase in integrated roughness and river scouring.
In detail, there exists a junction angle between the inflow of the mainstream and the outflow of Dongting Lake, as water from Dongting Lake flows into the Yangtze River at the Chenglingji station, which can be regarded as the lateral inflow condition for the Jingjiang Reach [40]. However, there is a backwater effect when the two streams of water meet. Obviously, the backwater effect depends on the dynamic contrast between the two streams. If the mainstream discharge decreases and the discharge from Dongting Lake at the Chenglingji station increases, the backwater effect of Chenglingji outflow on the mainstream is greater. Otherwise, the backwater effect of the mainstream on Chenglingji remains [42,43]. However, the backwater effect of the Chenglingji outflow on the YCR exists in both flood and dry seasons due to its continuous natural inflow. For flood control and management in the Yangtze River, how the Chenglingji outflow influences the flood level of the Jingjiang Reach in the flood seasons deserves more investigation. However, to date, few studies have been conducted on the influence of the Chenglingji outflow on flood levels in the YCR under different flood-encountering scenarios. Accordingly, the flood backwater height and the backwater influence range in the YCR have not yet been clearly identified. Similarly, the influences of factors such as river morphology and vegetation resistance variations, as well as the backwater, which inhibit the decline of flood water levels also need to be further studied.
The main objective of the present study is to investigate the dominant mechanism and influencing factors of flood water level in the YCR since the operation of the Three Gorges Project. Firstly, based on observational data, flood level variations in recent years were simulated using a one-dimensional channel network mathematical model. After analyzing the influences of river scouring, riverbed resistance, and Dongting Lake backwater, the effect of these factors on flood water levels was evaluated. In the end, the dominant factors inhibiting flood level declines were discussed.

2. Methods and Data

2.1. Study Area

The YCR has a total length of 408 km and basically comprises 3 parts: the Yizhi Reach (YZR, from Yichang to Zhicheng, ~60.8 km in length), the Upper Jingjiang Reach (UJR, from Zhicheng to Ouchikou, ~171.7 km in length), and the Lower Jingjiang Reach (LJR, from Ouchikou to Chenglingji, ~175.5 km in length) (see Figure 1). Notably, the YZR is a transitional section from a mountainous river to a plain alluvial river. The riverbed is mainly composed of gravel mixed with some pebbles that strongly resist scouring. However, in the UJR, many bends exist, some of which have central bars: the estuary bounds the sandy pebble riverbed upstream and the sandy riverbed downstream. The UJR is also relatively resilient to scouring because of the thick clay layer on the surface soil of its riverbank and the dense distribution of pebbles on its bottom layer. Conversely, the LJR has a typical meandering river channel, whose riverbed mostly comprises scourable and movable medium-fine sand with a median particle size of ~0.18 mm. Because of its dramatic evolution, the riverbed is characterized by a thick overlaying sheet.
Entering its cofferdam power generation period, the Three Gorges Project at Sandouping, Yiling District, Yichang City, was impounded to 135 m on 10 June 2003. On 27 October 2006, it was impounded to 156 m and started its initial operation period. After an experimental impoundment of 175 m in 2008, on 26 October 2010, the Three Gorges Reservoir was impounded to 175 m for the first time, followed by a continuous 175 m impoundment to fulfill its established functions. In September 2015, the project received final approval. Since its operation, a large amount of sediment has been held up in the reservoir, which causes the YCR downstream of the Three Gorges Dam to experience continuous adjustments and suffer the most intensive erosion, especially in the medium flow channels [44].

2.2. Data

In situ observations used in this study include the topographic data of the YCR in 2002, 2006, 2011, and 2016, as well as the measured daily water level, discharge, and sediment data of the 6 hydrometric stations (see Table 1). The bed sand gradation data in 1998~2015 of the YCR and the elevation differences between some typical river islands and the main braided streams in 2002~2016 were also collected. The braided streams include Yanzhiba, Guanzhou, Dongshizhou, Jiangkou, Mayangzhou Taipingkou, Sanbatan, Tuqizhou, Jiaoziyuan, Daokouyao, Wuguizhou, and Xiongjiazhou.

2.3. Methodology

2.3.1. 1D Channel Network Mathematical Model

In this study, a 1D channel network mathematical model was used for flow calculations. The unsteady water flow dynamics in a channel can be described by the Saint–Venant equations [45]:
Q x + B Z t = 0
Q t + x β Q 2 A + g A Z x + J f = 0
where x and t are the spatial and temporal variables, in m and s; Q is the flow discharge (m3/s); Z is the water surface elevation (m); B is the river width (m) and A is the flow area (m2); g is the gravity acceleration (m/s2); β is the momentum correction factor; and J f is the water-surface gradient. To set up the 1D channel network mathematical model based on a single channel, the mass continuity and momentum conservation should be considered at each branch point, which can be described as:
l = 1 L ( m ) Q m , l n + 1 = 0
Z m , 1 = Z m , 2 = = Z m , L m = Z m
where m = 1,2,…,M; M is the number of the branch points in the river network; L(m) is the number of branches connecting to the branch point m; Zm,l is the water surface elevation of the branch l connected to the branch point m; and Q m , l n + 1 is the flow discharge of the inflow or outflow at the branch point m from the branch l. The discrete solutions of the above equations based on the linearized Preissmann four-point implicit scheme are:
a i Z i + 1 + b i Q i + 1 = c i Z i + d i Q i + e i
where coefficients a, b, c, d, e and a’, b’, c’, d’, e’ merely depend on the water surface elevation and flow discharge at every time step.
To set up the model, along the 1283 km river channel from Yichang to Datong, the inflow of Qingjiang River, Dongting Lake, Hanjiang River, and Poyang Lake as well as the discharge of distributary channels including the Songzi River at Songzikou, the Hudu River at Taipingkou, and the Ouchi River at Ouchiko was taken into consideration. Based on the stage-discharge relationships between the discharge of the Songzi River and the water level at the Zhicheng hydrometric station, the discharge of the Hudu River and the water level at the Shashi hydrometric station, and the discharge of the Ouchi River and the water level at the Shishou hydrometric station, the amount of the diverted discharge can be determined. Specifically, discharge data at the Yichang hydrometric station upstream and the stage-discharge relationship at the Datong hydrometric station downstream were defined in the model. Based on the river network structure, braided streams were considered in the simulation and different branching streams were generalized into different river reaches.

2.3.2. Calculation of the Influencing Factors

Outflow intensity T
In this study, the outflow intensity T at the Chenglingji station was defined as the ratio of the discharge at the Chenglingji station to that at the Yichang station, as shown below:
T = Q C h e n g l i n g j i Q Y i c h a n g
where QChenglingji is the discharge at the Chenglingji station (m3/s) and QYichang is the discharge at the Yichang station (m3/s).
River integrated roughness n
In open channel hydraulics, the constant uniform flow formula [46] is widely used, shown as:
Q = A U = A C R J
where Q is the discharge of the cross-section (m3/s); A is the area of the cross-section (m2); U is the average discharge of the cross-section (m/s); C is the Chezy coefficient (m1/2/s); R is the hydraulic radius (m); and J is the river gradient. C can be calculated according to the following formula [47]:
C = 1 n R 1 / 6
where n is the roughness coefficient of the river channel (s/m1/3). Substituting Equation (9) into Equation (8) yields:
Q = A 1 n R 2 / 3 J 1 / 2
Based on the flow conservation law, Q is equal to the channel discharge Q b e a c h plus the channel discharge Q c h a n n e l , which is:
Q = Q b e a c h + Q c h a n n e l
Substituting Equation (10) into Equation (11) yields:
A 1 n R 2 / 3 J 1 / 2 = A b e a c h 1 n b e a c h R b e a c h 2 / 3 J 1 / 2 + A c h a n n e l 1 n c h a n n e l R c h a n n e l 2 / 3 J 1 / 2
where A b e a c h , n b e a c h , and R b e a c h are the discharge area, roughness coefficient, and hydraulic radius of the beach area, respectively; A c h a n n e l , n c h a n n e l , and R c h a n n e l are the discharge area, roughness coefficient, and hydraulic radius of the channel area, respectively. The hydraulic radius R can be calculated by the following equations:
R = A χ
R b e a c h = A b e a c h χ b e a c h
R c h a n n e l = A c h a n n e l χ c h a n n e l
where χ b e a c h and χ c h a n n e l are the wetted perimeters of the beach and the channel, respectively.
As gradients of the beach and channel can be regarded as equal to J. the relationship can be obtained between the river integrated roughness coefficient n, the beach roughness coefficient n b e a c h and the channel roughness coefficient n c h a n n e l as follows:
1 n A 5 / 3 χ 2 / 3 = 1 n b e a c h A b e a c h 5 / 3 χ b e a c h 2 / 3 + 1 n c h a n n e l A c h a n n e l 5 / 3 χ c h a n n e l 2 / 3
Once the relationship between χ b e a c h and χ c h a n n e l is obtained, n can be derived by a function of n b e a c h and n c h a n n e l .

3. Results and Analysis

3.1. River Network Modelling

The river network model was calibrated and validated using the hydrological data in 2014, including the discharge and water level of the 6 stations shown in Table 1. The validation results show that the relative error is basically within ±10% (see Table 2), indicating that the parameters selected for the model are suitable to ensure accurate simulation.

3.2. Analysis of Riverbed Scouring

From 2002 to 2016, the total sediment scouring amount in the river channel was 2.094 billion m3, with an average annual scouring amount of 145 million m3/a and an average annual scouring intensity of 152,000 m3/km·a. Scouring was also notably concentrated in low-discharge channels, accounting for 92% of the total scouring amount.
On one hand, river scouring led to overall longitudinal trenching. For instance, the average elevations of the thalweg profile in 2002, 2006, 2011, and 2016 were 22.285, 20.964, 19.374, and 19.496 m, respectively. Therefore, the average accumulative longitudinal trenching values from 2002 to 2006, 2002 to 2011, and 2002 to 2016 were 1.317, 2.906, and 2.860 m, respectively. On the other hand, river scouring expanded the discharge cross-section. According to the results of a statistical analysis based on the data from fixed sections of the YCR, the proportions of sections with an increased discharge area in 2002, 2006, 2011, and 2016 were 0.00%, 73.64%, 90.91%, and 94.09%, of which the average discharge area increased on average by 0.00%, 4.00%, and 10.00%, respectively.

3.3. Analysis of River Resistance

3.3.1. Riverbed Sediment Coarsening

The composition of riverbed sediments is one of the factors influencing the morphological resistance of the riverbed surface. The variation in the median particle size of riverbed sediments along some typical river sections from Yichang to Chenglingji is shown in Figure 2. Notably, because sediments were sorted due to river scouring, the particle size has increased significantly since 2003. For example, while the median particle size increased from 0.211 to 0.280 mm in the Zhijiang Reach of the UJR, from 2003 to 2016, it increased from 0.182 to 0.238 mm in the Shishou Reach of the LJR. Because the particle roughness height ks positively relates to the median particle size d50 of riverbed sediments, riverbed surface resistances should inevitably increase with particle size growth.

3.3.2. Beach-Channel Elevation Difference

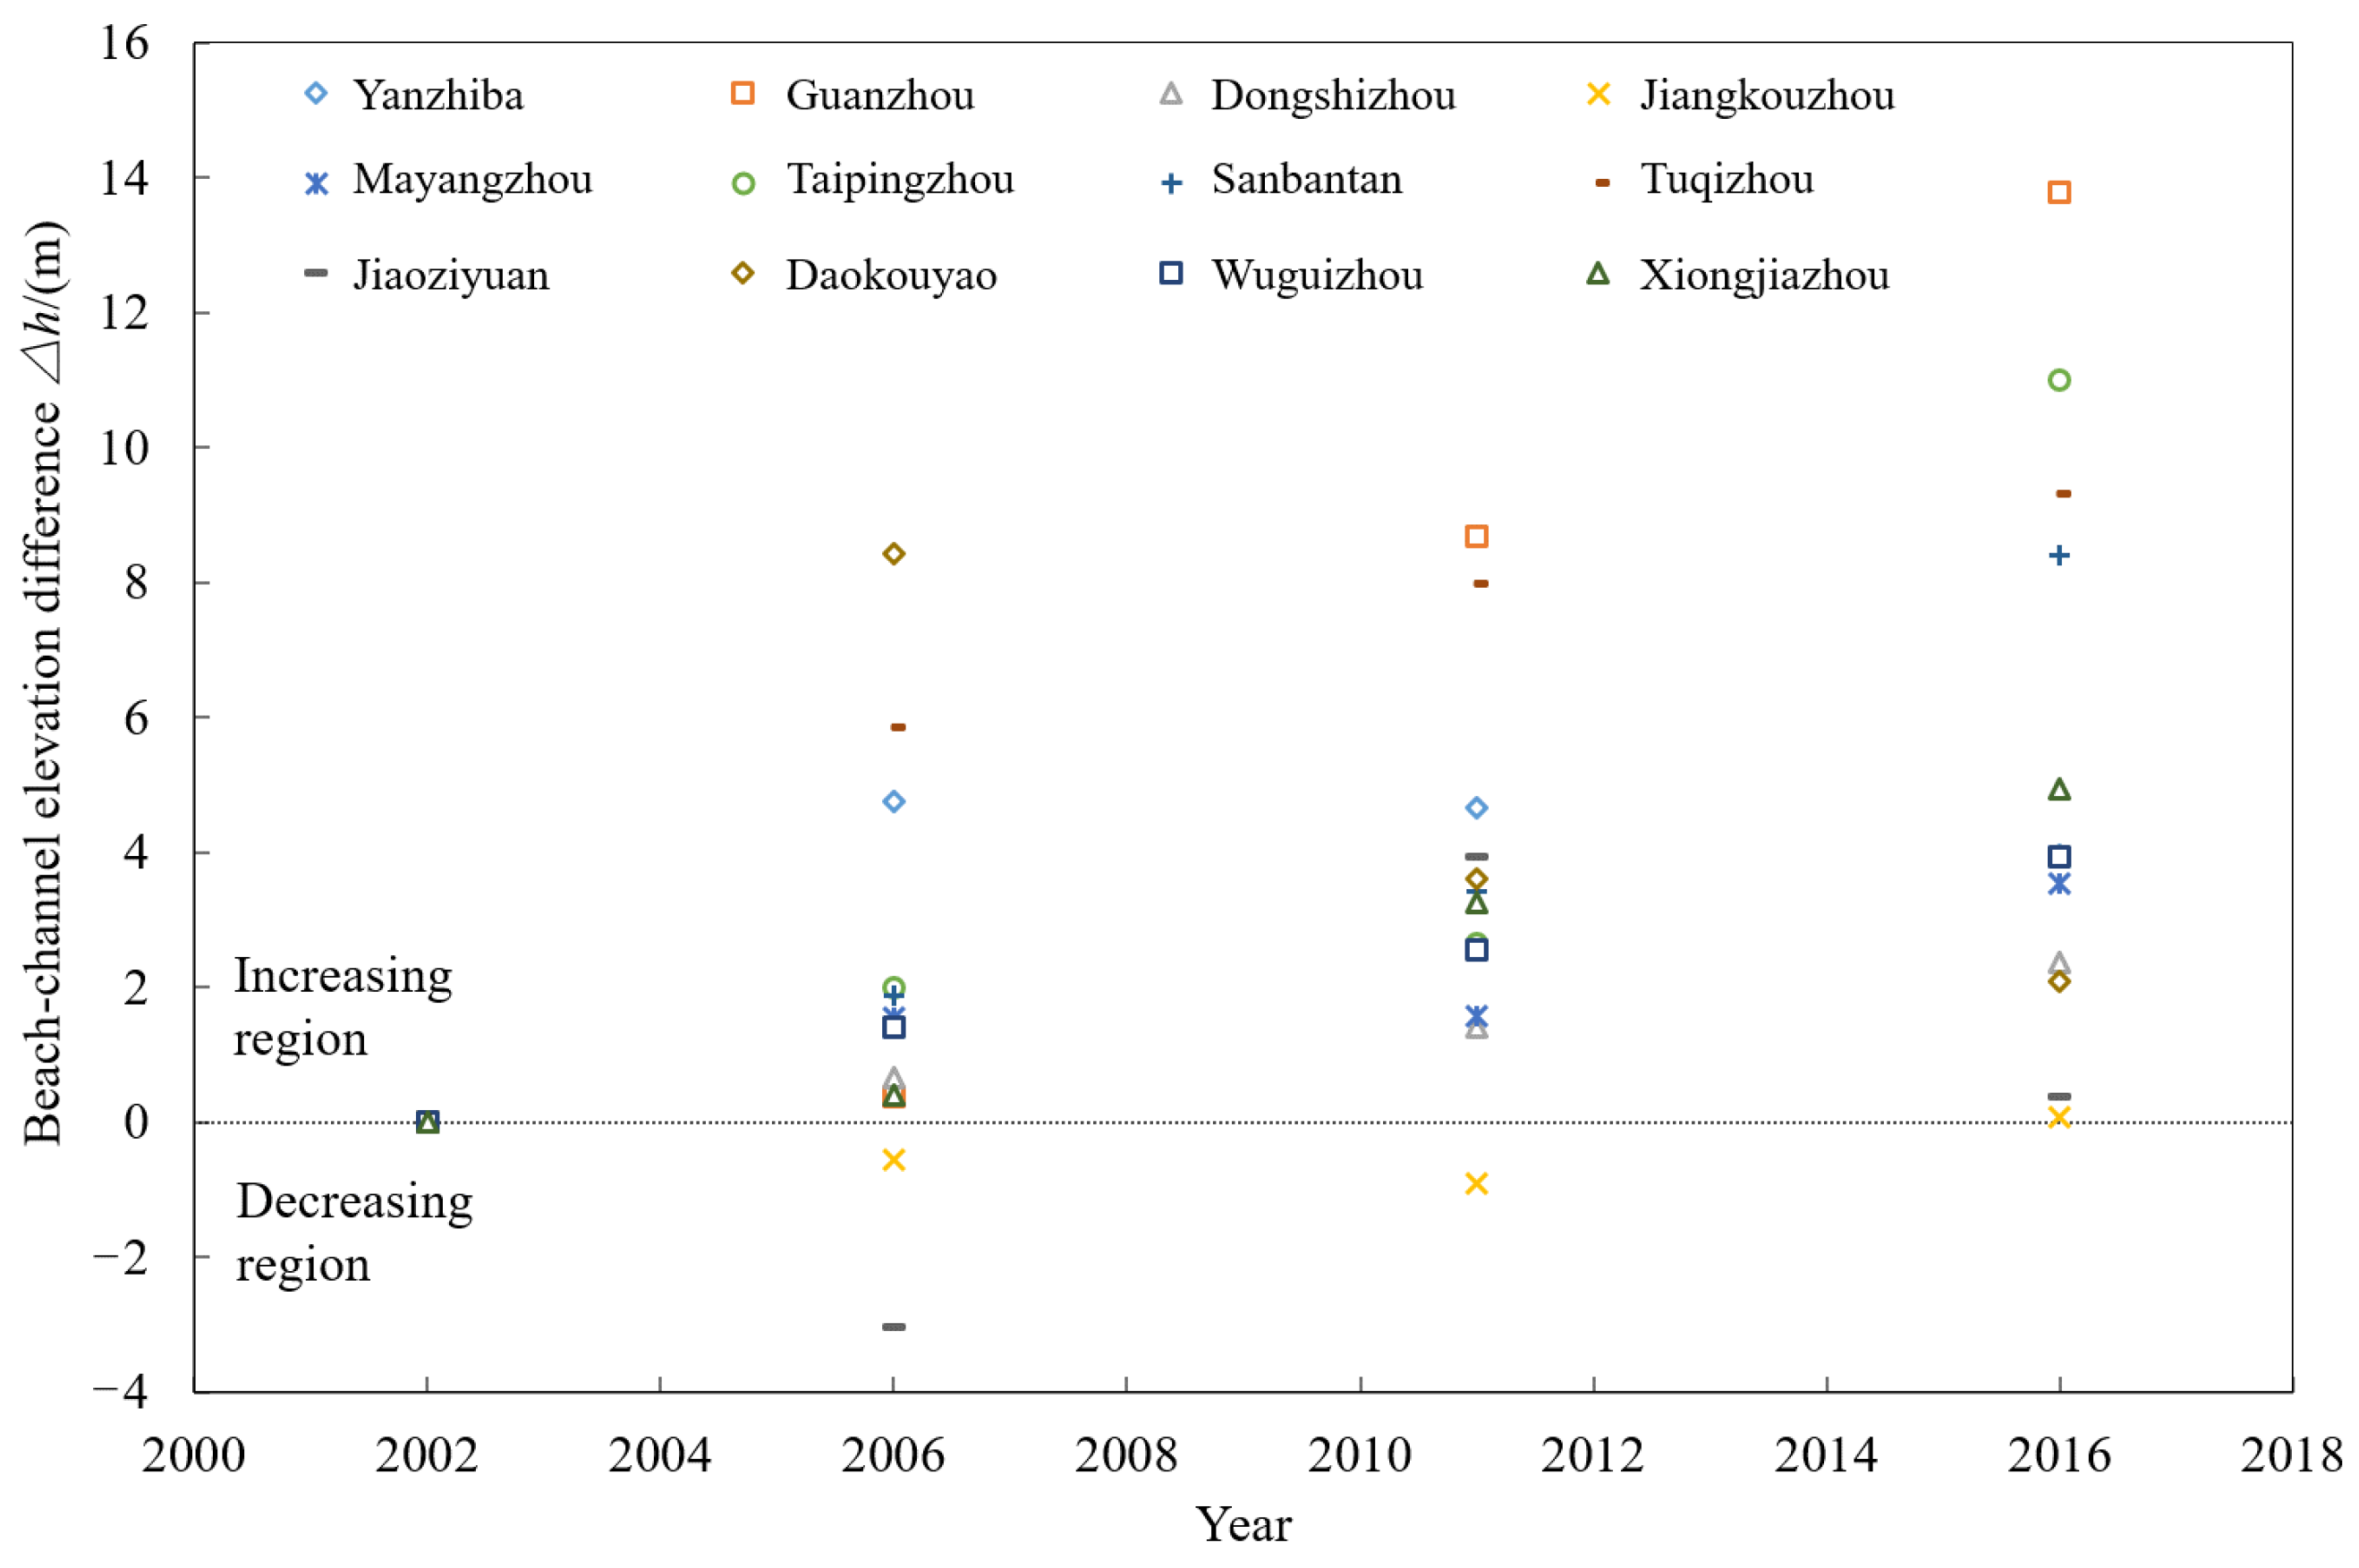
Because large beach-channel elevation difference Δh also affects riverbed surface morphological resistance, variations in this factor at the main braided streams of the YCR in recent years were counted. The results are shown in Figure 3, where the beach-channel elevation difference Δh refers to the elevation differences between the river island and its main braided stream. Although the beach-channel elevation difference of all braided streams increased to varying degrees, except for the Jiangkou and Daokouyao braided streams, the beach-channel elevation differences between the Guanzhou, Taipingkou, Sanbatan, Taitanzhou, and Wuguizhou braided streams increased significantly. From 2002 to 2016, for example, while the beach-channel elevation difference Δh of the Guanzhou braided stream increased by at most about 300% due to the recent alternation of major–minor branches, this difference in the Jiaoziyuan braided stream increased by the smallest margin of approximately 15%. As a result, the riverbed resistance correspondingly increases when the beach-channel elevation difference increases.

3.3.3. Bottomland Vegetation

The growth of bottomland vegetation has been proven to have a significant impact on the resistance of flood channels [26,48]. It can be affected by climate change as well as anthropogenic activities. Accordingly, since the operation of the Three Gorges Project, the inflow processes at downstream channels during the flood season have changed, particularly their peak-clipping effects, resulting in desirable vegetation development conditions due to the significant decrease in the water coverage probability of the beaches at downstream channels. Based on observed data, through theoretical analysis, field investigations, and physical experiments, it has been revealed that the impoundment of the Three Gorges Reservoir was the dominant factor for the significant increase in the vegetation coverage of some beaches at lower reaches, thus resulting in a pronounced increase in river channel resistances. For example, Lu [49] conducted a flume experiment and found out that due to vegetation-based variations, the increase in roughness was approximately 16.7–57.3%. Yao et al. [50] pointed out that because of the increased vegetation coverage in the Chenglingji–Hankou reach in the Middle Yangtze River, the roughness of some sections increased by approximately 39.8–76.8% with an average value of 53.4% from 2003 to 2016 by analyzing the in situ data. Therefore, considering the increase in bottomland vegetation coverage, the increased ratio of roughness is assumed to be approximately 53.4% in the YCR in this study.

3.4. Analysis of the Backwater

3.4.1. Occurrence of Floods in Dongting Lake and the Mainstream of the Yangtze River

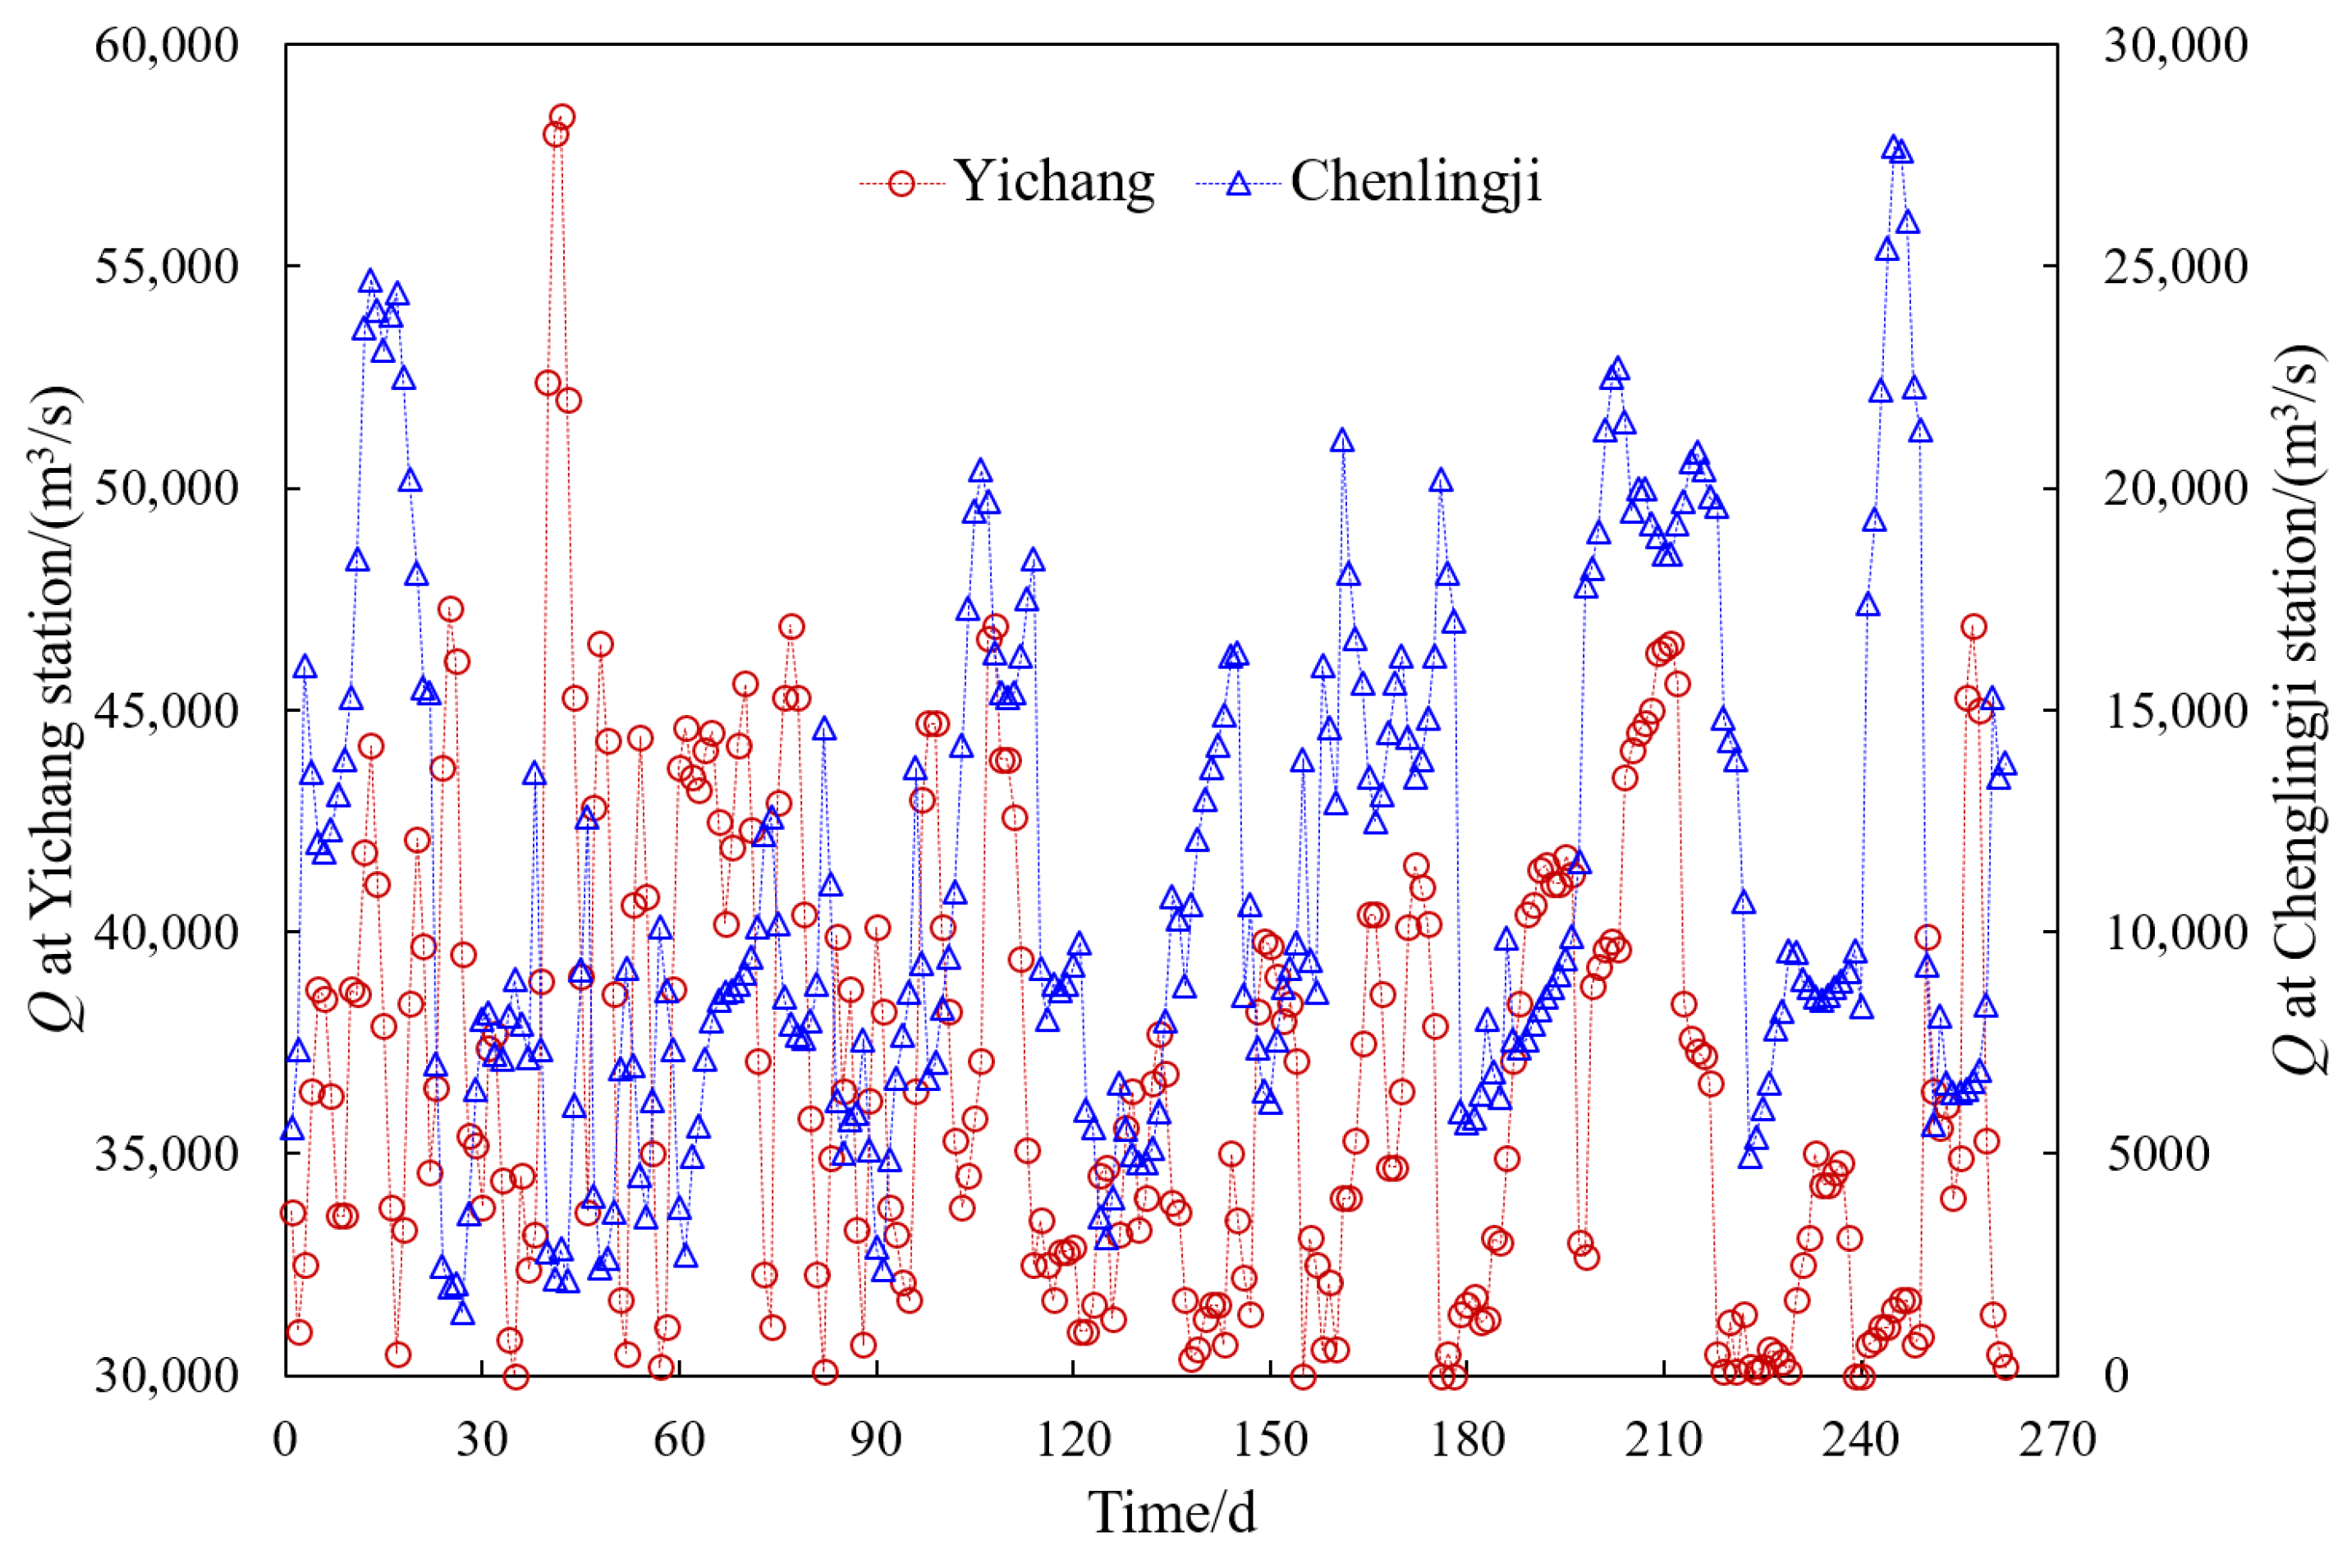
The discharge processes at the Yichang hydrometric station from 2003 to 2017 and the Chenglingji hydrometric station from 2003 to 2015 are shown in Figure 4. For Yichang station, although the discharge at flood seasons ranged from 15,000 to 58,000 m3/s at this station, the peak discharges showed significant interannual variations with the minimum of 27,400 and the maximum of 58,000 m3/s. Similarly, at the Chenglingji station, the flood discharge varied from 8000 to 28,000 m3/s with the average flood discharge of ~10,000 m3/s. The maximum and minimum peak discharges were 28,000 and 13,800 m3/s, respectively.
Figure 5 shows the relationship between flood discharges at the mainstream of the Yangtze River (i.e., the flood discharge at the Yichang station above 30,000 m3/s) and at the Chenglingji station. The correlation coefficient R2 was only 0.0184, which indicates that floods are unlikely to occur concurrently during the flood season both at the mainstream of the Yangtze River and Dongting Lake. However, it still could happen. For example, during the 2012 flood season, while the mainstream’s discharge exceeded 45,000 m3/s, that at the Chenglingji station exceeded 20,000 m3/s. Therefore, to investigate how simultaneous floods affect the backwater effect of Dongting Lake on the Jingjiang River, it is necessary to take the extreme condition and its negative consequences of potential simultaneous flood peaks at both the mainstream and the Chenglingji station into consideration.
The one-dimensional river network mathematical model was used to analyze the impact of overflow, with the flood discharge of the Yichang station being 55,000, 50,000, and 45,000 m3/s. To study the effect of the backwater at the Chenglingji station on the flood water level in the Jingjiang Reach, based on the observed discharge data, four working conditions were developed to determine the outflow at the Chenglingji station: 10,000, 15,000, 20,000, and 25,000 m3/s. Although extreme weather due to climate change may lead to larger flood discharges, based on the above model setting, extreme flood encountering scenarios can be simulated considering flood magnitudes in 2003~2016. There is a continuous backwater impact because of the continuous outflow at the Chenglingji station. Thus, because the average discharge during the flood season at Chenglingji was ~10,000 m3/s, this value was defined as the comparative working condition. Finally, by comparing the calculation results of other working conditions with those at 10,000 m3/s at Chenglingji, the amplitude and range of the backwater impact were obtained. As the backwater impact is related to the relative outflow intensity of the mainstream of the Yangtze River and the Chenglingji station, the outflow intensity should not be reflected only by the discharge at the Chenglingji station. Based on this setting (see Equation (7)), T ranges from 0.27 to 0.56. Subsequently, the impact of backwater is mainly based on two factors: the flood backwater height ΔZ and influence range L.

3.4.2. Backwater Height ΔZ

The backwater height ΔZ of each station varied with the outflow intensity T at the Chenglingji station as shown in Figure 6. It can be observed, that at the upper reaches, the backwater effect, represented by ΔZ, gradually increased with an increase in T. The maximum backwater heights at the Jianli, Tiaoguan, Shishou, Xinchang, and Haoxue stations were 0.66, 0.36, 0.22, 0.20, and 0.17 m, respectively. The backwater influence is also affected by distance. Figure 6 also shows that ΔZ caused by backwater impact becomes stronger as the distance to the Chenglingji station decreases. The slope k of the linear fitting equation of the Jianli, Jiaoguan, Shishou, Xinchang, and Haoxue stations was 1.67, 0.88, 0.56, 0.57, and 0.47, respectively. It decreases gradually with the increasing distance, which means that the level of the backwater influence decreases with the increasing distance.

3.4.3. Backwater Influence Range L

The upstream influence range L corresponding to ΔZ ranges with the outflow intensity T at the Chenglingji station (see Figure 7). The influence ranges L of 5, 10, 15, and 20 cm of ΔZ are shown. Notably, at different ΔZ, the influence distance L similarly shows a nonlinear increasing trend as the inflow intensity T increases, while the growth rate decreases. To discuss the maximum backwater range that may affect the upstream regions, it can reach 226 km to Shashi, 206 km to Gongan, 187 km to Haoxue, and 160 km to Ouchikou at ΔZ of 5, 10, 15, and 20 cm, respectively. Thus, the greatest influence range covers the Shashi–Chenglingji Reach of the Jingjiang Reach of the Yangtze River.

4. Discussion

Flood levels at the YCR can decrease because of riverbed scouring, while morphological changes, vegetation resistance, and backwater at the Chenglingji station can cause the increase. Based on the analysis in Section 3, the influence of various factors on flood level variations should be further discussed. Declines in flood levels due to riverbed scouring can be generated from the flood level simulation in 2002 and 2016 via mathematical modelling. At the Yichang station, the flood level variations were accessed based on the discharges of 55,000, 50,000, and 45,000 m3/s. To evaluate the backwater influence, the extreme condition in which concurrent floods occurred both in the mainstream and Dongting Lake was considered (see Section 3.3).
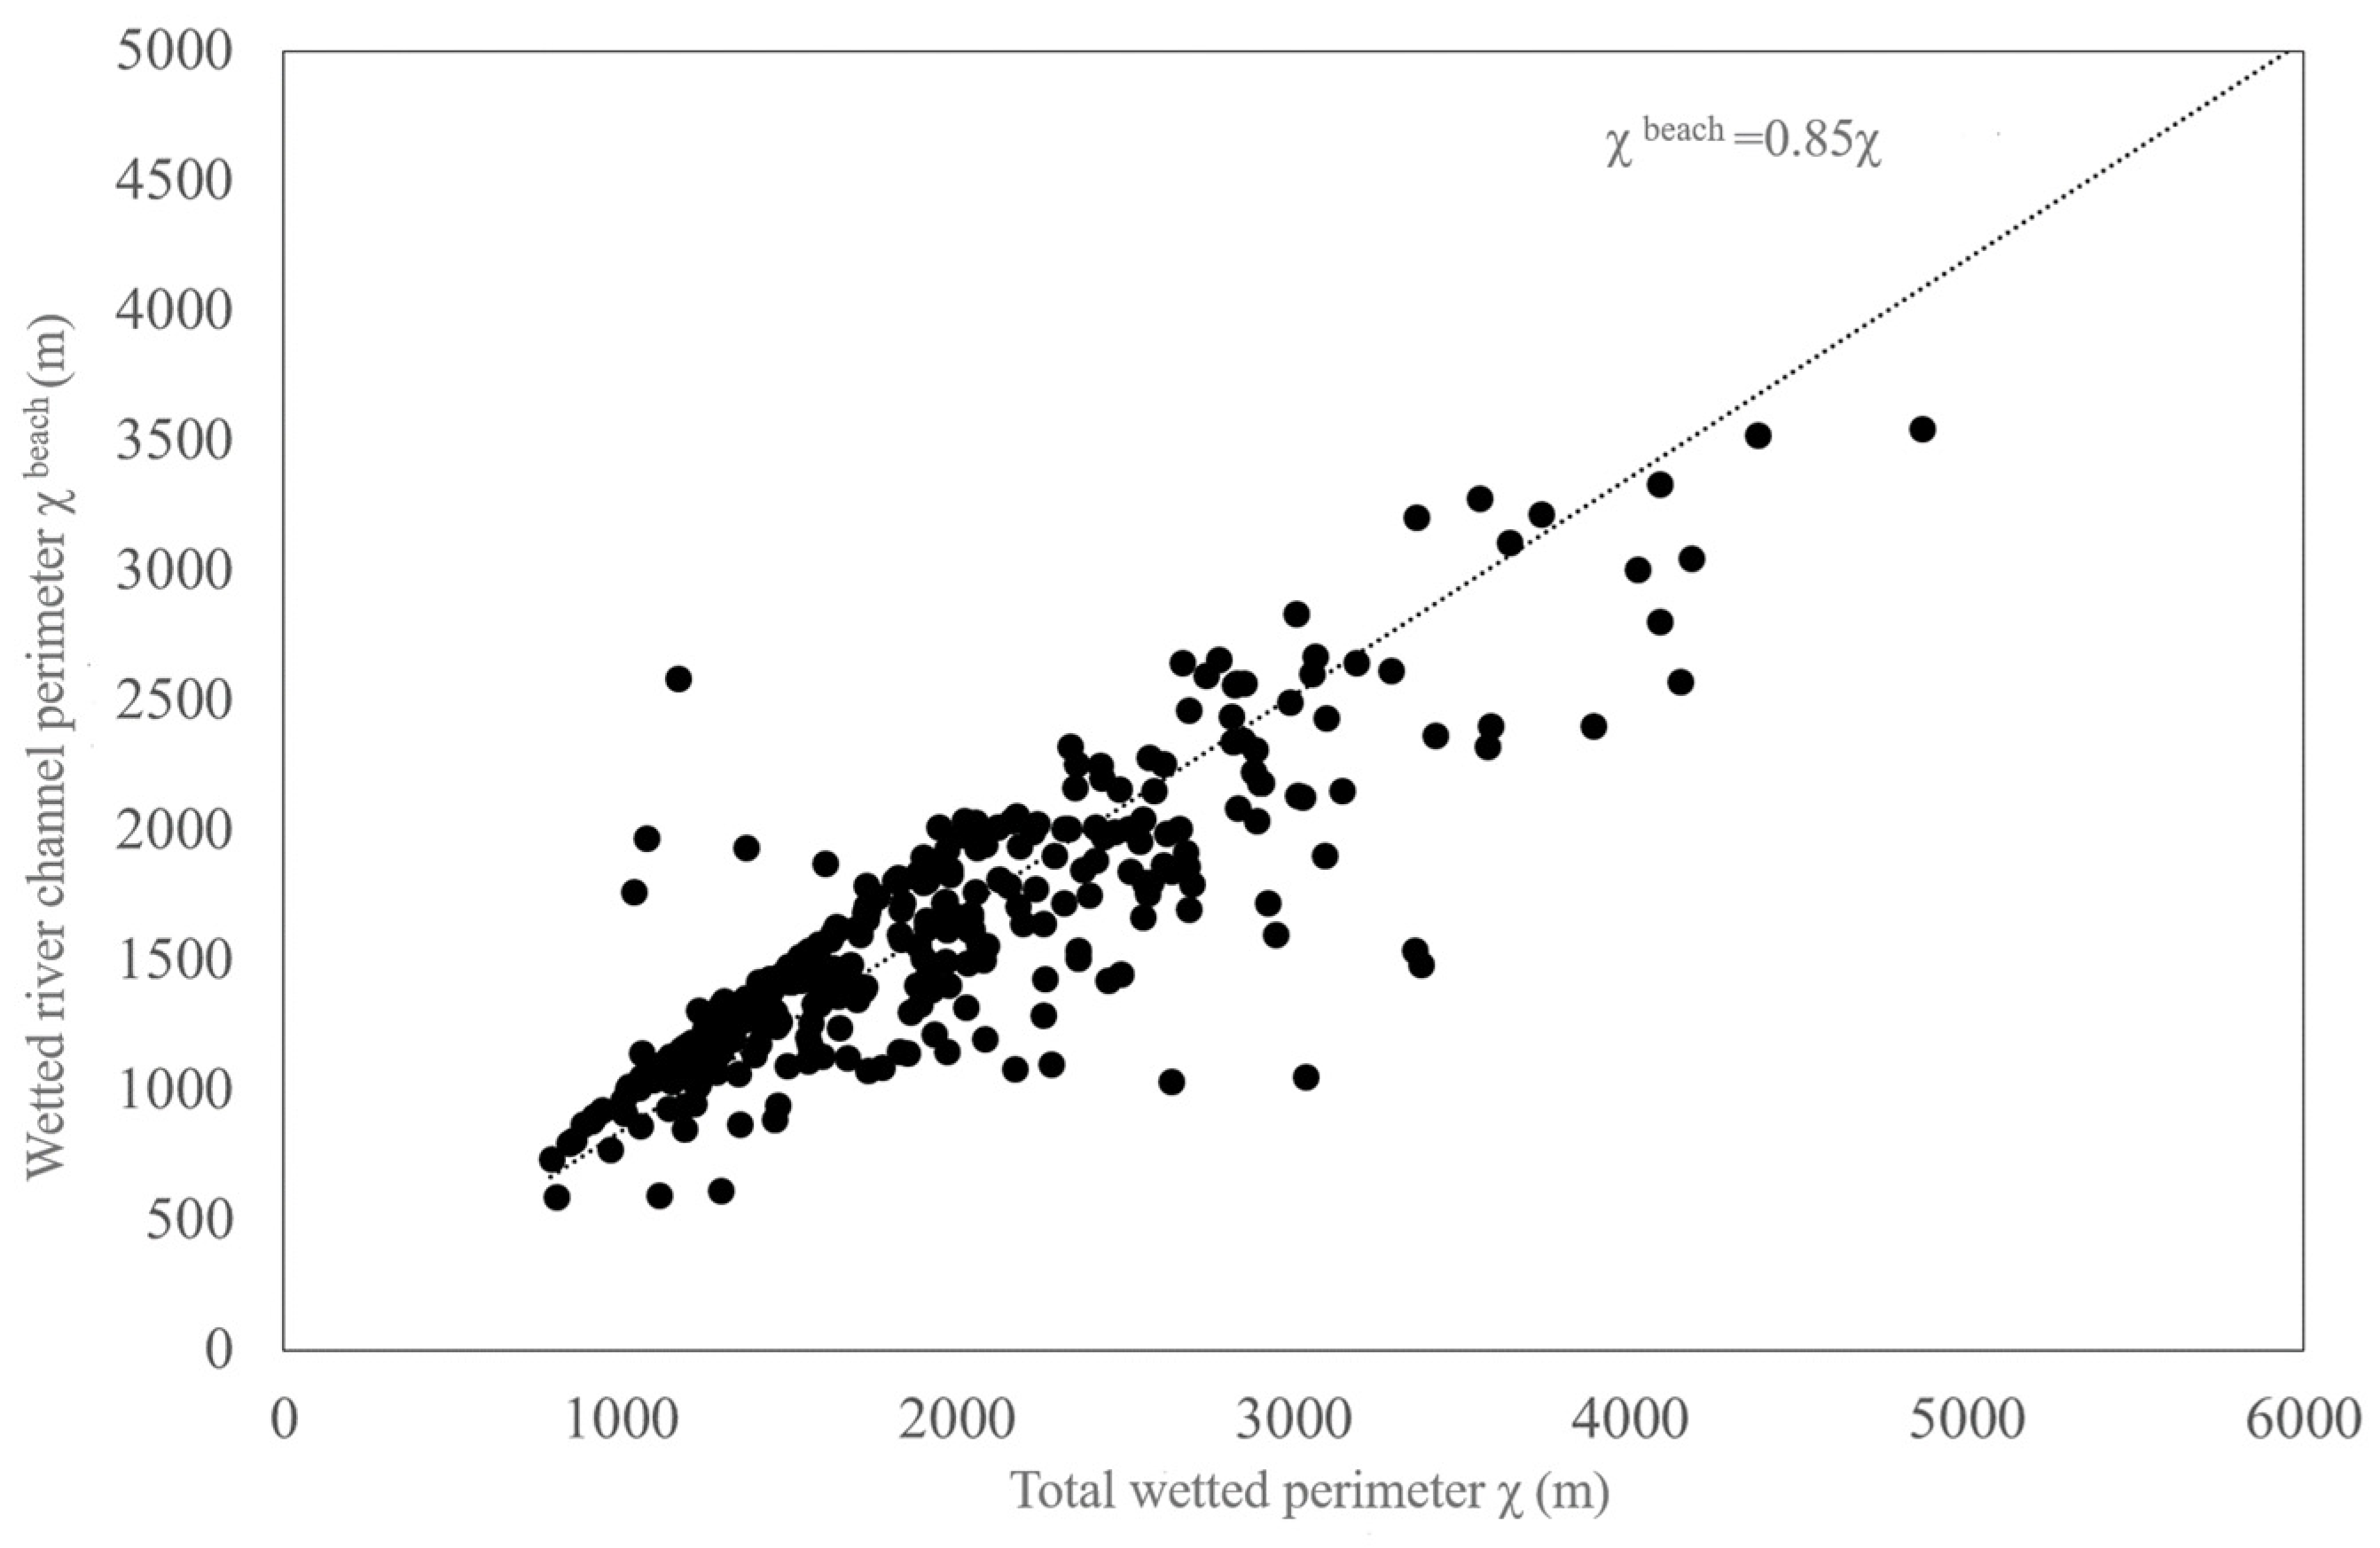
The resistance variation influence is relatively complex because different resistance units act at different riverbed surface areas. In addition, the theoretical relationship between the roughness morphology and coefficient is still under exploration, making its influence on the river roughness coefficient n difficult to quantify. Furthermore, riverbed armoring and the increase in the beach-channel elevation difference mainly affect the river channel, while the vegetation effect can be observed generally on the beach surface with higher elevation. Therefore, to study how flood levels can be affected by different resistance units, it is necessary to separate the river beach and river channel and explore whether there is a relatively stable relationship between the beach and river channel on the cross-section. If it exists, an integrated roughness coefficient calculation formula based on beach and channel zoning can be developed. According to the flood bankfull water level, wetted beach perimeter χ beach and wetted river channel perimeter χ channel at the cross-section can be analyzed separately. The statistical analysis results of 350 typical sections in the YCR are shown in Figure 8.
It is evident from Figure 8 that a relatively stable relationship exists between the wetted perimeter of the natural river beach (χ beach) and the wetted perimeter of the river channel (χ channel), with the ratio of χ beach to χ channel being about 15%:85% via linear fitting. Therefore, incorporating the proportional relationship shown in Figure 8 into Equation (17), the relationship between the integrated roughness coefficient n, the beach roughness coefficient n b e a c h , and the channel roughness coefficient n c h a n n e l can be developed as follows:
n = n b e a c h n c h a n n e l 0.15 n b e a c h + 0.85 n c h a n n e l
From 2002 to 2016, including the beach-channel elevation difference and median particle size d50 of riverbed sediments, riverbed surface roughness parameters generally increased, with them showing a slightly decreasing trend in local regions. Furthermore, except for a few braided streams that experienced main branch adjustments and translocation, causing the elevation difference between the beach and channel to increase greatly, the maximum increment proportion of the overall rough morphology of the river section was 36.97%, not exceeding 40%. Although the roughness height (ks) grows positively along with the morphological roughness parameter (Δ, d50), the theoretical expression between (Δ, d50) and ks was been identified. Therefore, it is more practical to establish a relationship between n c h a n n e l and ks instead of building one between the n c h a n n e l and (Δ, d50). According to the logarithmic velocity distribution formula:
V U = 5.75 l g 12.27 R χ k s
where V is the average velocity (m/s); U is the friction velocity (m/s); and R is the hydraulic radius (m). The constant uniform discharge formula can be calculated as:
V U = R 1 / 6 n g 1 / 3
where g is the gravity acceleration (m/s2). Therefore, the relationship between the roughness coefficient and roughness height can be obtained as follows:
R 1 / 6 n g 1 / 2 = 5.75 l g 12.27 R χ k s
Further deformation of the above formula results in:
n = R 1 / 6 5.75 g 1 / 2 l g 12.27 R χ k s
Assuming that a linear relationship exists between (Δ, d50) and ks when the other variables are constant, (Δ, d50) increases by 40%, increasing ks by 40% and n by 13.6%. Consequently, n c h a n n e l can be assumed to increase by 1.136 times due to the roughness morphology variation. According to the relevant analysis (see Section 3.3.3), n c h a n n e l in the YCR can be set as 1.534 times the original because of the increasing bottomland vegetation. Based on the analysis above, the influences of morphological resistance and bottomland vegetation variations on flood levels can be derived separately.
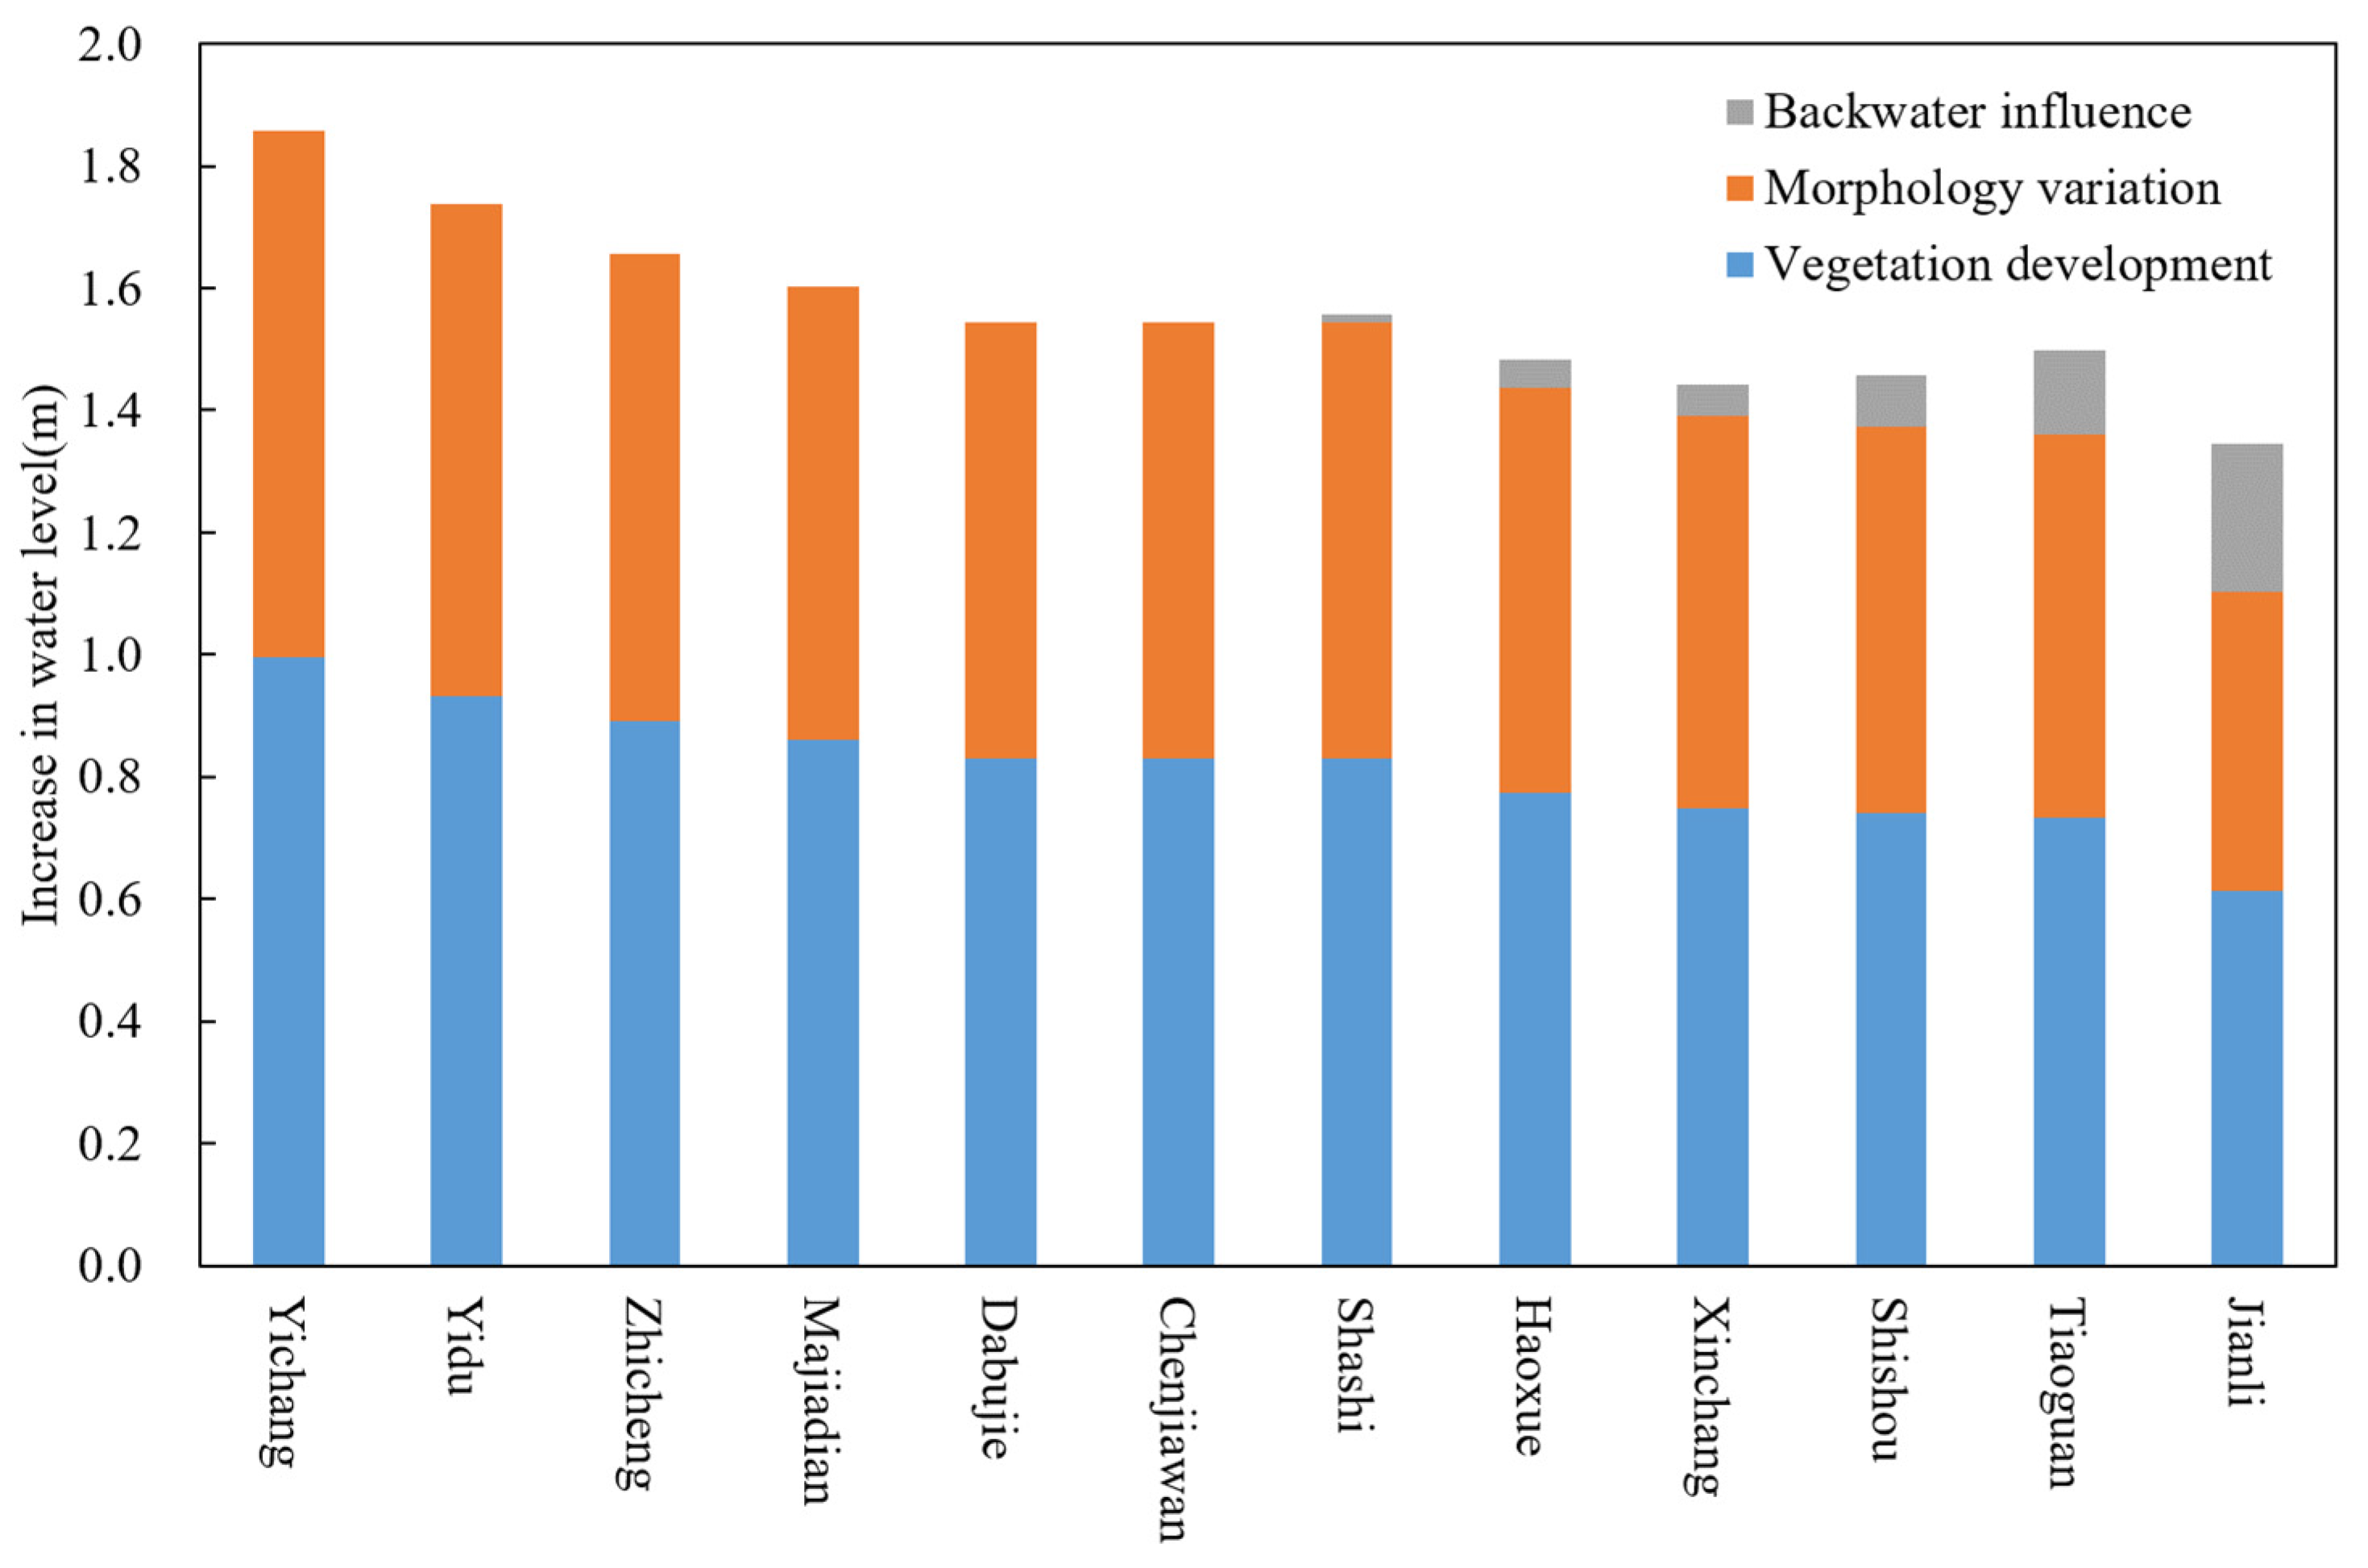
Topographic scouring and trenching decreases flood levels. In contrast, backwater, bottomland vegetation development, and morphological variations (including riverbed surface coarsening and increases in beach-channel elevation difference) can make the flood level increase. Figure 9 demonstrates the contribution of different factors to the increase in flood water levels at the flood discharge of 55,000 m3/s. The comparison between the flood water level decrease (topographic scouring and trenching) and increase (backwater, bottomland vegetation development, and morphological variation) is shown in Figure 10. The results indicate that bottomland vegetation development and morphological variation were the main reasons for the flood level maintenance, while the influence of backwater was relatively concentrated in local areas (from Shashi to Jianli, see Figure 1).
If not considering the influence of backwater at the Chenglingji station, the total water level increase caused by different factors can offset the water-level decrease but not completely. The increase in the water level caused by vegetation development and morphological variation was smaller than the decrease in the water level caused by topographic trenching, resulting in the largest difference between them being ~0.25 m near Dabujie. Although this difference remains within normal fluctuations in the stage–discharge relationship the middle and lower reaches of the Yangtze River, it can be related to other factors because of the complicated composition of river resistance. For example, factors such as cross-sectional morphological variations and river-related construction projects can also lead to high water levels. On the other hand, if taking the influence of the backwater at the Chenglingji station into consideration, the increase in the water level caused by the backwater, the bottomland vegetation development and morphological variations in the Haoxue–Jianli Reach in the local regions were greater than the water-level reduction caused by topographic trenching. The increasing height in water level showed a gradually decreasing trend upstream, with the largest being ~0.3 m near Jianli. Thus, in this study, under the most extreme condition that the flood of the mainstream of the Yangtze River encountered the greatest flood from Dongting Lake, the increasing height in the mainstream should be the largest. Therefore, the high flood water level can be observed in some local regions.

5. Conclusions

In this study, based on observational data from 2002 to 2016, the influence of the river geomorphology, bottomland vegetation development, and backwater effect of Dongting Lake on the flood water levels in the YCR since the operation of the Three Gorges Project was analyzed using a one-dimensional channel network mathematical model. The contribution of these influencing factors was discussed. The main findings of the study are summarized as follows.
(1)
Since the backwater effect decreased gradually with upstream distance increments, a positive correlation existed between the backwater height ΔZ and outflow intensity T at the Chenglingji station in the YCR. Moreover, the backwater influence range L in the YCR correlated positively with T. Thus, given the extreme condition that simultaneous floods occur in the mainstream and Dongting Lake, these influences could extend upstream to Shashi in the YCR.
(2)
Because of the riverbed scouring and trenching processes, the decreasing flood levels in the YCR were mainly due to the increase in riverbed resistance caused by bottomland vegetation development and river channel morphology variations. The high water level caused by bottomland vegetation development and river channel morphology variation can basically offset the flood level decrease caused by topographic scouring and trenching. Moreover, the influence of the backwater of Dongting Lake on flood levels was relatively concentrated in local areas.
This study provides valuable insights into the influences on the variations in flood water levels in the YCR since the Three Gorges Project started operating, which can improve our understanding of flooding occurrence and development in the YCR. It can also provide references for future research on flood control and riverbank protection for the Yangtze River. To further investigate how flood water levels change over time, future studies should also focus on how climate change will affect river morphological processes and floods on long time scales.

Author Contributions

Conceptualization, methodology, data curation, software, funding acquisition, investigation, validation, and visualization, L.J.; supervision, resources, project administration, formal analysis, writing—original draft, writing—review and editing, and funding acquisition, Z.Z. All authors have read and agreed to the published version of the manuscript.

Funding

This study was funded by the National Key Research and Development Program of China (2023YFC3209503) and the National Natural Science Foundation of China (52009007).

Data Availability Statement

The data presented in this study are available from the corresponding author upon request. The data are not publicly available due to other ongoing studies.

Acknowledgments

The authors would like to express their gratitude to the anonymous reviewers for their insightful and constructive comments.

Conflicts of Interest

The first author Lei Jiang is employed by Changjiang Institute of Survey, Planning, Design and Research Co., Ltd. The remaining author(s) declare that the research was conducted in the absence of any commercial or financial relationships that could be construed as a potential conflict of interest.

References

  1. Chen, Z.; Li, J.; Shen, H.; Wang, Z. Yangtze River of China: Historical analysis of discharge variability and sediment flux. Geomorphology 2001, 41, 77–91. [Google Scholar] [CrossRef]
  2. Zhang, J.; Zhang, Z.F.; Liu, S.M.; Wu, Y.; Xiong, H.; Chen, H.T. Human impacts on the large world rivers: Would the changjiang (yangtze river) be an illustration? Glob. Biogeochem. Cycles 1999, 13, 1099–1105. [Google Scholar] [CrossRef]
  3. Hu, B.; Yang, Z.; Wang, H.; Sun, X.; Bi, N.; Li, G. Sedimentation in the Three Gorges Dam and the future trend of Changjiang (Yangtze River) sediment flux to the sea. Hydrol. Earth Syst. Sci. 2009, 13, 2253–2264. [Google Scholar]
  4. Gao, Z.; Long, D.; Tang, G.; Zeng, C.; Huang, J.; Hong, Y. Assessing the potential of satellite-based precipitation estimates for flood frequency analysis in ungauged or poorly gauged tributaries of China’s Yangtze River basin. J. Hydrol. 2017, 550, 478–496. [Google Scholar] [CrossRef]
  5. Fang, H.; Han, D.; He, G.; Chen, M. Flood management selections for the Yangtze River midstream after the Three Gorges Project operation. J. Hydrol. 2012, 432, 1–11. [Google Scholar] [CrossRef]
  6. Liu, L.; Sun, W.; Liu, J. Spatio-Temporal Analysis of Simulated Summer Extreme Precipitation Events under RCP4.5 Scenario in the Middle and Lower Reaches of the Yangtze River Basin. Sustainability 2023, 15, 9218. [Google Scholar] [CrossRef]
  7. Shankman, D.; Lai, X. Severe flood probability on the middle Changjiang (Yangtze River) after completion of the Three Gorges Dam. Front. Earth Sci. 2022, 10, 1006004. [Google Scholar] [CrossRef]
  8. Lan, L.; Xu, Y.; Mei, Y.; Ren, Y.; Tian, Y.; Zhang, X. Optimized flood control for the Three Gorges Reservoir considering evolving flood propagation trends in the Jingjiang Reach of the Yangtze River. Front. Earth Sci. 2022, 10, 1013583. [Google Scholar] [CrossRef]
  9. Liu, P.; Li, L.; Guo, S.; Xiong, L.; Zhang, W.; Zhang, J.; Xu, C. Optimal design of seasonal flood limited water levels and its application for the Three Gorges Reservoir. J. Hydrol. 2015, 527, 1045–1053. [Google Scholar] [CrossRef]
  10. Mei, X.; Dai, Z.; Darby, S.E.; Gao, S.; Wang, J.; Jiang, W. Modulation of Extreme Flood Levels by Impoundment Significantly Offset by Floodplain Loss Downstream of the Three Gorges Dam. Geophys. Res. Lett. 2018, 45, 3147–3155. [Google Scholar] [CrossRef]
  11. Ren, J.; Zhao, M.; Zhang, W.; Xu, Q.; Yuan, J.; Dong, B. Impact of the construction of cascade reservoirs on suspended sediment peak transport variation during flood events in the Three Gorges Reservoir. Catena 2020, 188, 104409. [Google Scholar] [CrossRef]
  12. Lyu, Y.; Fagherazzi, S.; Tan, G.; Zheng, S.; Feng, Z.; Han, S.; Shu, C. Hydrodynamic and geomorphic adjustments of channel bars in the Yichang-Chenglingji Reach of the Middle Yangtze River in response to the Three Gorges Dam operation. Catena 2020, 193, 104628. [Google Scholar] [CrossRef]
  13. Hu, Y.; Li, D.; Deng, J.; Yue, Y.; Zhou, J.; Chai, Y.; Li, Y. Mechanisms Controlling Water-Level Variations in the Middle Yangtze River Following the Operation of the Three Gorges Dam. Water Resour. Res. 2022, 58, e2022WR032338. [Google Scholar] [CrossRef]
  14. Zhou, Y.; Li, Z.; Yao, S.; Shan, M.; Guo, C. Case Study: Influence of Three Gorges Reservoir Impoundment on Hydrological Regime of the Acipenser sinensis Spawning Ground, Yangtze River, China. Front. Ecol. Evol. 2021, 9, 624447. [Google Scholar] [CrossRef]
  15. Lin, F.F.; Xia, J.Q.; Zhou, M.R.; Deng, S.S. Recent response of bankfull channel geometry and flood-discharge capacity in the Lower Jingjiang Reach to upstream and downstream boundary conditions. J. Hydraul. Eng. 2019, 50, 641–649. (In Chinese) [Google Scholar]
  16. Yang, Y.; Zheng, J.; Zhang, H.; Chai, Y.; Zhu, Y.; Wang, C. Impact of the Three Gorges Dam on riverbed scour and siltation of the middle reaches of the Yangtze River. Earth Surf. Process. Landf. 2022, 47, 1514–1531. [Google Scholar] [CrossRef]
  17. Chen, Y.; Lin, P. The Total Risk Analysis of Large Dams under Flood Hazards. Water 2018, 10, 140. [Google Scholar] [CrossRef]
  18. Ghosh, S.; Guchhait, S.K. Hydrogeomorphic variability due to dam constructions and emerging problems: A case study of Damodar River, West Bengal, India. Environ. Dev. Sustain. 2014, 16, 769–796. [Google Scholar] [CrossRef]
  19. Pinter, N.; Jemberie, A.A.; Remo, J.W.; Heine, R.A.; Ickes, B.S. Cumulative impacts of river engineering, Mississippi and Lower Missouri rivers. River Res. Appl. 2009, 26, 546–571. [Google Scholar] [CrossRef]
  20. Yu, Y.; Wang, X.; Yi, S.; Miao, X.; Vandenberghe, J.; Li, Y.; Lu, H. Late Quaternary aggradation and incision in the headwaters of the Yangtze River, eastern Tibetan Plateau, China. Geol. Soc. Am. Bull. 2021, 134, 371–388. [Google Scholar] [CrossRef]
  21. Chai, Y.; Li, Y.; Yang, Y.; Zhu, B.; Li, S.; Xu, C.; Liu, C. Influence of Climate Variability and Reservoir Operation on Streamflow in the Yangtze River. Sci. Rep. 2019, 9, 5060. [Google Scholar] [CrossRef]
  22. Yang, P.; Xia, J.; Luo, X.Y.; Meng, L.; Zhang, S.; Cai, W.; Wang, W. Impacts of climate change-related flood events in the Yangtze River Basin based on multi-source data. Atmos. Res. 2021, 263, 105819. [Google Scholar] [CrossRef]
  23. Zhang, J.; Xu, K.; Yang, Y.; Qi, L.; Hayashi, S.; Watanabe, M. Measuring Water Storage Fluctuations in Lake Dongting, China, by Topex/Poseidon Satellite Altimetry. Environ. Monit. Assess. 2006, 115, 23–37. [Google Scholar] [CrossRef]
  24. Hu, Y.; Deng, J.; Li, Y.; Liu, C.; He, Z. Flow resistance adjustments of channel and bars in the middle reaches of the Yangtze River in response to the operation of the Three Gorges Dam. J. Geogr. Sci. 2022, 32, 2013–2035. [Google Scholar] [CrossRef]
  25. Khodnevych, Y.V.; Stefanyshyn, D.V. Data arrangements to train an artificial neural network within solving the tasks for calculating the Chézy roughness coefficient under uncertainty of parameters determining the hydraulic resistance to flow in river channels. Environ. Saf. Nat. Resour. 2022, 42, 59–85. [Google Scholar]
  26. Wigmosta, M.S.; Vail, L.W.; Lettenmaier, D.P. A distributed hydrology-vegetation model for complex terrain. Water Resour. Res. 1994, 30, 1665–1679. [Google Scholar] [CrossRef]
  27. Jiang, Y.; Cheng, H.; Zhou, Q.; Li, Y.; Yang, G.; Jin, Y.; Mei, S.; Gu, X.; Zhang, H. Influence of major water conservation projects on river channels and shorelines in the middle and lower reaches of the Yangtze River. Arab. J. Geosci. 2021, 14, 884. [Google Scholar] [CrossRef]
  28. He, Z.; Sun, Z.; Li, Y.; Zhao, Q.; Hu, Y.; Chen, Z. Response of the gravel-sand transition in the Yangtze River to hydrological and sediment regime changes after upstream damming. Earth Surf. Process. Landf. 2021, 47, 383–398. [Google Scholar] [CrossRef]
  29. Yang, S.; Milliman, J.D.; Li, P.; Xu, K. 50,000 dams later: Erosion of the Yangtze River and its delta. Glob. Planet. Change 2011, 75, 14–20. [Google Scholar] [CrossRef]
  30. Yang, S.; Milliman, J.D.; Xu, K.; Deng, B.; Zhang, X.Y.; Luo, X.X. Downstream sedimentary and geomorphic impacts of the Three Gorges Dam on the Yangtze River. Earth-Sci. Rev. 2014, 138, 469–486. [Google Scholar] [CrossRef]
  31. Chen, X.; Hassan, M.A.; An, C.; Fu, X. Rough Correlations: Meta-Analysis of Roughness Measures in Gravel Bed Rivers. Water Resour. Res. 2020, 56, e2020WR027079. [Google Scholar] [CrossRef]
  32. Han, K.; Sun, J.; Lin, B.; Huang, Z.; Shi, X. Large-scale modelling of highly braided and laterally confined reach of a sand-bed river. Earth Surf. Process. Landf. 2023, 48, 1557–1572. [Google Scholar] [CrossRef]
  33. Martínez, F.; Manríquez, H.; Ojeda, A.; Olea, G. Organization Patterns of Complex River Networks in Chile: A Fractal Morphology. Mathematic 2022, 10, 1806. [Google Scholar] [CrossRef]
  34. Pourbakhshian, S.; Pouraminian, M. Stochastic Modeling to Prediction of River Morphological Changes. Indian J. Sci. Technol. 2015, 8, 1–10. [Google Scholar] [CrossRef]
  35. Zhao, Y.; Zou, X.; Liu, Q.; Xu, M.; Yao, Y. Recent morphological changes of the Changjiang (Yangtze River) mega-delta in the Anthropocene, China: Impact from natural and anthropogenic changes. Holocene 2021, 31, 791–801. [Google Scholar] [CrossRef]
  36. Long, R. Morphological variation and discriminant analysis of Spinibarbus sinensis among Jialing River, Chishui River and Qingjiang River, the tributaries of Yangtze River. J. Fish. Sci. China 2014, 21, 1029–1038. (In Chinese) [Google Scholar]
  37. Dai, M.; Wang, J.; Zhang, M.; Chen, X. Impact of the Three Gorges Project operation on the water exchange between Dongting Lake and the Yangtze River. Int. J. Sediment Res. 2017, 32, 506–514. [Google Scholar] [CrossRef]
  38. Ou, C.; Li, J.; Zhou, Y.; Cheng, W.; Yang, Y.; Zhao, Z. Evolution characters of water exchange abilities between dongting lake and yangtze river. J. Geogr. Sci. 2014, 24, 731–745. [Google Scholar] [CrossRef]
  39. Liu, Y.; Jiang, C.; Long, Y.; Deng, B.; Jiang, J.; Yang, Y.; Wu, Z. Study on the Water Level–Discharge Relationship Changes in Dongting Lake Outlet Section over 70 Years and the Impact of Yangtze River Backwater Effect. Water 2023, 15, 2057. [Google Scholar] [CrossRef]
  40. Mao, B.; Wu, Z.; Mei, J.; Tao, W. Confluence relationship changes of Yangtze River and Dongting Lake since impoundment of Three Gorges project. J. Hydroelectr. Eng. 2013, 32, 48–57. (In Chinese) [Google Scholar]
  41. Chai, Y.; Yang, Y.; Deng, J.; Sun, Z.; Li, Y.; Zhu, L. Evolution characteristics and drivers of the water level at an identical discharge in the Jingjiang reaches of the Yangtze River. J. Geogr. Sci. 2020, 30, 1633–1648. [Google Scholar] [CrossRef]
  42. Yang, Y.; Yin, H.; Li, M.; Liu, W.; Li, K.; Yu, W. Effect of water depth and waterway obstructions on the divergence and confluence areas of Dongting Lake and the Yangtze River after the operation of the Three Gorges Project. River 2023, 2, 108–188. [Google Scholar] [CrossRef]
  43. Duan, W.; Zheng, Y.; Liu, J. Causes of water level rising in Chenglingji-Luoshan reach of Changjiang River. J. Hydraul. Eng. 2001, 32, 29–34. [Google Scholar]
  44. Dai, Z.J.; Liu, J.T. Impacts of large dams on downstream fluvial sedimentation: An example of the Three Gorges Dam (TGD) on the Changjiang (Yangtze River). J. Hydrol. 2013, 480, 10–18. [Google Scholar] [CrossRef]
  45. Mangeney-Castelnau, A.; Villotte, J.P.; Bristeau, M.; Benoît, P.; Bouchut, F.; Simeoni, C.; Yerneni, S. Numerical modeling of avalanches based on Saint-Venant equations using a kinetic scheme. J. Geophys. Res. 2003, 108, 2527. [Google Scholar] [CrossRef]
  46. Chow, V.T. Open-Channel Hydraulics; McGraw-Hill Book Company Inc.: New York, NY, USA, 1959. [Google Scholar]
  47. Bjerklie, D.M.; Dingman, S.L.; Bolster, C.H. Comparison of constitutive flow resistance equations based on the Manning and Chezy equations applied to natural rivers. Water Resour. Res. 2005, 41, W11502. [Google Scholar] [CrossRef]
  48. Dehrashid, F.A.; Heidari, M.; Rahimi, H.; Khoshkonesh, A.; Yuan, S.; Tang, X.; Lu, C.; Wang, X. CFD modeling the flow dynamics in an open channel with double-layered vegetation. Model. Earth Syst. Environ. 2022, 9, 543–555. [Google Scholar] [CrossRef]
  49. Lu, W. Experimental research on the roughness of grassed riverbed. China Rural Water Hydropower 2021, 4, 81–84, 91. (In Chinese) [Google Scholar]
  50. Yao, J.; Xia, J.; Deng, S.; Zhou, M.; Xu, Q. Variation in flood-discharge capacity of Chenglingji-Hankou reach in the middle Yangtze River and analysis of influencing factors since the onset of Three Gorges Reservoir. J. Lake Sci. 2021, 33, 830–841. (In Chinese) [Google Scholar]
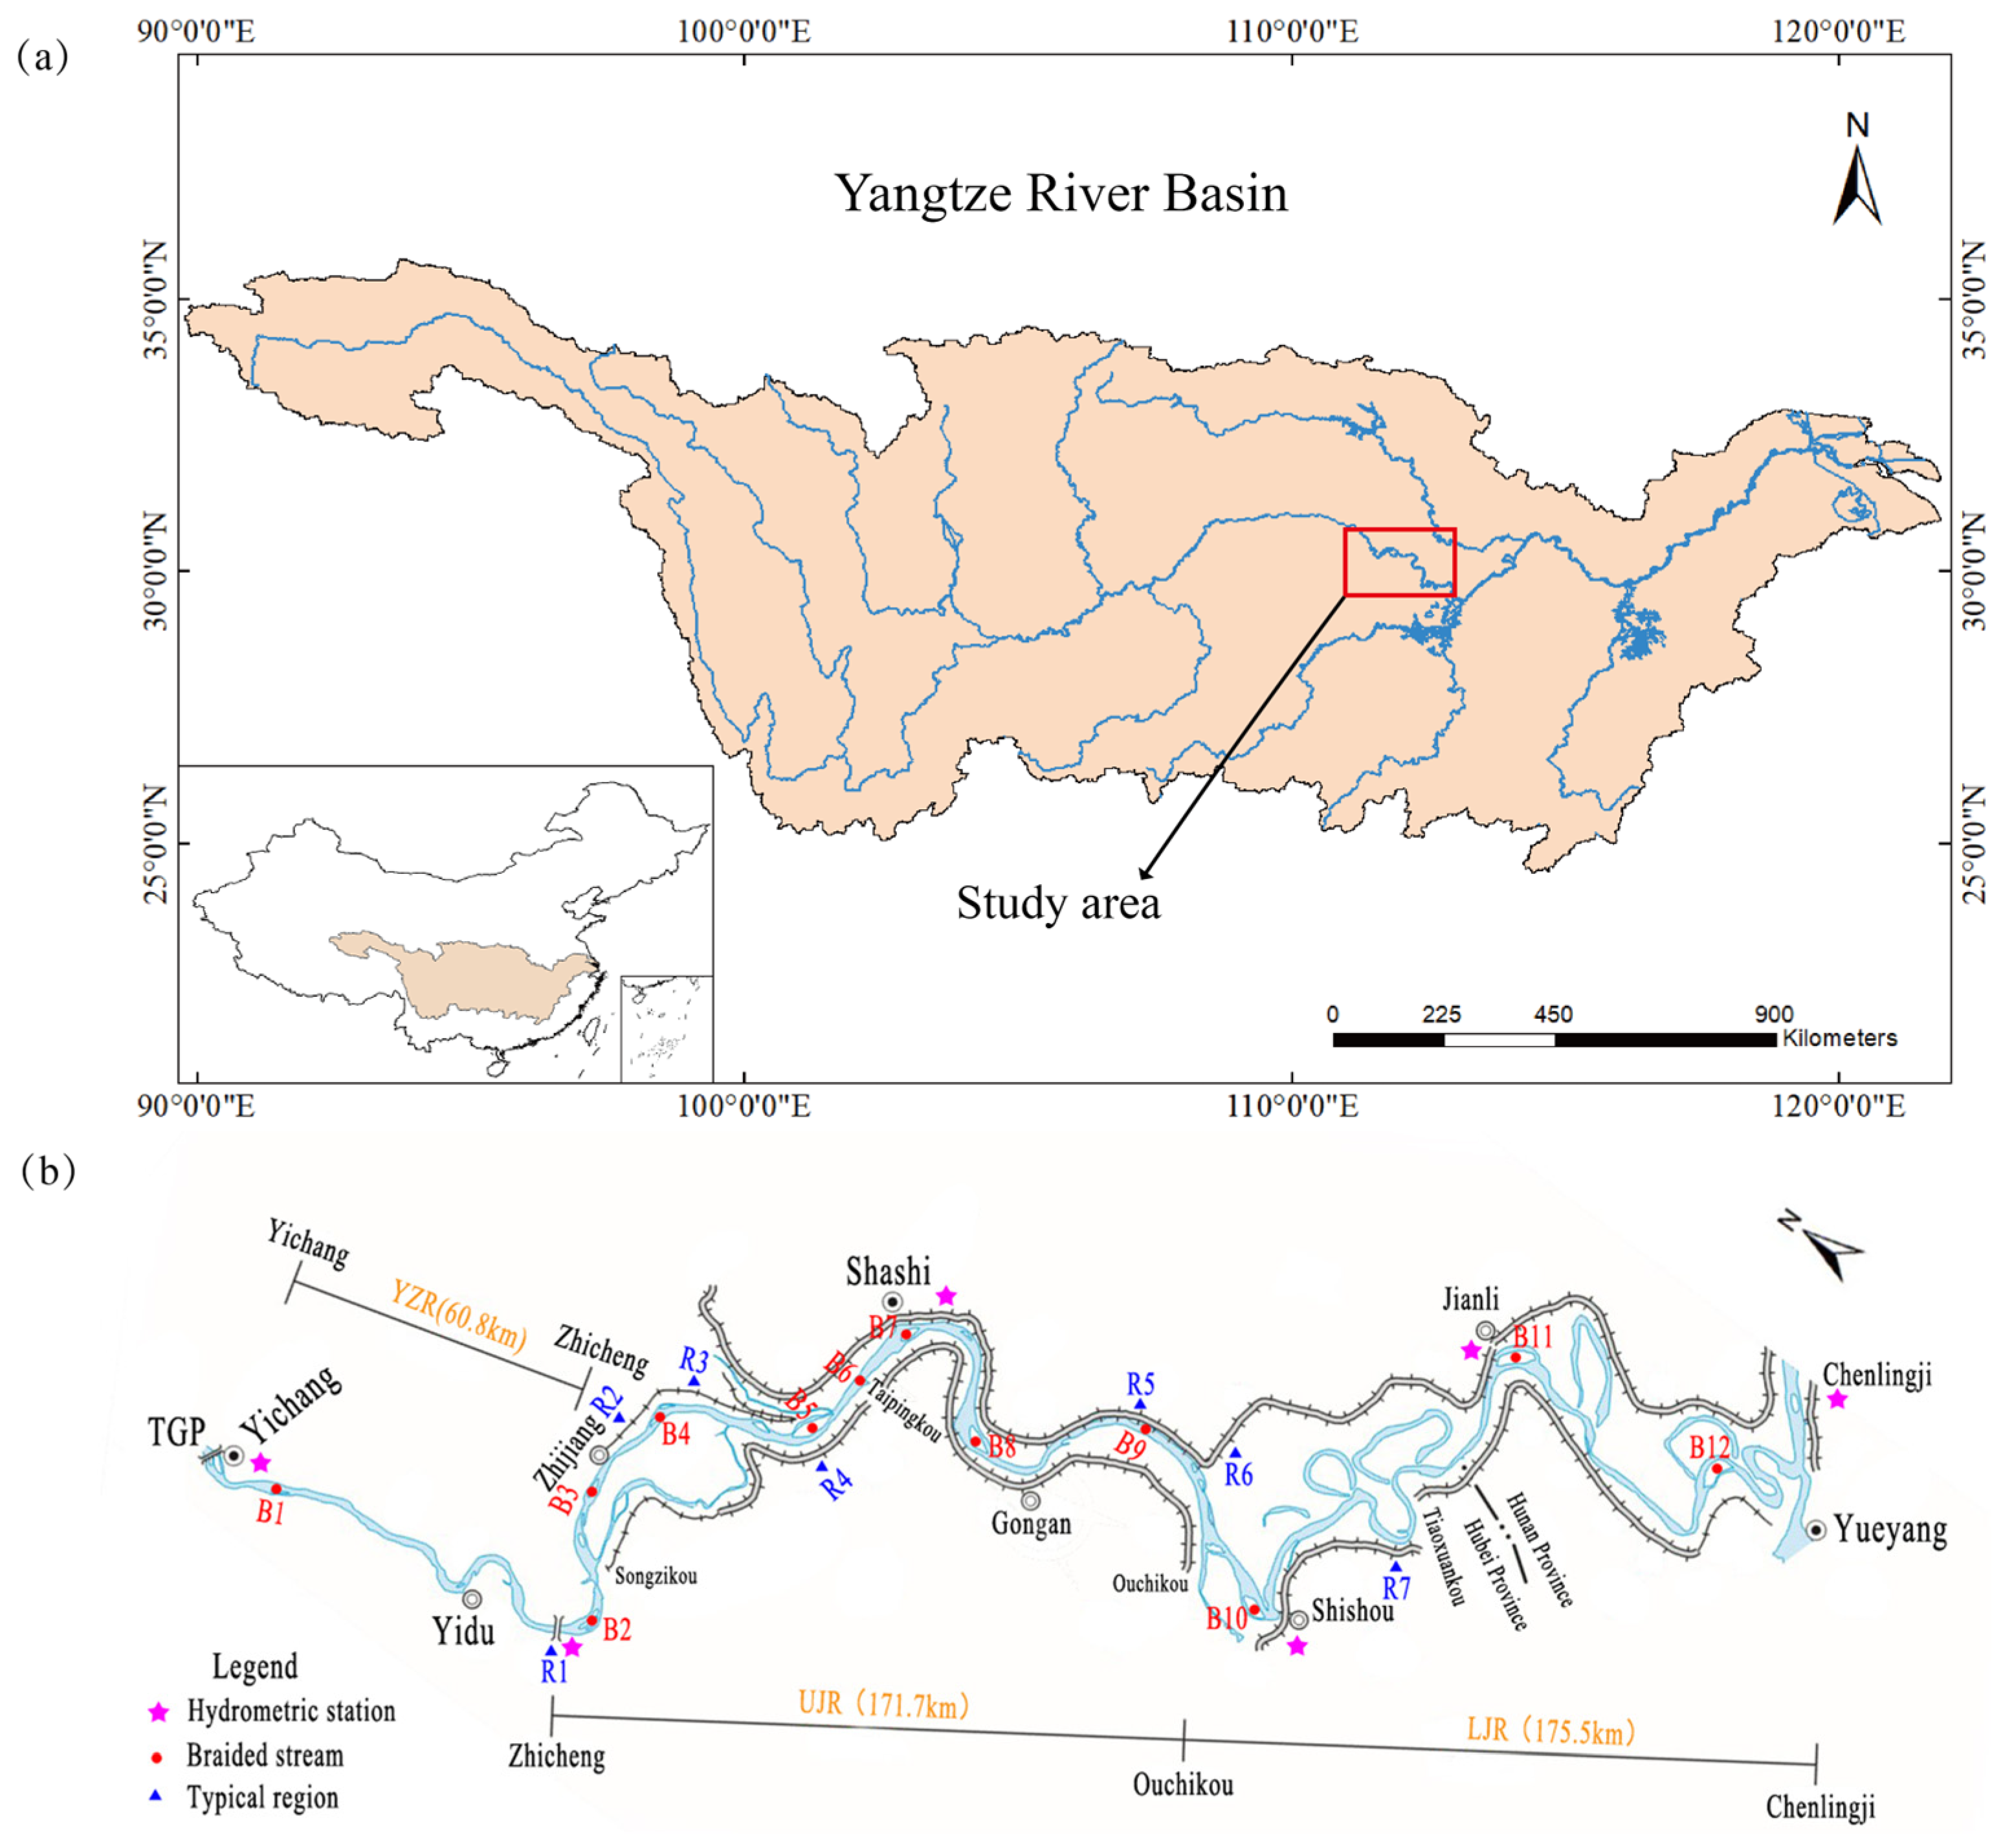
Figure 1. (a) Map of the Yangtze River Basin indicating the location of the study area; (b) sketch of the Yichang–Chenglingji Reach (YCR) with the location of the Three Gorges Project (TGP), typical regions (R1–R7 represent Zhicheng, Majiadian, Dabujie, Chenjiawan, Haoxue, Xinchang and Tiaoguan regions, respectively), braided streams (B1–B12 represent Yanzhiba, Guanzhou, Dongshizhou, Jiangkouzhou, Mayangzhou, Taipingkou, Sanbatan, Tuqizhou, Jiaoziyuan, Daokouyao, Wuguizhou and Xiongjiazhou braided streams, respectively), and the Yichang, Zhicheng, Shashi, Shishou, Jianli, and Chenglingji (the outlet of Dongting Lake) hydrometric stations.
Water 16 00841 g001
Figure 2. Variations in the sediment-based median particle size d50 at some typical river sections from Yichang to Chenglingji.
Water 16 00841 g002
Figure 3. Beach-channel elevation difference variations at braided streams of the YCR.
Water 16 00841 g003
Figure 4. Discharge process at (a) the Yichang hydrometric station from 2003 to 2017 and (b) the Chenglingji hydrometric station from 2003 to 2015.
Water 16 00841 g004
Figure 5. Relationship diagram between the flood discharge exceeding 30,000 m3/s from 2003 to 2015 at the Yichang hydrometric station and the corresponding flood discharge at the Chenglingji hydrometric station.
Water 16 00841 g005
Figure 6. The backwater height ΔZ at the Jianli, Tiaoguan, Shishou, Xinchang, and Haoxue stations vs. the outflow intensity T.
Water 16 00841 g006
Figure 7. The backwater influence range L vs. the outflow intensity T under the backwater height ΔZ of 5, 10, 15, and 20 cm.
Water 16 00841 g007
Figure 8. Relationship between the wetted river channel perimeter χ beach and total wetted perimeter χ generated from the data of 350 typical sections in the YCR.
Water 16 00841 g008
Figure 9. Contribution of different factors to the increase in flood water levels at the flood discharge of 55,000 m3/s.
Water 16 00841 g009
Figure 10. Variations in flood water levels at different flood discharges (m3/s).
Water 16 00841 g010
Table 1. Observed data from the hydrometric stations.
ReachStationLocationData Type
Yizhi Reach (YZR)Yichang111.29° E, 30.69° NDaily water level, discharge, and sediment
Zhicheng111.50° E, 30.30° N
Upper Jingjiang Reach (LJR)Shashi112.26° E, 30.31° N
Lower Jingjiang Reach (UJR)Shishou112.33° E, 29.75° N
Jianli112.90° E, 29.81° N
Chenglingji113.15° E, 29.44° N
Table 2. Relative errors for calibration and validation of the river network model.
ReachStationRelative Errors
CalibrationValidation
YZRYichang7%5%
Zhicheng−3%−5%
LJRShashi2%3%
UJRShishou6%4%
Jianli3%−3%
Chenlingji−8%−7%
Disclaimer/Publisher’s Note: The statements, opinions and data contained in all publications are solely those of the individual author(s) and contributor(s) and not of MDPI and/or the editor(s). MDPI and/or the editor(s) disclaim responsibility for any injury to people or property resulting from any ideas, methods, instructions or products referred to in the content.