Article

Enhanced Pretreatment of Natural Rubber Industrial Wastewater Using Magnetic Seed Coagulation with Ca(OH)2

by
Ishanka Prabhath Wimalaweera
1,2,3,4,
Yuansong Wei
1,2,3,4,5,*,
Tharindu Ritigala
1,2,3,
Yawei Wang
1,2,3,
Hui Zhong
1,2,3,
Rohan Weerasooriya
5,
Shameen Jinadasa
6 and
Sujithra Weragoda
4,7
1
State Key Joint Laboratory of Environmental Simulation and Pollution Control, Research Center for Eco-Environmental Sciences, Chinese Academy of Sciences, Beijing 100085, China
2
Laboratory of Water Pollution Control Technology, Research Center for Eco-Environmental Sciences, Chinese Academy of Sciences, Beijing 100085, China
3
University of Chinese Academy of Sciences, Beijing 100049, China
4
China-Sri Lanka Joint Research and Demonstration Center for Water Technology, Ministry of Water Supply, Meewathura, Peradeniya 20400, Sri Lanka
5
National Institute of Fundamental Studies, Hanthana Road, Kandy 20000, Sri Lanka
6
Department of Civil Engineering, University of Peradeniya, Peradeniya 20400, Sri Lanka
7
National Water Supply and Drainage Board, Katugastota 20800, Sri Lanka
*
Author to whom correspondence should be addressed.
Water 2024, 16(6), 847; https://doi.org/10.3390/w16060847
Submission received: 8 February 2024 / Revised: 25 February 2024 / Accepted: 27 February 2024 / Published: 15 March 2024
(This article belongs to the Section Wastewater Treatment and Reuse)

Abstract

:
The efficiency of magnetic seed coagulation (MSC) with pH adjustment by NaOH and Ca(OH)2 as a pretreatment for high-strength natural rubber industrial wastewater (NRIWW) was compared in this study. The high content of suspended solids (SSs) and other inhibitory substances of NRIWW is a primary issue which affects its subsequent secondary and tertiary treatment processes. The MSC process with polyaluminum chloride (PAC), anionic polymer (polyacrylamide—PAM)), and magnetic seeds (MS) (ferric oxide (Fe3O4)) was proven to be a cost-effective pretreatment of NRIWW, and Ca(OH)2 showed improved pretreatment performance, with turbidity, COD, and TSS removals of 95%, 56%, and 64%, respectively. Sedimentation was enhanced from 30 min by conventional coagulation to less than 5 min by the MSC. The organic components of NRIWW reacted with MS to generate Fe–OH/Fe–OH+ linkages through processes of surface complexing and hydrogen bonding. According to fractal analysis, the MSC process optimized with Ca(OH)2 produces less complex flocs that are uniform and densely packed. Additionally, MS served as an adsorbent and promoted the development of magnetic flocs by boosting their density and size. MSC with pH adjustment by Ca(OH)2 presents a robust and cost-effective pretreatment process for NRIWW.

Graphical Abstract

1. Introduction

The rubber industry stands as a cornerstone of the world’s economy, playing a pivotal role in various industries and contributing significantly to global trade [1,2]. Rubber is the third largest merchandise export item of Sri Lanka, producing 70,867–78,204 Mt of rubber per year (2019–2022 data) [3,4]. Rubber manufacturing facilities have been driven to enhance their production capabilities due to the rising demand for natural rubber, and this has led to a simultaneous increase in water demand for the manufacturing factories, which in turn has meant that large amounts of rubber effluent are now being discharged into natural water streams [5] as wastewater (WW), which is one of the most severe pollutants from the rubber industry. Generally, natural rubber industrial wastewater (NRIWW) comprises a small portion of uncoagulated latex and serum liquid and high amounts of proteins, lipids, carotenoids, carbohydrates, sugar, and organic and inorganic salts, which generate high COD and BOD in the wastewater and specifically low pH values. High concentrations of nitrogen and sulfate compounds, high EC levels, and low pH in the wastewater result from the use of ammonia and sulfuric acid during the manufacturing process [6]. The solids content in rubber industry wastewater, which includes total, suspended, and dissolved solids, is also a significant concern. High levels of these solids can lead to severe ecological impacts which contribute to the turbidity of natural water bodies, disrupt aquatic ecosystems, and can lead to sedimentation that affects water flow and habitat structure [6]. Recent studies have assessed the physicochemical parameters of NRIWW, identifying the significant presence of toxic organic pollutants and heavy metals, such as Zn, Cr, and Ni. Bioassays have highlighted the phytotoxic and cytogenotoxic potential of this wastewater, evidenced by inhibited seed germination and growth and chromosomal abnormalities in test plants [7]. The pretreatment stage plays a crucial role in the effective treatment of rubber industrial wastewater by removing materials that are inhibitory to downstream processes [8]. Pretreatment is usually focused on the removal of suspended solids (SSs) through numerous physical and chemical processes. Chemical precipitation, Fenton oxidation, ozonation, ultrasonic irradiation, and electrocoagulation have been the main technologies researched for NRIWW pretreatment processes [8]. Existing pretreatment technologies have significant limitations, including lower efficiency, less flexibility, a necessity for large areas, and high energy consumption during downstream processes (for the aerator in the aerobic treatment system) [9,10]. This problem typically occurs when rubber factories overwhelm their wastewater treatment plants due to increased production over time [6]. To guarantee adherence to stringent environmental regulations and discharge limitations, novel treatment strategies must be put into practice during the pretreatment of NRIWW. Among existing pretreatment techniques, chemical precipitation coagulation has been the most commonly applied process at full scale. Various compounds have been tested during past research into chemical coagulation for NRIWW, e.g., ferric sulfate and dragon fruit foliage have been used as natural coagulants for the treatment of concentrated latex (CL) effluent [11]; iron (II) sulphate heptahydrate (FeSO4·7H2O), a waste from titanium oxide manufacture, has been utilized as a coagulant to treat secondary rubber processing effluent (SRPE) [12]; ferric chloride (FeCl3·7H2O) and Al2(SO4)3 have been used for chemical coagulation [13]; and sulfide precipitation using sodium sulfide hydrate has been applied for the treatment of acidic latex wastewater containing high average Zn and COD. However, conventional pretreatment processes have disadvantages related to low treatment efficiency, high cost caused by high chemical dosages, and a large land requirement for larger flocculation and sedimentation basins [14].
Compared with conventional coagulation, magnetic seed coagulation (MSC) has demonstrated itself to be a successful and advanced technology [15], widely applied in the wastewater treatment industry [16] as an effective measure for removing suspended matter, phosphorus, and organic matter during pretreatment in recent years. The use of magnetic seeds facilitates the aggregation of particles into flocs, hence offering many notable benefits, such as a low footprint for treatment tanks due to high sedimentation rates, significantly enhanced efficiency and stability of contaminant removal, the formation of more densely packed flocs and a reduction in chemical sludge, and a low cost of chemicals because of the high recovery rate of magnetic seeds [17]. For example, MSC improved the pretreatment efficiency of the high-strength digestate of food waste (HS-DFW) through anaerobic digestion, with the removal efficiencies of turbidity and TSS found to be 99 ± 0.1% and 98 ± 0.1%, respectively [18]. Mixing magnetic seeds from coal fly ash (MS-CFA) with polyaluminum chloride (PAC) and polymer (polyacrylamide—PAM) improved phosphorus removal by precipitation and effectively lowered PAM dosage by over 80% [19]. MSC aided by PAC is able to remove DOM with high molecular weight, polarity, and aromaticity [15]. The magnetic seeds–Al13–DOM complexes play a key role in enhancing DOM removal and reducing residual total Al concentrations in the water [20].
As an enhanced pretreatment technology, the MSC process has been gaining popularity through recent years. To the best of the authors’ knowledge, this method has not been studied for NRIWW pretreatment. The MSC method, when applied to the pretreatment of high-strength NRIWW, exhibits significant efficiency in pollutant removal. Therefore, the main objectives of this study were to investigate MSC as a pretreatment method for NRIWW by optimizing process variables, such as pH, PAC, PAM, and MS dosage, by evaluating the removal efficiencies of turbidity, TSS, and COD, and to compare the effectiveness of NaOH and Ca(OH)2 as pH adjustment chemicals towards MSC pretreatment efficiency. This study also sought to assess the environmental impact of optimized MSC pretreatment on NRIWW, focusing on pollutant reduction and sustainable practices. Meanwhile, particle size reduction, surface morphology, sludge settling ability, and FTIR of the sludge particles were tested in order to understand the mechanism of the MSC treatment of NRIWW.

2. Materials and Methods

2.1. Wastewater of Centrifuged Latex Production

NRIWW samples were collected weekly from a centrifuged latex manufacturing factory in Mawanella, Sri Lanka (7°15′22.2″ N 80°26′27.9″ E), which utilizes natural latex in its production process. Wastewater from concentrated latex production is considered particularly contaminated due to the extensive ammonification of natural latex for stabilization and the use of potent acidic coagulants such as sulfuric acid in the production process [21]. To mitigate self-degradation and further acidification, NRIWW samples were refrigerated at 4 °C until their utilization in the experiments. Table 1 illustrates that the high COD, BOD, and total organic carbon (TOC) concentrations in the NRIWW are results of the presence of uncoagulated latex, lipids, and inorganic compounds that emerge at various processing stages. The pH value was found to be around 5.0, ascribed to the industry procedures’ usage of sulfuric acid.

2.2. Experiments of Magnetic Seed Coagulation (MSC)

The basic concept of MSC is “seeding” highly magnetized particles into a fluid medium, where they react with pollutants, resulting in “seed pollutants” flocs. These flocs are concentrated in sludge via sedimentation and filtration, with or without a magnetic field. The most frequently used method of magnetic seeding is to add magnetic components directly to the target water [16]. Experiments of MSC were carried out in the China–Sri Lanka Joint Research and Demonstration Centre for Water Technology, Sri Lanka.
Polyaluminum chloride (PAC, Weifang JS chemical Co., Ltd., Weifang, China) served as the coagulant, polyacrylamide (PAM, Weifang JS chemical Co., Ltd., Weifang, China) as the flocculant, and NaOH (AR, Techno Pharmchem, Delhi, India) and hydrated lime (AR, Sinopharm, Shanghai, China) as pH-adjusting chemicals. Ferroferric oxide (Fe3O4, 325 mesh, particle size > 44 μm, Meiqi Industry, Henan, China) was used as magnetic seeds. The jar test (Six-in-one electromotive stirrer, VELP) was used for the optimization trials of pH adjustment chemicals as well as the coagulant, flocculant, and MS. pH optimization was conducted using NaOH and Ca(OH)2 with a PAC dosage of 0.75 g/L, which was determined based on the literature, where similar rubber wastewater studies [2,9,11] utilized this level to ensure observable coagulation effects. This dosage was observed to achieve high removal efficiency in later trials with PAC optimization. This dosage facilitated a clear examination of pH’s influence on coagulation, aiding in identifying the optimal pH range (4.5–8.0) using 1 M of NaOH and Ca(OH)2 solutions. After the pH adjustment, MS was added and mixed at 300 rpm for one minute. Then, PAC was added and the wastewater was agitated at 300 rpm for 1 min for coagulation. Then, PAM was dosed and agitated at 300 rpm for 20 s, and slow mixing was carried out at 60 rpm for 5 min. The sample was then retrieved after 30 min of sedimentation.

2.3. Analytical Methods

Standard Methods for the Examination of Water and Wastewater, 24th edition [22], was used to analyze all the parameters. A HACH HQ 40 d multi-parameter water quality analyzer (HACH Company, Loveland, CO, USA) was used to measure the pH and conductivity during the experiment. The supernatant was passed through a 0.45 μm membrane filter to separate the dissolved components in order to carry out the analysis. COD, PO43−, SO42−, and NO3 were measured with an ultraviolet spectrophotometer (SP UV 1100, DLAB SCIENTIFIC Co., Ltd., Beijing, China). COD levels were determined using prefabricated tube reagents from the HACH Company, Colorado, USA. Turbidity was measured utilizing a laboratory turbidimeter (2100N, EPA, 115 Vac, HACH Company, Loveland, CO, USA). Nessler reagent [23] was used to measure NH4+–N. Identification of functional clusters was performed using Fourier transform infrared (FTIR) spectrometry in attenuated total reflectance (ATR) mode in a wave number range of 4000-650 cm−1 by cumulating 64 scans at a resolution of 2 cm−1 using a Nicolet iS10 FTIR spectrometer (Thermo Fisher Scientific, Waltham, MA, USA), where dried samples from each treatment phase were utilized. Particle size distribution was examined using a Mastersizer 3000 laser particle analyzer (Malvern Panalytical Ltd., Malvern, UK).
All data were statistically analyzed by IBM SPSS Statistics (Version 25). An ANOVA was conducted at each optimization trial to identify the optimum dosage/condition at each step towards gaining the best removal of contaminates. The Tukey HSD test was used to identify which dosing group/dosages were substantially different from one another after an ANOVA test indicated which optimization step had the most substantial effect on pollutant removal. Multivariable linear regression assessed the effectiveness of various treatment conditions (pH, PAC, PAM, MS) for pollutant removal (COD, TSS, turbidity) and determined the associations between treatment conditions and removal indicators. The Life Cycle Assessment (LCA) methodology, compliant with ISO standards [24,25], evaluated the treatment of 1 m³ of wastewater, with a focus on the MSC process phase that includes reagent and electricity use. The study employed OpenLCA (version 1.10.3) [26] software and the ELCD database, along with the ReCiPe 2016 Midpoint (H) method for impact assessment, taking into account the sludge disposal practices of gravity settling, dewatering, and landfilling, which are common in the Sri Lankan rubber industry. A complete methodology section with inventory data for LCA is included in the Supplementary Materials.

2.4. Fractal Structure

The study of surface complexity and inhomogeneity using measures such as lacunarity (L) and fractal dimension (FD) is a common approach to studying floc structure using image processing [27,28]. The FD of SEM images obtained from the surface of flocs was computed using the FracLac v2.5 plug-in, which is included in the public domain Java-based image processing software program ImageJ 1.47v (National Institutes of Health, Bethesda, Maryland, USA). According to [27], lacunarity is the heterogeneity of the gaps or the degree of structural variation inside an item; it is explained as the space between the flocs or the visual texture of an image. The lacunarity (L) of floc surface pictures was computed using the FracLac v2.5 plug-in, a part of the ImageJ (Version 1.54i) program [28].

2.4.1. SEM Analysis

Floc samples used in this analysis were collected from the coagulation–flocculation process under optimum conditions of each optimization trial. On a transparent ground slide, floc samples were naturally evaporated to dry them for the experiment [29]. The surface morphology of the sludge particles was observed by a field emission scanning electron microscope (FE-SEM, HITACHI SU8020, Hitachi, Tokyo, Japan).

2.4.2. Fractal Dimension

In the context of wastewater treatment, understanding the structural complexity of flocs is crucial for optimizing the coagulation process. Fractal dimension (FD) analysis provides insight into the degree of irregularity and complexity of floc structures, which is indicative of their settling and filtering behaviors. In this study, we employed fractal geometry theory, particularly the Hausdorff dimension, to quantify the FD of flocs formed during treatment. Fractal geometry theory states that the dimension may be defined in a variety of ways. The most often used method is the Hausdorff dimension, which is now central to the study of fractals [30]. The dimension for flocs was described using Equation (1).
d f = lim ε 0 log N ( ε ) l o g ( 1 ε )
where df is the Hausdorff dimension; N(ε) are small boxes in the object, which has a dimension and sides ε [31]. This study evaluates the fractal dimension as the degree of irregularity using the box-counting method, a fractal analysis technique. The FD value represents the surface roughness index for the actual surface.

2.4.3. Lacunarity Measurement

Lacunarity measurement provides quantitative insights into the texture and patterns formed during the coagulation process. It reflects the distribution of gaps within the structure of flocs, serving as an indicator of their homogeneity and stability, which are vital for effective sedimentation in wastewater treatment. Gliding box sampling is used in the lacunarity computation process to quantify the deviation from translational invariance of the intensity distribution of an image. The basis for lacunarity is an image’s pixel distribution, which is essentially derived from scans conducted at various box sizes and grid orientations. In the upper-left corner of a binary image with side length T pixels, a square moving window with a side length of r pixels is positioned so that r ≤ T. Underneath the moving window, the algorithm counts the mass m of pixels that correspond to the picture. Then, the window is moved one pixel to the right, and the underlying mass is once more measured. A frequency distribution of the box masses n (m, r) is generated by this process. By dividing this frequency distribution by the total number of boxes N(r) of size r, we may obtain a probability distribution Q (m, r). Lacunarity is determined using Equation (2).
L = σ 2 + μ 2 + 1
where σ is the standard deviation and μ is the mean of the probability distribution Q. The relationship between lacunarity and the window measurement scale is demonstrated by the variation in the ratio of σ to μ with the size of the window covering the image [32].

3. Results

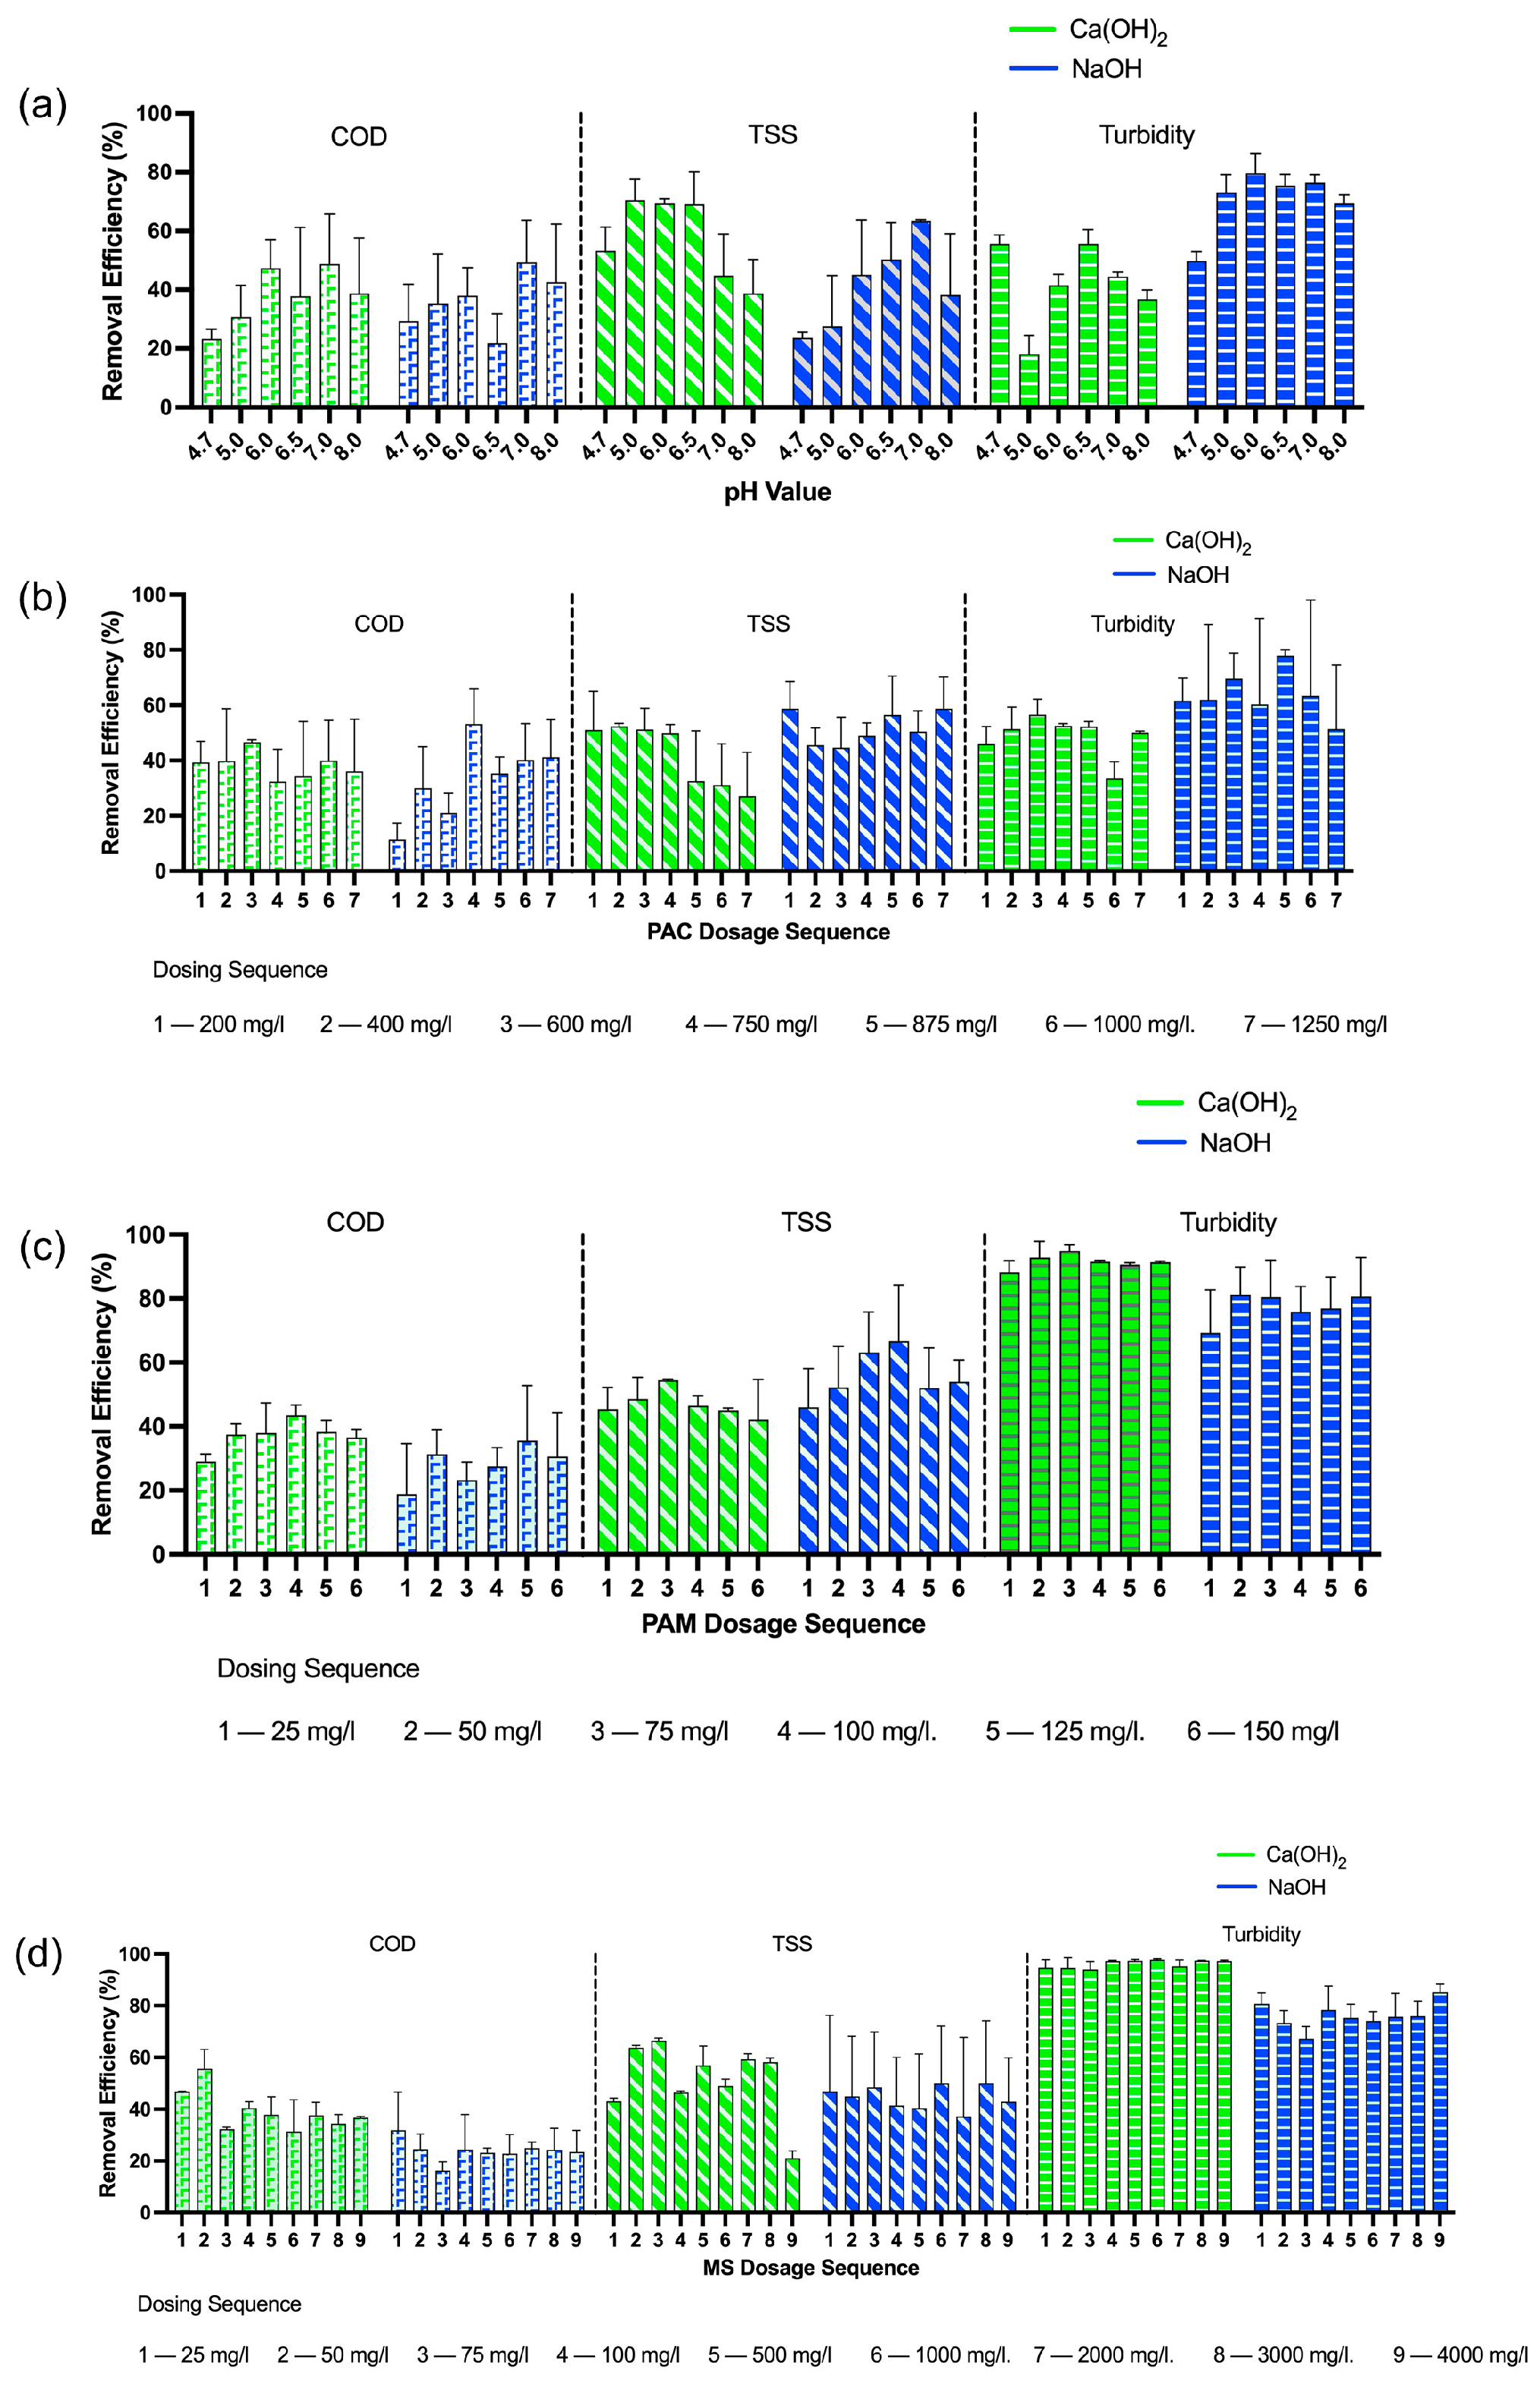
3.1. Optimization of MSC

3.1.1. pH

One of the primary variables in the coagulation process that significantly affects pollutant removal is the pH of raw wastewater, which can alter the hydrolysis characteristics, the coagulant’s attaching site, and the nature of the pollutants themselves [33]. pH imbalance is a major hurdle that strongly decreases the performance of biological treatment systems [34]. NRIWW samples were tested at the raw pH level and a range of pre-adjusted pH levels (4.5–8.0) [2,11] using 1M of NaOH and Ca(OH)2 solution. Turbidity, COD, and TSS were taken as the primary measurements for the optimization process throughout the study. As shown in Figure 1a the pH was 7.0 and 6.5 for NaOH and Ca(OH)2, respectively, corresponding to the minimum residual turbidity, COD, and TSS values.
One-way ANOVA analysis (Table S2) shows that pH had a significant impact on removal of COD, TSS, and turbidity (p < 0.05) during the pH optimization trial with NaOH. The Tukey HSD test shows that pH 7 has significantly higher removal efficiencies than other pH values. Therefore, pH 7 was selected as the optimum pH value for other trials that used NaOH. The pH adjustment with Ca(OH)2 exhibited higher F-values and significant difference in turbidity results, even though COD does not depict a significant difference, and the Tukey HSD test shows that pH 6.5 has significantly higher removal efficiencies than the other pH values. Therefore, pH 6.5 was selected as the optimum pH value for other trials that used Ca(OH)2. Overall, both chemicals were effective in pH adjustment where NaOH may be used to adjust pH levels with the least amount of chemicals, and Ca(OH)2 increases the coagulum’s ability to precipitate.

3.1.2. PAC

Figure 1b shows the removal efficiencies of COD, TSS, and turbidity at different dosages of PAC. Coagulant doses ranging from 200–1250 mg/L were used for the trial based on past research [11]. COD, TSS, and turbidity removal was improved with dosage and eventually developed the most significant values at different dosages for NaOH and Ca(OH)2 separately. During the PAC optimization trial with NaOH, the larger F-value suggests a greater degree of difference, i.e., the F-value for COD is higher than the F-value for turbidity and TSS. The significant difference (p < 0.05) in the mean values of COD suggests that the PAC dosage has an effect on the removal of these pollutants, while the non-significant difference in TSS and turbidity values suggests that PAC dosage has less of an effect on its removal. The Tukey HSD test shows that a PAC dosage of 750 mg/L has significantly higher removal efficiencies than the other PAC dosage values. Therefore, PAC = 750 mg/L was selected as the optimum PAC dosage value for other trials that used NaOH. During the PAC optimization trial with Ca(OH)2, F-values suggest a minor difference between these groups. Significant differences (p < 0.05) in the mean values of COD, TSS, and turbidity were not observed and this suggests that the PAC dosage does not have an effect on the removal of these pollutants. According to the mean plots, it is observed that a PAC dosage of 600 mg/L gives relatively higher removal. Therefore PAC = 600 mg/L was selected as the optimum PAC dosage value for other trials that used Ca(OH)2. Adequate enmeshment and destabilization occurred with the rise in coagulant components in the suspension.
The efficient turbidity reduction of PAC can be explained in this regard using electrostatic patch coagulation and bridge aggregation. After maximal turbidity removal, re-stabilization began to occur when the PAC dose was raised even higher. It was implied that the high electrostatic repulsion forces produced by adsorbed polycations were the reason why particles were attracted to one another. However, the residual turbidity decreased even more after adding more PAC. It is clear that some amorphous precipitates developed during PAC addition, providing sweep flocculation through which hydroxides enhanced the removal of turbidity [35].

3.1.3. PAM

This study used PAM doses ranging from 25 to 150 mg/L, based on findings from prior research [9,36]. As presented in Figure 1c, the turbidity, COD, and TSS removals improved marginally with increasing PAM dosage and decreased with further increases in PAM dosage. During the PAM optimization trial with NaOH, the F-value suggests a minor difference between the groups. Significant differences (p < 0.05) in the mean values of COD, TSS, and turbidity were not observed and this suggests that the PAM dosage does not have an effect on the removal of these pollutants. According to the mean plots, it is observed that a PAM dosage of 50 mg/L results in relatively higher removal. Therefore, PAM = 50 mg/L was selected as the optimum PAM dosage value for other trials when using NaOH. During the PAM optimization trial with Ca(OH)2, turbidity and TSS removals show significant difference in means values which suggest that PAM dosage has an effect on the removal of these pollutants, while the non-significant difference related to COD suggests that PAM dosage has less of an effect on its removal. The Tukey HSD test shows that a PAM dosage of 75 mg/L has significantly higher removal efficiencies than the other PAM dosage values. Therefore, when using Ca(OH)2, PAM = 75 mg/L was selected as the optimal PAM dosage value for other trials. Despite a certain level of dosage being applied afterward, the removal efficiencies of turbidity and COD began to decline again due to the existence of extra polymer and traces of cloudiness in the bulk caused by excess polymer dosage. This can be described in terms of electrostatic patches, polymer flocculant bridging, and sweep flocculation [37]. The maximum removals of COD, TSS, and turbidity were accomplished at a PAM dosage of 50–75 mg/L with both NaOH and Ca(OH)2. High levels of proteins, fatty acids, and other organic compounds are found in natural latex residues in effluent. These organic substances could also serve as coagulant aides, promoting the formation and stability of flocs to enhance the coagulation process. This strategy could be a promising direction for future research.

3.1.4. Magnetic Seeds (MS)

A magnetic seed coagulant pollutant combination was used to remove the pollutant by sedimentation or filtration. This method was employed to lower the high ionic strength of the coagulation media, which could otherwise reduce the sedimentation rate of the suspension and increase the settling time. This study explored the effect of magnetic seeds (Fe3O4 with an average size corresponding to 325 mesh) by varying the MS concentration between 25 and 4000 mg/L, a range established based on insights obtained from prior research referenced in [17,18]. External magnetic flux was not used in this experiment to increase the settling rate. During MS optimization trials with both NaOH and Ca(OH)2, the F-value suggests minor difference between the groups. Significant differences (p < 0.05) in the mean values of COD, TSS, and turbidity were not observed and this suggests that the MS dosage does not have an effect on the removal of these pollutants. According to the mean plots, the MS dosages of 50 mg/L and 100 mg/L result in relatively higher removal for NaOH and Ca(OH)2, respectively. The highest removals were achieved at 50 mg/L of MS coupled with optimum PAC and PAM dosages for both NaOH and Ca(OH)2. Through a variety of external influences including electric double layer forces, gravitational force, Van der Waals forces, Brownian motion, and fluid motion, aggregation MS was altered to produce separation [38]. With the increasing dosage of MS, removal of these pollutants decreased slightly due to the settling of the suspension before the proper coagulation process occurred. This occurred due to formation of further crystalline floc with decreased enmeshment/sorbing potential [17].

3.2. Pollutant Removal under Optimized MSC

It is obvious from Figure 2 that turbidity reduction with only PAC was 55–60%, attributed to adequate destabilization of colloidal particles with a high and robust charge on nanoclusters [17]. Still, some percentage of tiny flocs remaining in the suspension might arouse the residual turbidity, but these effectively flocculated together with the addition of PAM. At optimum PAM dosage, turbidity and TSS removal efficiencies were amplified to 80–95%. However, MS addition was shown to have a few effects on contaminant removal, as it optimized the process mostly by enhancing the settling rate. Similar to turbidity removal, a 46–53% removal of total COD was achieved during coagulation with PAC alone, the COD removal was decreased to 31–38% by introducing PAM and with the addition of MS, its removal efficiency was increased to 56% in the Ca(OH)2 trial while the NaOH trial resulted in a reduced efficiency of 25%.
A multivariate linear regression study carried out during the NaOH trial shows that COD removal efficiency was positively affected by pH level and PAC dosage. Also, pH and PAC dosage have significant (p < 0.05) linear relationships with COD removal efficiency (Table S3). On the other hand, PAM dosage and MS dosage are negatively related to COD removal efficiency and do not show a significant linear relationship with COD removal efficiency, respectively. The Ca(OH)2 trial shows that at any pH level, PAC dosage, PAM dosage, and MS dosage do not have any significant linear relationship with COD removal efficiency. However, pH level positively affects COD removal efficiency when using both NaOH and Ca(OH)2. When considering TSS removal, pH level showed a significant positive linear relationship with removal when using NaOH, and both pH and PAC dosage displayed a significant negative linear relationship when carrying out the trials using Ca(OH)2. pH level and PAC dosage exhibit significant linear relationship with turbidity removal when using NaOH, and PAM dosage and MS dosage show a positive linear relationship with turbidity removal when using Ca(OH)2.

3.3. Settling Time of MSC with pH Adjustment

This study utilized NaOH and Ca(OH)2 for pH adjustment to create an optimal environment for the coagulation process facilitated by PAC, with Ca(OH)2 additionally contributing to coagulation due to its properties as a coagulant/flocculant. The sedimentation time during MSC with pH adjustment using NaOH and Ca(OH)2 in the presence and absence of MS was investigated. Consequent sludge volume was measured with different sedimentation times at optimal dosages of NaOH and Ca(OH)2As shown in Figure 3, the outcomes clearly demonstrate that MSC is quicker than conventional coagulation with both NaOH and Ca(OH)2. It can, thus, be understood that the key task of MS is to increase the settleability of floc.
The results indicated that NaOH had a comparatively lower settling speed and higher sludge volume than Ca(OH)2, regardless of the presence or absence of MS. Ca(OH)2 was discovered to display not only a comparatively quicker settling rate but was also characterized by effective removal of turbidity, COD, and TSS. The incorporation of MS into the coagulation process significantly enhances the rate of sedimentation and reduces the required volume of the sedimentation tank. For example, the regular settling time of conventional coagulation time is 30 min [37,38], and the settling time of the MSC process is less than 5 min [37,39]. The MSC process can be considered as a significant advantage in treatment efficiency as well as a means of saving the capacity of tanks. Furthermore, the recovery of MS at approximately 99% [40] can further reduce the necessity for new MS addition and subsequently the overall chemical costs, which makes it an economical substitute in restricted spaces and highly urban sites. External magnetic flux can be applied to further concentrate the sludge, representing a potential direction for future research.

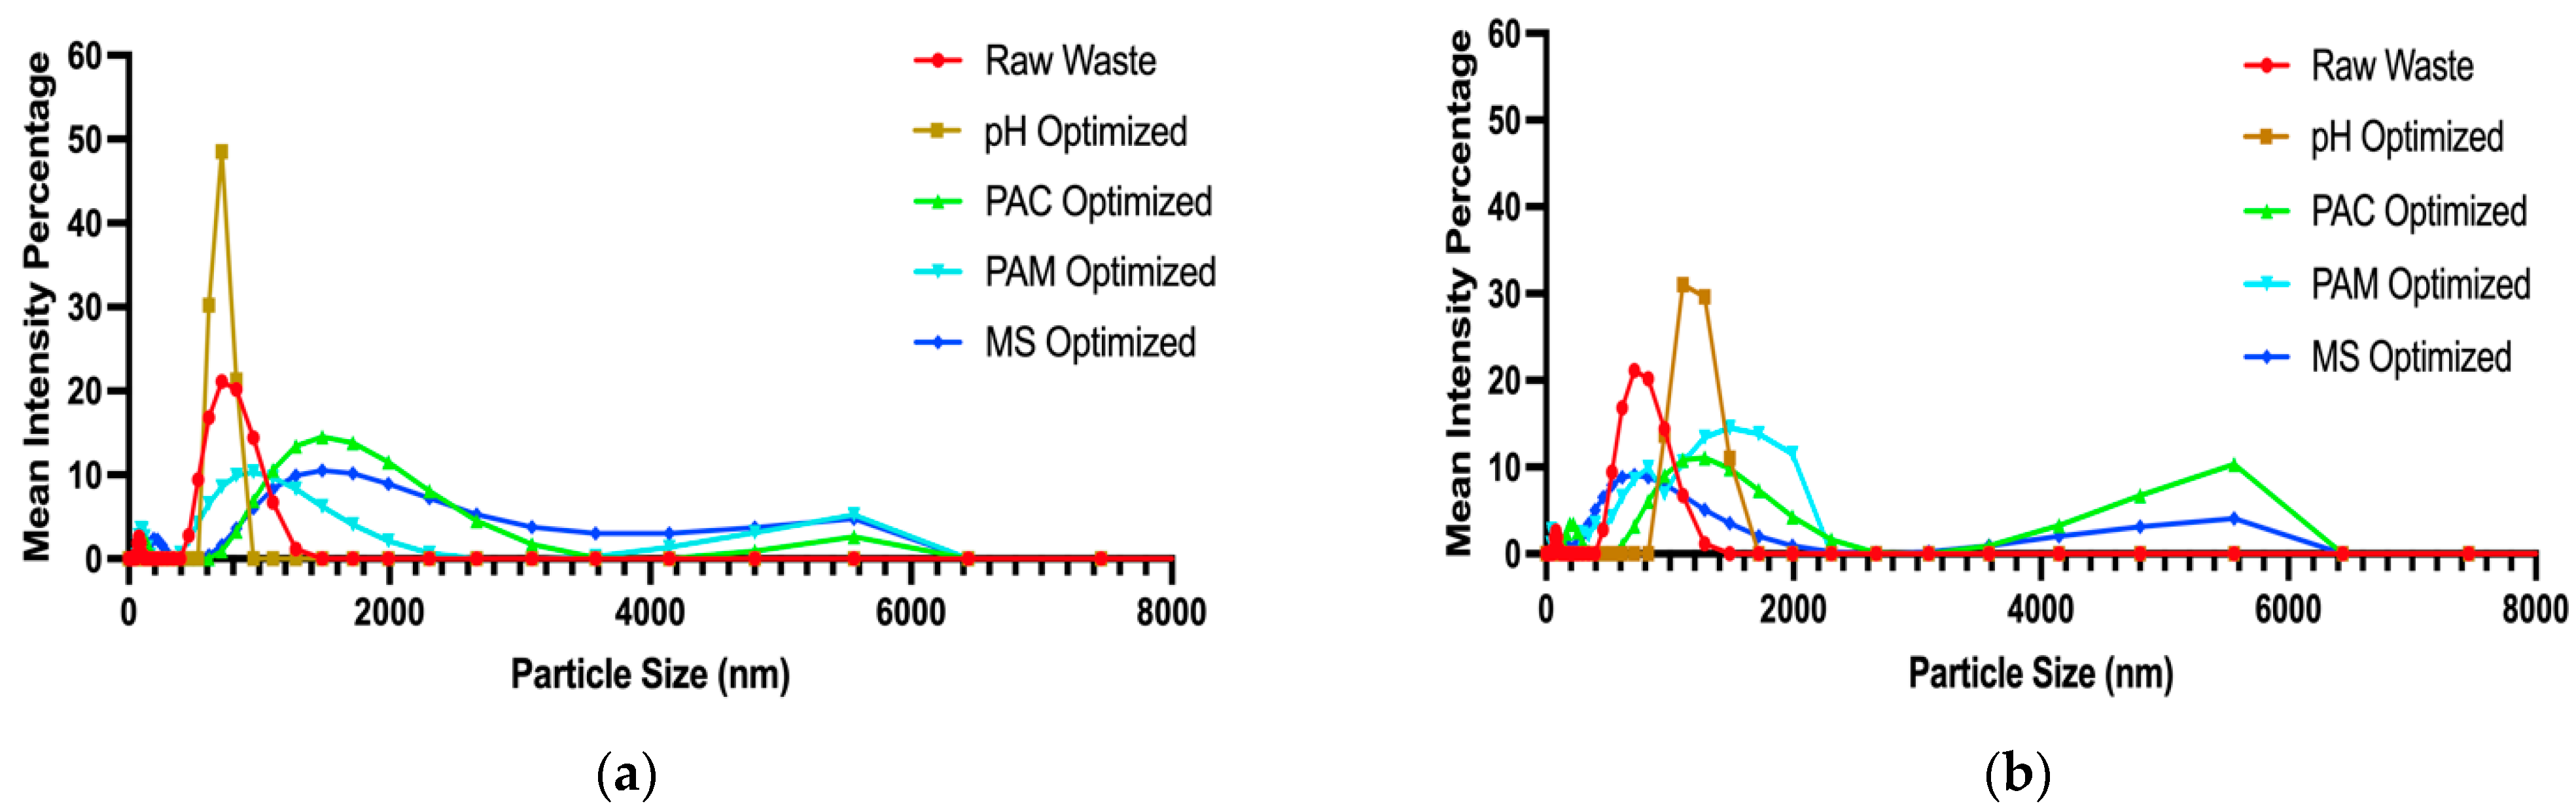
3.4. Fractal Structure Analysis

Fractal analysis was performed using SEM images of flocs, where NaOH and Ca(OH)2 were used as pH adjustment chemicals and optimization was performed on pH, PAC, PAM, and MS. The fractal dimension indicates the complexity of the floc structure. Higher values of D (closer to 2) suggest more complex and irregular structures. Therefore, when analyzing floc structures, a higher D value corresponds to denser and more complex floc structures [29]. Conversely, lower lacunarity values indicate a more uniform and densely packed structure [32].
During the pH optimization trial, NaOH-optimized flocs had a lower fractal dimension compared to Ca(OH)2-optimized flocs (Figure 4). This suggests that Ca(OH)2 results in a more complex floc structure under pH optimization. During other trials (PAC, PAM, and MS), NaOH flocs exhibit a higher fractal dimension, which implies more complex floc structures with NaOH addition. Flocs optimized with NaOH exhibited significantly lower lacunarity, indicating a more uniform and densely packed structure compared to Ca(OH)2-optimized flocs after adjustment with pH, PAC, and PAM. But with MS addition, Ca(OH)2 showed a more dense floc structure than the NaOH floc structure.
As shown in Figure S6, the microstructures of the flocs formed by PAC were scattered with small flocs, and large and loose flocs were formed with the addition of PAC + PAM, but the flocs became aggregated and more dense, and black dots were observed in the flocs with the addition of PAC + PAM + MS (Supplementary Data), explaining that MS was successfully scattered into the flocs which was also observed by [20,31]. The specific gravity of flocs with MS was much greater than that of flocs formed by only PAC. pH optimization can assist in optimizing the charge properties of the suspended particles, making them more amenable for coagulation and subsequent floc formation [41]. Morphology of the floc reveals the sweep flocculation mechanism at coagulation [42]. PAM aids in aggregating destabilized particles or micro-flocs, resulting in the formation of larger and denser flocs [43]. Polymers provide physical and chemical connections between the particles, further enhancing aggregation and floc growth. Adding MS was crucial in increasing the specific gravity of flocs, whereas PAM primarily influenced the size of the particles.

3.5. Removal of Dissolved Matter and Particle Size Optimization

The particle size distribution of raw water and optimized concentrations during trials (with PAC, PAM, and MS) in suspension are shown in Figure 5, The particle size of samples coagulated with only PAC increased, was further enhanced by adding PAM, and was further improved with MS dosage. The most substantial growth in size was witnessed with pH adjustment using both NaOH and Ca(OH)2. A similar occurrence was detected in the floc structure obtained from SEM analysis (Figure S6). The sedimentation rate of flocs formed by PAC addition was reduced by the excessive ionic density of the coagulum, even though flocs formed by PAC addition are expected to have increased sorbing capacity due to their elevated surface area and smooth, glossy (amorphous) surface. However, it was clear that by using coagulant aids, particularly MS, entangled formed flocs are created which have sheer resistance and higher weight. These flocs could decrease the settling time significantly.
FTIR data of the raw NRIWW show the presence of organic sulfate, organic nitrogen, triple-bonded molecules, aromatic compounds, and organic phosphates (Figure 6a). For the raw wastewater (Figure 6a), there is an obvious and prominent peak of 612 cm−1 in the spectra attributed to out-of-plane bending vibrations of substituted aromatic rings, which could be present in aromatic compounds found in the natural rubber wastewater. The wide range of absorption peaks at 1073 cm−1 indicates organic phosphate and phosphate ions. The peak at 1625 cm−1 typically attributed to the stretching vibrations of C=C bonds indicates the presence of unsaturated compounds like alkenes or aromatic compounds. It could suggest the presence of unsaturated compounds in the wastewater, possibly derived from natural rubber and the peak at 3220 cm−1 corresponds to aromatic compounds, organic nitrogen and ammonium. Similarly, the peak at 1409 cm−1 can be assigned to the organic sulfate. Peaks at 2159 cm−1–2029 cm−1 are attributed to the stretching vibrations of C≡N triple bonds.

4. Discussion

4.1. Proposed Mechanism of MSC Enhanced with pH Adjustment by Ca(OH)2

To comprehend the hypothesized mechanism of the MSC process as described in this study, several analytical techniques were employed, including measurement of particle size distribution of the coagulum and FTIR and FD analysis. In the presence of MS, the sludge volume index (SVI) is generally lower (Figure 4), indicating more effective sedimentation. Specifically, Ca(OH)2 trials showed a tendency for a more compact sludge blanket over time compared to NaOH. This is likely due to the additional role of Ca(OH)2 as a coagulant, which could contribute to the formation of larger, denser flocs. The optimized doses of PAM and MS further enhance these effects, leading to improved removal mechanisms and higher sedimentation rates, as seen by the more pronounced reduction in the H+/H0 ratio. These observations are critical for understanding the dynamics of floc formation and the subsequent efficiency of the MSC process. According to Figure 5, the experiment demonstrated that treating the water with PAC alone, and then with additional PAM and MS, progressively increased the particle size. The most notable enlargement occurred when the pH was modified. However, the introduction of MS as a coagulant aid led to the formation of tangled, heavy flocs that were more resistant, which could potentially reduce the time required for the particles to settle. The pH and zeta potential can also be used to describe this phenomenon further, where changing the pH can alter the surface charge of particles, making them more amenable to coagulation and reducing the zeta potential through charge neutralization to enhance particle aggregation and floc formation. As per the literature evidence, zeta potential increased with rising pH value at pH values less than 6.5 and thereafter, zeta potential decreased in the basic range. PAC can reduce turbidity at low aluminum concentrations, and the lowest level was well before the compound’s isoelectric point when considering zeta potential. Due to stable Al species such as Al13, rapid adsorption occurs, leading to the aggregation and rearrangement of particles, eventually forming “electrostatic patches” on the particle surface [35]. During MS optimization, flocs optimized with NaOH had a fractal dimension of 1.7944, higher than flocs optimized with Ca(OH)2, which had a fractal dimension of 1.7392 (Table S4). The higher fractal dimension observed with NaOH treatment could be indicative of a more porous and less efficient floc structure, which correlates with its reduced contaminant removal efficiency compared to Ca(OH)2. Conversely, Ca(OH)2-optimized flocs showed a lower lacunarity value (L = 0.4771) compared to NaOH-optimized flocs (L = 0.5508), indicating a more symmetrical and compact structure (Table S4). Ca(OH)2 exhibits less lacunarity, indicating a more symmetric and compacted floc structure, which is more effective in contaminant entrapment and results in better removal efficiency. This aligns with the overall higher efficacy of Ca(OH)2 in the treatment trials for removing contaminants. Area under curve (AUC) values and D50 measurements (Table S5) of particle size distribution (PSD) curves indicate that Ca(OH)2 is more effective in terms of particle size reduction and sedimentation compared to NaOH. The reduced D50 during Ca(OH)2 trials suggests a faster and more efficient sedimentation process. The increasing trend in AUC values when going from raw waste to the MS optimization step in NaOH treatment suggests an increase in particle quantity. For Ca(OH)2, the AUC values initially increase until the PAC optimization step and then decrease during the PAM and MS optimization steps, indicating a change in both particle size and quantity. The decreasing trend in D50 during Ca(OH)2 trials supports the notion of faster sedimentation. This size variation of the particles as shown in Figure 5 can be explained by the solubility of NaOH and Ca(OH)2. NaOH is highly soluble and easily separates into the ions of Na+ and OH. Due to strong disassociation, colloidal particles in the coagulum are smaller in size and more challenging to settle. The slower dissolution rate of Ca(OH)2 likely contributes to a more gradual release of Ca2+ ions, facilitating stronger floc formation and enhancing the MSC process’ mechanism for pollutant removal.
Findings of the FTIR results highlight NRIWW’s intricacy as well as a large range of chemical elements present in the raw wastewater. According to the FTIR results of the optimized dosage combination using NaOH and Ca(OH)2, as shown in Figure 6b,c, it is clear that Ca(OH)2 is more effective than NaOH in pollutant removal. However, neither NaOH nor Ca(OH)2 was effective in removing organic phosphate compounds contained in the NRIWW. Ca(OH)2 was efficient in removing dissolved contaminants such as aromatic compounds and C≡N triple-bond compounds from the wastewater. Some aromatic molecules can also directly adsorb onto the surfaces of PAC and PAM, which occurs as a result of chemical interactions such as hydrogen bonds or electrostatic interactions between the coagulants/flocculants and the aromatic molecules [44]. Based on the research outcomes of this study and previous studies [15,17,18,20], MS could act as cores to enhance the settling ability of coagulum with higher density, size, and strength. Due to the high suspended solid concentration of the NRIWW, short relative distances and high occurrence of impacts between particles can be observed and these result in high turbidity removal efficiency in the MSC process. According to FTIR data, aromatic/aliphatic carboxyl or hydroxyl organic matters present in NRIWW might interact with MS and form Fe–OH/Fe–OH+ bonds through surface complexing and hydrogen-bonding processes, which explain, in part, the relatively high removal of organic matter. Adsorbing–bridging is also another potential coagulation mechanism with MS-Al species, which elevated the removal of Al–hydroxyphosphate complexes. It was revealed that MS may function as adsorbents when combined with coagulants and suspended particles to form magnetic flocs with increased density, size, and strength that could be quickly and efficiently removed from suspension to coagulum.

4.2. Life Cycle Analysis and Cost Analysis

LCA offers a nuanced view of the environmental sustainability of Ca(OH)2 and NaOH when used in the MSC process for wastewater treatment. While earlier sections of this study indicate that Ca(OH)2 performs effectively, the LCA data suggest that NaOH also presents certain environmental advantages (Table 2), with a more moderate distinction. For instance, NaOH is associated with reduced impact on freshwater eutrophication [45], which is crucial in preventing excessive algal growth and maintaining the health of aquatic ecosystems. In addition, its influence on global warming metrics is marginally lower, which could lead to a smaller carbon footprint for wastewater treatment processes employing NaOH. In terms of human health, the LCA data indicate a small negative impact for NaOH in the area of carcinogenic toxicity, hinting at a potential reduction in cancer-related health risks compared to Ca(OH)2. Moreover, the slight negative value for NaOH in fossil resource scarcity [46] suggests a less intensive use of non-renewable resources, contributing to a more balanced approach to environmental stewardship. Complete impact assessment results are available as Supplementary Data. The LCA results do not undermine the viability of Ca(OH)2 but rather provide a comparative insight where NaOH shows modest environmental benefits in certain specific impact categories.
The operational costs of the coagulation process are often associated with the cost of sludge disposal, chemicals, and electricity [47]. The optimal dose was used to compute the chemical cost, and for each coagulation phase, an estimate of the cost for 1 m3 of WW was made and recorded in Table 3. Although MS addition was shown to raise the cost of chemicals, it is a relatively insignificant cost and the process may still be considered as an important process when it comes to reducing tank basin volume and enhancing treatment capacity. When incorporating LCA into the study, the initial findings suggest the NaOH may offer some environmental advantages over Ca(OH)2, particularly in reducing eutrophication and global warming potential. However, Ca(OH)2 addition for pH adjustment has significantly lower cost value when compared to NaOH. Furthermore, the nearly 99% recovery rate of MS [17] may further reduce the MS usage and, consequently, the total chemical costs. To sum up, cost analysis reveals that the MSC process with Ca(OH)2 as a pH adjustment agent is a financially viable, alternative approach for the pretreatment of NRIWW in heavily urbanized and space-constrained areas.

4.3. Limitations of this Study

The MSC approach shows promise in terms of effective pollutant removal and optimized process variables, but it also has drawbacks in terms of chemical prices, complexity, and specific pollutant removal restrictions. The particular use and setting of wastewater treatment may have an impact on the MSC method’s overall efficacy. Although past research notes a high MS recovery rate (about 99%), it is devoid of specific information regarding the MS recovery system’s economic analysis, which may have an influence on total cost considerations. This study focuses on NRIWW, and the MSC method’s applicability and effectiveness may alter depending on the kind of wastewater. Although this study suggests that Ca(OH)2 is more efficient and the MSC process may be economically viable, further work is required to fully assess the environmental and economic sustainability of this treatment approach.

5. Conclusions

In this study, the coagulation process coupled with MSC technology was employed for pretreating wastewater from the natural rubber industry, and we compared the effectiveness of NaOH and Ca(OH)2 as pH adjustment chemicals in the MSC process. With specific concentrations of commercial PAC, PAM, and MS, Ca(OH)2 showed superior removal of dissolved contaminants, particularly aromatic compounds and C≡N triple-bond compounds, forming a coagulum with uniform and densely packed floc structure. The addition of MS significantly improved coagulum settleability, enhancing pollutant removal. FTIR data indicated that organic matter in the wastewater interacted with MS, forming strong bonds and facilitating the formation of magnetic flocs, increasing their density and size. While the coagulation process concentrated pollutants in the coagulum, it effectively removed hydrophobic, non-biodegradable components, which act as common limitations for subsequent biological processes. The coagulation with PAC, PAM, and MS proved to be a cost-effective pretreatment for NRIWW. MS accelerates settling rates, reducing the footprint of the pretreatment facility, especially when used in conjunction with Ca(OH)2 for pH adjustment. LCA results showed that Ca(OH)2 addition for pH adjustment has significantly lower cost value than that of NaOH. Future studies should aim to quantify the long-term environmental impacts and economic benefits of the process to substantiate the sustainability claims made herein.

Supplementary Materials

The following supporting information can be downloaded at: https://www.mdpi.com/article/10.3390/w16060847/s1, Figure S1: Schematic diagram of the methodology of optimizations trials, Figure S2: Effect on pH on removal of (a) COD, (b) SS, and (c) turbidity, Figure S3: Effect of PAC on removal of (a) COD, (b) SS, and (c) turbidity, Figure S4: Effect of PAM on removal of (a) COD, (b) SS, and (c) turbidity, Figure S5: Effect of MS on removal of (a) COD, (b) SS, and (c) turbidity, Figure S6: SEM images of flocs (a—pH adjusted with NaOH and Ca(OH)2, b—PAC added, c—PAC and PAM added sludge, d—PAC, PAM, and MS added), Figure S7: Visual illustration of the pretreatment steps (Figure a–d with NaOH and Figure e–h with Ca(OH)2), Figure S8: Scope and system boundary of the LCA study, Table S1: Characteristics of PAC used for the experiment, Table S2: Significance of variables analyzed using ANOVA analysis, Table S3: Summary of the multivariable linear regression analysis results, Table S4: Fractal dimension (FD) and lacunarity (L) under optimized conditions, Table S5: Area under the curve (AUC) and D50 value analysis of PSD curves, Table S6 Chemical prices, Table S7: Detailed inventory data for LCA, Table S8: Complete LCA data set.

Author Contributions

Conceptualization, Y.W. (Yuansong Wei) and I.P.W.; methodology, I.P.W. and T.R.; software, I.P.W.; formal analysis, I.P.W.; investigation, I.P.W. and T.R.; writing—original draft preparation, I.P.W.; writing—review and editing, Y.W. (Yuansong Wei), R.W., S.J. and S.W.; supervision, Y.W. (Yuansong Wei), S.J., R.W. and S.W.; project administration, Y.W. (Yuansong Wei), Y.W. (Yawei Wang) and H.Z.; funding acquisition, Y.W. (Yuansong Wei). All authors have read and agreed to the published version of the manuscript.

Funding

This research was funded by the Program of China–Sri Lanka Joint Center for Water Technology Research and Demonstration; the Program of the Comprehensive Studies on Sri Lanka (059GJHZ2023104MI); the China–Sri Lanka Joint Center for Education and Research by the Chinese Academy of Sciences; and the Chinese Government Scholarship Program (CSC No. 2019SLJ017105).

Data Availability Statement

Data are contained within the article or Supplementary Materials.

Acknowledgments

The administrative staff of the education department of RCEES, technical and administrative staff at the China–Sri Lanka Joint Center for Water Technology Research and Demonstration, technical and administrative staff at the University of Peradeniya.

Conflicts of Interest

The authors declare no conflicts of interest.

References

  1. Rubber Reserach Institute of Sri Lanka. Hand Book of Rubber; Tillekeratne, L.M.K., Director, Nugawela, A., Seneviratne, W.M.G., Eds.; Rubber Research Institute: Agalawatta, Sri Lanka, 2003; Volume 2, ISBN 9559022067. [Google Scholar]
  2. Ngteni, R.; Hossain, M.S.; Kadir, M.O.A.; Asis, A.J.; Tajudin, Z. Kinetics and Isotherm Modeling for the Treatment of Rubber Processing Euent Using Iron (II) Sulphate Waste as a Coagulant. Water 2020, 12, 1747. [Google Scholar] [CrossRef]
  3. Department of Census and Statistics, Ministry of Finance. Economic Statistics of Sri Lanka. 2023. Available online: www.statistics.gov.lk (accessed on 26 February 2024).
  4. Sri Lanka, C.B. Sri Lanka Export Development Board. Available online: https://www.srilankabusiness.com/news/merchandize-exports-reached-usd-13-bn-in-2022.html (accessed on 29 August 2023).
  5. Silalahi, H.; Agustina, T.; Sirait, E. Treatment of rubber industry wastewater by using fenton reagent and activated carbon. J. Teknol. 2017, 2, 31–37. [Google Scholar]
  6. Ho, K.C.; Chan, M.K.; Chen, Y.M.; Subhramaniyun, P. Treatment of Rubber Industry Wastewater Review: Recent Advances and Future Prospects. J. Water Process Eng. 2023, 52, 103559. [Google Scholar] [CrossRef]
  7. Liu, N.; Sun, Z.; Zhang, H.; Klausen, L.H.; Moonhee, R.; Kang, S. Emerging High-Ammonia-nitrogen Wastewater Remediation by Biological Treatment and Photocatalysis Techniques. Sci. Total Environ. 2023, 875, 162603. [Google Scholar] [CrossRef] [PubMed]
  8. Wijerathna, W.S.M.S.K.; Wimalaweera, T.I.P.; Samarajeewa, D.R.; Lindamulla, L.M.L.K.B.; Rathnayake, R.M.L.D.; Nanayakkara, K.G.N.; Jegatheesan, V.; Wei, Y.; Jinadasa, K.B.S.N. Imperative Assessment on the Current Status of Rubber Wastewater Treatment: Research Development and Future Perspectives. Chemosphere 2023, 338, 139512. [Google Scholar] [CrossRef] [PubMed]
  9. Ostermeyer, P.; Van Landuyt, J.; Bonin, L.; Folens, K.; Williamson, A.; Hennebel, T.; Rabaey, K. High Rate Production of Concentrated Sulfides from Metal Bearing Wastewater in an Expanded Bed Hydrogenotrophic Sulfate Reducing Bioreactor. Environ. Sci. Ecotechnol. 2022, 11, 100173. [Google Scholar] [CrossRef] [PubMed]
  10. Idris, J.; Som, A.M.; Musa, M.; Ku Hamid, K.H.; Husen, R.; Muhd Rodhi, M.N. Dragon Fruit Foliage Plant-Based Coagulant for Treatment of Concentrated Latex Effluent: Comparison of Treatment with Ferric Sulfate. J. Chem. 2013, 2013, 230860. [Google Scholar] [CrossRef]
  11. Hatamoto, M.; Nagai, H.; Sato, S.; Takahashi, M.; Kawakami, S.; Choeisai, P.K.; Syutsubo, S.; Ohashi, A.; Yamaguchi, T. Rubber and Methane Recovery from Deproteinized Natural Rubber Wastewater by Coagulation Pre-Treatment and Anaerobic Treatment. Int. J. Environ. Res. 2012, 6, 577–584. [Google Scholar] [CrossRef]
  12. Massoudinejad, M.; Rabori, M.M.; Dehghani, M.H. Treatment of Natural Rubber Industry Wastewater through a Combination of Physicochemical and Ozonation Processes Introduction 1 Treatment of Natural Rubber Industry Wastewater through a Combination of Physicochemical and Ozonation Processes. J. Adv. Environ. Health Res. 2015, 3, 242–249. [Google Scholar]
  13. El-taweel, R.M.; Mohamed, N.; Alrefaey, K.A.; Husien, S.; Abdel-Aziz, A.B.; Salim, A.I.; Mostafa, N.G.; Said, L.A.; Fahim, I.S.; Radwan, A.G. A Review of Coagulation Explaining Its Definition, Mechanism, Coagulant Types, and Optimization Models; RSM, and ANN. Curr. Res. Green Sustain. Chem. 2023, 6, 100358. [Google Scholar] [CrossRef]
  14. Zheng, L.; Zhang, H.; Li, C.; Wu, Z.; Yu, J.; Xu, H.; Chen, M.; Wei, Y. Roles of Magnetic Coagulation in Black-Odor Water Restoration: An Insight into Dissolved Organic Matters. Water Cycle 2023, 4, 1–11. [Google Scholar] [CrossRef]
  15. Zhang, M.; Xiao, F.; Wang, D.; Xu, X.; Zhou, Q. Comparison of Novel Magnetic Polyaluminum Chlorides Involved Coagulation with Traditional Magnetic Seeding Coagulation: Coagulant Characteristics, Treating Effects, Magnetic Sedimentation Efficiency and Floc Properties. Sep. Purif. Technol. 2017, 182, 118–127. [Google Scholar] [CrossRef]
  16. Zheng, L.; Jiao, Y.; Zhong, H.; Zhang, C.; Wang, J.; Wei, Y. Insight into the Magnetic Lime Coagulation-Membrane Distillation Process for Desulfurization Wastewater Treatment: From Pollutant Removal Feature to Membrane Fouling. J. Hazard. Mater. 2020, 391, 122202. [Google Scholar] [CrossRef] [PubMed]
  17. Ritigala, T.; Demissie, H.; Chen, Y.; Zheng, J.; Zheng, L.; Zhu, J.; Fan, H.; Li, J.; Wang, D.; Weragoda, S.K.; et al. Optimized Pre-Treatment of High Strength Food Waste Digestate by High Content Aluminum-Nanocluster Based Magnetic Coagulation. J. Environ. Sci. 2021, 104, 430–443. [Google Scholar] [CrossRef]
  18. Sha, S.; Rui, X.; Xu, Y.; Gao, Y.; Lee, C.T.; Li, C. Enhanced Precipitation Performance for Treating High-Phosphorus Wastewater Using Novel Magnetic Seeds from Coal Fly Ash. J. Environ. Manag. 2022, 315, 115168. [Google Scholar] [CrossRef]
  19. Lv, M.; Zhang, Z.; Zeng, J.; Liu, J.; Sun, M.; Yadav, R.S.; Feng, Y. Roles of Magnetic Particles in Magnetic Seeding Coagulation-Flocculation Process for Surface Water Treatment. Sep. Purif. Technol. 2019, 212, 337–343. [Google Scholar] [CrossRef]
  20. Pendashteh, A.R.; Asghari Haji, F.; Chaibakhsh, N.; Yazdi, M.; Pendashteh, M. Optimized Treatment of Wastewater Containing Natural Rubber Latex by Coagulation-Flocculation Process Combined with Fenton Oxidation. J. Mater. Environ. Sci. 2017, 8, 4015–4023. [Google Scholar]
  21. Wang, Y.; Dieude-Fauvel Emilie, E.; Dentel, S.K. Physical Characteristics of Conditioned Anaerobic Digested Sludge—A Fractal, Transient and Dynamic Rheological Viewpoint. J. Environ. Sci. 2011, 23, 1266–1273. [Google Scholar] [CrossRef]
  22. Wang, Y.; Lu, J.; Du, B.; Shi, B.; Wang, D. Fractal Analysis of Polyferric Chloride-Humic Acid (PFC-HA) Flocs in Different Topological Spaces. J. Environ. Sci. 2009, 21, 41–48. [Google Scholar] [CrossRef]
  23. HJ 535-2009; Water Quality-Determination of Ammonia Nitrogen-Nessler’s Reagent Spectrophotometry. Ministry of Ecology and Environment of People’s Republic of China: Beijing, China, 2009.
  24. ISO 14040; Environmental Management—Life Cycle Assessment—Principles and Framework. International Organisation for Standardisation (ISO): Geneve, Switzerland, 2006.
  25. ISO 14044; Environmental Management—Life Cycle Assessment—Requirements and Guidelines. International Organisation for Standardisation (ISO): Geneve, Switzerland, 2006.
  26. Jin, H.; Wang, Y.; Li, T.; Dong, Y.; Li, J. Differences in Rheological and Fractal Properties of Conditioned and Raw Sewage Sludge. J. Environ. Sci. 2013, 25, 1145–1153. [Google Scholar] [CrossRef]
  27. Zheng, H.; Zhu, G.; Jiang, S.; Tshukudu, T.; Xiang, X.; Zhang, P.; He, Q. Investigations of Coagulation-Flocculation Process by Performance Optimization, Model Prediction and Fractal Structure of Flocs. Desalination 2011, 269, 148–156. [Google Scholar] [CrossRef]
  28. Rahimi, J.; Ngadi, M.O. Structure and Irregularities of Surface of Fried Batters Studied by Fractal Dimension and Lacunarity Analysis. Food Struct. 2016, 9, 13–21. [Google Scholar] [CrossRef]
  29. Wu, J.; Jin, X.; Mi, S.; Tang, J. An Effective Method to Compute the Box-Counting Dimension Based on the Mathematical Definition and Intervals. Results Eng. 2020, 6, 100106. [Google Scholar] [CrossRef]
  30. Vahedi, A.; Gorczyca, B. Application of Fractal Dimensions to Study the Structure of Flocs Formed in Lime Softening Process. Water Res. 2011, 45, 545–556. [Google Scholar] [CrossRef] [PubMed]
  31. Chen, Z.; Fan, B.; Peng, X.; Zhang, Z.; Fan, J.; Luan, Z. Evaluation of Al30 Polynuclear Species in Polyaluminum Solutions as Coagulant for Water Treatment. Chemosphere 2006, 64, 912–918. [Google Scholar] [CrossRef] [PubMed]
  32. Han, J.-C.; Ahmad, M.; Yousaf, M.; Rahman, S.U.; Sharif, H.M.A.; Zhou, Y.; Yang, B.; Huang, Y. Strategic analysis on development of simultaneous adsorption and catalytic biodegradation over advanced bio-carriers for zero-liquid discharge of industrial wastewater. Chemosphere 2023, 332, 138871. [Google Scholar] [CrossRef]
  33. Wu, X.; Ge, X.; Wang, D.; Tang, H. Distinct Coagulation Mechanism and Model between Alum and High Al13-PACl. Colloids Surf. A Physicochem. Eng. Asp. 2007, 305, 89–96. [Google Scholar] [CrossRef]
  34. Sun, Y.; Zhou, S.; Chiang, P.-C.; Shah, K.J. Evaluation and Optimization of Enhanced Coagulation Process: Water and Energy Nexus. Water-Energy Nexus 2019, 2, 25–36. [Google Scholar] [CrossRef]
  35. Cui, H.; Huang, X.; Yu, Z.; Chen, P.; Cao, X. Application Progress of Enhanced Coagulation in Water Treatment. RSC Adv. 2020, 10, 20231–20244. [Google Scholar] [CrossRef]
  36. Castrill, L.; Mara, E.; Fern, A. Coagulation—Flocculation as a Pretreatment Process at a Landfill Leachate Nitrification—Denitrification Plant. J. Hazard. Mater. 2008, 156, 538–544. [Google Scholar] [CrossRef]
  37. Ren, X.; Xu, X.; Xiao, Y.; Chen, W.; Song, K. Science of the Total Environment Effective Removal by Coagulation of Contaminants in Concentrated Leachate from Municipal Solid Waste Incineration Power Plants. Sci. Total Environ. 2019, 685, 392–400. [Google Scholar] [CrossRef] [PubMed]
  38. Feng, X.; Song, H.; Zhang, T.; Yao, S.; Wang, Y. Magnetic Technologies and Green Solvents in Extraction and Separation of Bioactive Molecules Together with Biochemical Objects: Current Opportunities and Challenges. Separations 2022, 9, 346. [Google Scholar] [CrossRef]
  39. Smoczyński, L.; Ratnaweera, H.; Kosobucka, M.; Smoczyński, M. Image Analysis of Sludge Aggregates. Sep. Purif. Technol. 2014, 122, 412–420. [Google Scholar] [CrossRef]
  40. Pernitsky, D.J.; Edzwald, J.K. Solubility of Polyaluminium Coagulants. J. Water Supply Res. Technol.—AQUA 2003, 52, 395–406. [Google Scholar] [CrossRef]
  41. Jaroszyński, T. Removal of Organic Solvents From Wastewaters By Means of Physico-Chemical Methods. Physicochem. Methods Water Wastewater Treat. 1980, 185–191. [Google Scholar] [CrossRef]
  42. Yoo, S.S. Operating Cost Reduction of In-Line Coagulation/Ultrafiltration Membrane Process Attributed to Coagulation Condition Optimization for Irreversible Fouling Control. Water 2018, 10, 1076. [Google Scholar] [CrossRef]
  43. Zhu, D.; Ge, C.; Sun, Y.; Yu, H.; Wang, J.; Sun, H. Identification of Organic Pollutants and Heavy Metals in Natural Rubber Wastewater and Evaluation Its Phytotoxicity and Cytogenotoxicity. Chemosphere 2024, 349, 140503. [Google Scholar] [CrossRef] [PubMed]
  44. Zhang, Y.; Zheng, W.; Liu, R.; Li, W.; Li, Y.; Chen, L. Treatment of an Alkaline Butyl Rubber Wastewater by the Process of Coagulation and Flocculation—Hydrolysis Acidification—Biological Contact Oxidation—MBR. Environ. Eng. Manag. J. 2013, 12, 1401–1409. [Google Scholar] [CrossRef]
  45. Melián, E.P.; Santiago, D.E.; León, E.; Reboso, J.V.; Herrera-Melián, J.A. Treatment of Laundry Wastewater by Different Processes: Optimization and Life Cycle Assessment. J. Environ. Chem. Eng. 2023, 11, 109302. [Google Scholar] [CrossRef]
  46. Zhou, X.; Yang, J.; Zhao, X.; Dong, Q.; Wang, X.; Wei, L.; Yang, S.S.; Sun, H.; Ren, N.Q.; Bai, S. Towards the Carbon Neutrality of Sludge Treatment and Disposal in China: A Nationwide Analysis Based on Life Cycle Assessment and Scenario Discovery. Environ. Int. 2023, 174, 107927. [Google Scholar] [CrossRef]
  47. Teo, C.J.; Karkou, E.; Vlad, O.; Vyrkou, A.; Savvakis, N.; Arampatzis, G.; Angelis-Dimakis, A. Life cycle environmental impact assessment of slaughterhouse wastewater treatment. Chem. Eng. Res. Des. 2023, 200, 550–565. [Google Scholar] [CrossRef]
Figure 1. Optimization trials with removal efficiencies of COD, SS, and turbidity: (a) pH (at 0.75 g/L PAC dosage); (b) PAC (pH at 7.0 and 6.5 for NaOH and Ca(OH)2 trials, respectively); (c) PAM (pH at 7.0 and 6.5, PAC at 750 mg/L and 600 mg/L for NaOH and Ca(OH)2 trials, respectively); (d) MS (pH at 7.0 and 6.5, PAC at 750 mg/L and 600 mg/L, PAM at 50 mg/L and 75 mg/L for NaOH and Ca(OH)2 trials, respectively).
Water 16 00847 g001
Figure 2. Removal of pollutants under optimized conditions. (For NaOH, the optimum conditions were determined as pH 7.0, PAC dosage of 750 mg/L, PAM dosage of 50 mg/L, and MS dosage of 50 mg/L. Optimum conditions for Ca(OH)2 were pH 6.5, PAC dosage of 600 mg/L, PAM dosage of 75 mg/L, and MS dosage of 100 mg/L).
Water 16 00847 g002
Figure 3. Effect of MSC with NaOH and Ca(OH)2 on sludge volume: ratio of the height of the sludge blanket (H+) to the total liquid height (H0).
Water 16 00847 g003
Figure 4. Fractal dimension and lacunarity of floc structure obtained from each optimized dosage. (For NaOH, the optimum conditions were determined as pH 7.0, PAC dosage of 750 mg/L, PAM dosage of 50 mg/L, and MS dosage of 50 mg/L. Optimum conditions for Ca(OH)2 were pH 6.5, PAC dosage of 600 mg/L, PAM dosage of 75 mg/L, and MS dosage of 100 mg/L).
Water 16 00847 g004
Figure 5. Particle size distribution of optimized conditions for (a) NaOH, (b) Ca(OH)2. (For NaOH, the optimum conditions were determined as pH 7.0, PAC dosage of 750 mg/L, PAM dosage of 50 mg/L, and MS dosage of 50 mg/L. Optimum conditions for Ca(OH)2 were pH 6.5, PAC dosage of 600 mg/L, PAM dosage of 75 mg/L, and MS dosage of 100 mg/L).
Water 16 00847 g005
Figure 6. FTIR of the samples: (a) raw wastewater, (b) optimized NaOH trial, (c) optimized Ca(OH)2 trial. (For NaOH, the optimum conditions were determined as pH 7.0, PAC dosage of 750 mg/L, PAM dosage of 50 mg/L, and MS dosage of 50 mg/L. Optimum conditions for Ca(OH)2 were pH 6.5, PAC dosage of 600 mg/L, PAM dosage of 75 mg/L, and MS dosage of 100 mg/L).
Water 16 00847 g006
Table 1. Characteristics of raw and pretreated (at optimum conditions) natural rubber wastewater from the centrifuged latex factory (Average ± S.D.) (n = 6).
ParameterRaw WastewaterPretreated Wastewater with Ca(OH)2Pretreated Wastewater with NaOH
COD, mg/L34,875 ± 265220,248 ± 82425,893 ± 2000
BOD5, mg/L11,150 ± 14856467 ± 9727805 ± 678
TOC, mg/L12,034 ± 16177438 ±10688238 ± 1543
TN, mg/L4137 ± 11033529 ± 3123830 ± 534
NO3–N, mg/L1461 ± 245113 ± 37485 ± 248
NO2–N, mg/L50.45 ± 24.6735.55 ± 20.1842.67 ± 33.48
NH3–N, mg/L2583 ± 8101545 ± 972256 ± 398
PO43−–P, mg/L995 ± 333156 ± 35390 ± 152
TSS, mg/L5695 ± 25951275 ± 452093 ± 22
SO42−–S, mg/L3130 ± 1032425 ± 1811126 ± 348
EC, mS/cm28.35 ± 8.5624.55 ± 8.6726.60 ± 9.14
Turbidity2620 ± 20587 ± 7708 ± 126
pH5.02 ± 0.816.50 ± 0.257.00 ± 0.50
Table 2. Summary of LCA analysis data set.
IndicatorMSC with Ca(OH)2MSC with NaOHUnit
Fossil resource scarcity1.55999 × 10−1−6.88316 × 10⁻¹USD2013
Freshwater ecotoxicity6.68386 × 10−145.72752 × 10⁻¹³species.yr
Freshwater eutrophication−1.85415 × 10⁻⁷−1.33689 × 10⁻⁷species.yr
Global warming, Human health1.38058 × 10−63.65916 × 10⁻⁷DAILY
Human carcinogenic toxicity2.52249 × 10−9−1.54105 × 10⁻⁸DAILY
Human non-carcinogenic toxicity3.00235 × 10−83.50142 × 10⁻⁸DAILY
Table 3. Comparison of chemical cost for each coagulation step to treat 1 m3 of NRIWW.
Optimization StepCost (USD/m3)
NaOHCa(OH)2
pH Optimization1.880.41
PAC Optimization0.380.30
PAM Optimization0.200.30
MS Optimization0.030.07
Total2.491.08
Disclaimer/Publisher’s Note: The statements, opinions and data contained in all publications are solely those of the individual author(s) and contributor(s) and not of MDPI and/or the editor(s). MDPI and/or the editor(s) disclaim responsibility for any injury to people or property resulting from any ideas, methods, instructions or products referred to in the content.

