
Evaluation of Water Quality of Groundwater of Sanghar District, Sindh, Pakistan: Chemical and Multivariate Analysis

 ,
,
Abstract
:1. Introduction
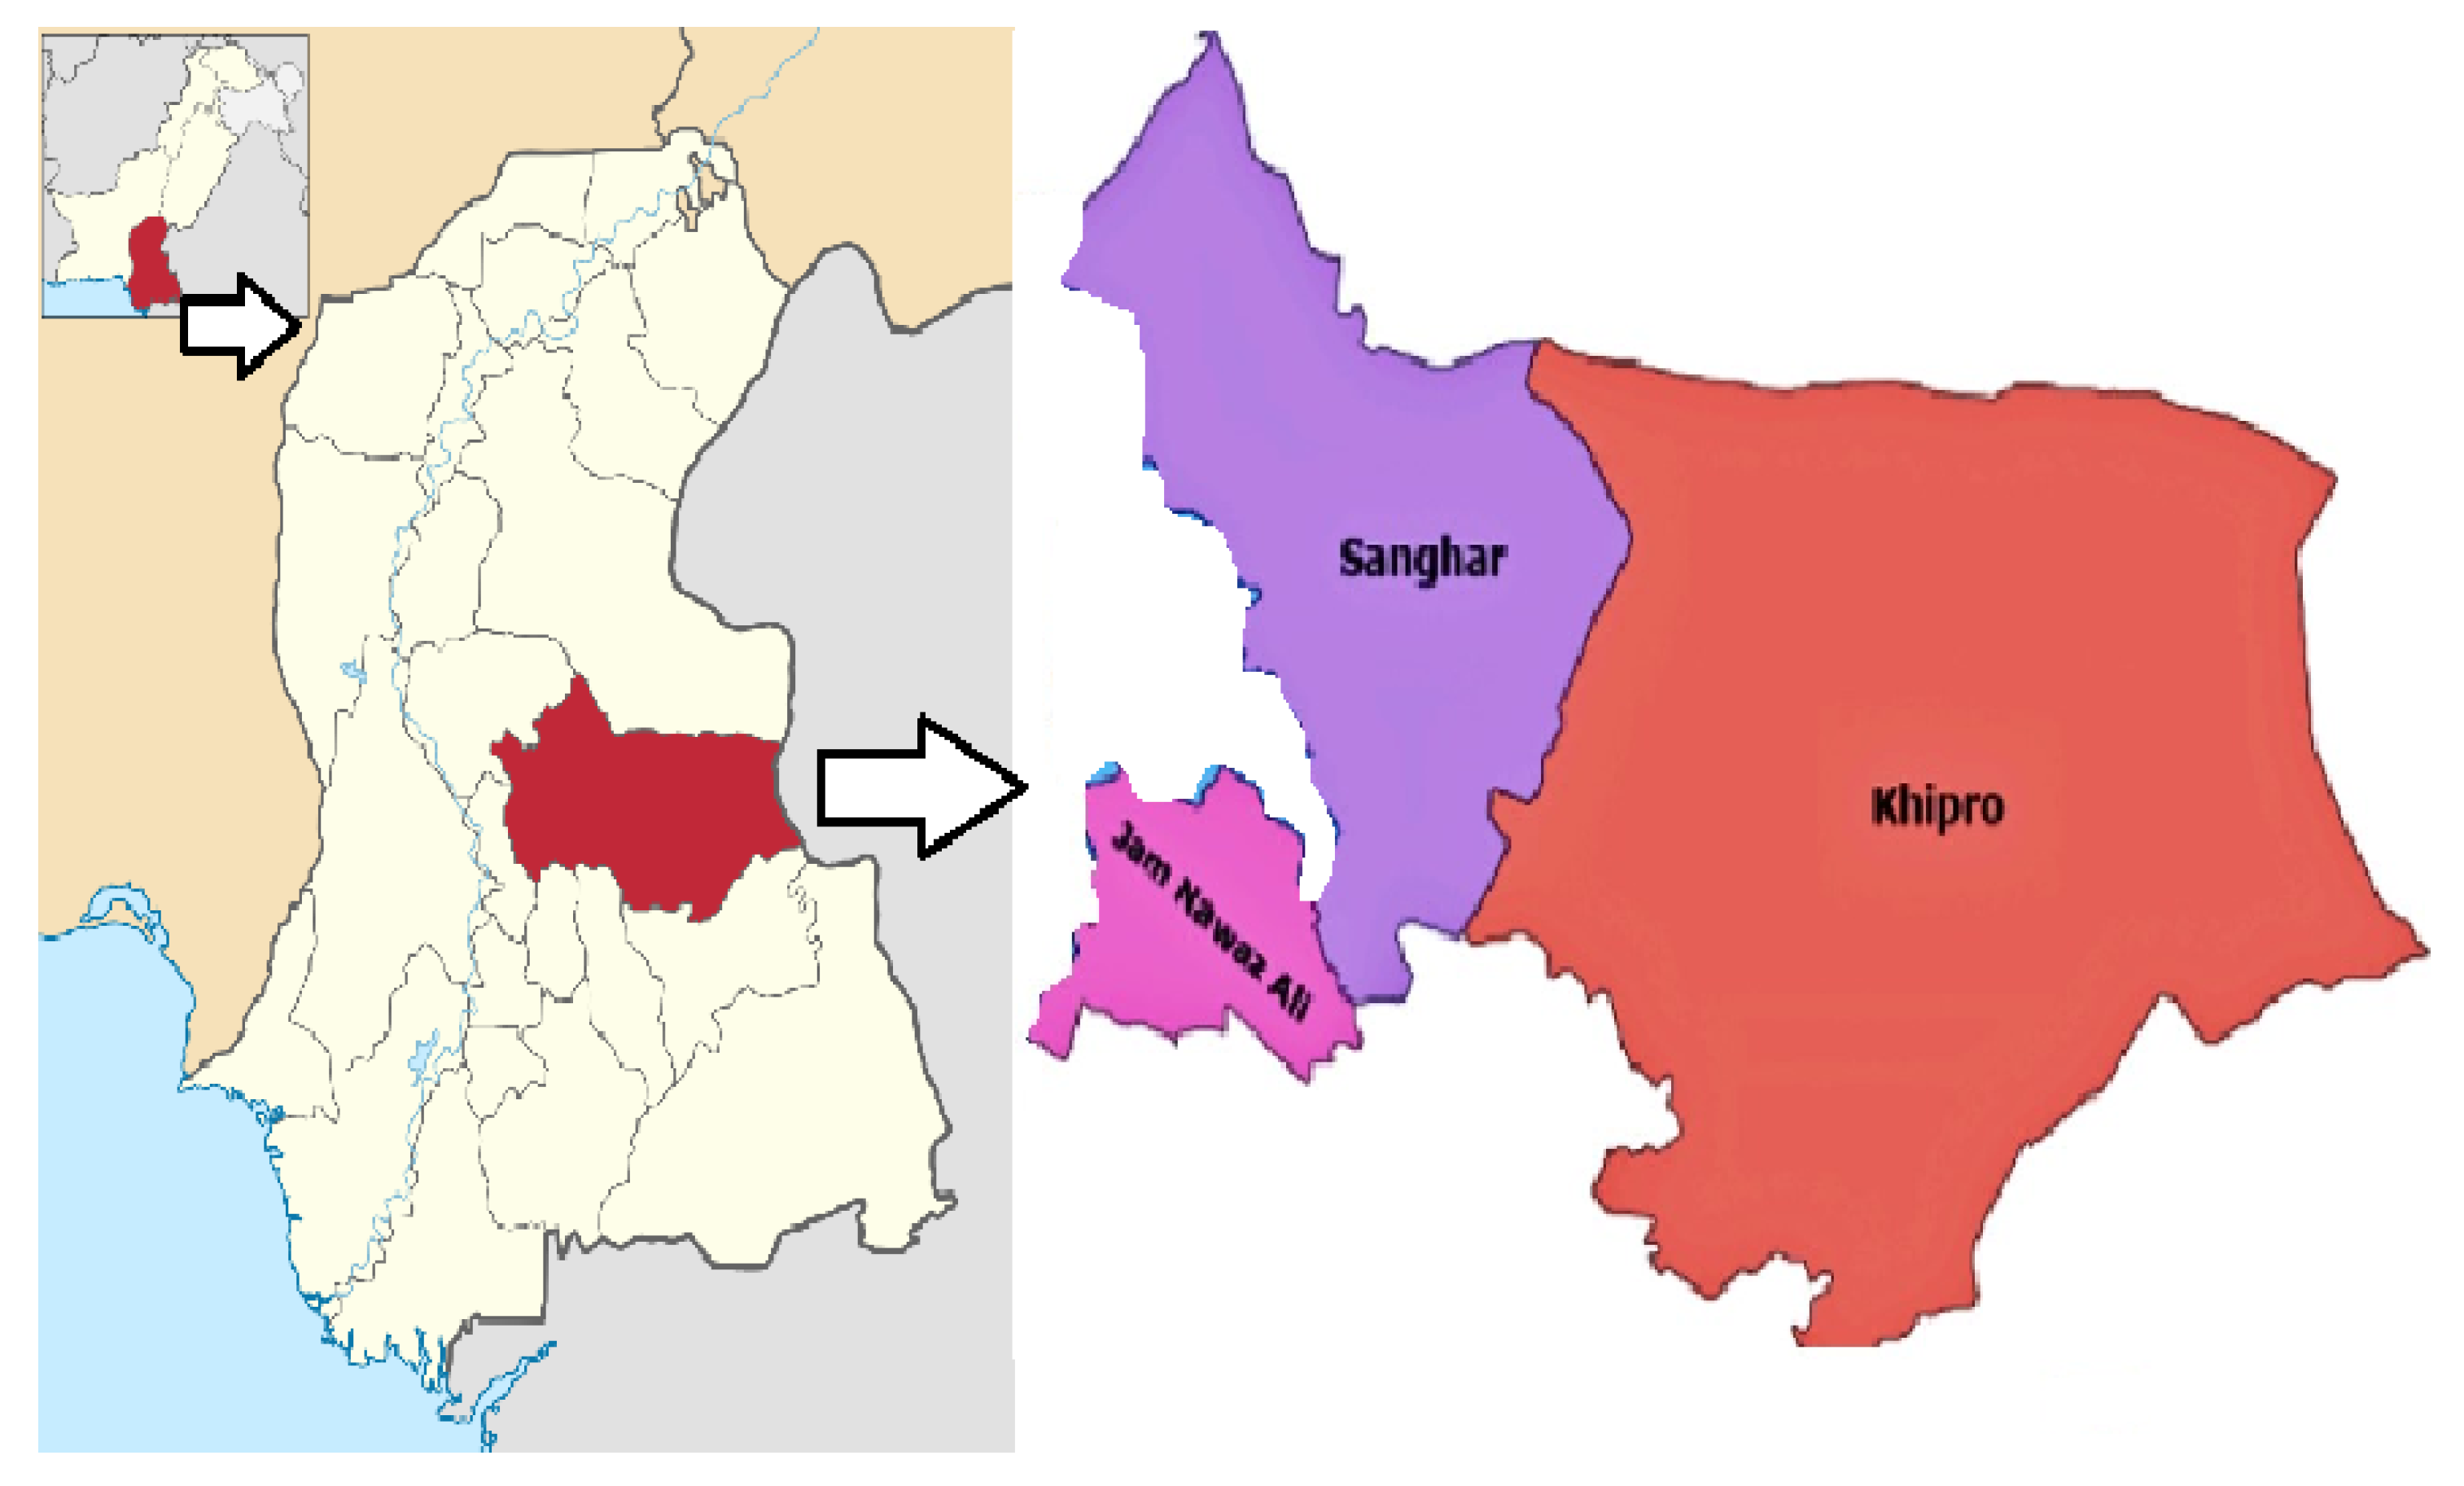
Geography and Geology
2. Materials and Methods
2.1. Sample Collection
2.2. Sample Analysis
2.3. Water Quality Index (WQI)
2.4. Gibbs Diagrams
2.5. Contamination Index (Cd)
2.6. Chronic Daily Intake Indices (CDIs)
2.7. Hazard Quotient Indices (HQ)
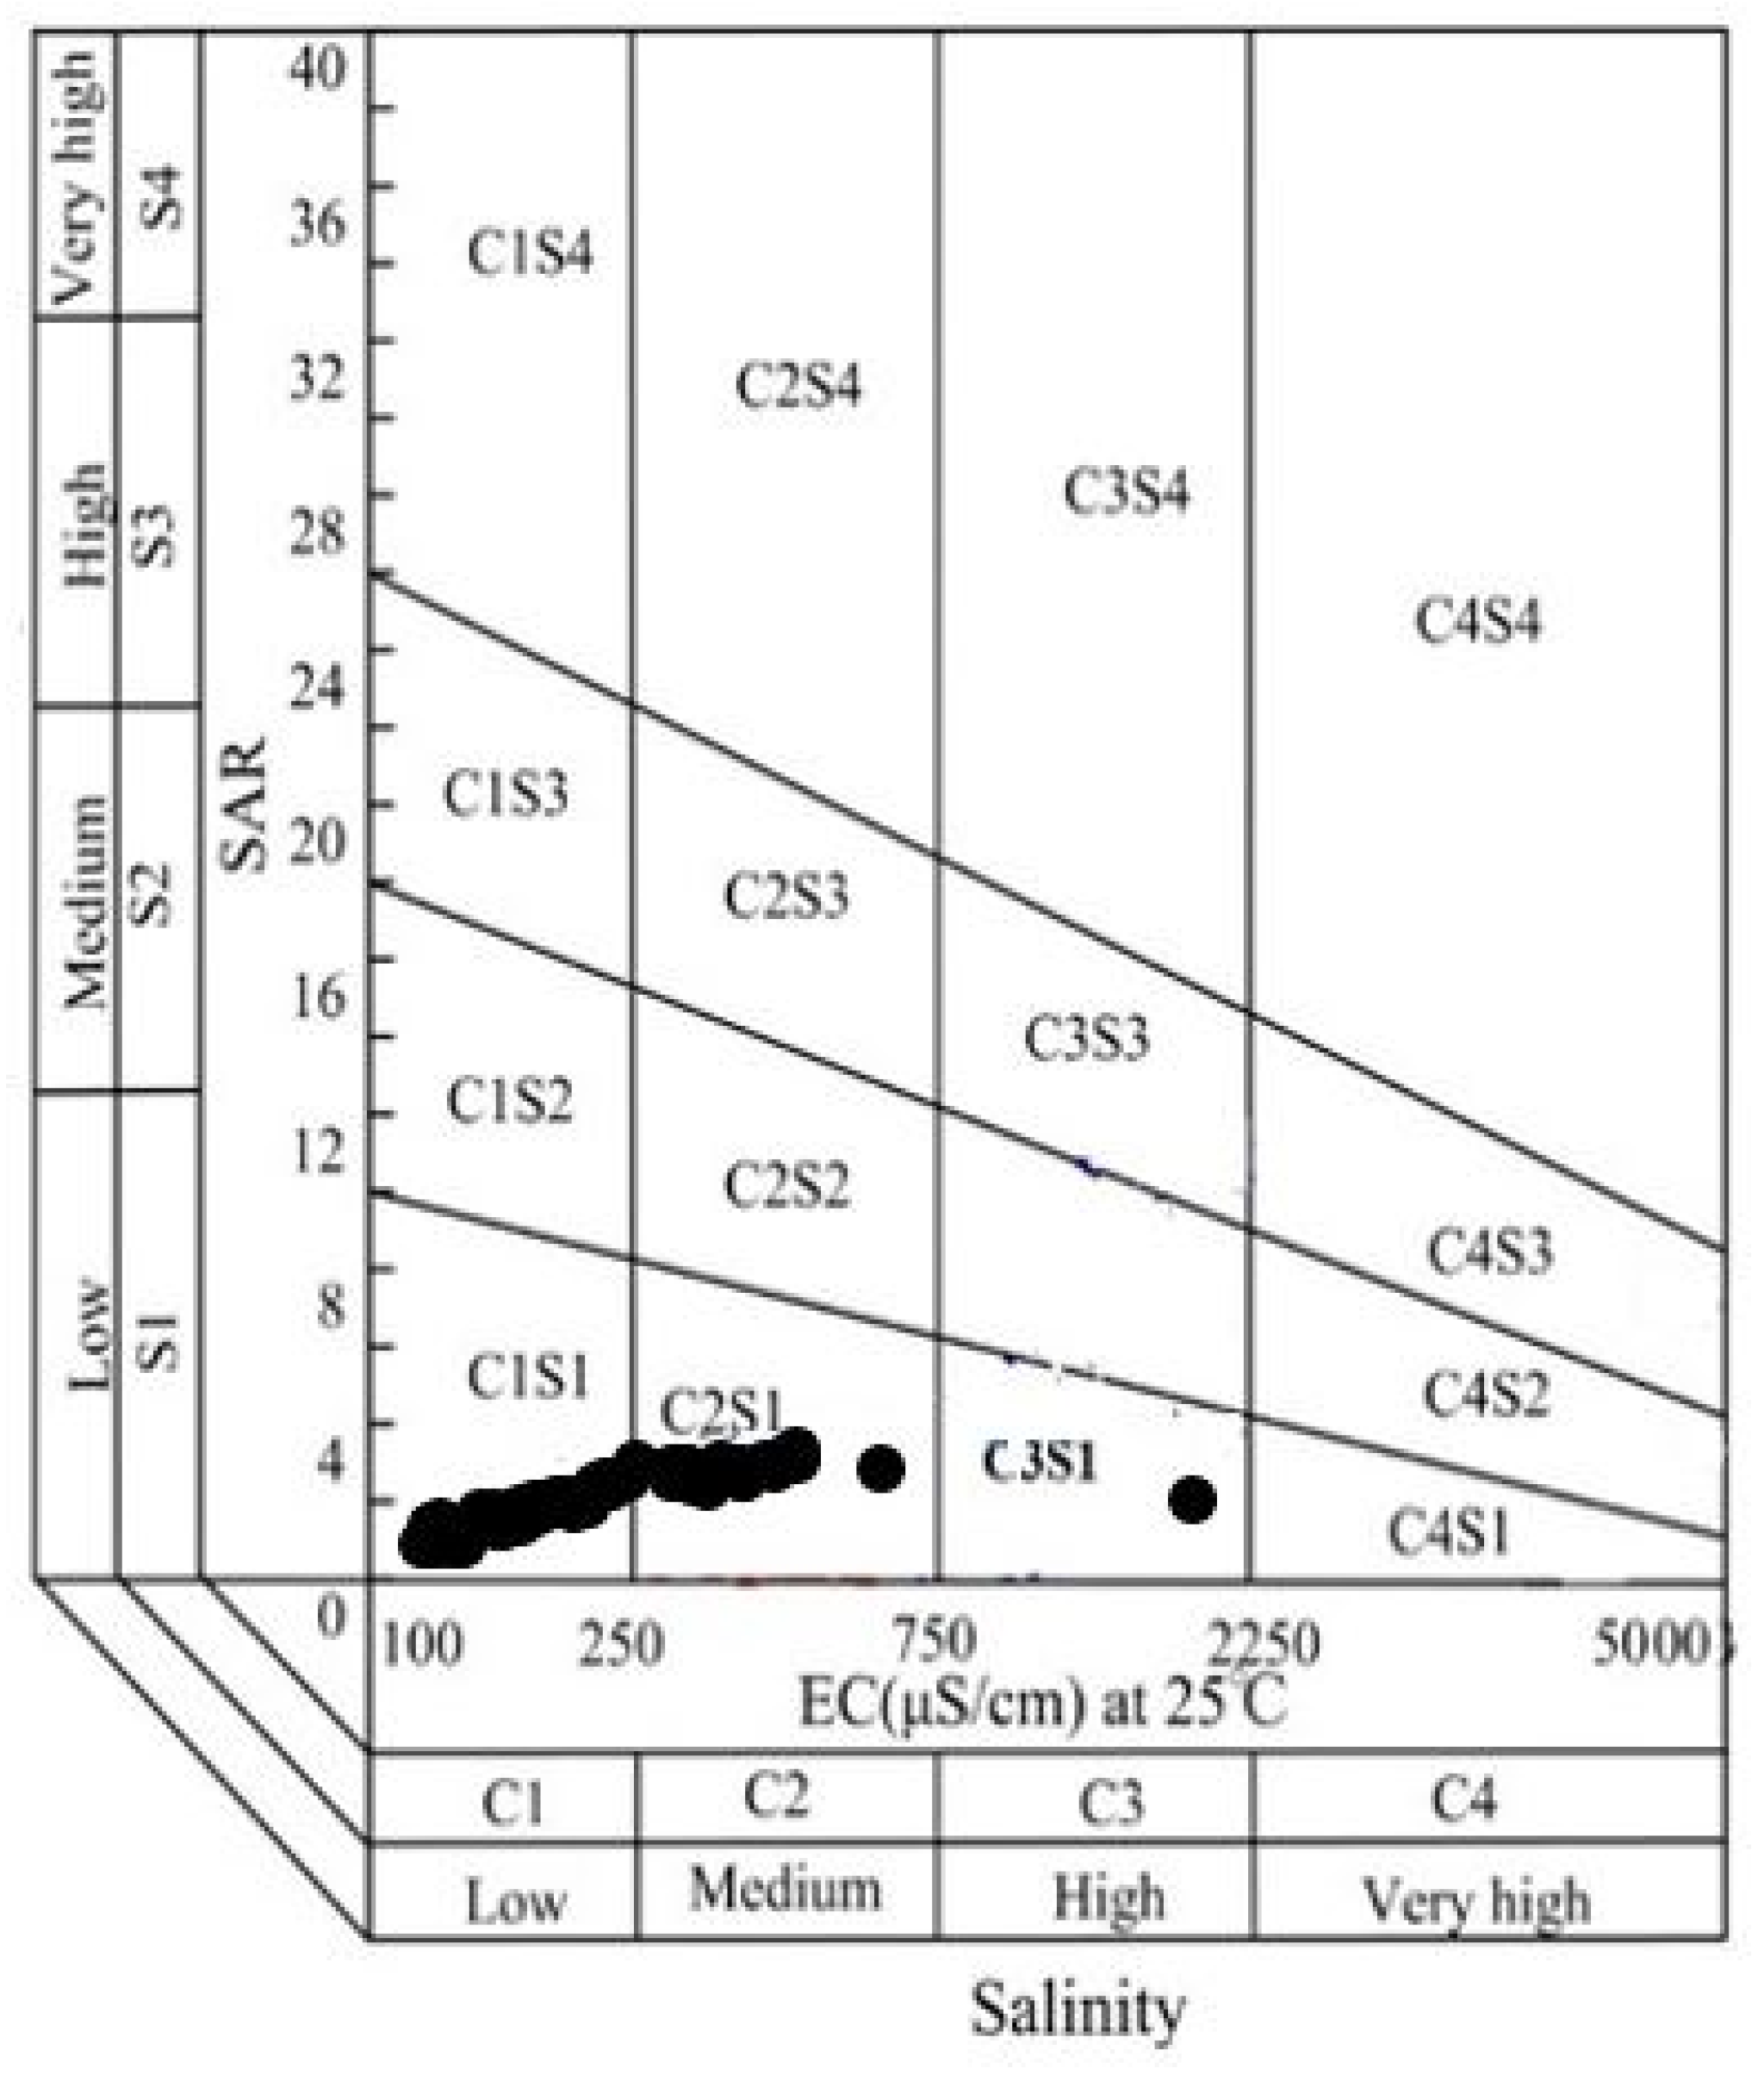
2.8. Suitability of the Groundwater for Irrigation
3. Results and Discussion
3.1. Sanghar Subdistrict
Suitability of Groundwater for Irrigation
3.2. Khipro Subdistrict
Quality of the Water for Irrigation
3.3. Jam Nawaz Ali Subdistrict
Water Quality for Irrigation
3.4. Water Quality Index (WQI)
3.5. Contamination Index (Cd)
3.6. Gibbs Diagrams
3.7. Chronic Daily Intake Indices (CDIs)
3.8. Hazard Quotient Indices (HQ)
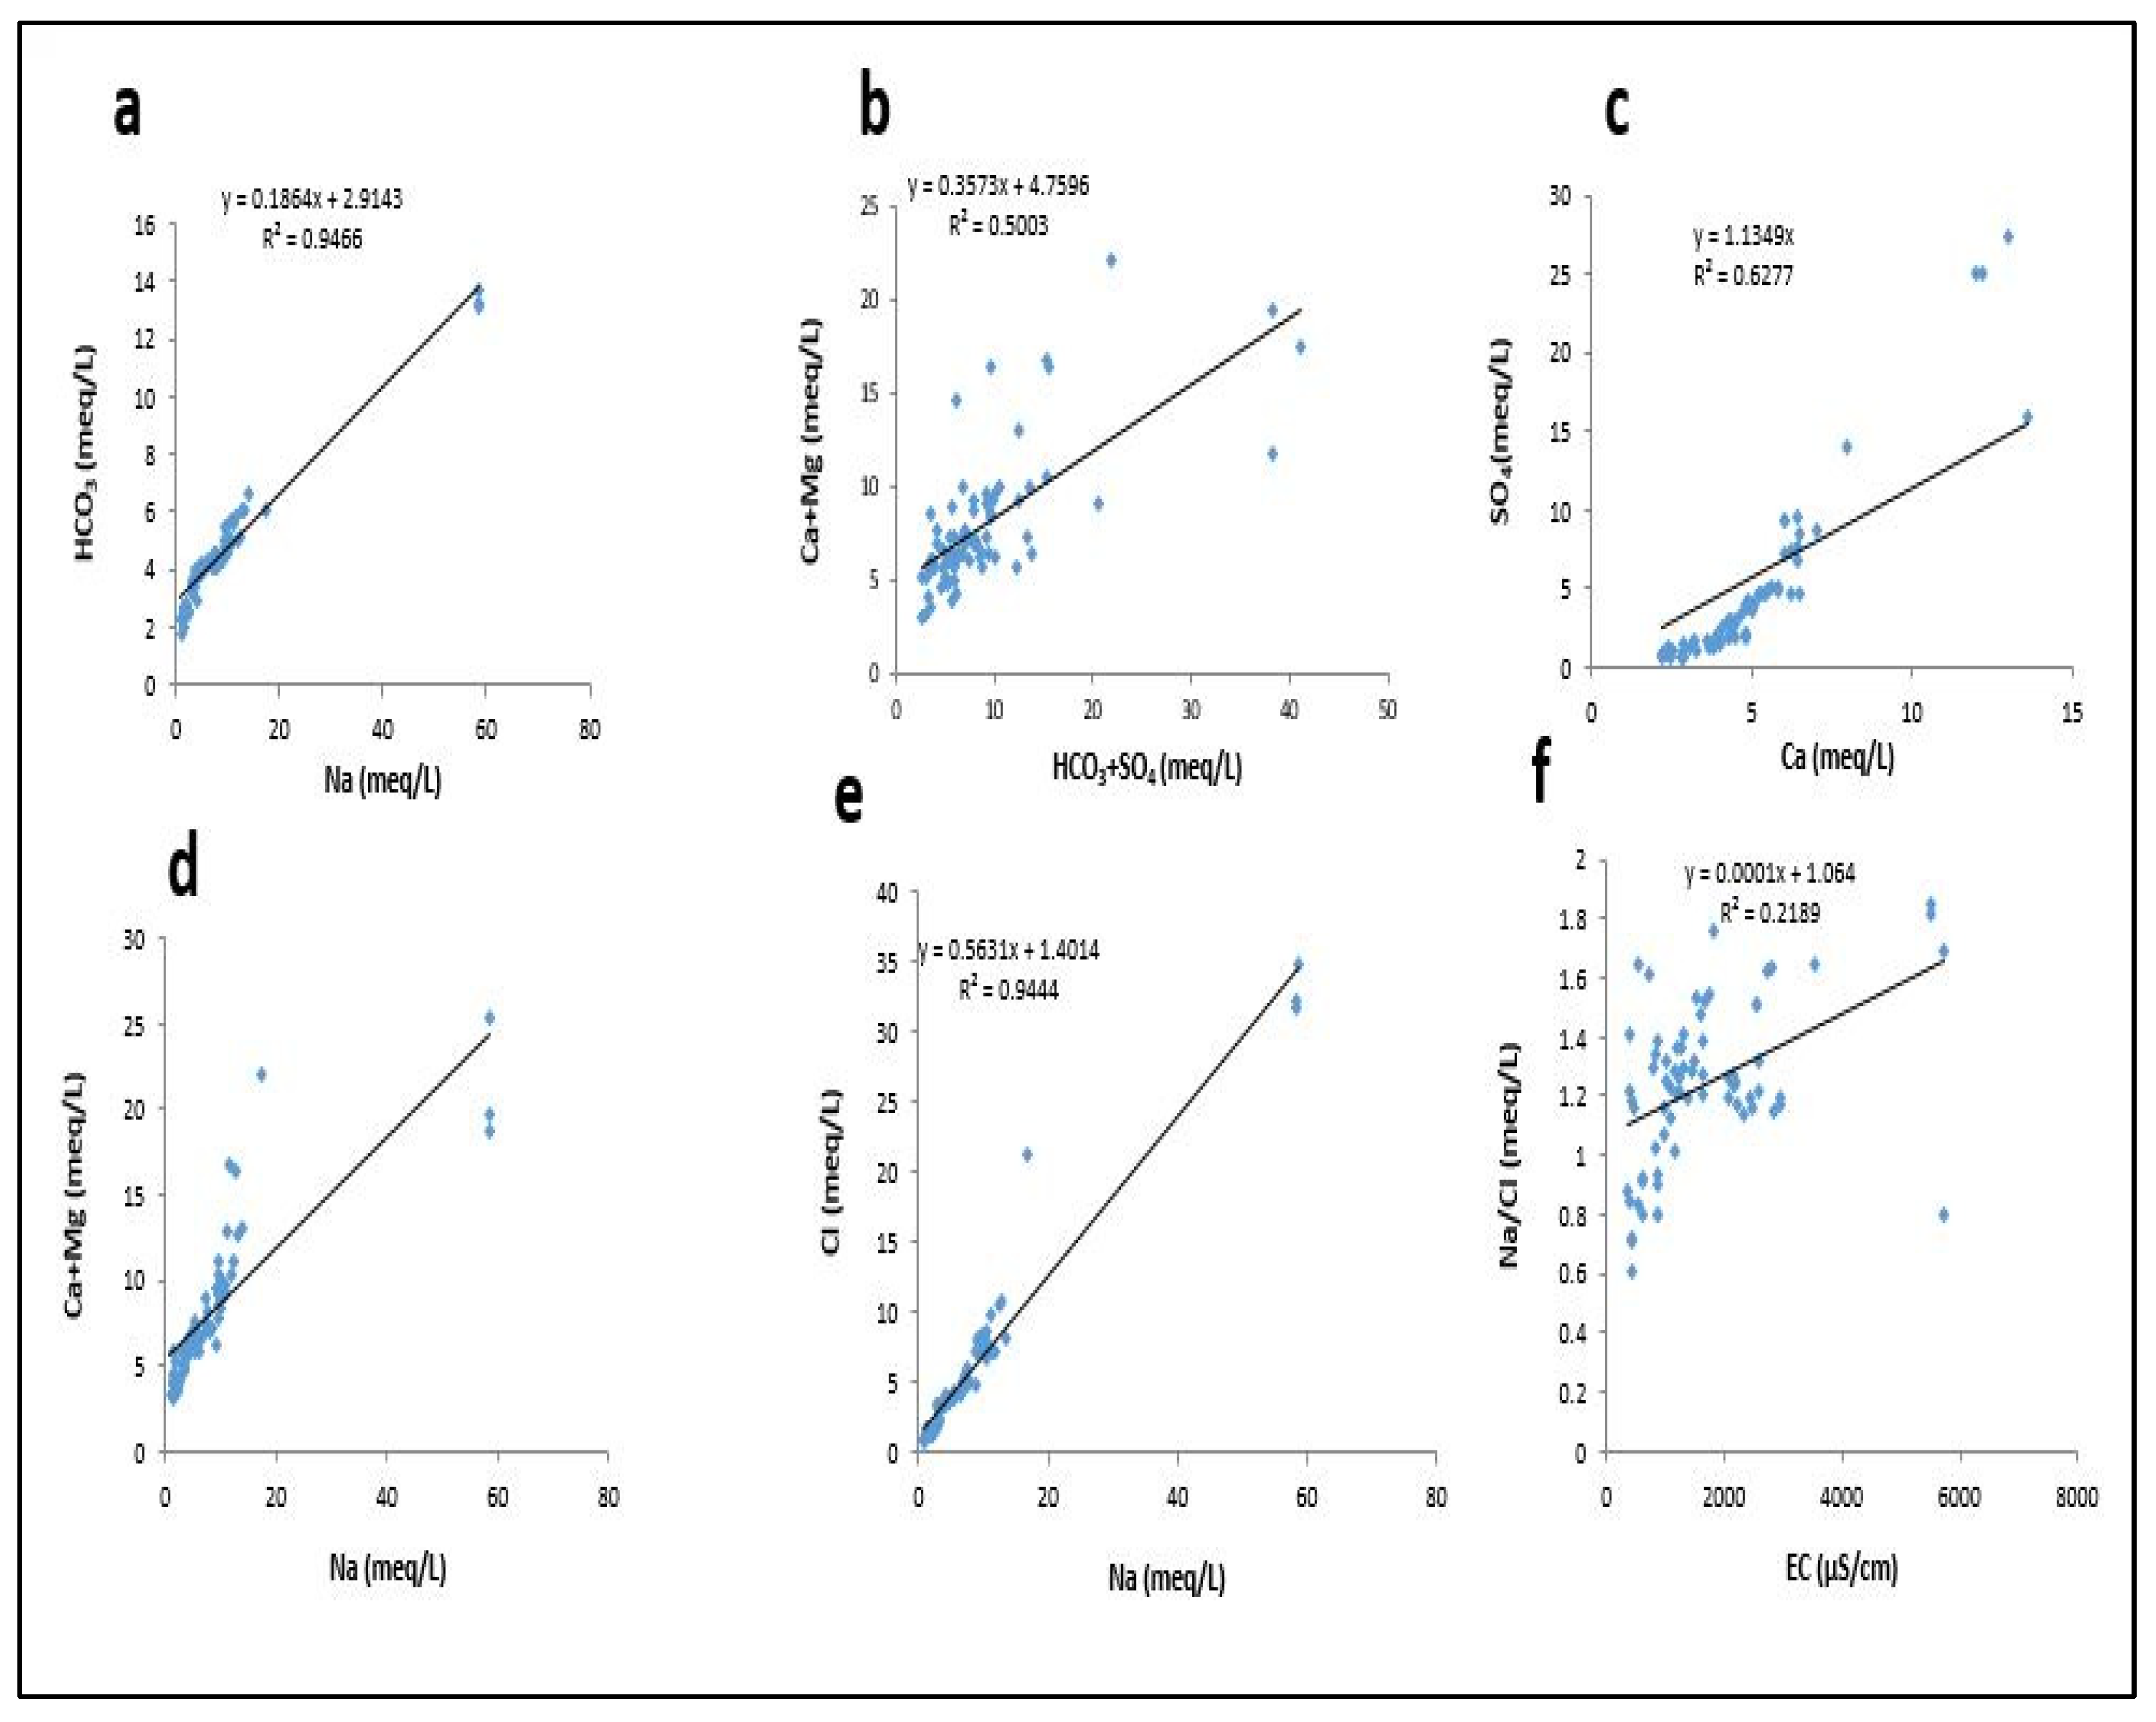
3.9. Scatter Diagrams for Weathering Processes
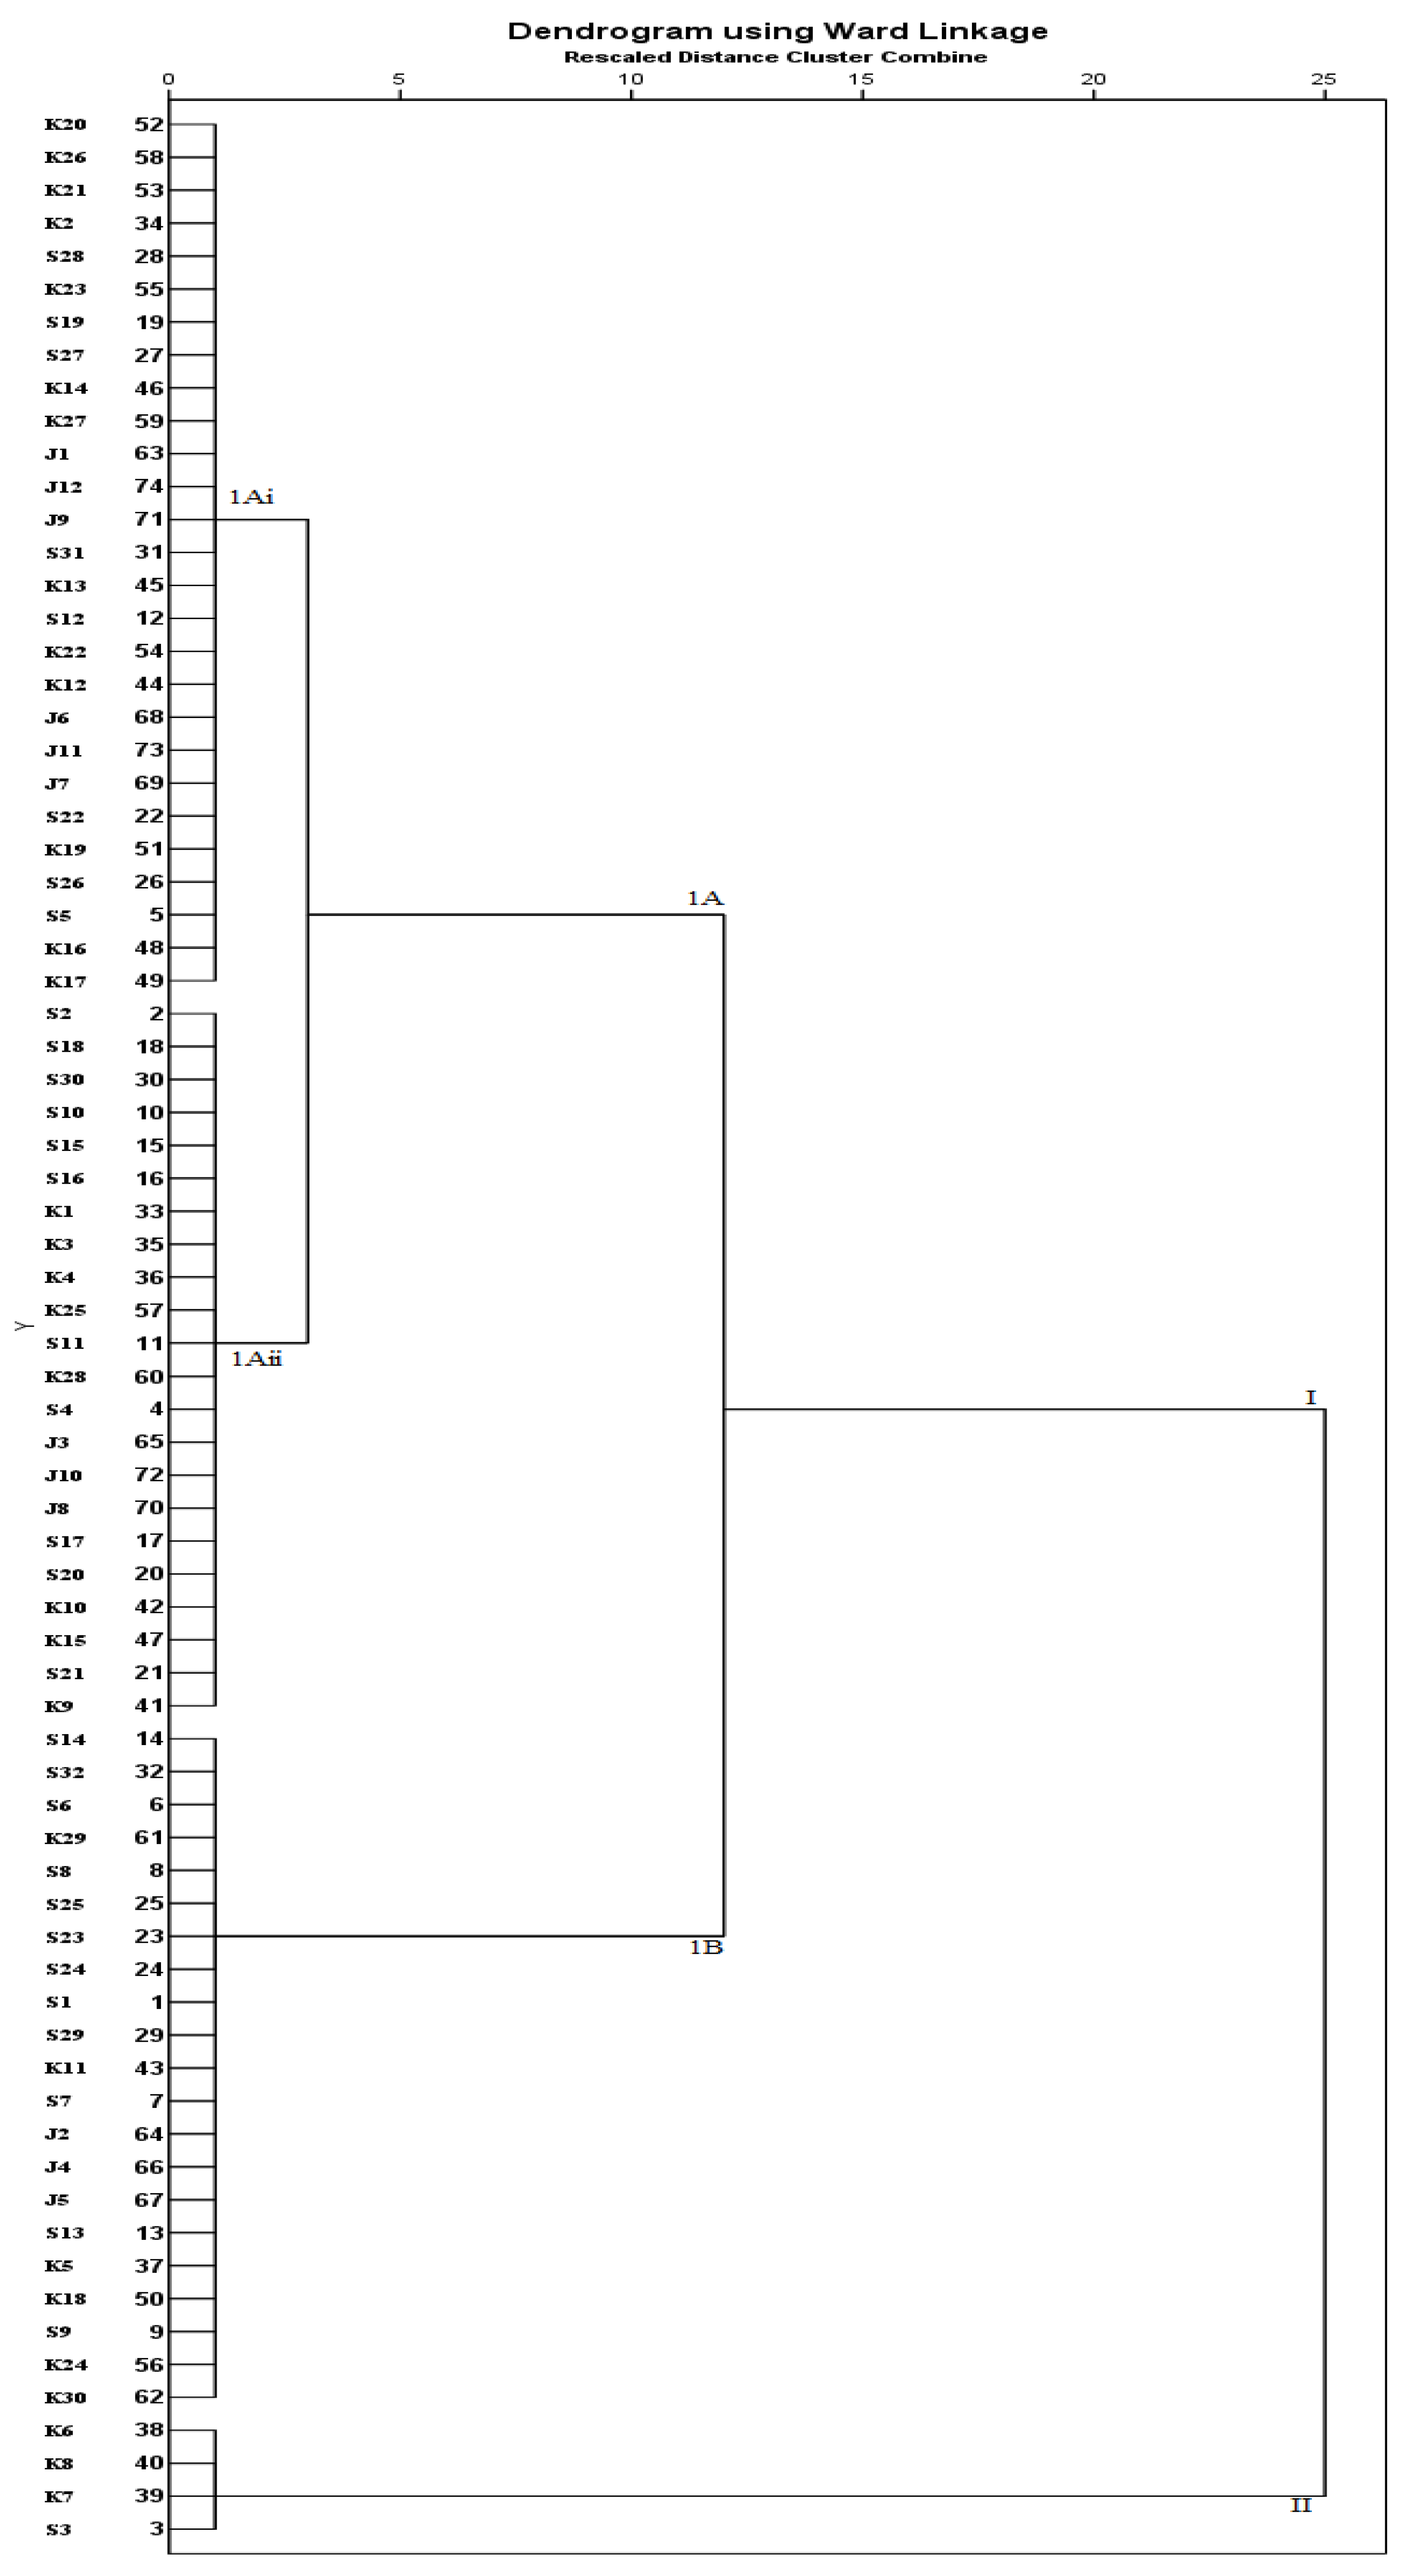
3.10. Cluster Analysis (CA)
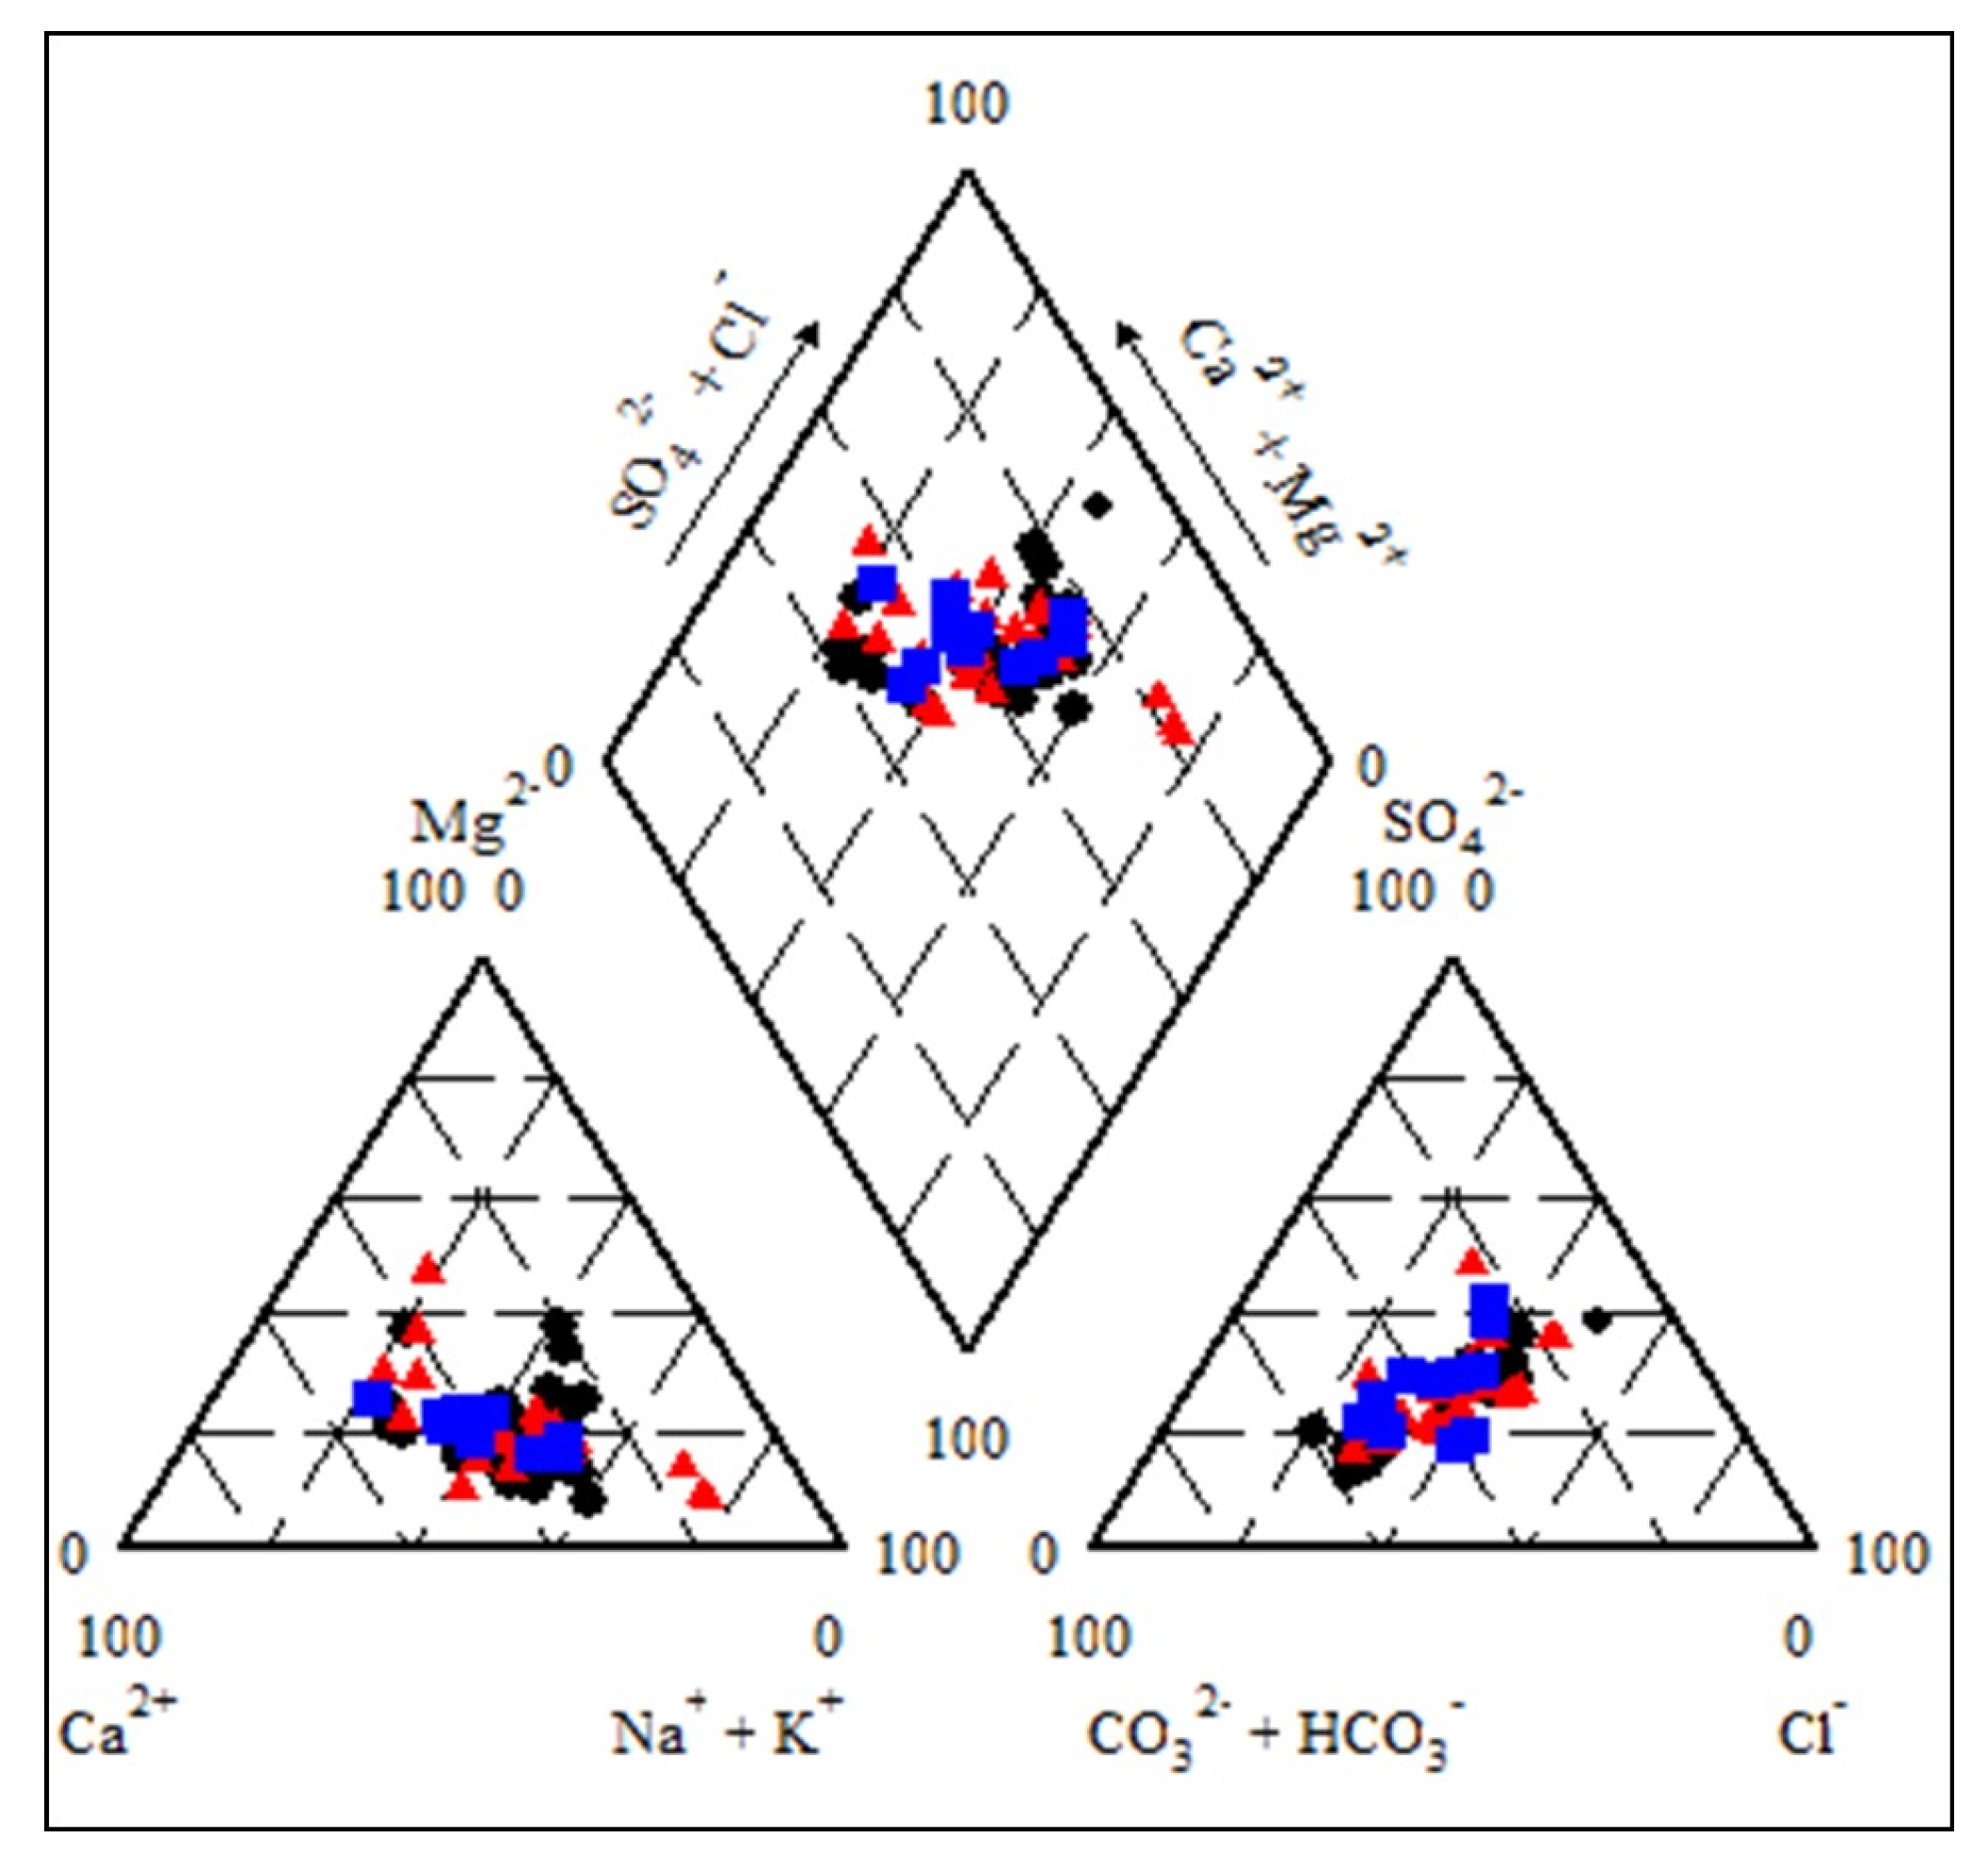
3.11. Piper Diagrams
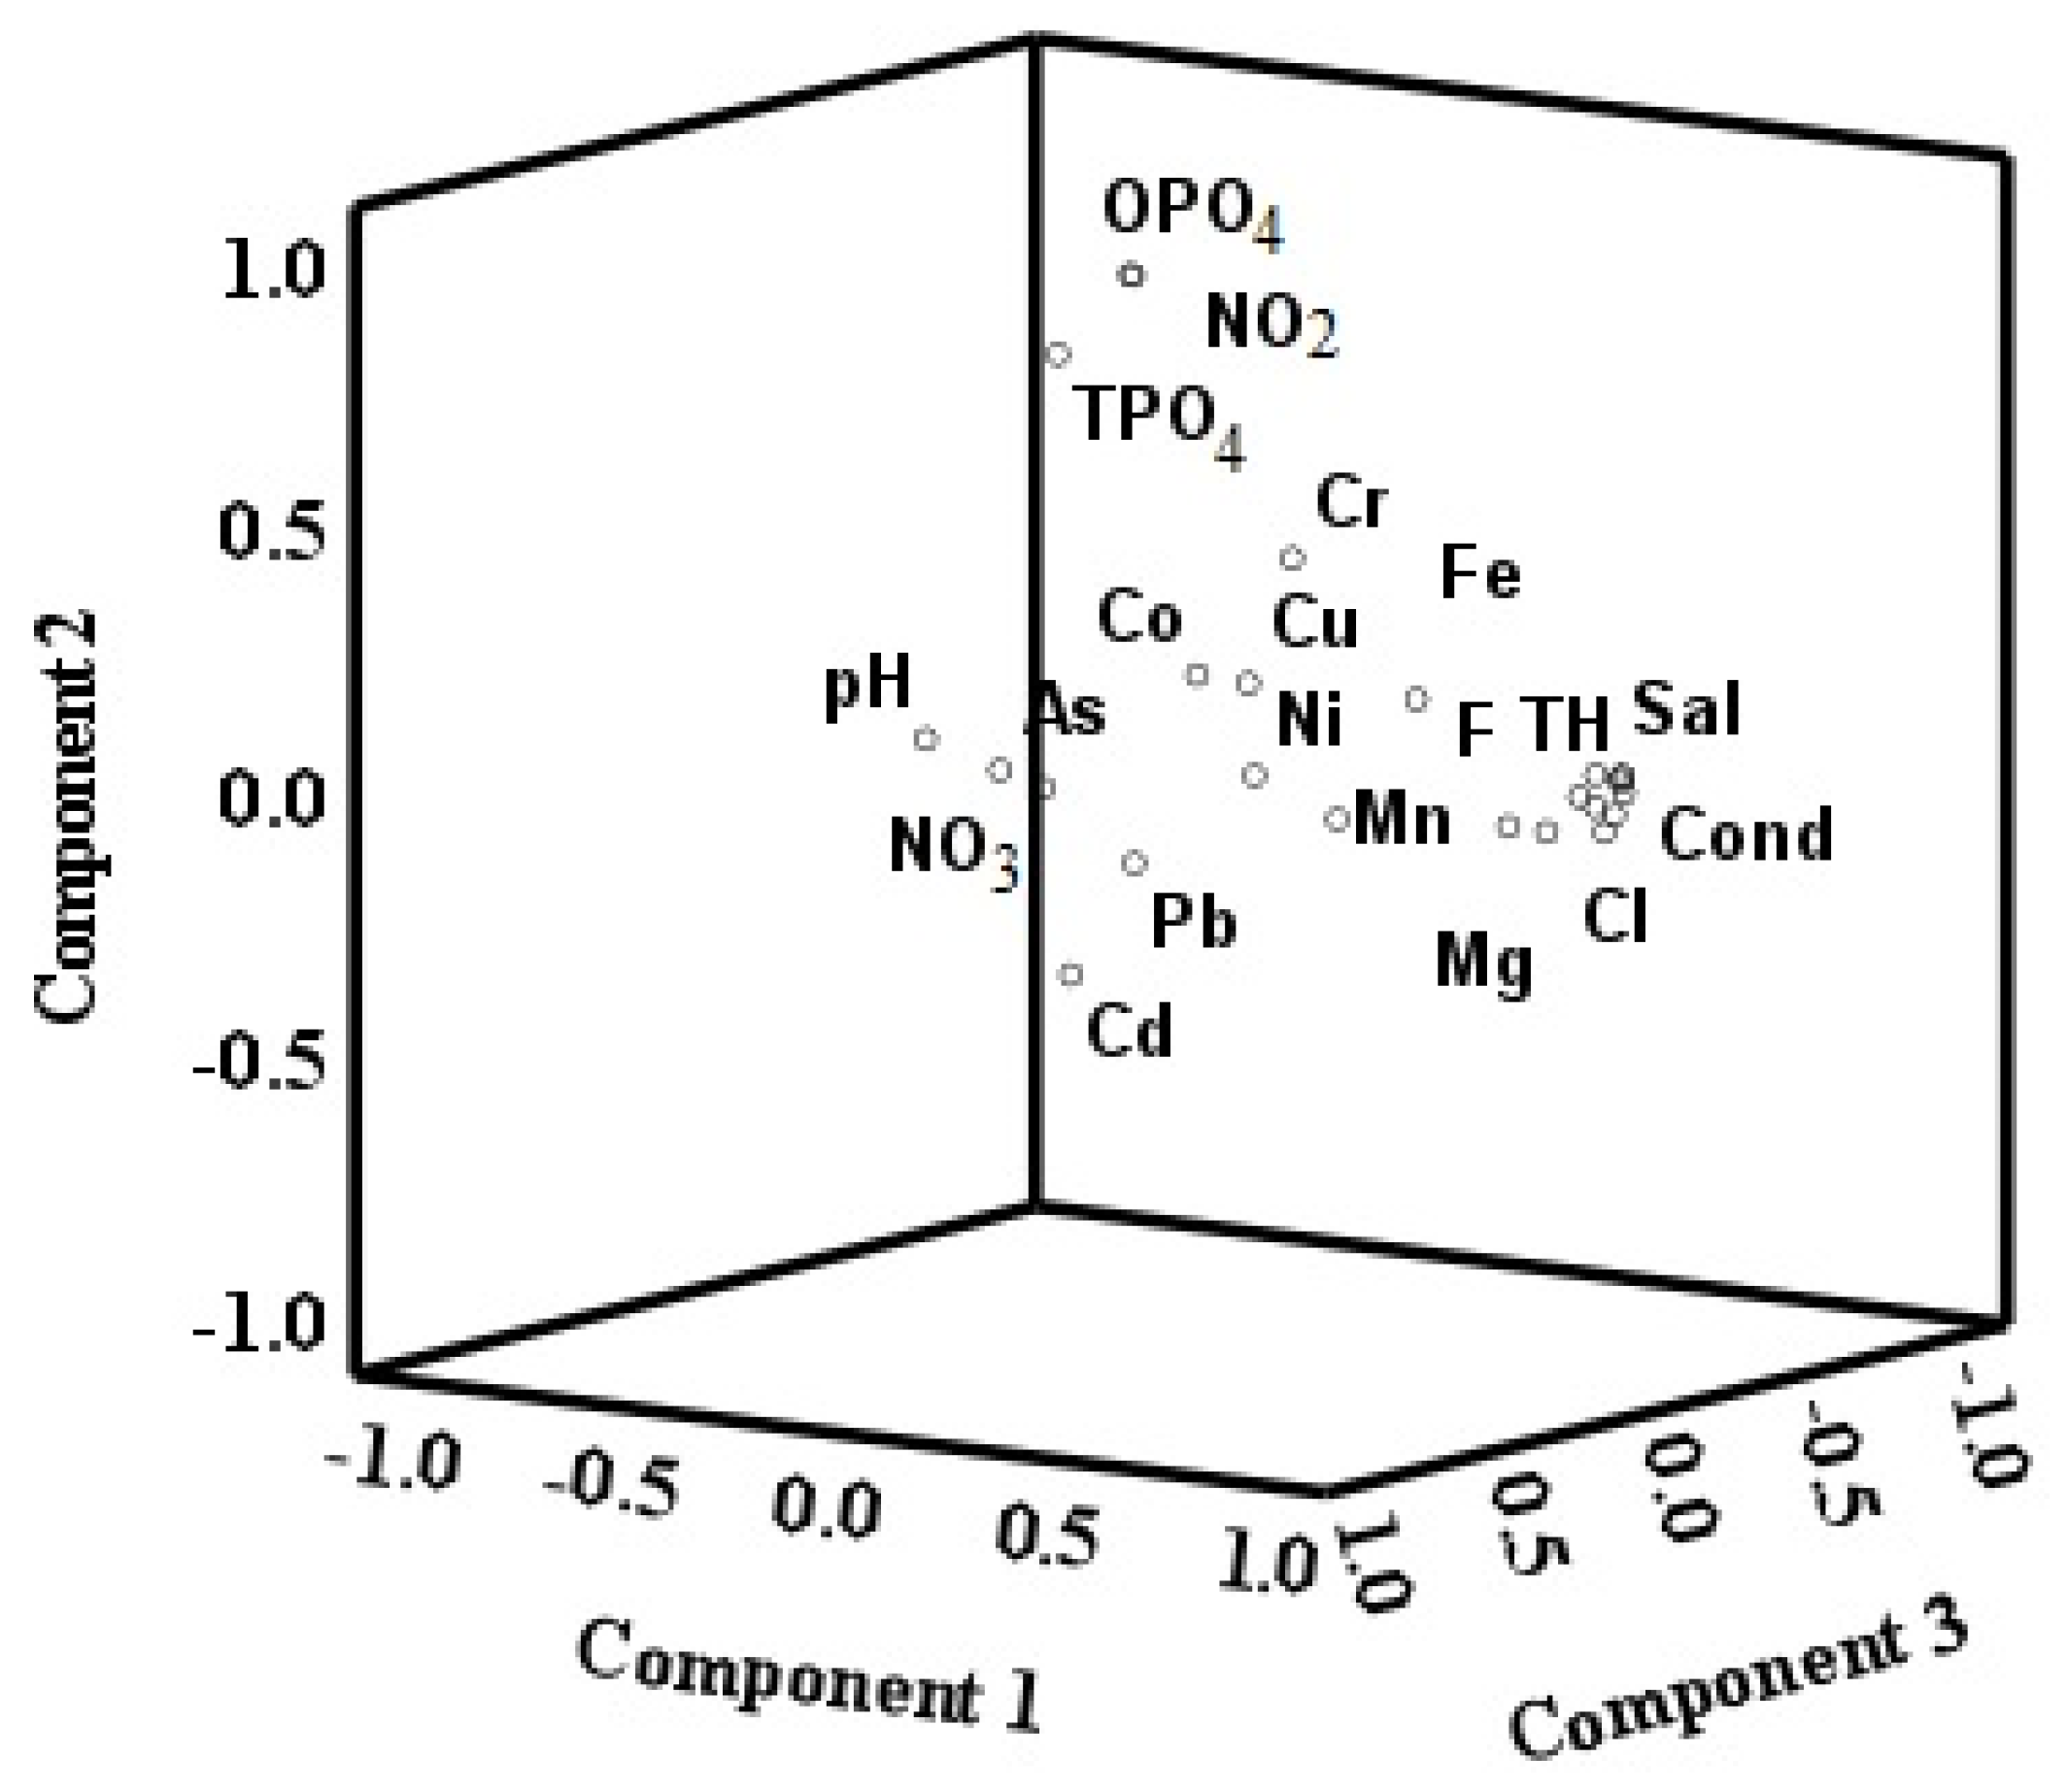
3.12. Principal Component Analysis (PCA)
3.13. Correlation Coefficient
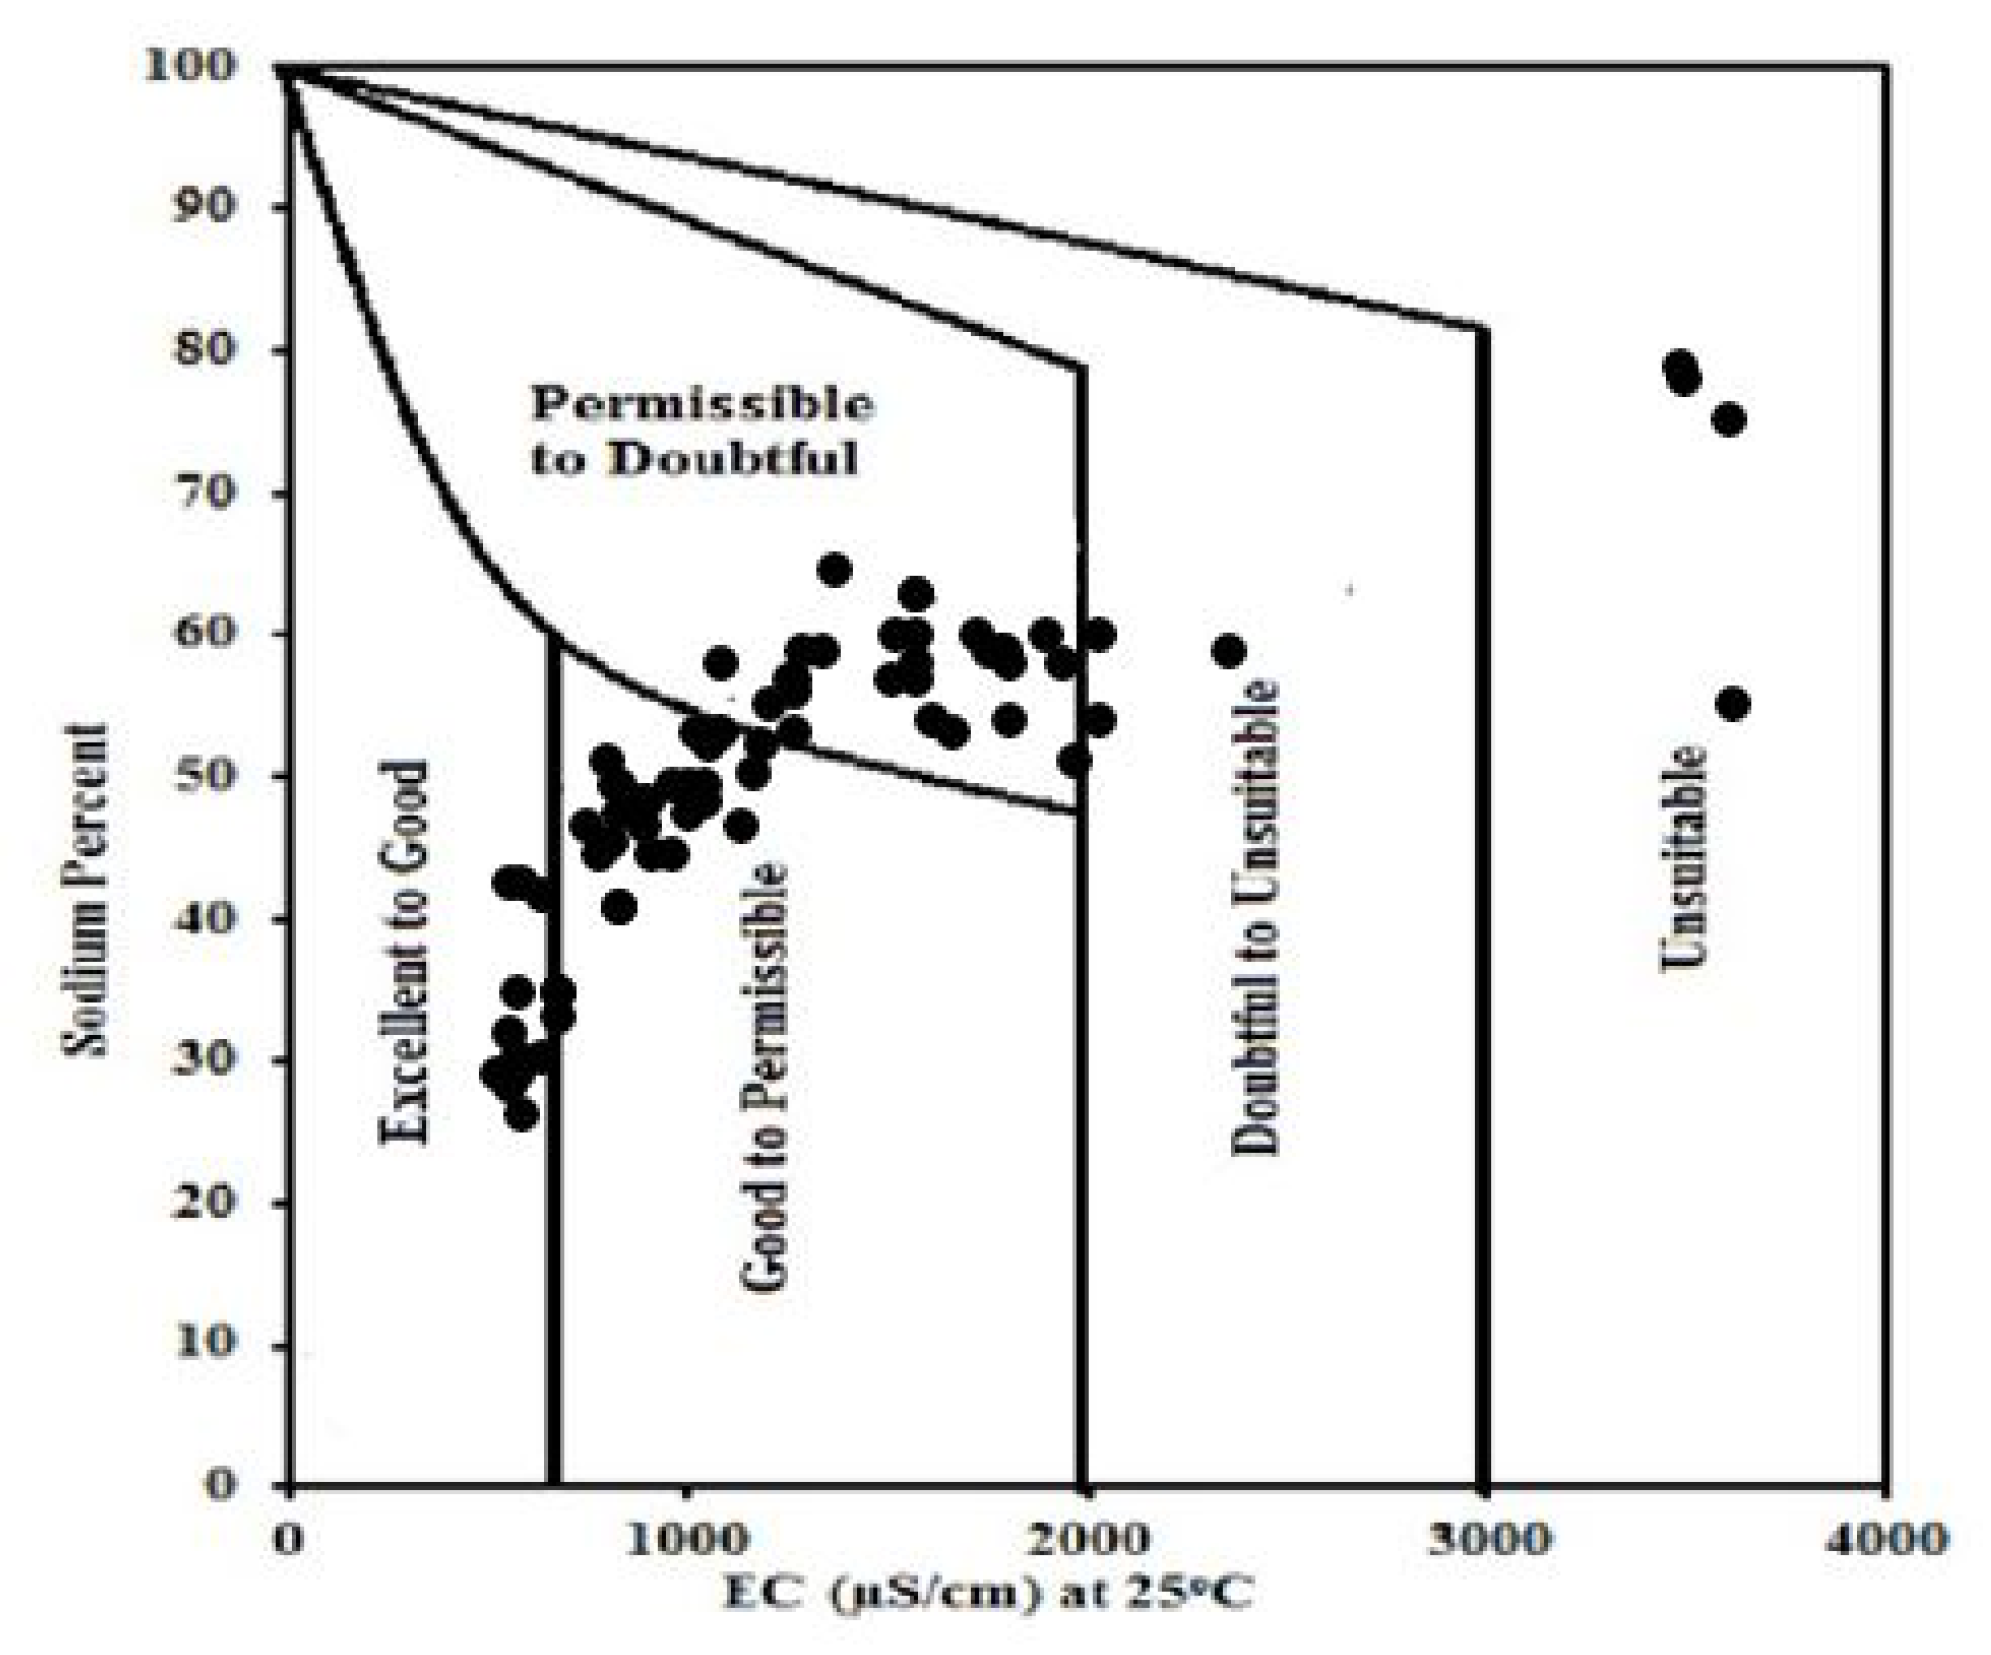
3.14. Wilcox Diagrams for Quality of Groundwater
4. Conclusions
- (1)
- Awareness programs may be initiated to inform the inhabitants about the locations of the contaminated groundwater and their possible health effects.
- (2)
- Alternate sources of drinking water may be used for drinking, particularly surface water from the river Indus.
- (3)
- If a dependable source of drinking water is not available, then the groundwater may be joined to suitable filters to reduce the concentrations of contaminants.
Supplementary Materials
Author Contributions
Funding
Data Availability Statement
Acknowledgments
Conflicts of Interest
References
- Brohi, R.O.Z.; Khuhawar, M.Y.; Mahar, R.B.; Ibrahim, M.A. Novel bimetallic nano particles for sorption of mercury (II) from drinking water: Adsorption experiment and computational studies. J. Water Process Eng. 2021, 39, 101727. [Google Scholar] [CrossRef]
- Singh, A.; Sharma, A.; Verma, R.K.; Chopade, R.L.; Pandit, P.P.; Nagar, V.; Aseri, V.; Choudhary, S.K.; Awasthi, G.; Awasthi, K.K.; et al. Heavy Metal Contamination of Water and Their Toxic Effect on Living Organisms. In The Toxicity of Environmental Pollutants; IntechOpen: Rijeka, Croatia, 2022. [Google Scholar]
- Daud, M.K.; Nafees, M.; Ali, S.; Rizwan, M.; Bajwa, R.A.; Shakoor, M.B.; Arshad, M.U.; Chatha, S.A.S.; Deeba, F.; Murad, W.; et al. Drinking water quality status and contamination in Pakistan. BioMed Res. Int. 2017, 2017, 7908183. [Google Scholar] [CrossRef] [PubMed]
- Shahab, A.; Shihua, Q.; Rashid, A.; Hasan, F.U.; Sohail, M.T. Evaluation of water quality for drinking and agricultural suitability in the lower Indus plain in Sindh province, Pakistan. Pol. J. Environ. Stud. 2016, 25, 2563–2574. [Google Scholar] [CrossRef]
- Lanjwani, M.F.; Khuhawar, M.Y.; Jahangir Khuhawar, T.M.; Lanjwani, A.H.; Jagirani, M.S.; Kori, A.H.; Rind, I.K.; Khuhawar, A.H.; Muhammad Dodo, J. Risk assessment of heavy metals and salts for human and irrigation consumption of groundwater in Qambar city: A case study. Geol. Ecol. Landsc. 2020, 4, 23–39. [Google Scholar] [CrossRef]
- Lanjwani, M.F.; Khuhawar, M.Y.; Khuhawar, T.M.J. Assessment of groundwater quality for drinking and irrigation uses in taluka Ratodero, district Larkana, Sindh, Pakistan. Int. J. Environ. Anal. Chem. 2022, 102, 4134–4157. [Google Scholar] [CrossRef]
- Ahmed, J.; Wong, L.P.; Chua, Y.P.; Channa, N. Drinking water quality mapping using water quality index and geospatial analysis in primary schools of Pakistan. Water 2020, 12, 3382. [Google Scholar] [CrossRef]
- Ahmed, J.; Wong, L.P.; Chua, Y.P.; Yasmin, A.; Channa, N.; VanDerslice, J.A. Estimation of hepatitis a virus infection prevalence through drinking water supply of primary schools of Sindh, Pakistan. Hepat. Mon. 2020, 20, e98412. [Google Scholar] [CrossRef]
- Rind, I.K.; Khuhawar, M.Y.; Lanjwani, M.F.; Khuhawar, T.M.J.; Samtio, M.S.; Soomro, W.A.; Baloch, A.R. Spatial variability of hydrochemistry and health risk assessment of groundwater of taluka Hala, district Matiari, Sindh, Pakistan. Arab. J. Geosci. 2023, 16, 99. [Google Scholar] [CrossRef]
- Podgorski, J.E.; Eqani, S.A.M.A.S.; Khanam, T.; Ullah, R.; Shen, H.; Berg, M. Extensive arsenic contamination in high-pH unconfined aquifers in the Indus Valley. Sci. Adv. 2017, 3, e1700935. [Google Scholar] [CrossRef]
- Khuhawar, M.; Ursani, H.; Khuahwar, T.; Lanjwani, M.; Mahessar, A. Assessment of water quality of groundwater of Thar Desert, Sindh. Pakistan J. Hydrogeol. Hydrol. Eng. 2019, 7, 2. [Google Scholar]
- Ullah, Z.; Talib, M.A.; Rashid, A.; Ghani, J.; Shahab, A.; Irfan, M.; Rauf, A.; Bawazeer, S.; Almarhoon, Z.M.; Mabkhot, Y.N. Hydrogeochemical investigation of elevated arsenic based on entropy modeling, in the aquifers of District Sanghar, Sindh, Pakistan. Water 2021, 13, 3477. [Google Scholar] [CrossRef]
- Bashir, E.; Huda, S.N.-U.; Naseem, S.; Hamza, S.; Kaleem, M. Geochemistry and quality parameters of dug and tube well water of Khipro, District Sanghar, Sindh, Pakistan. Appl. Water Sci. 2017, 7, 1645–1655. [Google Scholar] [CrossRef]
- Din, I.U.; Muhammad, S.; Faisal, S.; Rehman, I.U.; Ali, W. Heavy metal (loid) s contamination and potential risk assessment via groundwater consumption in the district of Hangu, Pakistan. Environ. Sci. Pollut. Res. 2023, 30, 33808–33818. [Google Scholar] [CrossRef]
- Selmane, T.; Dougha, M.; Djerbouai, S.; Djemiat, D.; Lemouari, N. Groundwater quality evaluation based on water quality indices (WQI) using GIS: Maadher plain of Hodna, Northern Algeria. Environ. Sci. Pollut. Res. 2023, 30, 30087–30106. [Google Scholar] [CrossRef]
- Kaur, T.; Bhardwaj, R.; Arora, S. Assessment of groundwater quality for drinking and irrigation purposes using hydrochemical studies in Malwa region, southwestern part of Punjab, India. Appl. Water Sci. 2017, 7, 3301–3316. [Google Scholar] [CrossRef]
- Adimalla, N.; Dhakate, R.; Kasarla, A.; Taloor, A.K. Appraisal of groundwater quality for drinking and irrigation purposes in Central Telangana, India. Groundw. Sustain. Dev. 2020, 10, 100334. [Google Scholar] [CrossRef]
- Li, P.; Wu, J.; Qian, H. Assessment of groundwater quality for irrigation purposes and identification of hydrogeochemical evolution mechanisms in Pengyang County, China. Environ. Earth Sci. 2013, 69, 2211–2225. [Google Scholar] [CrossRef]
- Soleimani, H.; Nasri, O.; Ojaghi, B.; Pasalari, H.; Hosseini, M.; Hashemzadeh, B.; Kavosi, A.; Masoumi, S.; Radfard, M.; Adibzadeh, A.; et al. Data on drinking water quality using water quality index (WQI) and assessment of groundwater quality for irrigation purposes in Qorveh & Dehgolan, Kurdistan, Iran. Data Brief 2018, 20, 375–386. [Google Scholar] [PubMed]
- P.B.O. Statistics. Available online: https://www.pbs.gov.pk/sites/default/files/tables/district_at_glance/Sanghar.pdf (accessed on 5 December 2023).
- Kadri, I.B. Petroleum Geology of Pakistan; Pakistan Petroleum Limited: Karachi, Pakistan, 1995. [Google Scholar]
- Baig, M.O.; Harris, N.; Ahmed, H.; Baig, M. Controls on reservoir diagenesis in the Lower Goru sandstone formation, Lower Indus Basin, Pakistan. J. Petrol. Geol. 2016, 39, 29–47. [Google Scholar] [CrossRef]
- Ashraf, U.; Zhang, H.; Anees, A.; Mangi, H.N.; Ali, M.; Zhang, X.; Imraz, M.; Abbasi, S.S.; Abbas, A.; Ullah, Z.; et al. A core logging, machine learning and geostatistical modeling interactive approach for subsurface imaging of lenticular geobodies in a clastic depositional system, SE Pakistan. Nat. Resour. Res. 2021, 30, 2807–2830. [Google Scholar] [CrossRef]
- Ashraf, U.; Zhu, P.; Yasin, Q.; Anees, A.; Imraz, M.; Mangi, H.N.; Shakeel, S. Classification of reservoir facies using well log and 3D seismic attributes for prospect evaluation and field development: A case study of Sawan gas field, Pakistan. J. Pet. Sci. Eng. 2019, 175, 338–351. [Google Scholar] [CrossRef]
- Li, M.; Ma, H.; Pan, H.; Ashraf, U.; Jiang, R. Building a rock physics model for the formation evaluation of the Lower Goru sand reservoir of the Southern Indus Basin in Pakistan. J. Petrol. Sci. Eng. 2020, 194, 107461. [Google Scholar]
- Ashraf, U.; Zhang, H.; Anees, A.; Ali, M.; Zhang, X.; Shakeel Abbasi, S.; Nasir Mangi, H. Controls on reservoir heterogeneity of a shallow-marine reservoir in Sawan Gas Field, SE Pakistan: Implications for reservoir quality prediction using acoustic impedance inversion. Water 2020, 12, 2972. [Google Scholar] [CrossRef]
- Shakir, U.; Hussain, M.; Mahmood, M.F.; Amjad, M.R.; Mehood, W.A.Z.S.; Abideen, Z.U.; Tahir, A.R.; Barron, M. Prespect generation studies of Cretaceous sands, Kipro area by integrating seismic and well data. Nucleous 2020, 57, 67–75. [Google Scholar]
- Shahab, A.; Qi, S.; Zaheer, M. Arsenic contamination, subsequent water toxicity, and associated public health risks in the lower Indus plain, Sindh province, Pakistan. Environ. Sci. Pollut. Res. 2019, 26, 30642–30662. [Google Scholar] [CrossRef] [PubMed]
- Jacobs, H.L.; Gabrielson, I.N.; Horton, R.K.; Lyon, W.A.; Habbard, E.C.; McCallum, G.E. Water quality criteria-stream vs. effluents standards. J. Water Pollut. Control. Fed. 1965, 37, 292–315. [Google Scholar]
- American Public Health Association (APHA); WEF (Water Environment Federation). Standard Methods for the Examination of Water and Wastewater, 22nd ed.; American Public Health Association: Washington, DC, USA; American Water Works Association: Denver, CO, USA; Water Environment Federation: Washington, DC, USA, 2012; ISBN 978-087553-013-0. [Google Scholar]
- Greenberg, A.E.; Clesceri, L.S.; Eaton, A.D. Standard Methods for the Examination of Water and Wastewater. Available online: https://www.standardmethods.org/doi/book/10.2105/SMWW.2882 (accessed on 5 December 2023).
- Baired, R.; Eaton, A.D.; Rice, E.W.; Bridgewater, L.; American Public Health Association (APHA); American Water Works Association, Water Environment Federation. Standard Methods for the Examination of Water and Wastewater; American Public Health Association: Washington, DC, USA, 2017. [Google Scholar]
- Masood, A.; Aslam, M.; Pham, Q.B.; Khan, W.; Masood, S. Integrating water quality index, GIS and multivariate statistical techniques towards a better understanding of drinking water quality. Environ. Sci. Pollut. Res. 2022, 29, 26860–26876. [Google Scholar] [CrossRef] [PubMed]
- US EPA. Risk Assessment for Carcinogenic Effects. Available online: https://www.epa.gov/fera/risk-assessment-carcinogenic-effects (accessed on 5 December 2023).
- Backman, B.; Bodiš, D.; Lahermo, P.; Rapant, S.; Tarvainen, T. Applications of a groundwater contamination index in Finland and Slovakia. Environ. Geol. 1998, 36, 55–64. [Google Scholar] [CrossRef]
- Zabin, S.A.; Foaad, M.; Al-Ghamdi, A.Y. Non-carcinogenic risk assessment of heavy metals and fluoride in some water wells in the Al-Baha Region, Saudi Arabia. Hum. Ecol. Risk Assess. 2008, 14, 1306–1317. [Google Scholar] [CrossRef]
- Muhammad, S.; Usman, Q.A. Heavy metal contamination in water of Indus River and its tributaries, Northern Pakistan: Evaluation for potential risk and source apportionment. Toxin Rev. 2022, 41, 380–388. [Google Scholar] [CrossRef]
- Moldovan, Z. Spectrophotometric determination of nitrite by its catalytic effect on the oxidation of Congo red with bromate. Bull. Chem. Soc. Ethiop. 2012, 26, 159–169. [Google Scholar] [CrossRef]
- WHO. Guidelines for Drinking-Water Quality: First Addendum to the Fourth Edition; WHO: Geneva, Switzerland, 2017. [Google Scholar]
- Abadin, H.; Llanos, F.; Stevens, Y.W. Toxicological Profile for Lead; US Department of Health and Human Services, Agency for Toxic Substances and Diseases Registry: Atlanta, GA, USA, 2007.
- Ketata, M.; Gueddari, M.; Bouhlila, R. Use of geographical information system and water quality index to assess groundwater quality in El Khairat deep aquifer (Enfidha, Central East Tunisia). Arab. J. Geosci. 2012, 5, 1379–1390. [Google Scholar] [CrossRef]
- Gibbs, R.J. Mechanisms controlling world water chemistry. Science 1970, 170, 1088–1090. [Google Scholar] [CrossRef] [PubMed]
- Khan, S.; Cao, Q.; Zheng, Y.; Huang, Y.; Zhu, Y. Health risks of heavy metals in contaminated soils and food crops irrigated with wastewater in Beijing, China. Environ. Pollut. 2008, 152, 686–692. [Google Scholar] [CrossRef]
- Mgbenu, C.N.; Egbueri, J.C. The hydrogeochemical signatures, quality indices and health risk assessment of water resources in Umunya district, southeast Nigeria. Appl. Water Sci. 2019, 9, 22. [Google Scholar] [CrossRef]
- Datta, P.; Deb, D.; Tyagi, S. Stable isotope (18O) investigations on the processes controlling fluoride contamination of groundwater. J. Contam. Hydrol. 1996, 24, 85–96. [Google Scholar] [CrossRef]
- Egbueri, J.C.; Mgbenu, C.N.; Chukwu, C.N. Investigating the hydrogeochemical processes and quality of water resources in Ojoto and environs using integrated classical methods. Model. Earth Syst. Environ. 2019, 5, 1443–1461. [Google Scholar] [CrossRef]
- Jankowski, J.; Acworth, R.I. Impact of debris-flow deposits on hydrogeochemical processes and the developement of dryland salinity in the Yass River Catchment, New South Wales, Australia. Hydrogeol. J. 1997, 5, 71–88. [Google Scholar] [CrossRef]
- Piper, A.M. A graphic procedure in the geochemical interpretation of water-analyses. Eos Trans. Am. Geophys. Union 1944, 25, 914–928. [Google Scholar]


| Parameters | Minimum | Maximum | Mean | Std. Deviation | Std. Error |
|---|---|---|---|---|---|
| pH | 6.74 | 8.65 | 7.7284 | 0.34037 | 0.03957 |
| Conductivity µs/cm | 346 | 5730 | 1675 | 1231 | 143 |
| Salinity g/L | 0.2 | 3.1 | 0.858 | 0.6697 | 0.0779 |
| TDS mg/L | 221 | 3667 | 1072 | 787 | 91 |
| NO2 µg/L | 0.09 | 400 | 42 | 95 | 11 |
| NO3 mg/L | 0.65 | 6.39 | 2.8199 | 1.26219 | 0.14673 |
| T.PO4 mg/L | 0.26 | 7.76 | 1.4619 | 1.40125 | 0.16289 |
| O.PO4 mg/L | 0.14 | 3.07 | 0.7942 | 0.75109 | 0.08731 |
| T.H mg/L | 1 | 800 | 244 | 170 | 19 |
| Na mg/L | 20 | 1349 | 185 | 254 | 29 |
| K mg/L | 5 | 103 | 20 | 21 | 2.5 |
| Ca mg/L | 44 | 272 | 98 | 45 | 5 |
| Mg mg/L | 10 | 149 | 36.39 | 27 | 3.212 |
| Chloride mg/L | 28 | 1230 | 211 | 227 | 26 |
| Alkalinity mg/L | 104 | 820 | 265 | 127 | 14 |
| SO4 mg/L | 27 | 1319 | 216 | 256 | 29 |
| Mn µg/L | 3 | 282 | 36 | 40 | 4 |
| As µg/L | 0 | 10 | 4 | 7.8 | 0.9 |
| Fe µg/L | 1.2 | 256 | 27 | 41 | 4 |
| Co µg/L | 9.8 | 48 | 26 | 9 | 1 |
| Cu µg/L | 0 | 113 | 24 | 38 | 4 |
| Ni µg/L | 0 | 155 | 45 | 38 | 4 |
| Pb µg/L | 0 | 66 | 14 | 15 | 2 |
| Cd µg/L | 0 | 107 | 19 | 27 | 3 |
| F mg/L | 0.1 | 26 | 4 | 5.4 | 0.6 |
| Cr µg/L | 0 | 96 | 29 | 31 | 3.6 |
| KI meq/L | 0.2 | 76 | 24 | 22 | 2.6 |
| SAR meq/L | 0.4 | 4.9 | 1.3 | 0.84 | 0.0984 |
| PI meq/L | 67 | 112 | 94 | 8.6 | 1.0068 |
| Na% meq/L | 27 | 82 | 52 | 11.5 | 1.3386 |
| Sanghar Sub District | Khipro Sub District | Jam Nawaz Ali Sub District | ||||||
|---|---|---|---|---|---|---|---|---|
| Sample ID | WQI | State | Sample ID | WQI | State | Sample ID | WQI | State |
| S1 | 75 | Poor | K1 | 49 | Good | J1 | 43 | Good |
| S2 | 48 | Good | K2 | 42 | Good | J2 | 112 | Unfit |
| S3 | 212 | Unfit | K3 | 65 | Poor | J3 | 74 | Poor |
| S4 | 46 | Good | K4 | 49 | Good | J4 | 83 | Very Poor |
| S5 | 22 | Excellent | K5 | 105 | Unfit | J5 | 108 | Unfit |
| S6 | 128 | Unfit | K6 | 374 | Unfit | J6 | 35 | Good |
| S7 | 99 | Very Poor | K7 | 345 | Unfit | J7 | 19 | Excellent |
| S8 | 91 | Very Poor | K8 | 323 | Unfit | J8 | 81 | Very Poor |
| S9 | 119 | Unfit | K9 | 96 | Very Poor | J9 | 42 | Good |
| S10 | 65 | Poor | K10 | 65 | Poor | J10 | 64 | Poor |
| S11 | 37 | Good | K11 | 96 | Very Poor | J11 | 30 | Good |
| S12 | 29 | Good | K12 | 67 | Poor | J12 | 34 | Good |
| S13 | 117 | Unfit | K13 | 51 | Poor | |||
| S14 | 167 | Unfit | K14 | 70 | Poor | |||
| S15 | 43 | Good | K15 | 98 | Very Poor | |||
| S16 | 55 | Poor | K16 | 30 | Good | |||
| S17 | 73 | Poor | K17 | 64 | Poor | |||
| S18 | 38 | Good | K18 | 135 | Unfit | |||
| S19 | 69 | Poor | K19 | 28 | Good | |||
| S20 | 73 | Poor | K20 | 53 | Poor | |||
| S21 | 57 | Poor | K21 | 57 | Poor | |||
| S22 | 28 | Good | K22 | 34 | Good | |||
| S23 | 81 | Very Poor | K23 | 43 | Good | |||
| S24 | 80 | Very Poor | K24 | 134 | Unfit | |||
| S25 | 107 | Unfit | K25 | 64 | Poor | |||
| S26 | 37 | Good | K26 | 44 | Good | |||
| S27 | 39 | Good | K27 | 50 | Good | |||
| S28 | 33 | Good | K28 | 52 | Poor | |||
| S29 | 73 | Poor | K29 | 247 | Unfit | |||
| S30 | 51 | Poor | K30 | 128 | Unfit | |||
| S31 | 42 | Poor | ||||||
| S32 | 102 | Unfit | ||||||
| Sanghar Sub District | Khipro Sub District | Jam Nawaz Ali Sub District | |||
|---|---|---|---|---|---|
| Sample ID | Contamination Index | Sample ID | Contamination Index | Sample ID | Contamination Index |
| S1 | −1 | K1 | −8 | J1 | −5 |
| S2 | −7 | K2 | −10 | J2 | −0.7 |
| S3 | 19 | K3 | −7 | J3 | −2 |
| S4 | −7 | K4 | −9 | J4 | −1 |
| S5 | −9 | K5 | −2 | J5 | 0.7 |
| S6 | 8.5 | K6 | 42 | J6 | −7.3 |
| S7 | −1 | K7 | 38 | J7 | −9.2 |
| S8 | 0.2 | K8 | 37 | J8 | 0.2 |
| S9 | 2 | K9 | −0.101 | J9 | −7 |
| S10 | −2 | K10 | −0.5 | J10 | −3 |
| S11 | −7 | K11 | −2 | J11 | −8 |
| S12 | 2 | K12 | −7 | J12 | −9 |
| S13 | 0.85 | K13 | −8 | ||
| S14 | 11 | K14 | −4 | ||
| S15 | −7 | K15 | −2 | ||
| S16 | −5 | K16 | −13 | ||
| S17 | −0.2 | K17 | −5 | ||
| S18 | −10 | K18 | 1 | ||
| S19 | −3 | K19 | −10 | ||
| S20 | −2 | K20 | −8 | ||
| S21 | −8 | K21 | −8 | ||
| S22 | −11 | K22 | −6 | ||
| S23 | 3 | K23 | −8 | ||
| S24 | −1 | K24 | 2 | ||
| S25 | 2 | K25 | −3 | ||
| S26 | −3 | K26 | −10 | ||
| S27 | −8 | K27 | −8 | ||
| S28 | −9 | K28 | −8 | ||
| S29 | −0.4 | K29 | 16 | ||
| S30 | −5 | K30 | 1 | ||
| S31 | −9 | ||||
| S32 | 2 | ||||
| Samples No. | Fe | Cu | Cd | Cr | Mn | Ni | Pb | As |
|---|---|---|---|---|---|---|---|---|
| S1 | 5.80 × 10⁻⁴ | 1 × 10⁻³ | 1 × 10⁻⁴ | 1 × 10⁻³ | 1.3 × 10⁻³ | 4. × 10−4 | 2.14 × 10⁻¹ | 1 × 10⁻⁴ |
| S2 | 5.30 × 10⁻⁴ | 1 × 10⁻⁴ | 0 | 1.9 × 10⁻³ | 1.9 × 10⁻³ | 3 × 10⁻⁴ | 0 | 0 |
| S3 | 3.22 × 10⁻³ | 0 | 7 × 10⁻⁴ | 0 | 2.2 × 10⁻³ | 2.7 × 10⁻³ | 1.92 × 10⁻¹ | 0 |
| S4 | 7.12 × 10⁻³ | 5 × 10⁻⁴ | 0 | 1.1 × 10⁻³ | 6 × 10⁻⁴ | 1 × 10⁻³ | 2.44 × 10⁻¹ | 0 |
| S5 | 1.74 × 10⁻³ | 2.50 × 10⁻³ | 0 | 1.3 × 10⁻³ | 1.3 × 10⁻³ | 0 | 1.97 × 10⁻¹ | 7 × 10⁻⁴ |
| S6 | 3.70 × 10⁻⁴ | 1 × 10⁻⁴ | 7 × 10⁻⁴ | 1.5 × 10⁻³ | 1.4 × 10⁻³ | 2.1 × 10⁻³ | 12.2 × 101 | 0 |
| S7 | 8.0 × 10⁻⁴ | 2 × 10⁻⁴ | 3 × 10⁻⁴ | 0 | 4 × 10⁻⁴ | 2.4 × 10⁻³ | 3 × 10⁻¹ | 0 |
| S8 | 1.57 × 10⁻³ | 2.5 × 10⁻³ | 2 × 10⁻⁴ | 1.8 × 10⁻³ | 1.9 × 10⁻³ | 1.5 × 10⁻³ | 2.47 × 10⁻¹ | 0 |
| S9 | 2.51 × 10⁻³ | 0 | 0 | 1.5 × 10⁻³ | 2.2 × 10⁻³ | 3.1 × 10⁻³ | 0 | 0 |
| S10 | 0 | 2 × 10⁻⁴ | 0 | 1.1 × 10⁻³ | 6 × 10⁻⁴ | 2.6 × 10⁻³ | 9.64 × 10⁻¹ | 1 × 10⁻⁴ |
| S11 | 0 | 0 | 0 | 2 × 10⁻³ | 1.3 × 10⁻³ | 4 × 10⁻⁴ | 3.44 × 10⁻¹ | 3 × 10⁻⁴ |
| S12 | 9.20 × 10⁻⁴ | 1 × 10⁻⁴ | 0 | 2.7 × 10⁻³ | 1.4 × 10⁻³ | 5 × 10⁻⁴ | 2.03 × 10⁻¹ | 1 × 10⁻⁴ |
| S13 | 1.41 × 10⁻³ | 1 × 10⁻⁴ | 3 × 10⁻⁴ | 0 | 4 × 10⁻⁴ | 1.5 × 10⁻³ | 1.78 × 10⁻¹ | 0 |
| S14 | 3.50 × 10⁻⁴ | 1 × 10⁻⁴ | 5 × 10⁻⁴ | 1.2 × 10⁻³ | 3 × 10⁻⁴ | 2.6 × 10⁻³ | 9.58 × 10⁻¹ | 0 |
| S15 | 7.30 × 10⁻⁴ | 2 × 10⁻⁴ | 0 | 1.3 × 10⁻³ | 5 × 10⁻⁴ | 3 × 10⁻⁴ | 2.17 × 10⁻¹ | 1 × 10⁻⁴ |
| S16 | 2.70 × 10⁻⁴ | 3.1 × 10⁻³ | 0 | 9 × 10⁻⁴ | 2 × 10⁻⁴ | 1.5 × 10⁻³ | 2.33 × 10⁻¹ | 1 × 10⁻⁴ |
| S17 | 1.20 × 10⁻⁴ | 2.7 × 10⁻³ | 3 × 10⁻⁴ | 1.4 × 10⁻³ | 7 × 10⁻⁴ | 1.3 × 10⁻³ | 8.19 × 10⁻¹ | 1 × 10⁻⁴ |
| S18 | 8.70 × 10⁻⁴ | 1 × 10⁻⁴ | 0 | 0 | 8 × 10⁻⁴ | 0 | 1.19 × 10⁻¹ | 0 |
| S19 | 3.30 × 10⁻⁴ | 1 × 10⁻⁴ | 0 | 0 | 2.9 × 10⁻³ | 4.3 × 10⁻³ | 7.75 × 10⁻¹ | 7 × 10⁻⁴ |
| S20 | 5.60 × 10⁻⁴ | 2 × 10⁻⁴ | 1 × 10⁻⁴ | 1.9 × 10⁻³ | 1.8 × 10⁻³ | 4 × 10⁻⁴ | 2.06 × 10⁻¹ | 3 × 10⁻⁴ |
| S21 | 2.40 × 10⁻⁴ | 1 × 10⁻⁴ | 1 × 10⁻⁴ | 0 | 1.3 × 10⁻³ | 4 × 10⁻⁴ | 1.64 × 10⁻¹ | 0 |
| S22 | 2.70 × 10⁻⁴ | 2 × 10⁻⁴ | 3 × 10⁻⁵ | 1.2 × 10⁻³ | 2.1 × 10⁻³ | 1 × 10⁻³ | 2.14 × 10⁻¹ | 1 × 10⁻⁴ |
| S23 | 5.60 × 10⁻⁴ | 0 | 3 × 10⁻⁴ | 1 × 10⁻³ | 1 × 10⁻³ | 4 × 10⁻⁴ | 17.6 × 101 | 0 |
| S24 | 3.70 × 10⁻⁴ | 1.6 × 10⁻³ | 2 × 10⁻⁴ | 2.3 × 10⁻³ | 6 × 10⁻⁴ | 3 × 10⁻⁴ | 1.58 × 10⁻¹ | 0 |
| S25 | 4.25 × 10⁻³ | 2.8 × 10⁻³ | 2 × 10⁻⁴ | 1.8 × 10⁻³ | 3 × 10⁻⁴ | 1.6 × 10⁻³ | 0 | 1 × 10⁻⁴ |
| S26 | 2.50 × 10⁻⁴ | 1. × 10−4 | 0 | 2 × 10⁻³ | 1.8 × 10⁻³ | 1.7 × 10⁻³ | 12.3 × 101 | 7 × 10⁻⁴ |
| S27 | 1.20 × 10⁻⁴ | 0 | 0 | 1.6 × 10⁻³ | 4 × 10⁻⁴ | 7 × 10⁻⁴ | 2.17 × 10⁻¹ | 0 |
| S28 | 3.40 × 10⁻⁴ | 3 × 10⁻³ | 0 | 1.3 × 10⁻³ | 3 × 10⁻⁴ | 4 × 10⁻⁴ | 2.42 × 10⁻¹ | 0 |
| S29 | 1.90 × 10⁻⁴ | 1 × 10⁻⁴ | 2 × 10⁻⁴ | 2.4 × 10⁻³ | 6 × 10⁻⁴ | 3 × 10⁻⁴ | 4.28 × 10⁻¹ | 1 × 10⁻⁴ |
| S30 | 1.60 × 10⁻⁴ | 0 | 0 | 1.4 × 10⁻³ | 3 × 10⁻⁴ | 8 × 10⁻⁴ | 2.42 × 10⁻¹ | 3 × 10⁻⁴ |
| S31 | 2.88 × 10⁻³ | 2.9 × 10⁻³ | 0 | 1.2 × 10⁻³ | 1.8 × 10⁻³ | 1.8 × 10⁻³ | 0 | 0 |
| S32 | 5.80 × 10⁻⁴ | 2 × 10⁻⁴ | 3 × 10⁻⁴ | 1.8 × 10⁻³ | 2.2 × 10⁻³ | 1 × 10⁻³ | 2.42 × 10⁻¹ | 1 × 10⁻⁴ |
| K1 | 6.67 × 10⁻⁵ | 0 | 0 | 0 | 5 × 10⁻⁴ | 5 × 10⁻⁴ | 2.03 × 10⁻¹ | 1 × 10⁻⁴ |
| K2 | 1.80 × 10⁻⁴ | 1 × 10⁻⁴ | 2.50 × 10⁻³ | 0 | 4 × 10⁻⁴ | 9 × 10⁻⁴ | 2.44 × 10⁻¹ | 0 |
| K3 | 3.30 × 10⁻⁴ | 2 × 10⁻⁴ | 0 | 0 | 3 × 10⁻⁴ | 2.5 × 10⁻³ | 8.61 × 10⁻² | 0 |
| K4 | 3.60 × 10⁻⁴ | 2 × 10⁻⁴ | 4. × 10−4 | 0 | 7.8 × 10⁻³ | 9 × 10⁻⁴ | 2.28 × 10⁻¹ | 0 |
| K5 | 1.10 × 10⁻⁴ | 3 × 10⁻⁴ | 1.5 × 10⁻³ | 1 × 10⁻⁴ | 2.1 × 10⁻³ | 2.5 × 10⁻³ | 0 | 0 |
| K6 | 3.33 × 10⁻⁵ | 2 × 10⁻⁴ | 3 × 10⁻⁴ | 5 × 10⁻⁴ | 8 × 10⁻⁴ | 2.6 × 10⁻³ | 10.8 × 101 | 0 |
| K7 | 1.06 × 10⁻³ | 2.0 × 10⁻⁴ | 1.3 × 10⁻³ | 5 × 10⁻⁴ | 2.4 × 10⁻³ | 9 × 10⁻⁴ | 2.19 × 10⁻¹ | 0 |
| K8 | 5.10 × 10⁻⁴ | 2.0 × 10⁻⁴ | 7 × 10⁻⁴ | 4 × 10⁻⁴ | 0 | 2.6 × 10⁻³ | 9.33 × 10⁻¹ | 0 |
| K9 | 1.60 × 10⁻⁴ | 2.2 × 10⁻³ | 2.8 × 10⁻³ | 0 | 4 × 10⁻⁴ | 2.1 × 10⁻³ | 9.22 × 10⁻¹ | 0 |
| K10 | 5.0 × 10⁻⁴ | 1 × 10⁻⁴ | 2.2 × 10⁻³ | 0 | 9 × 10⁻⁴ | 4 × 10⁻⁴ | 18.4 × 101 | 0 |
| K11 | 3.40 × 10⁻⁴ | 0 | 0 | 0 | 2 × 10⁻⁴ | 4 × 10⁻⁴ | 1.75 × 10⁻¹ | 0 |
| K12 | 5.28 × 10⁻⁵ | 3 × 10⁻⁴ | 2.1 × 10⁻³ | 0 | 4 × 10⁻⁴ | 3.8 × 10⁻³ | 2.31 × 10⁻¹ | 0 |
| K13 | 1.30 × 10⁻³ | 3.1 × 10⁻³ | 0 | 0 | 2.4 × 10⁻³ | 1.4 × 10⁻³ | 2.47 × 10⁻¹ | 0 |
| K14 | 2.80 × 10⁻⁴ | 2 × 10⁻⁴ | 0 | 0 | 4 × 10⁻⁴ | 2.5 × 10⁻³ | 9.0 × 10⁻¹ | 0 |
| K15 | 1.80 × 10⁻⁴ | 1 × 10⁻⁴ | 2.6 × 10⁻³ | 1 × 10⁻⁴ | 1.1 × 10⁻³ | 4 × 10⁻⁴ | 2.19 × 10⁻¹ | 0 |
| K16 | 6.94 × 10⁻⁵ | 0 | 3 × 10⁻³ | 0 | 8 × 10⁻⁴ | 6 × 10⁻⁴ | 1.97 × 10⁻¹ | 0 |
| K17 | 2.80 × 10⁻⁴ | 1 × 10⁻⁴ | 9 × 10⁻⁴ | 0 | 3 × 10⁻⁴ | 4 × 10⁻³ | 2.11 × 10⁻¹ | 7 × 10⁻⁴ |
| K18 | 4.80 × 10⁻⁴ | 2 × 10⁻⁴ | 1.4 × 10⁻³ | 1 × 10⁻⁴ | 4 × 10⁻⁴ | 1 × 10⁻³ | 2.42 × 10⁻¹ | 0 |
| K19 | 5.60 × 10⁻⁴ | 2 × 10⁻⁴ | 8 × 10⁻⁴ | 0 | 2.2 × 10⁻³ | 4 × 10⁻⁴ | 2.06 × 10⁻¹ | 7 × 10⁻⁴ |
| K20 | 2.40 × 10⁻⁴ | 1 × 10⁻⁴ | 1.1 × 10⁻³ | 1 × 10⁻⁵ | 6 × 10⁻⁴ | 4 × 10⁻⁴ | 1.64 × 10⁻¹ | 0 |
| K21 | 2.70 × 10⁻⁴ | 2 × 10⁻⁴ | 3 × 10⁻⁴ | 0 | 3 × 10⁻⁴ | 1 × 10⁻³ | 2.14 × 10⁻¹ | 0 |
| K22 | 5.60 × 10⁻⁴ | 0 | 1.1 × 10⁻³ | 0 | 2 × 10⁻⁴ | 4 × 10⁻⁴ | 17.6 × 101 | 1 × 10⁻⁴ |
| K23 | 3.70 × 10⁻⁴ | 1.6 × 10⁻³ | 1 × 10⁻³ | 0 | 9 × 10⁻⁴ | 3 × 10⁻⁴ | 1.58 × 10⁻¹ | 7 × 10⁻⁴ |
| K24 | 4.25 × 10⁻³ | 2.8 × 10⁻³ | 1.2 × 10⁻³ | 2 × 10⁻⁴ | 1.1 × 10⁻³ | 1.6 × 10⁻³ | 0 | 0 |
| K25 | 2.50 × 10⁻⁴ | 1 × 10⁻⁴ | 3 × 10⁻⁴ | 0 | 1.3 × 10⁻³ | 1.7 × 10⁻³ | 12.3 × 101 | 1 × 10⁻⁴ |
| K26 | 1.20 × 10⁻⁴ | 0 | 6 × 10⁻⁴ | 0 | 0 | 7 × 10⁻⁴ | 2.17 × 10⁻¹ | 0 |
| K27 | 3.40 × 10⁻⁴ | 3 × 10⁻³ | 1.7 × 10⁻³ | 0 | 4 × 10⁻⁴ | 4 × 10⁻⁴ | 2.42 × 10⁻¹ | 0 |
| K28 | 1.90 × 10⁻⁴ | 1 × 10⁻⁴ | 1.1 × 10⁻³ | 0 | 8 × 10⁻⁴ | 3 × 10⁻⁴ | 4.28 × 10⁻¹ | 1 × 10⁻⁴ |
| K29 | 4.80 × 10⁻⁴ | 2 × 10⁻⁴ | 1.9 × 10⁻³ | 3 × 10⁻⁴ | 3 × 10⁻⁴ | 1 × 10⁻³ | 2.42 × 10⁻¹ | 0 |
| K30 | 5.28 × 10⁻⁵ | 0 | 0 | 2 × 10⁻⁴ | 2.9 × 10⁻³ | 4 × 10⁻⁴ | 3.42 × 10⁻¹ | 0 |
| J1 | 9.20 × 10⁻⁴ | 1 × 10⁻⁴ | 0 | 2.6 × 10⁻³ | 2.1 × 10⁻³ | 5 × 10⁻⁴ | 2.03 × 10⁻¹ | 0 |
| J2 | 1.41 × 10⁻³ | 1 × 10⁻⁴ | 2 × 10⁻⁴ | 0 | 0 | 1.5 × 10⁻³ | 1.78 × 10⁻¹ | 0 |
| J3 | 3.50 × 10⁻⁴ | 1 × 10⁻⁴ | 2 × 10⁻⁴ | 0 | 6 × 10⁻⁴ | 2.6 × 10⁻³ | 9.58 × 10⁻¹ | 0 |
| J4 | 7.30 × 10⁻⁴ | 2 × 10⁻⁴ | 2 × 10⁻⁴ | 1.7 × 10⁻³ | 2.1 × 10⁻³ | 3 × 10⁻⁴ | 2.17 × 10⁻¹ | 0 |
| J5 | 2.70 × 10⁻⁴ | 3.10 × 10⁻³ | 2 × 10⁻⁴ | 3 × 10⁻⁴ | 2 × 10⁻⁴ | 1.5 × 10⁻³ | 2.33 × 10⁻¹ | 0 |
| J6 | 1.20 × 10⁻⁴ | 2.70 × 10⁻³ | 0 | 1 × 10⁻³ | 2 × 10⁻⁴ | 1.3 × 10⁻³ | 8.19 × 10⁻¹ | 1 × 10⁻⁴ |
| J7 | 8.70 × 10⁻⁴ | 1 × 10⁻⁴ | 0 | 2.4 × 10⁻³ | 4 × 10⁻⁴ | 0 | 1.19 × 10⁻¹ | 7 × 10⁻⁴ |
| J8 | 3.30 × 10⁻⁴ | 1 × 10⁻⁴ | 0 | 2.2 × 10⁻³ | 2 × 10⁻⁴ | 4.3 × 10⁻³ | 7.75 × 10⁻¹ | 1 × 10⁻⁴ |
| J9 | 1.60 × 10⁻⁴ | 0 | 0 | 2.1 × 10⁻³ | 4 × 10⁻⁴ | 8 × 10⁻⁴ | 2.42 × 10⁻¹ | 0 |
| J10 | 2.88 × 10⁻³ | 2.9 × 10⁻³ | 0 | 2.4 × 10⁻³ | 2 × 10⁻⁴ | 1.8 × 10⁻³ | 0 | 0 |
| J11 | 5.80 × 10⁻⁴ | 2 × 10⁻⁴ | 0 | 1 × 10⁻³ | 2 × 10⁻⁴ | 1 × 10⁻³ | 2.42 × 10⁻¹ | 7 × 10⁻⁴ |
| J12 | 0 | 0 | 0 | 1.9 × 10⁻³ | 3 × 10⁻⁴ | 5 × 10⁻⁴ | 2.03 × 10⁻¹ | 0 |
| Min | 0 | 0 | 0 | 0 | 0 | 0 | 0 | 0 |
| Max | 7.12 × 10⁻³ | 3.1 × 10⁻³ | 3 × 10⁻³ | 2.7 × 10⁻³ | 7.8 × 10⁻³ | 4.3 × 10⁻³ | 18.4 × 101 | 7 × 10⁻⁴ |
| Mean | 7.70 × 10⁻⁴ | 7 × 10⁻⁴ | 5 × 10⁻⁴ | 8 × 10⁻⁴ | 1 × 10⁻³ | 1.3 × 10⁻³ | 4.07 × 10⁻¹ | 1 × 10⁻⁴ |
| Samples No. | Fe | Cd | Cr | Mn | Ni | Pb | As |
|---|---|---|---|---|---|---|---|
| S1 | 8.20 × 10⁻⁴ | 2.61 × 10⁻¹ | 7 × 10⁻⁴ | 9.30 × 10⁻³ | 1.79 × 10⁻² | 1.18 × 10² | 3.23 × 10⁻¹ |
| S2 | 7.60 × 10⁻⁴ | 1.61 × 10⁻¹ | 1.20 × 10⁻³ | 1.39 × 10⁻² | 1.51 × 10⁻² | 5.43 × 101 | 0 |
| S3 | 4.60 × 10⁻³ | 13.7 × 101 | 0 | 1.57 × 10⁻² | 1.35 × 10⁻¹ | 5.72 × 101 | 0 |
| S4 | 1.02 × 10⁻² | 1.17 × 10⁻¹ | 7 × 10⁻⁴ | 4.60 × 10⁻³ | 5.19 × 10⁻² | 5.65 × 101 | 0 |
| S5 | 2.49 × 10⁻³ | 6.11 × 10⁻² | 8 × 10⁻⁴ | 8.90 × 10⁻³ | 0 | 5.25 × 101 | 16.2 × 101 |
| S6 | 5.30 × 10⁻⁴ | 13.5 × 101 | 1 × 10⁻³ | 9.70 × 10⁻³ | 1.07 × 10⁻¹ | 0 | 0 |
| S7 | 1.15 × 10⁻³ | 6.61 × 10⁻¹ | 0 | 2.80 × 10⁻³ | 1.21 × 10⁻¹ | 0 | 0 |
| S8 | 2.24 × 10⁻³ | 4.94 × 10⁻¹ | 1.20 × 10⁻³ | 1.39 × 10⁻² | 7.65 × 10⁻² | 0 | 0 |
| S9 | 3.58 × 10⁻³ | 1.28 × 10⁻¹ | 1 × 10⁻³ | 1.57 × 10⁻² | 1.56 × 10⁻¹ | 0 | 0 |
| S10 | 0 | 1.44 × 10⁻¹ | 8 × 10⁻⁴ | 4.60 × 10⁻³ | 1.28 × 10⁻¹ | 59.4 × 101 | 3.23 × 10⁻¹ |
| S11 | 0 | 1 × 10⁻¹ | 1.30 × 10⁻³ | 8.90 × 10⁻³ | 2.13 × 10⁻² | 0 | 6.46 × 10⁻¹ |
| S12 | 1.31 × 10⁻³ | 6.67 × 10⁻² | 1.80 × 10⁻³ | 9.70 × 10⁻³ | 2.74 × 10⁻² | 53.2 × 101 | 3.23 × 10⁻¹ |
| S13 | 2.02 × 10⁻³ | 6.33 × 10⁻¹ | 0 | 2.80 × 10⁻³ | 7.74 × 10⁻² | 67.9 × 101 | 0 |
| S14 | 5 × 10⁻⁴ | 10.5 × 101 | 8 × 10⁻⁴ | 2.20 × 10⁻³ | 1.32 × 10⁻¹ | 54.8 × 101 | 0 |
| S15 | 1.05 × 10⁻³ | 1.39 × 10⁻¹ | 9 × 10⁻⁴ | 3.40 × 10⁻³ | 1.61 × 10⁻² | 3.40 × 101 | 3.23 × 10⁻¹ |
| S16 | 3.80 × 10⁻⁴ | 1.28 × 10⁻¹ | 6 × 10⁻⁴ | 1.20 × 10⁻³ | 7.42 × 10⁻² | 83.3 × 101 | 3.23 × 10⁻¹ |
| S17 | 1.70 × 10⁻⁴ | 5.44 × 10⁻¹ | 1 × 10⁻³ | 5 × 10⁻³ | 6.35 × 10⁻² | 68.7 × 101 | 3.23 × 10⁻¹ |
| S18 | 1.24 × 10⁻³ | 1.28 × 10⁻¹ | 0 | 6 × 10⁻³ | 0 | 0 | 0 |
| S19 | 4.70 × 10⁻⁴ | 6.11 × 10⁻² | 0 | 2.04 × 10⁻² | 2.15 × 10⁻¹ | 2.68 × 101 | 16.2 × 101 |
| S20 | 7.90 × 10⁻⁴ | 2.94 × 10⁻¹ | 1.30 × 10⁻³ | 1.29 × 10⁻² | 2.22 × 10⁻² | 95.7 × 101 | 6.46 × 10⁻¹ |
| S21 | 3.40 × 10⁻⁴ | 2.33 × 10⁻¹ | 0 | 8.90 × 10⁻³ | 1.75 × 10⁻² | 56.3 × 101 | 0 |
| S22 | 3.90 × 10⁻⁴ | 5 × 10⁻² | 8.00 × 10⁻⁴ | 1.51 × 10⁻² | 4.82 × 10⁻² | 49.4 × 101 | 3.23 × 10⁻¹ |
| S23 | 8.00 × 10⁻⁴ | 6.94 × 10⁻¹ | 6.00 × 10⁻⁴ | 6.90 × 10⁻³ | 2.04 × 10⁻² | 2.66 × 101 | 0 |
| S24 | 5.20 × 10⁻⁴ | 4.78 × 10⁻¹ | 1.50 × 10⁻³ | 4.60 × 10⁻³ | 1.65 × 10⁻² | 60.2 × 101 | 0 |
| S25 | 6.07 × 10⁻³ | 4.06 × 10⁻¹ | 1.20 × 10⁻³ | 2.20 × 10⁻³ | 7.83 × 10⁻² | 64.8 × 101 | 3.23 × 10⁻¹ |
| S26 | 3.50 × 10⁻⁴ | 6.67 × 10⁻² | 1.30 × 10⁻³ | 1.29 × 10⁻² | 8.50 × 10⁻² | 2.28 × 101 | 16.2 × 101 |
| S27 | 1.70 × 10⁻⁴ | 7.22 × 10⁻² | 1.10 × 10⁻³ | 3.20 × 10⁻³ | 3.44 × 10⁻² | 33.2 × 101 | 0 |
| S28 | 4.90 × 10⁻⁴ | 1.06 × 10⁻¹ | 9.00 × 10⁻⁴ | 2.20 × 10⁻³ | 2.03 × 10⁻² | 2.15 × 101 | 0 |
| S29 | 2.70 × 10⁻⁴ | 3.78 × 10⁻¹ | 1.60 × 10⁻³ | 4.2 × 10⁻³ | 1.72 × 10⁻² | 57.1 × 101 | 3.23 × 10⁻¹ |
| S30 | 2.30 × 10⁻⁴ | 1.50 × 10⁻¹ | 1.00 × 10⁻³ | 2 × 10⁻³ | 3.83 × 10⁻² | 45.5 × 101 | 6.46 × 10⁻¹ |
| S31 | 4.11 × 10⁻³ | 6.11 × 10⁻² | 8.00 × 10⁻⁴ | 1.29 × 10⁻² | 8.78 × 10⁻² | 59.4 × 101 | 0 |
| S32 | 8.20 × 10⁻⁴ | 5.50 × 10⁻¹ | 1.20 × 10⁻³ | 1.59 × 10⁻² | 5.06 × 10⁻² | 4.89 × 101 | 3.23 × 10⁻¹ |
| K1 | 0 | 0 | 0 | 3.80 × 10⁻³ | 2.26 × 10⁻² | 44.0 × 101 | 3.23 × 10⁻¹ |
| K2 | 2.60 × 10⁻⁴ | 49.4 × 101 | 0 | 3 × 10⁻³ | 4.61 × 10⁻² | 0 | 0 |
| K3 | 4.70 × 10⁻⁴ | 0 | 0 | 1.80 × 10⁻³ | 1.24 × 10⁻¹ | 3.42 × 101 | 0 |
| K4 | 5.10 × 10⁻⁴ | 8.56 × 10⁻¹ | 0 | 5.60 × 10⁻² | 4.65 × 10⁻² | 60.2 × 101 | 0 |
| K5 | 1.50 × 10⁻⁴ | 29.4 × 101 | 0 | 1.53 × 10⁻² | 1.24 × 10⁻¹ | 67.1 × 101 | 0 |
| K6 | 0 | 5 × 10⁻¹ | 3 × 10⁻⁴ | 5.40 × 10⁻³ | 1.29 × 10⁻¹ | 1.19 × 101 | 0 |
| K7 | 1.51 × 10⁻³ | 25.6 × 101 | 3 × 10⁻⁴ | 1.73 × 10⁻² | 4.69 × 10⁻² | 67.1 × 101 | 0 |
| K8 | 7.30 × 10⁻⁴ | 13.9 × 101 | 3 × 10⁻⁴ | 6 × 10⁻⁴ | 1.29 × 10⁻¹ | 0 | 0 |
| K9 | 2.20 × 10⁻⁴ | 5.67 × 101 | 0 | 2.80 × 10⁻³ | 1.07 × 10⁻¹ | 67.1 × 101 | 0 |
| K10 | 7.20 × 10⁻⁴ | 44.8 × 101 | 0 | 6.30 × 10⁻³ | 1.92 × 10⁻² | 56.3 × 101 | 0 |
| K11 | 4.90 × 10⁻⁴ | 0 | 0 | 1.60 × 10⁻³ | 2.19 × 10⁻² | 67.9 × 101 | 0 |
| K12 | 0 | 42.8 × 101 | 0 | 2.80 × 10⁻³ | 1.88 × 10⁻¹ | 23.9 × 101 | 0 |
| K13 | 1.86 × 10⁻³ | 0 | 0 | 1.75 × 10⁻² | 7.14 × 10⁻² | 63.3 × 101 | 0 |
| K14 | 4 × 10⁻⁴ | 0 | 0 | 3 × 10⁻³ | 1.24 × 10⁻¹ | 0 | 0 |
| K15 | 2.50 × 10⁻⁴ | 52.8 × 101 | 0 | 7.90 × 10⁻³ | 1.88 × 10⁻² | 3 × 101 | 0 |
| K16 | 0 | 59.4 × 101 | 0 | 5.80 × 10⁻³ | 3.11 × 10⁻² | 61 × 101 | 0 |
| K17 | 3.90 × 10⁻⁴ | 17.2 × 101 | 0 | 2 × 10⁻³ | 2.01 × 10⁻¹ | 2.59 × 101 | 16.2 × 101 |
| K18 | 6.80 × 10⁻⁴ | 27.2 × 101 | 0 | 3 × 10⁻³ | 4.79 × 10⁻² | 2.56 × 101 | 0 |
| K19 | 7.90 × 10⁻⁴ | 15 × 101 | 0 | 1.57 × 10⁻² | 2.22 × 10⁻² | 5.11 × 101 | 16.2 × 101 |
| K20 | 3.40 × 10⁻⁴ | 2.22 × 100 | 0 | 4.60 × 10⁻³ | 1.75 × 10⁻² | 48.6 × 101 | 0 |
| K21 | 3.90 × 10⁻⁴ | 5.56 × 10⁻¹ | 0 | 2 × 10⁻³ | 4.82 × 10⁻² | 64.0 × 101 | 0 |
| K22 | 8 × 10⁻⁴ | 21.7 × 101 | 0 | 1.20 × 10⁻³ | 2.04 × 10⁻² | 68.7 × 101 | 3.23 × 10⁻¹ |
| K23 | 5.20 × 10⁻⁴ | 19.4 × 101 | 0 | 6.70 × 10⁻³ | 1.65 × 10⁻² | 2.50 × 101 | 16.2 × 101 |
| K24 | 6.07 × 10⁻³ | 24.4 × 101 | 2 × 10⁻⁴ | 7.90 × 10⁻³ | 7.83 × 10⁻² | 61 × 101 | 0 |
| K25 | 3.50 × 10⁻⁴ | 6.11 × 10⁻¹ | 0 | 8.90 × 10⁻³ | 8.50 × 10⁻² | 54.8 × 101 | 3.23 × 10⁻¹ |
| K26 | 1.70 × 10⁻⁴ | 11.7 × 101 | 0 | 6 × 10⁻⁴ | 3.44 × 10⁻² | 58.6 × 101 | 0 |
| K27 | 4.90 × 10⁻⁴ | 34.4 × 101 | 0 | 3 × 10⁻³ | 2.03 × 10⁻² | 67.1 × 101 | 0 |
| K28 | 2.70 × 10⁻⁴ | 21.1 × 101 | 0 | 6 × 10⁻³ | 1.72 × 10⁻² | 57.1 × 101 | 3.23 × 10⁻¹ |
| K29 | 6.80 × 10⁻⁴ | 37.2 × 101 | 2 × 10⁻⁴ | 2.20 × 10⁻³ | 4.79 × 10⁻² | 45.5 × 101 | 0 |
| K30 | 0 | 0 | 1 × 10⁻⁴ | 2.04 × 10⁻² | 2.13 × 10⁻² | 59.4 × 101 | 0 |
| J1 | 1.31 × 10⁻³ | 1.22 × 10⁻¹ | 1.70 × 10⁻³ | 1.51 × 10⁻² | 2.74 × 10⁻² | 4.89 × 101 | 0 |
| J2 | 2.02 × 10⁻³ | 4.50 × 10⁻¹ | 0 | 6 × 10⁻⁴ | 7.74 × 10⁻² | 44 × 101 | 0 |
| J3 | 5 × 10⁻⁴ | 4.28 × 10⁻¹ | 0 | 4.60 × 10⁻³ | 1.32 × 10⁻¹ | 0 | 0 |
| J4 | 1.05 × 10⁻³ | 4 × 10⁻¹ | 1.20 × 10⁻³ | 1.51 × 10⁻² | 1.61 × 10⁻² | 3.42 × 101 | 0 |
| J5 | 3.80 × 10⁻⁴ | 4.39 × 10⁻¹ | 2 × 10⁻⁴ | 1.60 × 10⁻³ | 7.42 × 10⁻² | 62 × 101 | 0 |
| J6 | 1.70 × 10⁻⁴ | 3.94 × 10⁻² | 7 × 10⁻⁴ | 1.40 × 10⁻³ | 6.35 × 10⁻² | 6.71 × 101 | 3.23 × 10⁻¹ |
| J7 | 1.24 × 10⁻³ | 3.33 × 10⁻² | 1.60 × 10⁻³ | 3 × 10⁻³ | 0 | 1.19 × 101 | 16.2 × 101 |
| J8 | 4.70 × 10⁻⁴ | 9.44 × 10⁻² | 1.40 × 10⁻³ | 1.40 × 10⁻³ | 2.15 × 10⁻¹ | 67.1 × 101 | 3.23 × 10⁻¹ |
| J9 | 2.30 × 10⁻⁴ | 1.06 × 10⁻¹ | 1.40 × 10⁻³ | 3.20 × 10⁻³ | 3.83 × 10⁻² | 94.9 × 101 | 0 |
| J10 | 4.11 × 10⁻³ | 1.28 × 10⁻¹ | 1.60 × 10⁻³ | 1.40 × 10⁻³ | 8.78 × 10⁻² | 56.3 × 101 | 0 |
| J11 | 8.20 × 10⁻⁴ | 4.50 × 10⁻² | 7 × 10⁻⁴ | 1.40 × 10⁻³ | 5.06 × 10⁻² | 49.4 × 101 | 16.2 × 101 |
| J12 | 0 | 1.17 × 10⁻¹ | 1.20 × 10⁻³ | 2.20 × 10⁻³ | 2.26 × 10⁻² | 2.66 × 101 | 0 |
| Min | 0 | 0 | 0 | 6 × 10⁻⁴ | 0 | 0 | 0 |
| Max | 1.02 × 10⁻² | 59.4 × 101 | 1.80 × 10⁻³ | 5.60 × 10⁻² | 2.15 × 10⁻¹ | 1.18 × 10² | 16.2 × 101 |
| Mean | 1.20 × 10⁻³ | 11.1 × 101 | 6 × 10⁻⁴ | 8 × 10⁻³ | 6.47 × 10⁻² | 1.60 × 101 | 2.85 × 10⁻¹ |
| Component | Initial Eigenvalues | Extraction Sums of Squared Loadings | Rotation Sums of Squared Loadings | ||||||
|---|---|---|---|---|---|---|---|---|---|
| Total | % of Variance | Cumulative% | Total | % of Variance | Cumulative% | Total | % of Variance | Cumulative% | |
| 1 | 10.96 | 42.17 | 42.17 | 10.96 | 42.17 | 42.17 | 10.67 | 41.06 | 41.06 |
| 2 | 2.81 | 10.81 | 52.98 | 2.81 | 10.81 | 52.98 | 2.78 | 10.71 | 51.77 |
| 3 | 1.998 | 7.68 | 60.66 | 1.998 | 7.68 | 60.66 | 1.80 | 6.91 | 58.67 |
| 4 | 1.49 | 5.73 | 66.40 | 1.49 | 5.73 | 66.40 | 1.55 | 5.95 | 64.63 |
| 5 | 1.32 | 5.07 | 71.47 | 1.32 | 5.07 | 71.47 | 1.44 | 5.55 | 70.17 |
| 6 | 1.13 | 4.34 | 75.81 | 1.13 | 4.34 | 75.81 | 1.37 | 5.27 | 75.44 |
| 7 | 1.11 | 4.26 | 80.07 | 1.11 | 4.26 | 80.07 | 1.204 | 4.630 | 80.070 |
| 8 | 0.898 | 3.45 | 83.52 | ||||||
| 9 | 0.83 | 3.18 | 86.70 | ||||||
| 10 | 0.68 | 2.60 | 89.31 | ||||||
| 11 | 0.59 | 2.27 | 91.58 | ||||||
| 12 | 0.51 | 1.98 | 93.56 | ||||||
| 13 | 0.43 | 1.66 | 95.21 | ||||||
| 14 | 0.36 | 1.40 | 96.61 | ||||||
| 15 | 0.30 | 1.14 | 97.76 | ||||||
| 16 | 0.20 | 0.78 | 98.54 | ||||||
| 17 | 0.17 | 0.64 | 99.18 | ||||||
| 18 | 0.09 | 0.34 | 99.53 | ||||||
| 19 | 0.06 | 0.25 | 99.78 | ||||||
| 20 | 0.02 | 0.09 | 99.86 | ||||||
| 21 | 0.020 | 0.08 | 99.94 | ||||||
| 22 | 0.01 | 0.05 | 99.99 | ||||||
| 23 | 0.002 | 0.007 | 99.995 | ||||||
| 24 | 0.001 | 0.004 | 99.999 | ||||||
| 25 | 0.000 | 0.001 | 100.000 | ||||||
| 26 | 2.202 × 10⁻⁶ | 8.468 × 10⁻⁶ | 100.000 | ||||||
| Parameters | pH | Cond | NO3 | T.PO4 | TH | Na | K | Ca | Mg | Cl | Alk | SO4 | Mn | As | Fe | Cu | Ni | Pb | Cd | F | Cr |
|---|---|---|---|---|---|---|---|---|---|---|---|---|---|---|---|---|---|---|---|---|---|
| pH | 1.00 | ||||||||||||||||||||
| Conduct | −0.309 | 1.00 | |||||||||||||||||||
| TDS | −0.309 | 1.00 | |||||||||||||||||||
| NO3 | −0.011 | 0.022 | 1.00 | ||||||||||||||||||
| T.PO4 | 0.082 | −0.106 | 0.105 | 1.00 | |||||||||||||||||
| T.H | −0.298 | 0.799 | 0.000 | −0.417 | 1.00 | ||||||||||||||||
| Na | −0.249 | 0.864 | 0.034 | −0.105 | 0.724 | 1.00 | |||||||||||||||
| K | −0.255 | 0.854 | −0.076 | −0.161 | 0.780 | 0.864 | 1.00 | ||||||||||||||
| Ca | −0.325 | 0.981 | 0.030 | −0.112 | 0.806 | 0.863 | 0.876 | 1.00 | |||||||||||||
| Mg | −0.325 | 0.830 | 0.052 | −0.176 | 0.737 | 0.702 | 0.689 | 0.783 | 1.00 | ||||||||||||
| Cl | −0.291 | 0.933 | 0.019 | −0.148 | 0.804 | 0.972 | 0.921 | 0.935 | 0.796 | 1.00 | |||||||||||
| Alk | −0.320 | 0.906 | 0.042 | −0.132 | 0.769 | 0.973 | 0.847 | 0.900 | 0.763 | 0.965 | 1.00 | ||||||||||
| SO4 | −0.265 | 0.947 | 0.068 | −0.052 | 0.765 | 0.954 | 0.874 | 0.934 | 0.813 | 0.970 | 0.955 | 1.00 | |||||||||
| Mn | −0.309 | 0.040 | −0.045 | −0.091 | 0.132 | 0.012 | 0.110 | 0.050 | 0.055 | 0.044 | 0.021 | 0.026 | 1.00 | ||||||||
| As | 0.361 | −0.384 | 0.071 | 0.122 | −0.284 | −0.249 | −0.259 | −0.417 | −0.283 | −0.293 | −0.349 | −0.284 | 0.191 | 1.00 | |||||||
| Fe | −0.166 | 0.147 | −0.203 | 0.006 | 0.121 | 0.025 | 0.101 | 0.154 | 0.045 | 0.083 | 0.042 | 0.068 | 0.152 | −0.090 | 1.00 | ||||||
| Cu | 0.045 | −0.108 | −0.224 | 0.047 | −0.147 | −0.098 | −0.116 | −0.116 | −0.171 | −0.132 | −0.111 | −0.104 | 0.054 | −0.034 | 0.293 | 1.00 | |||||
| Ni | −0.032 | 0.207 | 0.018 | −0.096 | 0.129 | 0.172 | 0.167 | 0.182 | 0.259 | 0.199 | 0.200 | 0.196 | 0.013 | 0.021 | 0.073 | −0.009 | 1.00 | ||||
| Pb | 0.033 | 0.074 | −0.052 | −0.059 | 0.105 | 0.152 | 0.113 | 0.065 | 0.166 | 0.126 | 0.126 | 0.134 | −0.028 | .017 | −0.257 | −0.164 | 0.196 | 1.00 | |||
| Cd | 0.068 | 0.069 | 0.118 | −0.026 | 0.189 | 0.064 | 0.054 | 0.068 | 0.118 | 0.073 | 0.085 | 0.105 | −0.132 | −0.176 | −0.135 | −0.031 | 0.007 | 0.107 | 1.00 | ||
| F | −0.186 | 0.848 | 0.189 | −0.008 | 0.733 | 0.841 | 0.724 | 0.829 | 0.719 | 0.839 | 0.865 | 0.902 | −0.025 | −0.293 | 0.027 | −0.104 | 0.146 | 0.103 | 0.250 | 1.00 | |
| Cr | −0.011 | −0.097 | −0.225 | −0.062 | −0.229 | −0.089 | −0.059 | −0.135 | −0.042 | −0.095 | −0.109 | −0.103 | 0.107 | 0.120 | 0.129 | 0.083 | −0.164 | −0.100 | −0.464 | −0.216 | 1.00 |
Disclaimer/Publisher’s Note: The statements, opinions and data contained in all publications are solely those of the individual author(s) and contributor(s) and not of MDPI and/or the editor(s). MDPI and/or the editor(s) disclaim responsibility for any injury to people or property resulting from any ideas, methods, instructions or products referred to in the content. |
© 2024 by the authors. Licensee MDPI, Basel, Switzerland. This article is an open access article distributed under the terms and conditions of the Creative Commons Attribution (CC BY) license (https://creativecommons.org/licenses/by/4.0/).
Share and Cite
Landar, A.Q.; Jahangir, T.M.; Khuhawar, M.Y.; Lanjwani, M.F.; Khuhawar, F.Y. Evaluation of Water Quality of Groundwater of Sanghar District, Sindh, Pakistan: Chemical and Multivariate Analysis. Water 2024, 16, 856. https://doi.org/10.3390/w16060856
Landar AQ, Jahangir TM, Khuhawar MY, Lanjwani MF, Khuhawar FY. Evaluation of Water Quality of Groundwater of Sanghar District, Sindh, Pakistan: Chemical and Multivariate Analysis. Water. 2024; 16(6):856. https://doi.org/10.3390/w16060856
Chicago/Turabian StyleLandar, Abdul Qayoom, Taj Muhammad Jahangir, Muhammad Yar Khuhawar, Muhammad Farooque Lanjwani, and Faheem Yar Khuhawar. 2024. "Evaluation of Water Quality of Groundwater of Sanghar District, Sindh, Pakistan: Chemical and Multivariate Analysis" Water 16, no. 6: 856. https://doi.org/10.3390/w16060856