Article

A New Inversion Method for Obtaining Underwater Spatial Information of Subsidence Waterlogging Based on InSAR Technology and Subsidence Prediction

1
School of Resources and Environmental Engineering, Anhui University, Hefei 230601, China
2
The Fourth Surveying and Mapping Institute of Anhui Province, Hefei 230031, China
3
Department of Engineering Management, Hefei College of Finance and Economics, Hefei 231299, China
*
Author to whom correspondence should be addressed.
Water 2024, 16(7), 1002; https://doi.org/10.3390/w16071002
Submission received: 14 March 2024 / Revised: 25 March 2024 / Accepted: 27 March 2024 / Published: 29 March 2024

Abstract

:
Surface waterlogging disasters due to underground mining and geological status have caused the abandonment of fertile land, seriously damaged the ecological environment, and have influenced the sustainable development of coal resource-based cities, which has become a problem that some mining areas need to face. However, the traditional underwater terrain measurement method using sonar encompasses a time-consuming and labor-intensive process. Thus, an inversion method for obtaining the underwater spatial information of subsidence waterlogging in coal mining subsidence waterlogging areas is proposed, based on differential interferometric synthetic aperture radar (D-InSAR) and the probability integral prediction method. First, subsidence values are obtained in the marginal area of the subsidence basin using D-InSAR technology. Then, the subsidence prediction parameters of the probability integral method (PIM) are inverted by a genetic algorithm (GA) based on the subsidence values. Finally, the underwater spatial information of subsidence waterlogging is calculated on the basis of the prediction parameters. The subsidence waterlogging area in the Wugou coal mine was adopted as the study area, and the underwater spatial information of subsidence waterlogging was inverted by the proposed method. The results show that this method can effectively provide the underwater spatial information of subsidence waterlogging, including the maximum subsidence value, waterlogging volume, subsidence waterlogging area, and underwater terrain in the subsidence waterlogging area. Compared with field-measured data from the same period, the RMSE of water depth is 99 mm, and the relative error is 9.9%, which proves that this inversion method is accurate and can meet engineering precision requirements.

1. Introduction

Coal resources, as the main body of the global energy structure, will remain difficult to replace in the foreseeable future. China is the world’s largest consumer of coal resources. By the end of 2021, the total annual energy consumption in China was 5.24 billion tons of standard coal, of which coal consumption accounted for 56.0% of the total energy consumption [1]. Extensive coal mining has caused a series of geological and environmental problems. For example, in terms of geology, coal mining can cause surface subsidence, affecting the landform and terrain of the surrounding areas. In terms of the environment, it leads to water pollution, ecological damage, and so on. According to statistics, the subsidence area in China exceeds 20,000 km2; the land subsidence area due to coal mining in China reaches 6000 km2, and the annual increase in the area is 240 km2 [2]. These land subsidence areas are affected by atmospheric precipitation and groundwater seepage, forming a large number of coal mining subsidence waterlogging areas (Figure 1). Subsidence waterlogging areas often correspond to the overlap between farmland and coal resources, which results in farmland damage and a sharp contradiction between people and land distribution. Statistics show that the surface subsidence waterlogging area in mining areas with high groundwater levels in the North China Plain due to coal mining reached 327.035 km2 from 1990 to 2017, of which 79% was originally cropland. Anhui Province in China hosts a coal mining subsidence waterlogging area of 118.09 km2, which increased by approximately six times from 1995 to 2020, with an average annual increase of 3.97 km2 [3]. In addition, subsidence waterlogging due to coal mining has been reported in other countries, such as Germany [4], the United States [5], and Australia [6], indicating that this global geological disaster is caused by underground mining [7].
Subsidence waterlogging disasters are the focus of researchers worldwide [8]. Moreover, solving the ecological and environmental problems associated with subsidence waterlogging due to underground mining has become the goal of researchers. Therefore, it is necessary to mitigate subsidence waterlogging to protect the ecological environment in mining areas [9]. However, the lack of underwater terrain data for subsidence waterlogging areas makes determination of the treatment scope difficult, thereby causing treated areas to be flooded again and negating treatment results. The subsidence waterlogging areas need repeated treatments, which limits the efficiency of ecological restoration and management of mining areas. Therefore, obtaining accurate underwater terrain information on subsidence waterlogging areas is very important for subsidence waterlogging evaluation and treatment [10].
Figure 1. Formation diagram of the subsidence waterlogging caused by underground mining [11].
Water 16 01002 g001
Traditional geodetic methods (such as leveling and GPS techniques) use points as monitoring elements instead of areas. Regarding large-scale surface deformation, the monitoring efficiency is not high, and it involves a time-consuming and labor-intensive approach that is greatly affected by external factors [12]. InSAR technology can be adopted to monitor ground surface deformation on a daily basis [13]. Earlier InSAR technology originated from the double-slit interference experiment of Thomas Young [14,15]. In the 1970s, due to the introduction of interferometric technology, two synthetic aperture radar (SAR) images covering the same area were jointly processed [16], and the corresponding phase difference was extracted to restore the target shape, such as the establishment of a digital elevation model, leading to the development of InSAR technology [17]. After decades of development in InSAR technology, differential interferometric synthetic aperture radar (D-InSAR) [18,19], small baseline subset interferometric synthetic aperture radar (SBAS-InSAR) [20], persistent scatterer interferometric synthetic aperture radar (PS-InSAR) [21], and distributed scatterer interferometric synthetic aperture radar (DS-InSAR) [22] techniques have been proposed, and these techniques have been widely used and can be employed to monitor land subsidence [23,24]. InSAR technology can be adopted to monitor land subsidence caused by mining with low cost and high efficiency [25,26,27].
However, there is often a large amount of water in subsidence areas during the actual mining process. InSAR technology only obtains the subsidence values without accounting for waterlogging and cannot provide the underwater spatial information of subsidence waterlogging, so the accurate and efficient acquisition of the underwater spatial information of subsidence waterlogging remains a challenge. The probability integral method (PIM) is the most widely used model for predicting surface subsidence. Accurate mining subsidence prediction should be based on the accurate parameters obtained. But, the PIM is a nonlinear and complex model, and the complexity of the overlying strata, the model error of the PIM, the field monitoring error, and other factors lead to poor reliability and robustness of the parameter inversion results of the PIM. As such, we proposed a method that combines InSAR technology and GA to invert the predicted parameters of the PIM and the underwater spatial information of subsidence waterlogging in subsidence waterlogging areas. We combined InSAR technology and GA to solve the problem of acquiring underwater spatial information in subsidence waterlogging areas [28]. This method can be adopted to extract small deformations at the boundary of coal mining subsidence areas relatively accurately, and a feasible solution is proposed for the problem of obtaining underwater spatial information in most waterlogging mining areas. This addresses the time-consuming and labor-intensive characteristics of traditional field measurement methods. This is very important for understanding the evolution processes, predicting waterlogging disasters, and treating the ecological environment affected by subsidence waterlogging in coal resource-based cities with high groundwater levels.

2. Overview of Study Area and Data Sources

2.1. Overview of Study Area

The study area is the Wugou Coal Mine in the Huaibei mining area. The geographical coordinates are 116°32′~116°43′ east longitude and 33°29′~33°36′ north latitude. The economy in this area is mainly based around mining and agriculture. The territory of Wugou town is flat, and the altitude gradually decreases from northwest to southeast. There are many rivers in the county, which are mainly divided into three major water systems: Hui River, Xi River, and Fei River. Most rivers flow from northwest to southeast. The Huaibei Plain, where the study area is located, has an average underground water level depth of less than 3 m year-round and is a typical high-groundwater-level coal mining area in China.
The underground coal mining working face 1034 is located in the Wugou Coal Mine, Huaibei city. The working face exhibits a strike length of 753.73 m, a strike azimuth of 45°, a coal seam inclination of 22°, an average mining thickness of 3.4 m, and an average ground elevation of 27.01 m. The working face was first mined in September 2018, but mining stopped in August 2019. Table 1 provides the geological and mining conditions of the 1034 working face. Figure 2 shows the location of the 1034 working face.

2.2. Data Sources

2.2.1. Radar Monitoring Data

The Sentinel-1A data (Table 2) and precise orbit ephemerides (POD) data used in this paper were retrieved from the Air Force Bureau. The Sentinel-1A data were adopted for C-band synthetic aperture radar imaging. The imaging mode is the interferometric wide-swath (IW) mode, which is the main acquisition mode for land. The product type is the single-look complex (SLC) product, using the VV polarization method, and the external DEM comprises STRM-3 data. The time range of the downloaded images extends from June 2018 to September 2020, with a total of 58 scenes. POD data were used to correct orbital information, effectively removing systematic errors caused by orbital errors. The image data of the waterlogging area in the study area comprise Sentinel-1A data, using VV + VH polarization mode, which were mainly used for soil moisture detection on a large scale. The time frame of the Sentinel-1A data for detecting waterlogging is synchronized with the monitoring period of waterlogging, with a total of 20 scenes.

2.2.2. Actual Measurement Data

In the actual water area measurements, GPS RTK technology was used to quickly detect the water depth at several points on the bottom, and the subsidence and water depth in the coal mining subsidence area were measured. In this paper, GPS mobile stations and detectors were installed on unmanned ships. The mobile station was installed directly above the transducer of the detector, and the positioning center coincided with the sounding center. The point data can be calculated based on the positioning coordinates and the water depth detected by the detector. Figure 3 shows the demonstration diagram of RTK and sonar measurement and the field measurement diagram.

3. Inversion Method of the Underwater Spatial Information of Subsidence Waterlogging

Addressing the problem whereby the underwater spatial information of subsidence waterlogging areas cannot be obtained, we proposed a method combining D-InSAR technology and the PIM to invert the underwater spatial information. This method entails the use of D-InSAR technology to obtain boundary information of the coal mining subsidence area without waterlogging, and GA is then used to invert the parameters of the PIM for predicting underwater spatial information. Figure 4 shows a flow diagram of the method.
The method proceeds as follows: (1) first, the corresponding satellite data information is obtained according to the mining situation and waterlogging status of the working face in the study area. D-InSAR technology is used to obtain the surface deformation of the working face at different times. By continuously superimposing the surface deformation information from continuous time periods, subsidence information of the subsidence boundary without waterlogging is obtained. (2) The waterlogging boundary of the coal mining subsidence area, extracted by the threshold method, is superimposed on the subsidence information obtained through differential interferometric radar technology to determine subsidence in nonwaterlogging areas of the subsidence basin. (3) The subsidence parameters (subsidence factor q , tangent of major influence angle tan β , propagation angle θ , and offset of the inflection point S ) of the PIM are inverted by GA. Using the subsidence parameter information of the working face, underwater spatial information can be deduced.

3.1. Subsidence Extraction in Nonwaterlogging Areas

In this paper, D-InSAR technology is used to process Sentinel-1A data from 24 September 2018 to 1 September 2020. The processing results from 24 September 2018 to 4 May 2020 will be superimposed every three months for display. The processing results from 4 May 2020 to 1 September 2020 will be superimposed once every month for display. The specific process is as follows: (1) data preparation: parameters are set, and radar data and precise orbit data are imported. The data type to be used is set, and the data processing path is defined. (2) Baseline estimation: the baseline situation of master–slave data is determined, including time baseline, space baseline, doppler shift, elevation change represented by phase cycle change, and other information. The data time baseline used in this paper is basically 11~24 d, and the spatial baseline is smaller than the critical baseline ([−4995.102]–[4995.102]). (3) Interferogram generation, filtering, and coherence calculation, phase unwrapping, control point selection, orbit refinement and reflattening, phase conversion, and geocoding of the data are performed through the D-InSAR workflow, and the results are finally output.
By performing a differential interferometric analysis of the primary and secondary images for each adjacent period and accumulating the differential interferometric results across all consecutive time periods, the total deformation in the region over a large timespan can be obtained. Figure 5 shows the D-InSAR workflow.

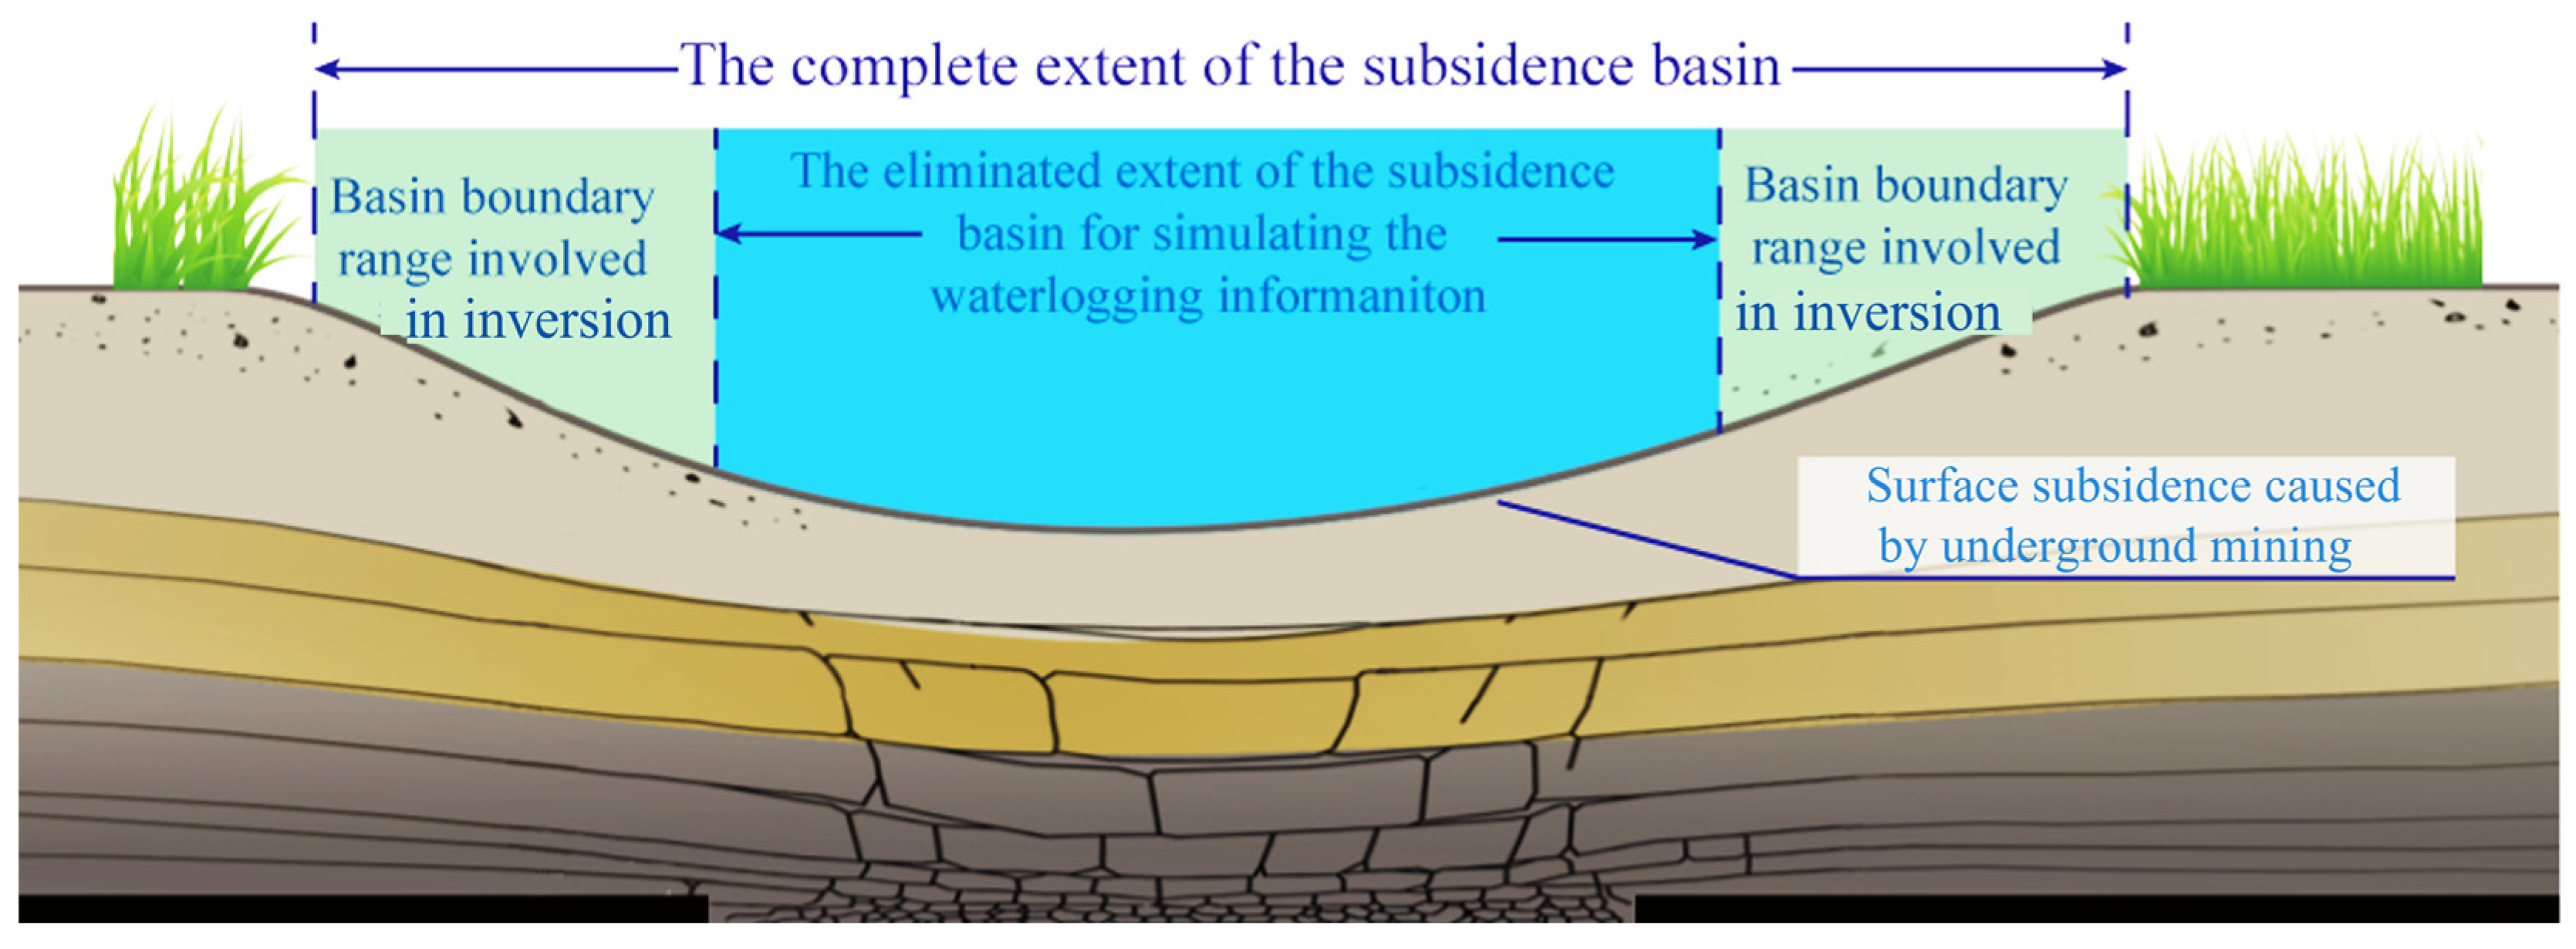
3.2. Boundary Extraction of Waterlogging in the Subsidence Area

In this paper, on the basis of extracting the coal mining subsidence area through D-InSAR technology, Sentinel-1 data are used to extract the waterlogging area within the subsidence area, and the subsidence area and the waterlogging area are superimposed to finally obtain the boundary information of the coal mining subsidence waterlogging area.
The process of extracting the water body is mainly based on the principle that the backscattering coefficient of the water body in the SAR image is low, and an initial relationship of bipolar data within the water body information is determined. After visual comparison, a suitable segmentation threshold is obtained, and a suitable relationship is constructed. The relationship is established to obtain water body information. In this process, Sentinel-1 Level-1 ground detection data under the interferometric wide–swath mode with VV + VH polarization are used for preprocessing, and the image is then filtered, radiometrically calibrated, and geocoded, while the geographic coordinate system is obtained for generating a backscatter coefficient map. The Sentinel-1 dual-polarization data-based SDWI water body extraction index equation was used to extract water body information. Figure 6 shows the range of waterlogging extracted by this method during a certain period:
S D W I = ln ( 10 × V V × V H ) 8

3.3. PIM Parameters Inversion Method Based on GA

In this paper, the parameters of the PIM are determined by using GA to predict the underwater spatial information of the waterlogging area. GA is a calculation model that simulates Darwin’s biological evolution theory of natural selection and biological evolution and is used to obtain the optimal solution by simulating the evolutionary process. Compared to the modular vector method and the least squares method, the genetic algorithm for subsidence factor inversion is relatively stable. Its stability is significantly superior to that of the other two algorithms. The results of the modular vector method and least squares method fluctuate greatly, and the inversion results are more dependent on the initial values.

3.3.1. Brief Review of PIM Theory

The PIM is a mining subsidence prediction method based on stochastic medium theory [29]. Stochastic medium theory was first introduced to strata movement research by J. Litwiniszyn in the 1950s. Later, it was developed by Chinese scholars Liu Baochen and Liao Guohua et al. and refined into the PIM [30]. In China, the PIM is the most used function for coal mine subsidence prediction and plays an important role in reducing the loss of mining subsidence. According to the principles guiding mining subsidence prediction for the PIM, the formula for land subsidence caused by a small unit is as follows:
W e ( x , y ) = 1 r e π x 2 + y 2 r 2
where W e ( x , y ) is the land subsidence caused by a small mining unit, (x, y) are coordinates of the surface point, r is the major influence radius, denoted by r = H/tan β, H is the mining depth; tanβ is the tangent of the major influence angle. Figure 7 shows the schematic diagram of calculating surface movement by probability integral method.
When the integral is carried out over the whole working face, the subsidence value of any point caused by the mining of the working face can be calculated as follows:
W ( x , y ) = D q m cos α W e ( x , y ) d φ d γ = D W 0 r 2 e π ( x φ ) 2 + ( y γ ) 2 r 2 d φ d γ
where W ( x , y ) is the subsidence of the surface point (x, y); m is the mining thickness, q is the subsidence factor, α is the dip angle of the coal seam, D is the calculation mining area of the working face, the length of the area D along the strike is D 3 , l is the calculated length of the working face along the strike, which can be calculated by l = D 3 2 S , S is the inflection point offset, the length of the area D along the inclination is D 1 , d φ d γ is the integration variable of the double integral over area D, L the calculated length of the working face along the strike can be calculated by:
L = ( D 1 2 S ) sin ( θ + α ) sin ( θ )
where θ is the propagation angle.

3.3.2. Theory of GA

GA is formalized as an optimization method by Holland and is a highly parallel, randomized, adaptive search algorithm that refers to biological natural selection and natural genetic mechanisms based on Darwinian evolution and Mendelian inheritance. It differs from most optimization techniques because of its global searching from one population of solutions rather than from one single solution. Every proposed solution is represented by a set of independent variables, which are coded in a chromosome, constituted by as many genes as the number of independent variables of the problem. So, it is mainly used for process optimization and machine learning, has few restrictions on optimization functions, and can handle very special functions.
PIM is a complex function model. The direct inversion of the parameters of PIM requires the linearization of the model, which requires the derivation of complex nonlinear functions and iterative solution. The resulting parameter is often affected by the accuracy of the initial value of the iteration, the nonlinear strength of the function, and the gross error. GA has the ability to find optimal solutions and multi-parameter inversion with complex functions.
GA works through the following steps. Firstly, the initial populations are generated based on the geological mining conditions and the given range of PIM prediction parameters. When the working face reaches full mining or large-scale mining, the geological structure plays a less decisive role in controlling surface subsidence. In such cases, the probabilistic integration method yields better predictive results. When the working face is not fully mined, the key strata or hard rock above the working face has some control over the surface. At this time, the probability integral method is used to predict the surface movement and deformation to a certain extent of deviation. Secondly, these generated populations are decoded into PIM parameters, and the subsidence values of the observation points are predicted through these PIM parameters. Thirdly, the predicted values are compared with the measured values, and the fitness value of each set of parameters is evaluated according to the fitness function. Finally, the populations are re-selected according to the fitness value, cross-over operation, and mutation operation, and the iterative cycle is not stopped until the predicted values are very close to the measured values.

3.3.3. Basic Steps of PIM Parameter Inversion Based on GA

The main steps of the parameter inversion method of the PIM based on GA are as follows, Figure 8 is the flow chart of genetic algorithm.
(1) Initialize parameter range and precision. The range and precision of the predicted parameters of the PIM are set according to the geological mining conditions and working face mining conditions. The parameters of the PIM are subsidence factor q , tangent of major influence angle tan β , main propagation angle θ , and offset of the inflection point S . Based on the data released by State Bureau of Coal Industry in 2017, a large number of mining area surface subsidence data are summarized. The data of 201 observation stations are counted, and the range of four parameters of the probability integration method is analyzed, which is shown in Table 3. q usually ranges from 0.01 to 1, and its inversion accuracy is 0.01. When a special coal mining method is used for mining, such as the fill-mining or strip-mining method, q is small and ranges from 0.01 to 0.5, and when the coal seam is mined under a thick loose layer, q may be greater than 1. tan β usually ranges from 1.0 to 3.0, and its inversion accuracy is 0.01. θ usually ranges from 70 to 90°, and its inversion accuracy is 0.1. S usually ranges from −30 to 40, and its inversion accuracy is 0.1. In general, S is a positive value. When the mining face is next to the goaf, it is often a negative value. The specific parameter ranges are shown in Table 3.
(2) Encoding and generating initial population. The parameters of the PIM should be encoded as a chromosome structure in GA, and the binary encoding method is often used. So, the individual binary length is calculated according to the range and precision of the PIM parameters. An N set of initial parameters to the problem are randomly created, then encoded as chromosomes. Every set of parameters is called an individual, and N individuals make up a population. GA starts iteration with the N set of parameters as the initial population. Then, these generated populations are decoded into the parameters of the PIM.
(3) Prediction of surface subsidence. The surface subsidence values of the observation points through the PIM parameters are based on Equation (3).
(4) Fitness evaluation. In the fitness evaluation process, an appropriate fitness function is important, as it measures the fitness degree of the individuals. Each individual in the population should be evaluated using the fitness function and arranged in descending order. According to the fitness of the individual, whether the individual meets the optimization criterion is judged, and if the individual meets the criterion, the individual is retained.
The surface subsidence value W M e a s u r e d is obtained from InSAR. Meanwhile, the surface subsidence value predicted by the PIM based on a set of parameters can be represented by W I n v e r s e d . In error theory, the residual sum of squares is often used as an important index to evaluate the accuracy of a model or method. Therefore, the square sum of the difference between the predicted values and the measured values of each surface point is taken as the fitness evaluation standard. The square sum of the difference can be calculated by Equation (5):
V V = ( W M e a s u r e d W I n v e r s e d ) 2
When the square sum of the difference is large, it indicates that the inversion parameters of the PIM are not accurate. The subsidence value and horizontal movement value predicted by this parameter differ greatly from the actual observation values, and the accuracy of the individual parameters is poor. On the contrary, when the square sum of the difference is large, it shows that the predicted values are more consistent with the actual observation values, and the inversion parameters of the PIM are more accurate.
(1)
The monitoring data are compared with the expected data, the fitness function is used to determine whether the parameters meet the adaptability requirements, and the probability of being selected is calculated, as expressed in Equation (6):
F = C max V V ; V V < C max
C is a coefficient of the fitness function, such that F is always greater than 0.
(2)
Judge whether the fitness values of these individuals meet the precision requirements or reach the number of iterations. If the fitness value of the individual meets the optimization criterion or the number of iterations reaches the iteration threshold, the individual is retained and output as the final optimal parameter, and this method ends. If the fitness value of the individual does not meet the criterion, step (7) will be performed, and the next iteration will begin.
(3)
GA operation is generally divided into three steps, including selection, crossover, and mutation. In the selection step, individuals with high fitness values will have a greater probability of generating individuals for the next generation, while individuals with low fitness values may be eliminated. In the crossover step, a new generation based on a certain crossover probability and crossover method will be generated. In the mutation step, parts of chromosomes are mutated with a small probability to generate new offspring individuals. When the GA operation is completed, the process jumps to step (3). The whole program is completed upon reaching step (6).

3.4. Calculation of the Underwater Spatial Information of Subsidence Waterlogging

The inversion parameters of the PIM and the following formulas are used to predict underwater spatial information, including the maximum subsidence value, height of the waterlogging from the original surface, maximum water depth, subsidence waterlogging area, waterlogging volume, and underwater terrain in the subsidence waterlogging area.
When the inversion parameters of the PIM are retrieved, the subsidence value W ( x , y ) of any surface point (x, y) can be calculated, according to Equation (3); then, the maximum subsidence value can be calculated as follows:
W max = max ( W ( x , y ) )
The waterlogging boundary can be extracted in Section 3.2; then, the subsidence value W b o u n d a r y of this boundary can be calculated according to Equation (3), based on the inversion parameters of the PIM, which is the height of waterlogging from the original surface H b w :
H b w = W boundary
The depth W w ( x w , y w ) of any underwater point ( x w , y w ) and the maximum water depth W max w can be calculated as follows:
W w ( x w , y w ) = W ( x w , y w ) H b w
W b w = W max H b w
The subsidence waterlogging area A w can be calculated as follows:
A w = 1 2 i = 1 n x i w y i + 1 w x i + 1 w y i w
where the waterlogging boundary consists of n points, ( x i w , y i w ) are the coordinates of point i in the waterlogging boundary.
The subsidence waterlogging volume V w can be calculated as follows:
V w = i = 1 n A i w h i
where the maximum water depth W max w will be divided into n equal parts, h i = W max w / n is. The split interval distance, A i w is the waterlogging area at different depths.

4. Results

The combination of D-InSAR technology with the inverted working face parameters is used to generate underwater spatial information in the coal mining subsidence waterlogging area, and the specific results are as follows:
(1)
Differential interference processing of the radar data from 24 September 2018 to 8 August 2020 is performed to obtain the subsidence value during different periods and determine the final subsidence value of the working face through continuous superposition. The subsidence results for 29 December 2018, 27 March 2019, 27 June 2019, 1 October 2019, 17 January 2020, and 4 May 2020 are obtained. The research results for the working face of the mining area are superimposed, as shown in Figure 9.
(2)
By observing the satellite image data, the corresponding waterlogging is determined, and the threshold method is used to extract the waterlogging range of the working face. Then, the subsidence in the mining area and the range of waterlogging during this period are superimposed to obtain the boundary subsidence of the coal mining subsidence waterlogging area. The observations revealed that the working face began to gradually experience waterlogging in June 2020, as shown in Figure 10.
(3)
According to the boundary subsidence information of the coal mining subsidence waterlogging area obtained by differential interferometric radar technology, the parameters of the PIM are inverted by GA, and the parameter model of the working face is generated. Since the actual measurement data were collected on 16 August 2020, according to the actual measurement data, the subsidence monitoring data on 8 August 2020 were selected for the experiment. Among them, the maximum number of iterations was set to 100, the initial population was less than 100, the crossover probability was 0.4, and the mutation probability was 0.001. Through continuous iterative calculation, the main parameter information was finally inverted, as listed in Table 4.
(4)
Combined with the parameter information inverted in the third step, the underwater spatial information of the 1034 working face on 8 August 2020 was predicted using the dynamic prediction system of the underwater spatial information of the subsidence waterlogging area, as shown in Figure 11.
With the use of the method for inverting underwater terra spatial information by combining D-InSAR technology and the probability integral method, it is concluded that the maximum subsidence value of the 1034 working face on 8 August 2020 is approximately 1357 mm. The height of the waterlogging boundary from the surface is approximately 526 mm, and the maximum water depth is approximately 831 mm. In addition, using the geographic information system to calculate underwater spatial information, the volume of the subsidence area is 189,978 m3, the waterlogging area is 107,622 m2, and the waterlogging volume is 97,726 m3. Figure 12 and Table 5 show these findings.

5. Discussion

To verify the accuracy of the method, the inversion results were compared with the measured results, and the inversion parameter information and the predicted subsidence results of the mining subsidence areas in different periods after the residual subsidence stage were compared to verify the accuracy of the method. In order to test the adaptability of the method, the influence of subsidence boundaries on the results of the inversion parameters is simulated under different degrees. Finally, the method presented in this paper is used to monitor the water change information of the 1034 working face.

5.1. Accuracy Analysis

5.1.1. Measurement Comparative Analysis

To verify the accuracy of the method, precision analysis was conducted using the measured data. Combined with remote sensing image information, the experimental data for 8 August 2020, which is closest to the actual monitoring date, were selected as the verification object. With the use of GPS RTK technology to monitor the actual subsidence of the 1034 working face of the Wugou Mine in Suixi County, Huaibei city, on 16 August 2020, the subsidence values of different points along the main section of the mining area were extracted, and the geospatial system was used to analyze and visualize the information.
Based on the above data, the measured point data obtained by RTK technology and the monitoring inversion data were superimposed and compared to quantitatively analyze the accuracy of the inversion results, as shown in Figure 13.
According to field monitoring of the 1034 working face, the maximum subsidence value measured on 16 August 2020 is 1480 mm, of which the water depth is approximately 995 mm, and the boundary height of the exposed subsidence area is approximately 485 mm. At the same time, in the data monitored and retrieved by radar from 8 August, the maximum subsidence value was 1357 mm, the water depth obtained by monitoring was approximately 837 mm, and the boundary height of the exposed subsidence area was approximately 520 mm. According to the RMSE formula (Formula (13)), the RMSE of the water depth is 99 mm, and the relative error is 9.9%.
R M S E = i = 1 n ( W M e a s u r e d i W I v e r s e d i ) 2 1 n
In summary, it is feasible to use D-InSAR to obtain boundary information on the waterlogging area in the coal mining subsidence area, then use the obtained boundary information to invert the parameter information of the working face, and finally predict underwater spatial information through these parameters.

5.1.2. Comparison Analysis of Traditional Method

The traditional method is based on the working face information and geological mining conditions, and the probability integral method is used to predict the maximum subsidence value of the surface. The new method uses D-InSAR technology to monitor boundary information of the subsidence waterlogging area. It uses subsidence boundary information to invert the prediction parameters required for the probability integral method and then predicts underwater terrain information. Figure 14 is a diagram of the waterlogging predicted by traditional methods.
According to the traditional method, the maximum subsidence value on 8 August 2020 is 1760 mm, the water depth is 1176 mm, the waterlogging surface distance from the surface is 584 mm, the water area is 129,379 m2, the water volume is 159,439 m3, and the subsidence area volume is 229,572 m3. The maximum subsidence value obtained by the inversion method is 1357 mm, the water depth is 831 mm, the waterlogging surface distance from the surface is 526 mm, the water area is 107,622 m2, the water volume is 97,726 m3, and the subsidence area volume is 189,978 m3. The actual measured maximum subsidence value is 1480 mm, of which the water depth is about 995 mm, and the waterlogging surface from the surface is about 485 mm. According to Formula (13), the RMSE of water depth in the traditional method is 182 mm, and the relative error is 18.2%, as shown in Table 6. Therefore, the inversion results of the new method proposed in this paper are closer to the actual measurement results, and the accuracy is higher than that of the traditional method.

5.2. Comparison of Subsidence in Different Periods after Stable Subsidence

Since mining of the 1034 working face was stopped in August 2019, the overall mining process was stopped for more than half a year until June 2020. The working face has gone through a residual subsidence stage and is in a basically stable state. The underwater terrain is basically unchanged. Due to the influence of other factors, the area and volume of the waterlogging area changed, as indicated in Table 7. To verify the accuracy of the method, underwater spatial information during different periods after stable subsidence is compared, and underwater spatial information after inversion is examined. Based on the method described in Section 3, we conducted waterlogging experiments during four different periods and then compared and analyzed the inversion parameters and predicted subsidence results. Table 8 provides the inversion results during different periods.
Figure 14 reveals that parameter inversion was conducted based on the waterlogging boundary information of the subsidence area during different periods, the error of the inversion parameters was small, and the maximum error remained within the 1% range. According to the estimated underwater spatial information based on the boundary subsidence inversion data during different periods, the maximum subsidence value on 9 June 2020 is approximately 1354.58 mm; on July 3, it is approximately 1355.71 mm; and on September 1, it is approximately 1355.27 mm. Compared with the water depth data on 8 August 2020, the difference is small; all within 3 mm. Since production in the study area was stopped in August 2019, waterlogging occurred one year after production cessation, and the working face during this period was basically stable. After waterlogging occurred, the maximum subsidence in the waterlogging area changed slightly. Therefore, the measured subsidence data can be applied to June, July, and September. Then, we compared and analyzed the inversion results during different periods with the measured information. The results showed that the measured values in June, July, September, and August differ by −125.42 mm, −124.29 mm, and −124.73 mm, respectively, the ratio of the maximum subsidence value error to the measured subsidence value is 8.5%, and the error is small. The impact on the overall forecast range is limited.
In summary, after the coal mining subsidence area stabilizes, the maximum subsidence value of the working face inverted at different times exhibits an error of less than 8.5% relative with the measured values. In addition, after stabilization, the inversion data during different periods are basically consistent, and the variation range is less than 3 mm. By inverting underwater spatial information using waterlogging information during different periods, it was verified that this method has reference value for different periods and different degrees of waterlogging in coal mining subsidence areas.

5.3. Predicted Parameters Are Inversed with Different Degrees of Subsidence Boundaries

Due to the changeable reality, to better understand the application situation and scope of the proposed method, we conducted a simulation experiment in this paper. The adaptability of the method is verified by artificially removing the subsidence boundaries to different degrees and inverting the parameter information of the subsidence boundaries.

5.3.1. Experimental Method

The 1034 working face was chosen in the Wugou Mine, Huaibei city, as the experimental object, based on the monitored subsidence boundaries on 8 August 2020, and the inversion results for 8 August 2020 were used as actual values for comparison. The specific steps are as follows:
The boundary information of 10%, 20%, 30%, 40%, 50%, 60%, 70%, and 80% is eliminated, thereby simulating varying boundary conditions of subsidence areas, as shown in Figure 15. Then, the parameter information of the working face is inverted using the different degrees of boundary information. Finally, by comparing the parameter information, the impact of different degrees of subsidence boundaries on the inversion parameters is examined. Among them, we eliminate 10% of the boundary information and consider 272 points, eliminate 20% of the boundary information and consider 244 points, eliminate 30% of the boundary information and consider 223 points, eliminate 40% of the boundary information and consider 195 points, eliminate 50% of the boundary information and consider 165 points, eliminate 60% of the boundary information and consider 137 points, eliminate 70% of the boundary information and consider 111 points, and eliminate 80% of the boundary information and consider 78 points.

5.3.2. Experimental Results

With the use of the method described in Section 3, parameter information is simulated in the above eight situations, and the results are listed in Table 9.
Through comparative analysis with Table 9 and Figure 16, it can be found that the maximum subsidence factor ( q ) in the simulation experiment exhibits a relative error of less than 5% from the actual value, indicating that different degrees of boundary information have negligible influence on the inverted subsidence factor in the mining area. Compared with the actual value, the relative error of the tangent of the major influence angle ( tan β ) is within 1%, and the error can be ignored. The propagation angle ( θ ) exhibits the largest error of 4.3%, relative to the actual value when 80% of the boundary data information is eliminated, and the error accounts for 4% of the actual value. At the same time, the offset of the inflection point ( S ) shows the same trend. When 80% of the boundary data is eliminated, the offset of the inflection point result fluctuates greatly, and the relative error reaches 41.7%, which has no reference value relative to the actual value.
In summary, after comparing the results of the eight simulation experiments, it is found that the maximum subsidence factor and the tangent of the main influence angle are less notably affected by waterlogging than the other parameters and exhibit a certain stability. However, when the amount of data is small, e.g., less than 100 datasets, the results of the propagation angle and inflection point offset show certain fluctuations, especially the inflection point offset, which does not have a reference value.

5.4. Evolution Process of Underwater Spatial Information

Combined with the results in Section 4, the underwater spatial information of the 1034 working face from mining to production termination to increasing waterlogging is obtained. Table 10 shows the maximum subsidence value, advancing distance of the working face, volume of the subsidence area, water depth, water area, and water volume of the 1034 working face from September 2018 to July 2021. Figure 17 shows the waterlogging evolution process.
Finally, the obtained waterlogging information of the subsidence area spans from 24 September 2018 to 10 July 2021, which is approximately 34 months. Figure 18 shows the volume of waterlogging and advance information of the working face after analysis.
Based on the above information, the analysis of the dynamic evolution trend of waterlogging of the 1034 working face shows the following:
(1)
Unformed stage of waterlogging: Nonwaterlogging occurred in the working face from September 2018 to 4 May 2020. The working face in the research area advanced 748 m from mining (September 2018) to production termination (August 2019). At this time, with the continued advancement of the working face, the subsidence basin continued to sink until the volume of the subsidence area was 145,025 m³ in October 2019. With the shutdown of working face mining, the subsidence area gradually entered the stage of residual subsidence. At this time, the working face no longer advanced, and the subsidence basin slowly subsided. By June 9, 2020, it had basically remained stable at 1355 mm, and the volume of the subsidence area gradually reached a maximum value of 189,715 m³. The above figure shows that when the working face continued to advance and the coal mining subsidence area was not fully mined, no waterlogging occurred.
(2)
Growth stage of waterlogging: In June 2020, waterlogging was gradually generated. Over time, the amount of waterlogging continued to increase, and the rate of increase gradually increased. By September 2020, the volume of water in the working area reached a maximum of 163,826 m3, water in the working area gradually decreased, and by January 2021, no waterlogging occurred. Moreover, in December 2020, there was a small peak in the volume of waterlogging, at 12,012 m3. During this period, the subsidence of the working face basically remained stable, the variation range of the maximum subsidence value was small, and the volume of the subsidence basin basically remained unchanged at approximately 190,000 m3. Waterlogging locally occurred in June, and the largest extent of waterlogging occurred in September. According to the local monsoon climate, there are frequent plum rains in June and seasonal precipitation in July and August. Accordingly, it is speculated that precipitation may be the main cause of ponding.
(3)
Seasonal fluctuation stage of waterlogging: From January 2021 to July 2021, nonwaterlogging occurred on the working face in the subsidence area. From the above-ground detection radar data, it was determined that the surface condition of the working face changed over time, and the working face was mostly bare ground or vegetation-covered land.

5.5. Analysis of Influencing Factors of Waterlogging Evolution

According to the results of the evolution of waterlogging in the 1034 working face, the evolution of waterlogging is unstable and will change due to the influence of factors such as precipitation, evaporation, buried depth of groundwater level, and maximum subsidence value.
According to Figure 19, the above reasons for the evolution of waterlogging in this paper can be summarized. During the rainy season from October 2018 to 2019, the precipitation was small, the subsidence value of the working face did not reach the shallow groundwater level at this time, and the waterlogging was easy to discharge. Waterlogging is not easy to form. With continuous mining of the working face, from October 2019 to September 2020, the working face has been in a stable state of subsidence. However, due to the monsoon climate from October 2019 to May 2020, there is little precipitation in autumn and winter, and no water supply can be formed. The precipitation is too low, the shallow groundwater is not replenished by the precipitation, and the buried depth of the groundwater level is low. The maximum subsidence value of the working surface of 1034 is much higher than the buried depth of the groundwater level, and waterlogging is still unable to occur at this time.
By June and July 2020, due to the influence of the plum rain season in the region, a large amount of waterlogging was formed. At this time, the shallow groundwater was subject to a large amount of recharge, and the buried depth of the groundwater table rose abruptly, gradually exceeding the maximum subsidence value in June, July, and August. Due to the substantial increase in precipitation, a large amount of water was provided to the working face, and the buried depth of the groundwater level also provided a certain lifting and replenishment effect for the water in the working face, making the waterlogging in this period of time not easy to discharge, so it was easy to quickly produce water in this period. In addition, because the shallow groundwater level in August reached the maximum subsidence value, groundwater provided a certain amount of surface water recharge. Although the precipitation in August was not as sufficient as in June and July, waterlogging at the working surface still existed in a state of slow expansion, so the waterlogging area, waterlogging depth, and storage capacity on September 1 continued to exhibit a growing trend. However, with the decrease in precipitation and the increase in evaporation, the area and volume of waterlogging decreased rapidly. However, due to a small increase in precipitation in November, the area of waterlogging increased slightly. By January 2021, the waterlogging was completely gone.
From January to June 2021, there was no water source to replenish, and the waterlogging could not form due to too little precipitation. When the rainy season arrived in July, because the precipitation of the month was mainly concentrated on July 15 and July 28, the precipitation was 80.27 mm and 115.47 mm, respectively, the concentrated precipitation time was too short and easy to discharge, and it was not easy to form stable waterlogging. At the same time, evaporation also reached the maximum value of the year, reaching 114.5 mm. Due to the high rate of evaporation, although there was enough precipitation in the month, it was still unable to form a certain amount of waterlogging. Under the influence of the laws of evaporation and precipitation, transient concentrated precipitation cannot promote the formation of waterlogging. So, there was no waterlogging until the rainy season of 2021.

6. Conclusions and Prospects

6.1. Conclusions

Considering the problem of underwater terrain measurement in coal mining subsidence waterlogging areas, in this paper, we proposed a method that combines D-InSAR technology and GA to invert underwater spatial information. This method significantly contributes by efficiently providing accurate underwater spatial information data of subsidence waterlogging areas for waterlogging disaster prediction, ecological environment treatment, and restoration in coal resource-based cities with high groundwater levels. The following conclusions can be drawn:
(1)
Using InSAR technology and GA, information of the subsidence waterlogging area can be predicted, including the maximum subsidence value, water depth, waterlogging volume, waterlogging area, and volume of the subsidence area. The results showed that the maximum subsidence value on 8 August 2020 is approximately 1357 mm, the water depth is 831 mm, the height from the waterlogging surface to the ground is 526 mm, the volume of the subsidence area is 189,978 m³, and the waterlogging volume is 97,726 m³, with a waterlogging area of 107,622 m2.
(2)
To verify the accuracy of the proposed method, the measured data of RTK during the same period are verified and analyzed. The RMSE of water depth is 99 mm, and the relative error is 9.9%. Therefore, this inversion method is accurate and can meet the precision requirements of engineering.
(3)
To verify the stability of this method, a series of simulation experiments were conducted. The results show that the relative error of the maximum subsidence factor (q) remains within 5%, and the relative error of the main influencing angle tangent (tanβ) is less than 1%. Therefore, this method maintains favorable inversion stability under different boundary ranges when the waterlogging area accounts for less than 80% of the total area. When 80% of the boundary data is eliminated, the relative error of the offset of the inflection point greatly fluctuates, reaching 41.7%, while the propagation angle also fluctuates. Therefore, when the waterlogging area exceeds 80%, the inversion results of this method provide no reference value.
(4)
The evolution processes and influencing factors of subsidence waterlogging were analyzed. According to the waterlogging evolution data and characteristics, the waterlogging evolution process can be divided into three stages: waterlogging nonformation stage, waterlogging generation stage, and waterlogging fluctuation stage.

6.2. Prospects

Although the method is innovative and practical, there is still room for further improvement and optimization.
(1)
The differential interferometer radar used for mining boundary extraction in this paper is based on two-dimensional surface extraction. The boundary subsidence can be further extracted from three horizontal directions, such as east–west, north–south and subsidence, by means of LOS resolution analysis, so as to further optimize the differential interference results.
(2)
In the process of inverting underwater terrain, a genetic algorithm based on the probability integral method was used in this paper, which is mainly aimed at spatial changes in the subsidence process of coal mining subsidence areas. In further studies, the influence of the time factor in the deformation process of the mining area could be considered, and the methods of spatio-temporal fusion, such as the introduction of the Knothe time function, could be used to further invert the underwater terrain and refine the inversion results.

Author Contributions

Conceptualization, X.Z. and M.Q.; methodology, X.Z.; software, M.Q. and P.Z.; validation, X.Z., M.Q. and E.N.; formal analysis, J.Z.; investigation, X.Z.; resources, X.Z.; data curation, L.Q.; writing—original draft preparation, X.Z. and M.Q.; writing—review and editing, X.Z., P.Z. and H.L.; visualization, X.Y.; supervision, X.Z.; project administration, X.Z.; funding acquisition, X.Z. All authors have read and agreed to the published version of the manuscript.

Funding

Financial support for this work was provided by the National Natural Science Foundation of China (52174156, 51804001). The Key University Science Research Project of Anhui Province (KJ2021A0080) and the Natural Science Foundation of Anhui Province (2308085ME149) are gratefully acknowledged.

Data Availability Statement

The data presented in this study are available on request from the author. The data are not publicly available due to permissions issues.

Acknowledgments

Special thanks to the reviewers and editors for providing constructive suggestions and comments to improve this manuscript.

Conflicts of Interest

The authors declare no conflicts of interest.

References

  1. Dudley, B. BP Statistical Review of World Energy 2022; British Petroleum Co.: London, UK, 2022. [Google Scholar]
  2. Guo, W.; Hu, B.; Zhang, J.; Chen, Q.; Jia, X.; Li, J. Research on the Settlement Regulation and Stability of Large Building Foundation over Gobs: A Case Study in the Xiangcheng Coal Mine, China. Shock Vib. 2021, 2021, 5533098. [Google Scholar] [CrossRef]
  3. Sun, R.; Zhu, X.; Zhang, P.; Liang, M.; Zhang, X.; Ning, Z.; Peng, X.; Liu, H.; Yang, X.; Huang, W.; et al. Research on the spatiotemporal evolution characteristics of waterlogging in high ground-water level coal mining subsidence areas—Taking mining areas in Anhui Province as an example. Coal Sci. Technol. 2020, 50, 215–224. [Google Scholar]
  4. Brücker, C.; Preuße, A. The future of underground spatial planning and the resulting potential risks from the point of view of mining subsidence engineering. Int. J. Min. Sci. Technol. 2020, 30, 93–98. [Google Scholar] [CrossRef]
  5. Grzovic, M.; Ghulam, A. Evaluation of land subsidence from underground coal mining using TimeSAR (SBAS and PSI) in Springfield, Illinois, USA. Nat. Hazards 2015, 79, 1739–1751. [Google Scholar] [CrossRef]
  6. Lechner, A.M.; Baumgartl, T.; Matthew, P.; Glenn, V. The impact of underground longwall mining on prime agricultural land: A review and research agenda. Land Degrad. Dev. 2016, 27, 1650–1663. [Google Scholar] [CrossRef]
  7. Cheng, L.; Skousen, J.G. Comparison of international mine reclamation bonding systems with recommendations for China. Int. J. Coal Sci. Technol. 2017, 4, 67–79. [Google Scholar] [CrossRef]
  8. Zhang, L. Big data, knowledge mapping for sustainable development A water quality index case study. Emerg. Sci. J. 2019, 3, 249–254. [Google Scholar] [CrossRef]
  9. Morrison, K.G.; Reynolds, J.K.; Wright, I.A. Subsidence fracturing of stream channel from longwall coal mining causing upwelling saline groundwater and metalenriched contamination of surface waterway. Water Air Soil Pollut. 2019, 230, 37. [Google Scholar] [CrossRef]
  10. Li, B.; Zhang, C.; Chen, Y. Research on the construction method of underwater terrain in coal mining subsidence area based on intelligent unmanned ship technology and GIS. China Coal 2020, 46, 28–35. [Google Scholar]
  11. Zhu, X.; Ning, Z.; Cheng, H.; Zhang, P.; Sun, R.; Yang, X.; Liu, H. A novel calculation method of subsidence waterlogging spatial information based on remote sensing techniques and surface subsidence prediction. J. Clean. Prod. 2022, 335, 130366. [Google Scholar] [CrossRef]
  12. Fan, J.; Zuo, X.; Li, T.; Chen, Q. Comparative analysis of PS-InSAR and SBAS-InSAR technology on land subsidence monitoring in main urban area of Kunming. Surv. Mapp. Eng. 2018, 27, 50–58. [Google Scholar]
  13. Zhang, B.; Wu, S.; Ding, X.; Zhu, J.; Li, Q. Use of multiplatform SAR imagery in mining deformation monitoring with dense vegetation coverage: A case study in the Fengfeng Mining area, China. Remote Sens. 2021, 13, 3091. [Google Scholar] [CrossRef]
  14. Li, C.; Zhang, W. Monitoring Application and Research Progress Based on InSAR Technology. North. Archit. 2020, 5, 15–19. [Google Scholar]
  15. Zheng, Y. Advantages and development prospects of InSAR technology in surface deformation measurement. China Stand. 2019, 16, 211–212. [Google Scholar]
  16. Zhu, C.; Deng, K.; Zhang, J.; Zhang, Y.; Fan, H.; Zhang, L. Three-dimensional deformation field detection based on multi-source SAR imagery in mining area. J. Coal Sci. 2014, 39, 673–678. [Google Scholar]
  17. Zhu, J.; Li, Z.; Hu, J. InSAR deformation monitoring method and research progress. J. Surv. Mapp. 2017, 46, 1717–1733. [Google Scholar]
  18. Ishwar, S.G.; Kumar, D. Application of DInSAR in mine surface subsidence monitoring and prediction. Curr. Sci. 2017, 112, 46–51. [Google Scholar] [CrossRef]
  19. Onuma, T.; Ohkawa, S. Detection of surface deformation related with CO2 injection by DInSAR at in Salah, Algeria. Energy Procedia 2009, 1, 2177–2184. [Google Scholar] [CrossRef]
  20. Dong, S.; Samsonov, S.; Yin, H.; Ye, S.; Cao, Y. Time-series analysis of subsidence associated with rapid urbanization in Shanghai, China measured with SBAS InSAR method. Environ. Earth Sci. 2014, 72, 677–691. [Google Scholar] [CrossRef]
  21. Zhang, L.; Ding, X.; Lu, Z. Modeling PSInSAR time series without phase unwrapping. IEEE Trans. Geosci. Remote Sens. 2010, 49, 547–556. [Google Scholar] [CrossRef]
  22. Bao, J.; Luo, X.; Liu, G.; Chang, L.; Wu, S. An improved distributed scatterers extraction algorithm for monitoring tattered ground surface subsidence with DSInSAR: A case study of loess landform in Tongren county. Int. J. Appl. Earth Obs. 2021, 99, 102322. [Google Scholar] [CrossRef]
  23. Liu, Z.; Qiu, H.; Zhu, Y.; Liu, Y.; Yang, D.; Ma, S.; Zhang, J.; Wang, Y.; Wang, L.; Tang, B. Efficient identification and monitoring of landslides by time-series InSAR combining single-and multi-look phases. Remote Sens. 2022, 14, 1026. [Google Scholar] [CrossRef]
  24. Li, Y.; Yang, K.; Zhang, J.; Hou, Z.; Wang, S.; Ding, X. Research on time series InSAR monitoring method for multiple types of surface deformation in mining area. Nat. Hazards 2022, 114, 2479–2508. [Google Scholar] [CrossRef]
  25. Chen, Y.; Yu, S.; Tao, Q.; Liu, G.; Wang, F. Accuracy verification and correction of D-InSAR and SBAS-InSAR in monitoring mining surface subsidence. Remote Sens. 2021, 13, 4365. [Google Scholar] [CrossRef]
  26. Zhu, J.; Yang, Z.; Li, Z. Recent progress in retrieving predicting mining-induced 3D displacements using, InSAR. Acta Geod. Cartogr. Sin. 2019, 48, 135. [Google Scholar] [CrossRef]
  27. Yang, Z.; Li, Z.; Zhu, J.; Wang, Y.; Wu, L. Use of SAR/InSAR in mining deformation monitoring, parameter inversion, and forward predictions: A review. IEEE Geosci. Remote Sens. Mag. 2020, 8, 71–90. [Google Scholar] [CrossRef]
  28. Wang, R.; Wu, K.; He, Q.; He, Y.; Gu, Y.; Wu, S. A novel method of monitoring surface subsidence law based on probability integral model combined with active and passive remote sensing data. Remote Sens. 2022, 14, 299. [Google Scholar] [CrossRef]
  29. Yang, L. Discussion on random medium theory. Mine Surv. 1987, 2, 32–34+29. [Google Scholar]
  30. Liu, B.; Liao, G.; Yan, R. Electrical simulation calculation of rock movement. Mine Surv. 1981, 2, 40–44. [Google Scholar]
Figure 2. Location map of the 1034 working face.
Water 16 01002 g002
Figure 3. (a) RTK to measure the surface elevation and sonar to detect the underwater terrain. (b,c) RTK field measurement map.
Water 16 01002 g003
Figure 4. Flow chart of underwater terrain inversion method.
Water 16 01002 g004
Figure 5. D-InSAR workflow.
Water 16 01002 g005
Figure 6. Schematic diagram of waterlogging extraction.
Water 16 01002 g006
Figure 7. Diagram of surface movement calculated by PIM.
Water 16 01002 g007
Figure 8. The basic steps of GA for inversing the parameters of the PIM.
Water 16 01002 g008
Figure 9. Subsidence evolution diagram of the working face.
Water 16 01002 g009aWater 16 01002 g009b
Figure 10. Waterlogging evolution diagram of the working face.
Water 16 01002 g010
Figure 11. Using the subsidence boundary to invert the underwater terrain on 8 August 2020.
Water 16 01002 g011
Figure 12. 3D schematic of the subsidence area.
Water 16 01002 g012
Figure 13. Comparison of measured data with predicted data.
Water 16 01002 g013
Figure 14. Main section profile of underwater terrain map trend at different times after stable subsidence.
Water 16 01002 g014
Figure 15. Different subsidence boundaries’ simulation diagram.
Water 16 01002 g015
Figure 16. (ad). Comparison of four parameters with actual values under different subsidence boundary information.
Water 16 01002 g016
Figure 17. Subsidence waterlogging area in different periods in the study area.
Water 16 01002 g017
Figure 18. Evolution diagram of waterlogging as the working face advances.
Water 16 01002 g018
Figure 19. Waterlogging volume and evaporation, precipitation, groundwater depth, maximum subsidence value change chart.
Water 16 01002 g019
Table 1. Geological and mining conditions of the 1034 working face.
Working Face NameMining Time (Year/Month)Strike Length/mDip Length/mAverage
Inclination/°
Average Thickness/mAverage
Buried Depth/m
Mining
Thickness
1034September 2018 to August 2019753.73132223.44203400
Table 2. Satellite image parameters.
SatelliteProduct TypeImaging ModePolarization ModeReplay
Cycle
BandNumber of ScenesTime RangeResolution
/m
Wave Length/cm
Sentinel-1ASLCIWVV12 dC58June 2018 to September 20205 × 205.6
Table 3. The range and precision of the predicted parameters of the PIM.
The Parameters of the PIMNormal RangePrecision
q0.01~1.40.01
tan β 1.0~3.00.01
θ 70~90°0.1
S −30~400.1
Table 4. Main parameter information.
Subsidence Factor  q Tangent of Major Influence Angle  tan β  Main Propagation Angle  θ Offset of the Inflection Point S
0.911.8086.259.8
Table 5. 1034 working face inversion results on August 8, 2020.
Maximum Subsidence Value/mmHeight of the Waterlogging Boundary from the Surface/mmMaximum Water Depth/mmVolume of the Subsidence Area/m3Waterlogging Area/m2Waterlogging Volume/m3
1357526831189,978107,62297,726
Table 6. Errors between the inversion method and traditional method.
Inversion MethodTraditional Method
RMSERelative ErrorRMSERelative Error
Water depth/mm99 mm9.9%182 mm18.2%
Table 7. Waterlogging information during different periods.
DateWater Depth/mmWater Volume/m³Water Area/m2Subsidence Area
Volume/m³
9 June 202054222,51526,848189,715
3 July 202061748,76753,984189,825
8 August 202083197,726107,622189,978
1 September 2020867163,826181,540189,715
Table 8. Inversion information of parameters at different periods after stable subsidence.
Date q tan β θ S
9 June 20200.9011.8086.069.95
3 July 20200.9001.8086.009.86
8 August 20200.911.8086.259.80
1 September 20200.9071.8086.0010
Table 9. Experimental results of predicted parameters under different subsidence boundaries.
Inversion
Parameter
Information
Eliminate 10%Eliminate 20%Eliminate 30%Eliminate 40%Eliminate 50%Eliminate 60%Eliminate 70%Eliminate 80%
q 0.9010.9000.9000.9000.9000.9020.9020.955
tan β 1.801.821.811.811.801.811.821.80
θ 86.0686.0086.5786.0086.0086.2586.1390.00
S 9.959.5410.009.999.999.889.895.71
Table 10. Underwater spatial information of waterlogging during different periods.
DateMaximum
Subsidence Value/mm
Water Depth/mmWater
Volume/m³
Water Area/m2Subsidence Area Volume/m³Working Face
Advance
Distance/m
24 September 2018000000
29 December 201810000011,040314
23 March 201945500031,010542
27 June 201977700067,169736
1 October 20191218000145,025748
17 January 20201263000160,987748
4 May 20201325000180,086748
9 June 2020135554222,51526,848189,715748
3 July 2020135661748,76753,984189,825748
8 August 2020135783197,726107,622189,978748
1 September 20201355867163,826181,540189,715748
7 October 2020135652618,87617,284189,825748
12 November 2020135747073457375189,978748
6 December 2020135750312,01211,292189,978748
11 January 20211357000189,978748
4 February 20211357000189,978748
12 March 20211357000189,978748
5 April 20211357000189,978748
4 May 20211357000189,978748
4 June 20211357000189,978748
10 July 20211357000189,978748
Disclaimer/Publisher’s Note: The statements, opinions and data contained in all publications are solely those of the individual author(s) and contributor(s) and not of MDPI and/or the editor(s). MDPI and/or the editor(s) disclaim responsibility for any injury to people or property resulting from any ideas, methods, instructions or products referred to in the content.

