Article

Study on Multi-Measures Joint Optimization Regulation of Temperature Control and Ice Melting for Water Conveyance Projects in Cold Regions

1
State Key Laboratory of Hydraulic Engineering Simulation and Safety, Tianjin University, Tianjin 300072, China
2
School of Civil Engineering, Tianjin University, Tianjin 300072, China
3
Institute of Ocean Energy and Intelligent Construction, Tianjin University of Technology, Tianjin 300382, China
*
Author to whom correspondence should be addressed.
Water 2024, 16(7), 1039; https://doi.org/10.3390/w16071039
Submission received: 10 March 2024 / Revised: 1 April 2024 / Accepted: 2 April 2024 / Published: 4 April 2024
(This article belongs to the Special Issue Restoration Methods and Planning Techniques for River Ecology)

Abstract

:
In order to realize the goal of ice-free water conveyance in the winter for water conveyance projects in cold regions, the operation principle of ice-free water conveyance through channels is described based on the two ice-melting measures of a solar heating gallery and heated storage tank. Based on the multi-year meteorological data and the theory of a product probability event, the concept of a “comprehensive satisfaction rate” was proposed, and then the joint optimal regulating model under two ice-melting measures was established, and the genetic algorithm was used to solve the problem, which solved the important limitations of the economic and efficiency optimization of different ice-melting measures. This paper applies this model to the Zhanghe control gate–Mangniuhe control gate section of the middle route of the South-to-North Water Transfer Project. According to the optimization analysis of a large number of operating conditions, the operating costs of the ice-melting measures have also increased with the increase in the comprehensive satisfy rate. In the operation process, the water temperature along the lines presents a “ladder-like” shape. The average hourly flow and average hourly water temperature of the heated water storage tank have the characteristics of overall unity and local complementarity. With the increase in the water flow and downstream depth before the gate, its operating cost also increases. The increase in the flow velocity at the same time can increase the heat transfer efficiency, reducing the operating costs. In addition, the water temperature of the channel with a solar heating gallery decreased more slowly than that without a solar heating gallery due to its good thermal insulation effect.

1. Introduction

China is a nation with an unbalanced distribution of water resources, low average per capital water resources, and serious water shortage [1]. Therefore, the Chinese government has built many water conveyance projects, such as the South–North Water Transfer Project and the Luanhe Tianjin Water Diversion Project. However, in the face of water conveyance projects in regions affected by cold weather in the winter, different degrees of ice conditions will occur in the channels [2,3], and the duration of freezing is generally as long as 1 to 3 months, seriously affecting the safety of the channels [4]. To ensure the safe operation of the projects, water conveyance under the ice cover is usually used, but this method greatly reduces the water flow. For example, in this method, the water flow of the Middle Route Project of the South-to-North Water Transfer Project in the winter is 43% of the design condition, which causes great tension in the water demand. In this context, completing water conveyance projects in cold regions without ice and with a large flow in the winter has become an attractive idea.
Although researchers have had similar ideas of realizing ice-free water conveyance through channels in the winter, there are still few studies and applications regarding the technology, only some theoretical and practical explorations. From the perspective of regulation methods, the types of ice-free water conveyance can be roughly divided into two types: the hydraulic regulation method and thermodynamic method. Liu et al.’s [5] study, which was based on hydraulics for open channels, used the principle of combining the flow of feedforward control and the water level of feedback control to control the gates’ operation and established a simulation model for the winter operation of multiple-series channel sections. The proposed transition mode from an open channel water conveyance state to a low-flow ice state was tested on the MATLAB platform, and the results showed that the model can achieve the expected goals. Mu and Chen et al. [6] applied the theories of hydraulics, ice-water mechanics, and heat transfer to build a one-dimensional water conveyance model for the main canal of the middle route of the South-to-North Water Transfer Project during the ice period. Through a numerical simulation, it was found that if the gates along the middle route did not participate in hydraulic control, the water level and flow would fluctuate greatly. However, due to the high technical requirements of the hydraulic regulation method and the difficulty of realization, the thermodynamic method is considered the main research direction. Thermodynamic methods mainly include the heating method and heat preservation method. The currently proven and widely used method for increasing the water temperature is groundwater injection, which involves injecting groundwater along the lines to increase the water body’s heat and temperature. For example, the Hongshanzui Power Station on the southern edge of the Zhunge’er Basin in China has successively drilled wells along the lines to extract high-temperature underground water and inject it into the channel, so that the channel can transport water without ice for a long time (in Figure 1). In addition, the use of a heat preservation method to achieve ice-free water conveyance has also been widely explored. According to the theory of heat transfer, Mu et al. [7] analyzed the heat exchange process of the water body after laying the insulation cover plate and introducing it into the water conveyance model during the ice period to simulate the ice conditions in northern Xinjiang. Wang and Zhang et al. [8] proposed a measure to solve the problem of ice damage during the winter operation of water conveyance channels in cold areas, namely insulation film floating on the water surface. It can effectively melt the ice and prevent the channel from freezing under the condition of full radiation. The above measures generally have the characteristics of a complex operability, poor practicality, and limited applicability, so people are gradually starting to learn from other disciplinary fields for cross-research.
With the progress in the research on thermal insulation material technologies and the development of renewable energy, the use of clean energy such as solar energy and geothermal energy to achieve ice melting in canals has attracted more and more attention [9,10]. In recent years, China has comprehensively promoted the large-scale and high-quality development of wind power and solar power and accelerated the green and low-carbon transformation of its energy system [11]. The United States has adopted ITC and PTC policies to promote the rapid growth of the total photovoltaic installation capacity and vigorously develop renewable energy technologies to achieve the sustainable development of resources [12]. Last year, the European Association released the “Global Solar PV Market Outlook 2021–2025”, which shows the great prospects of solar energy and other renewable energy developments [13]. People are beginning to turn their attention to the integration of water conveyance projects and renewable energy. As shown in Figure 2, the photovoltaic panel is laid on the water conveyance channel. Some researchers [14,15] conducted technical and economic feasibility studies on solar photovoltaic panels installed in water conveyance channels. Ma et al. [16] proposed the multi-objective decision model for the feasibility assessment of WSPV systems of long-distance water conveyance projects and applied it to typical projects in China to demonstrate the effectiveness of the modeling framework, while also exploring the co-benefits of WSPV systems. The University of California, Merced, the Turlock Irrigation District, the Department of Water Resources, and Solar Aquagrid have just entered into a partnership to place solar panels on channels that can benefit from shade through a project called Nexus [17]. To improve the utilization efficiency of solar energy, Wolf [18] first proposed the solar energy utilization technology of the PV/T complementary system in the 1970s. The technology converts part of the solar energy into electricity through solar panels, and then converts the rest of the solar energy into heat energy for power generation, heating, cooling, and seawater desalination. Studies have shown that the solar energy utilization efficiency of the PV/T system can reach 60–80%. In Chow et al.’s [19] review of PV/T technologies, experiments and outdoor studies showed that water-cooled PV/T systems may have a thermal performance comparable to conventional solar thermal collectors. The air-cooled PV/T system provides the possibility for the channel to melt ice during the winter. Rounis et al. [20] conducted experimental studies of single- and multi-entry BIPV/T systems under different climatic and wind conditions, comparing their electrical and thermal performances and photovoltaic temperature distributions. It was found that the comprehensive efficiency of a multi-entry BIPV/T system can reach 63%. Ji [21] combined PV/T photovoltaic panels, insulation cover plates, and ventilation ducts to form a heating gallery and simulated the work of laying in the water conveyance channel by using Fluent 16.0. At the same time, it also optimized the form of the ventilation duct outlets and the pipeline layout. The results showed that the air layer temperature between the water body and the corridor can be greatly increased, and heat loss of the water body can be reduced.
Meanwhile, various ice-melting measures have also been widely studied. Ban et al. [22] made full use of the solar energy resources in Tibet and made a solar heat-collecting inflatable bag with a black polymer heat-absorbing material. Multiple inflatable bags were arranged horizontally to form a plate structure and laid on the channel. The water temperature in the channel increased, and the anti-ice effect was obvious. Carbonell et al. [23] combined solar collectors with heat pumps to develop a mathematical model of deicing an ice storage tank using heat exchange and validated the main variables such as the outlet temperature, heat transfer, ice production, and ice melting under several operating modes. In addition, the development and utilization of geothermal energy is also a way to better the ice-melting effect. Drawing high-temperature groundwater can not only transport heat to the channel, but also plays a certain role in replenishing water. Under normal circumstances, the water capacity of the underground reservoir is large, and the water temperature is generally higher than 10 °C, which provides the feasibility for the channel water to melt ice. Zhang [24] built a three-dimensional hydrodynamic and thermal transport model of the Xingtai Baiquan underground reservoir and analyzed the effects of the well depth, continuous pumping and irrigation time, permeability coefficient and initial reservoir water level on pumping, and irrigation capacity, and combined with the process of the middle route of the South-to-North Water Transfer Project, used a genetic algorithm to optimize the pumping and irrigation schemes under the well group model to realize ice-free water transport through channels. Some studies have found that photovoltaic systems can not only insulate channels and generate electricity in the winter [25], but also reduce water surface evaporation [26,27] and inhibit algae growth [28,29], thus saving water resources and protecting the ecological environment. Ye et al. [30], taking the Middle Route Project of the “South-to-North Water Diversion Project” as an example, used measured data and a PV system model to evaluate the technical and economic feasibilities of a channel photovoltaic system under the two schemes, and found that the photovoltaic system can bring good economic and environmental benefits and is worth promoting in the future.
After determining the location and scale of each ice-melting measure, facing the complex winter meteorological environment, learning how to inject energy into the channel by regulating the ice-melting measures (such as water temperature, flow, etc.) to achieve ice-free water conveyance can be difficult. In the whole regulation process, there are too many factors and objectives to be considered [31,32], which are not easy to determine. At the same time, it is also necessary to select suitable optimization algorithms to seek the optimal solution. The various ice-melting measures and channel as a whole, considering the weather, cost, and other factors to carry out multi-faceted and multi-level optimization, are used to find comprehensive and implementable solutions to achieve the goal of ice-free water conveyance. In the past few decades, a great deal of research has focused on the numerical simulation of ice-water mechanics and the optimization of water and energy distribution, and there is little research on regulating ice-melting measures. Makhdoomi and Askarzadeh [33] used the CSAAC-AP algorithm to optimize the operation of the hybrid energy system consisting of PV cell diesel generators, and PHS. The simulation results showed that the proposed CSAAC-AP has a higher accuracy and robustness than the GA, PSO, and original CSA. Edwards and Finn [34] proposed a control strategy to predict the optimal flow of ground-source heat pumps under a partial load operation. Using this strategy, the optimal flow can be calculated based on the available design data and minimal online measurement data. Through the verified simulation models of single-speed and series-speed ground-source heat pumps, the optimal control strategy is evaluated in heating and cooling modes, respectively. Das and Zaman [35] built a hybrid optimization model for renewable energy and analyzed the impact of PV, diesel, and Batt systems on the NPC and COE under different regulating strategies. The results indicated that the Combined Dispatch strategy has a slightly lower cost of energy compared to the Load Following and Cyclic Charging strategies. Kusakana [36] developed an optimal operation model for the hybrid diesel–PV pumping system that optimally manages the flow generated by PV cell and groundwater pumping reservoirs based on the variable load demand and the availability of solar resources.
In general, most current studies only consider clean energy utilization or safe water conveyance for channels in the winter, and there is lack of research on winter ice-melting technologies based on clean energy and intelligent optimization algorithms. Therefore, it remains to be further explored how to optimize the regulation to achieve ice-free water transport by adopting various ice-melting measures.
In this study, based on the feasibility of installing solar photovoltaic panels in the water conveyance channel, the water temperature of the channel is regulated by laying a solar heating gallery and jointly heating water storage tanks to realize ice-free water conveyance in the winter. In this paper, the Zhanghe River control gate–Mangniu River control gate in the north section of the middle route of the South-to-North Water Transfer Project is taken as the research object, and the basic principle of melting ice in the solar heating gallery and the heated water storage tank and the process of melting for the channel are expounded. Then, based on the probability density of the meteorological data, the concept of a “comprehensive satisfaction rate” is proposed, and a mathematical model for the optimal regulation and operation of various ice-melting measures is constructed, and the optimal solution is sought step by step by using a genetic algorithm. Finally, according to the above model and method, the influence of different comprehensive satisfaction rates, the water flow, and downstream depth before the gate on the optimal operation of ice-melting measures is analyzed, and the relationship expression between each factor is obtained. At the same time, combined with the above results, the relevant corresponding operating costs were compared and analyzed, and the scientific feasibility of the regulating process of each ice-melting measure was analyzed, which provided technical guidance for the safe and efficient operation of ice-free water conveyance in the winter for water conveyance projects in cold regions.

2. Method

2.1. Basic Principles of Ice-Melting Measures

Considering the feasibility and operability of ice-melting measures combined with the actual project, this paper mainly chose two kinds of ice-melting measures: a solar heating gallery and heated water storage tank, and the operation principles of the two ice-melting measures and how to achieve ice-free water conveyance using channels are described in detail in this chapter.

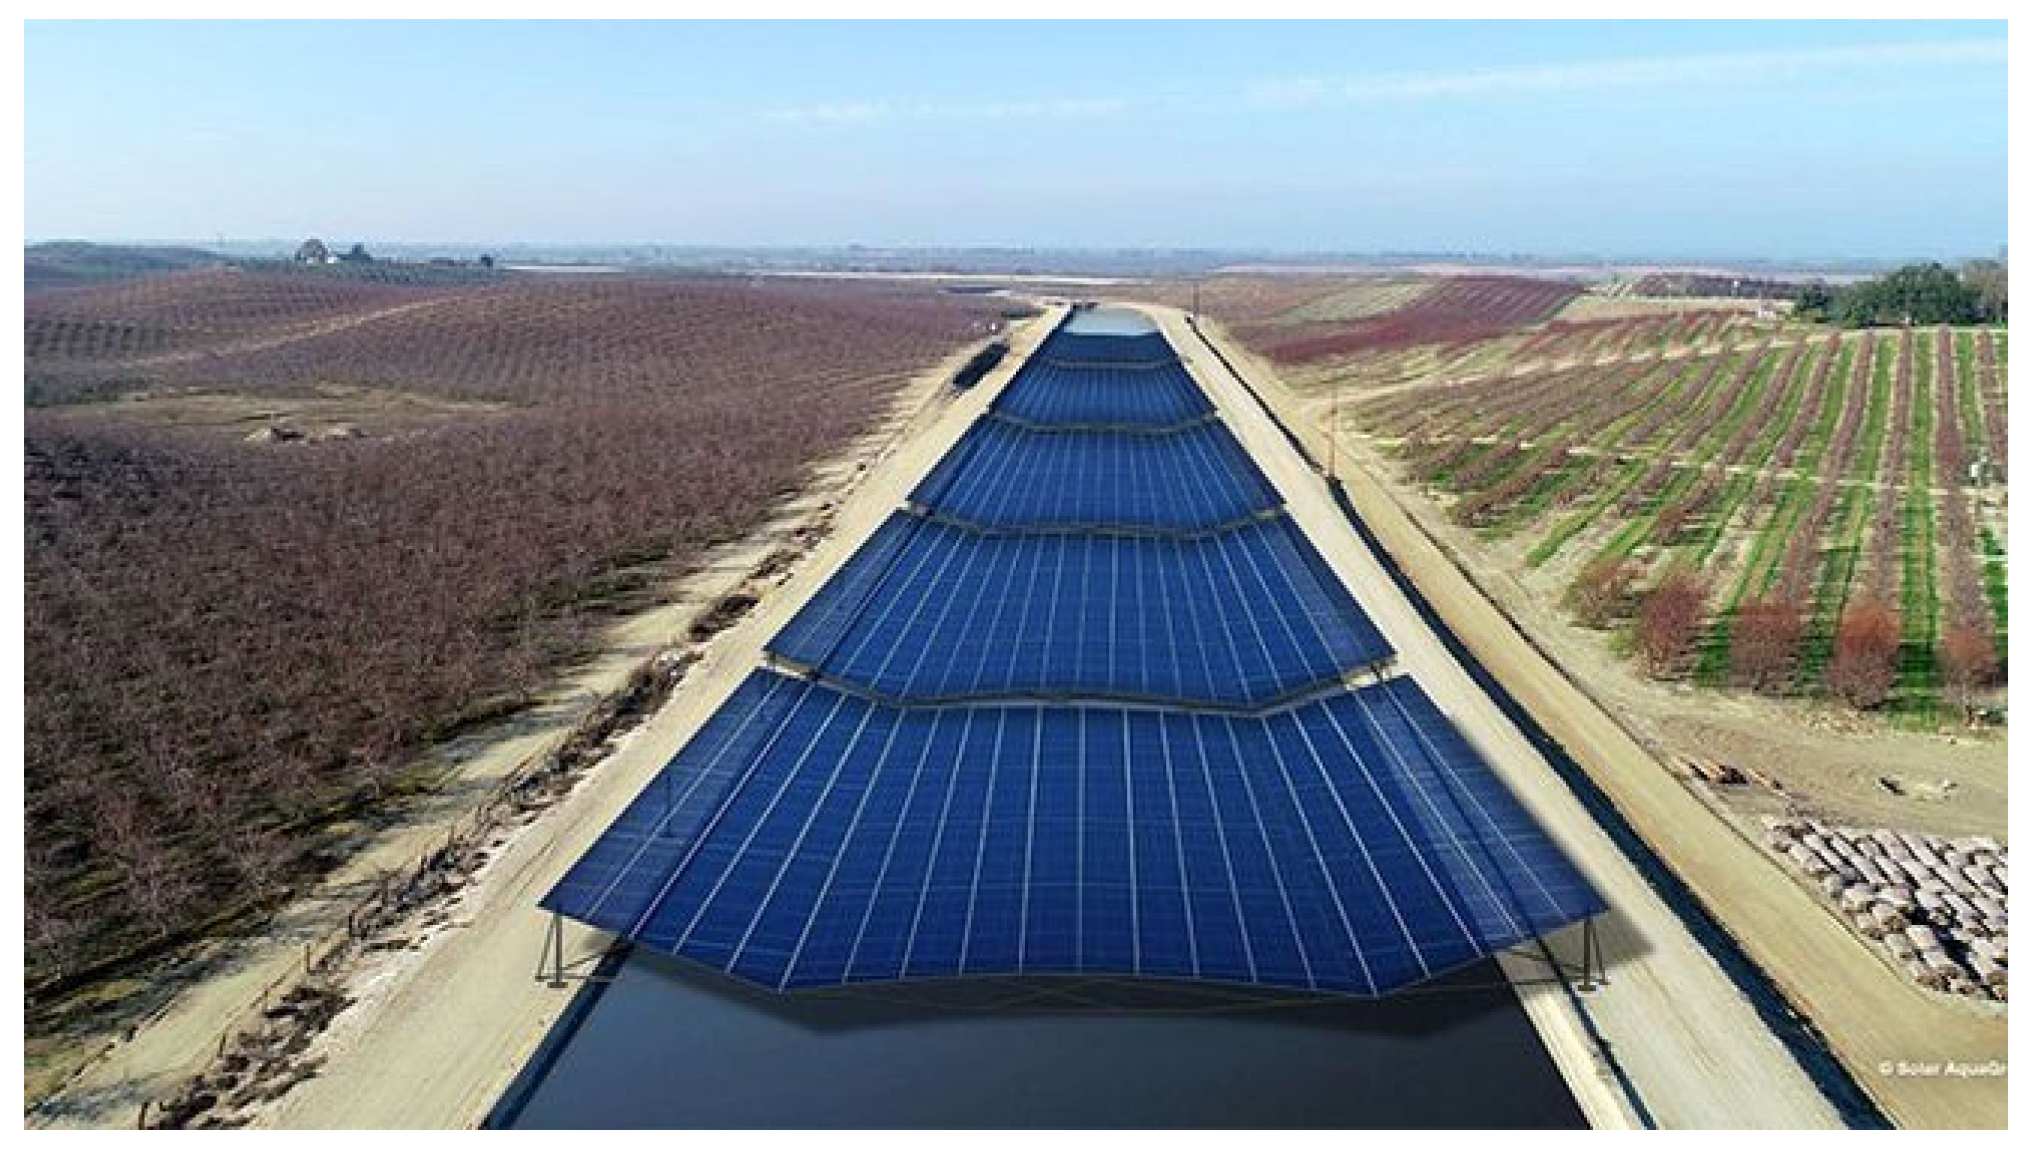
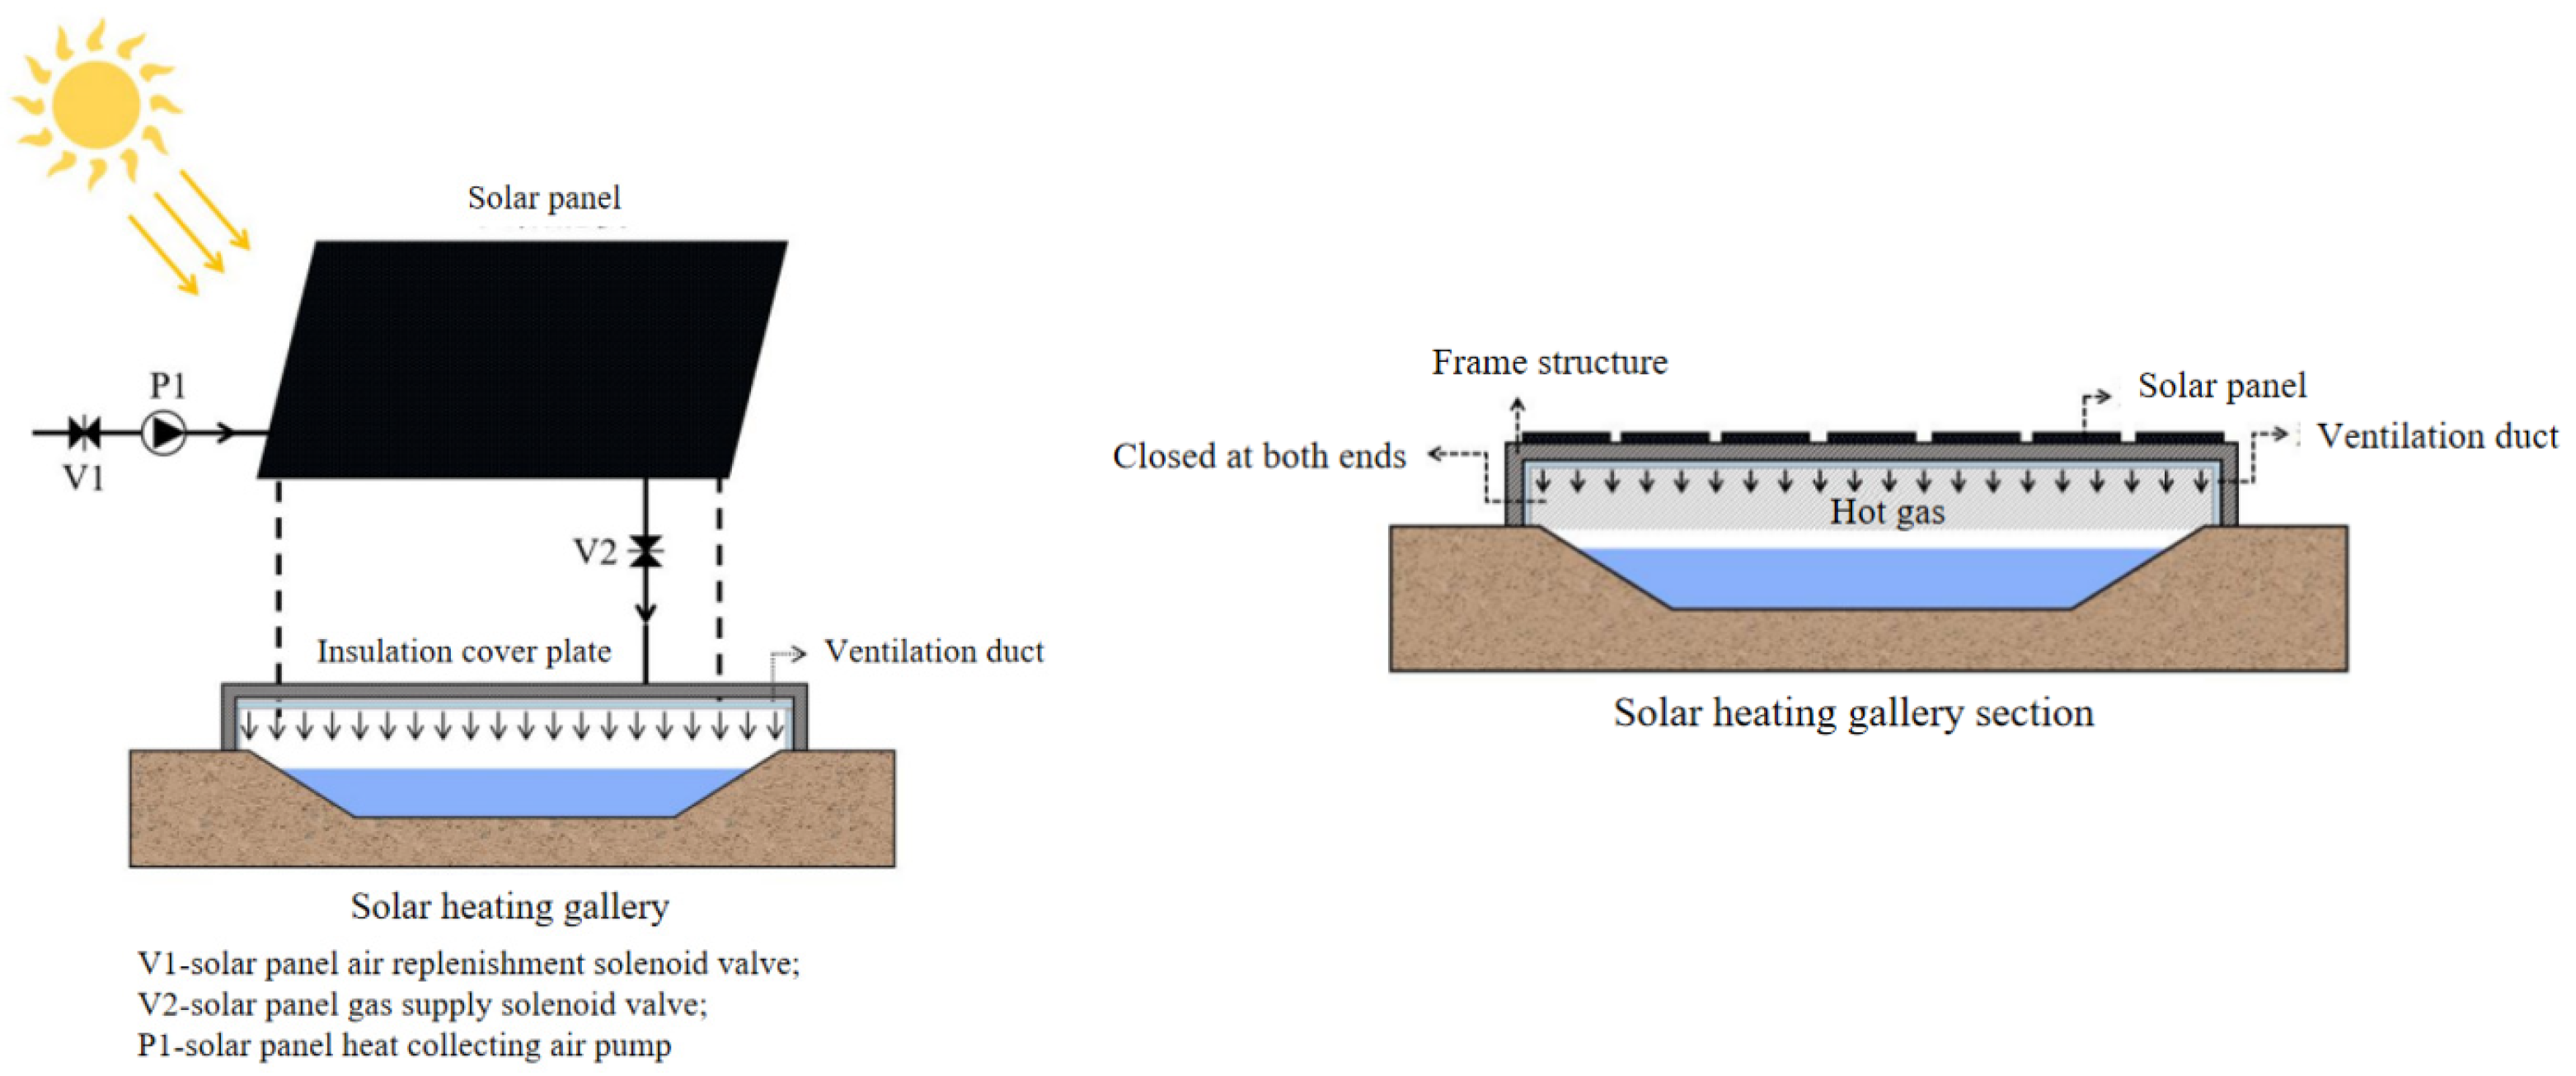
2.1.1. Solar Heating Gallery

At present, many types of photovoltaic panels have been developed and applied. Considering that the solar energy conversion efficiencies of the separate light–electricity or light–heat utilization technologies are low, PV/T air solar panels, which have a high solar energy conversion efficiency, are widely used. The structure of the PV/T air solar panel is shown in Figure 3, which is mainly composed of six parts: a transparent cover plate, photovoltaic panel, heat-absorbing panel, thermal insulation cotton, backplane, and shell. Its operating principle is mainly divided into two aspects: on the one hand, when the sun shines on the surface of the solar panel, the photovoltaic panel will convert the solar radiation through the transparent cover into direct current electricity, which is stored in the battery through the photovoltaic effect; on the other hand, the heat-absorbing panel absorbs the remaining solar radiant energy and converts it into heat energy, which is transmitted to the working medium (air) in the fluid channel so that the temperature of the cold air entering from the fluid inlet gradually increases, and finally, turns into hot air to take away the heat energy and use it. The specific working principle of PV/T air solar panels is shown in Figure 3.
When the solar panel islaid, the solar heating gallery is formed together with the cover plate, air runner, air pump, and other equipment. The solar heating gallery is laid on the channel, as shown in Figure 4. During the operation of the solar heating gallery, the solar panel first absorbs solar radiant energy and converts it into heat energy carried by the heat transfer medium (air). Then, the heated heat transfer medium is transported to the closed structure above the channel through the air runner to improve the temperature of the air layer in the closed structure, thereby increasing the temperature of the water body in the channel and achieving the purposes of temperature increase and temperature control.
The core of the whole device is used to increase the temperature of the air layer in the heating gallery, which exchanges heat with the water body, thus affecting the water temperature. Therefore, by taking the air layer in the heating gallery as the research object, the heat conduction between the air layer and the inner surface of the insulation cover plate, the convective heat transfer with the water surface, the mass exchange of the original air, and the injection of hot gas are considered. According to the previous research results, in this paper, the ventilation duct design with two slits and 2.5 m pipe spacing is adopted. The core temperature calculation formula is shown as follows [21]:
T h = { 0.23 + 0.721 T a i r , 0 t 7 4.531 + 1.05 T a i r + 0.0105 G 2.297 v a 4.083 + 0.871 T a i r , 17 t 23 , 7 t 17
where T h is the temperature of the air layer in the heating gallery, °C; T a i r is the environmental temperature, °C; G is the intensity of solar radiation that hits the PV/T air solar panel, W / m 2 ; v a is the ventilating speed, m / s ; and t is any time of the day.

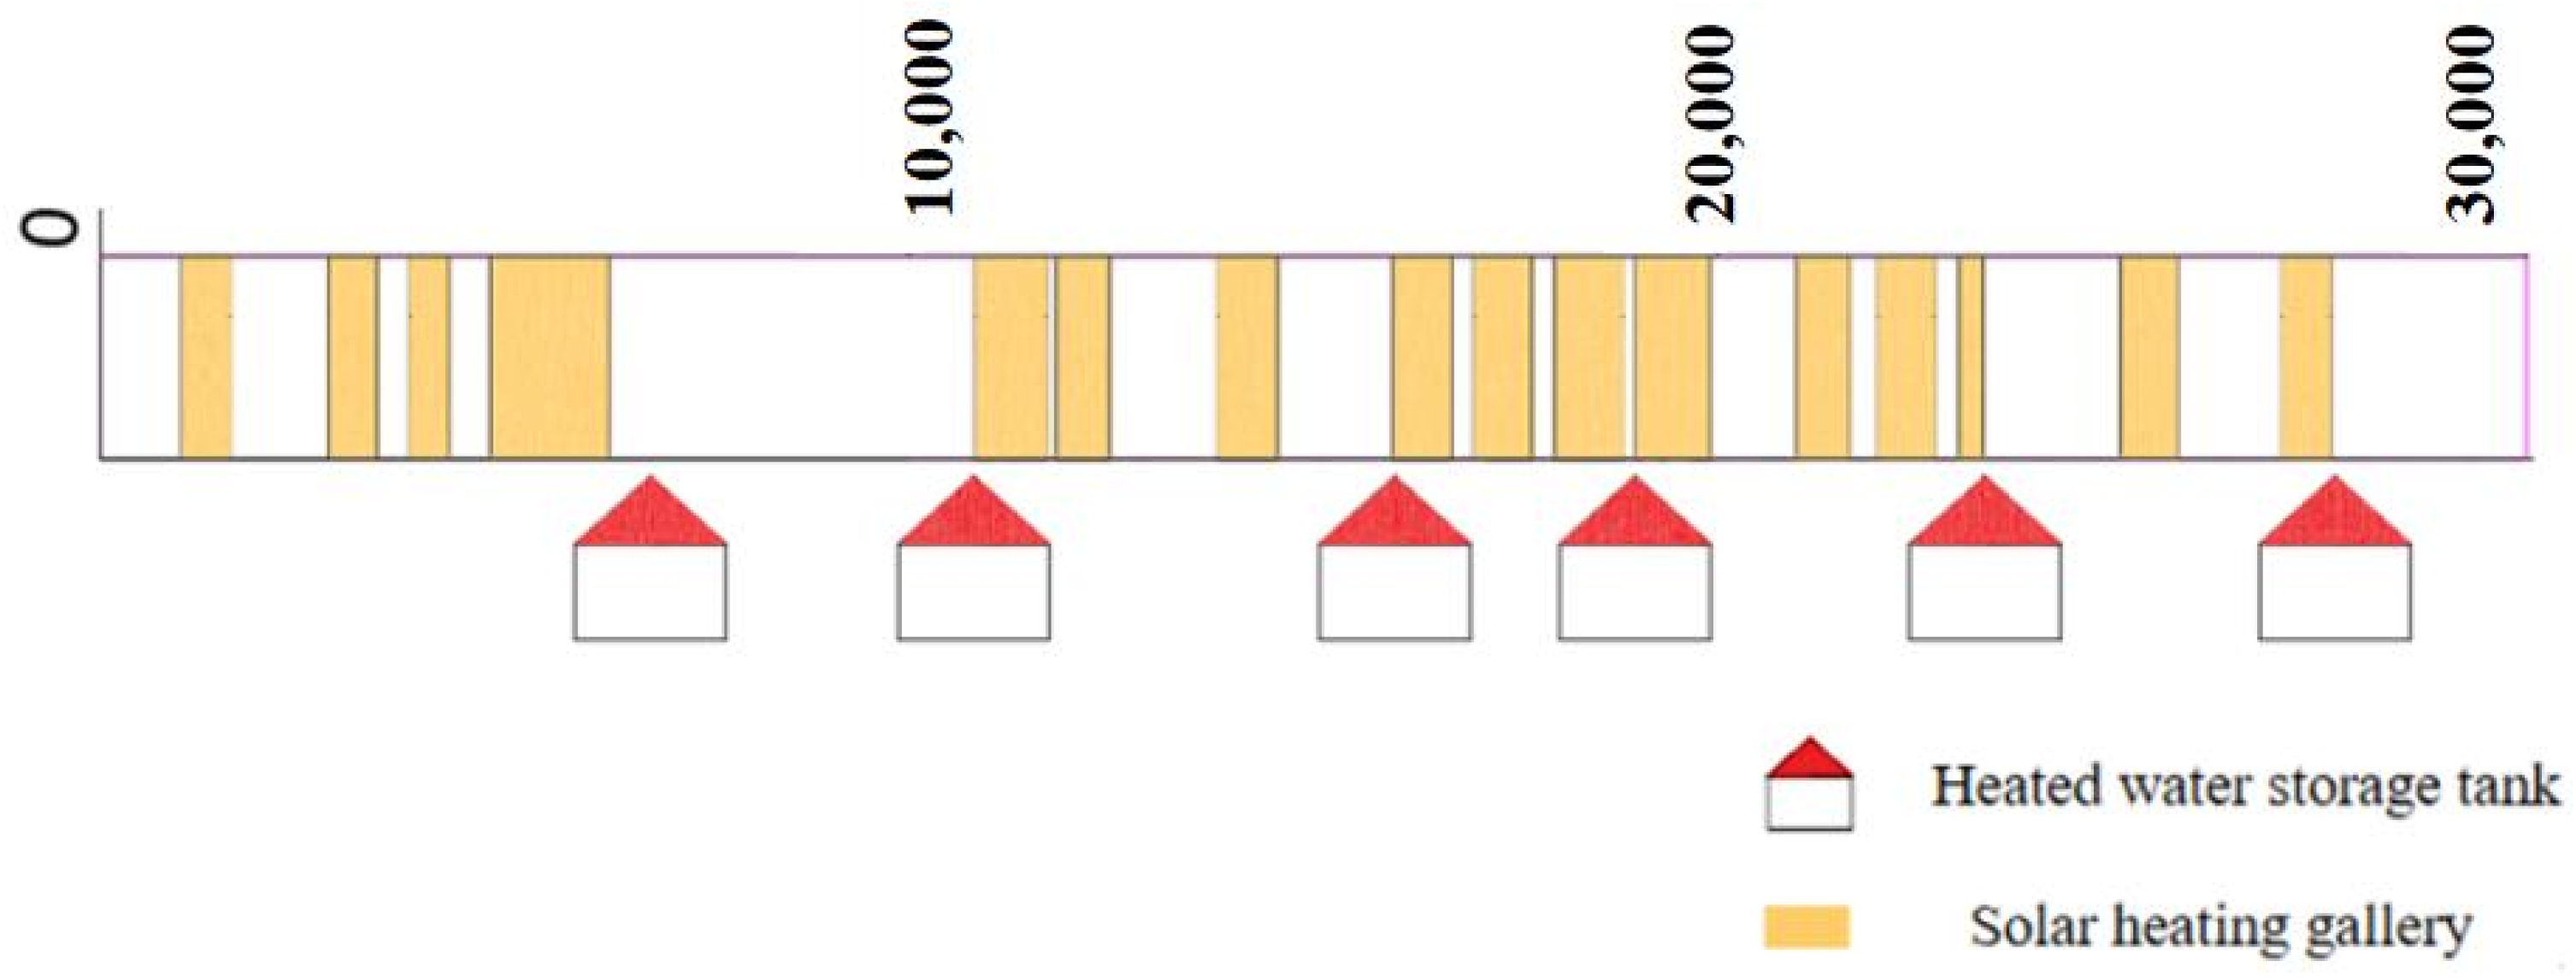
2.1.2. Heated Water Storage Tank

The electric energy generated by the solar panels in the heating gallery can be used to heat the water body. The storage tank uses the active circulation system, which can heat the cold water drawn in real time and return it to the channel. The structure of the heated water storage tank is shown in Figure 5.
When the solar heating unit operates, the solar panel first absorbs the solar radiant energy and converts it into electric energy to supply power to the electric heating rod in the water storage tank unit. The electric heating rod heats the cold water extracted from the channel by the water storage tank unit, and then injects the hot water back into the channel to mix with the cold water in the channel, so as to improve the temperature of the water body in the channel and achieve the purposes of temperature increase and temperature control. When the electricity generated by the solar panel cannot guarantee the output of hot water at the required temperature from the water storage tank unit, electricity can be taken from the power grid to heat the water in the tank, so that the water supply temperature meets the needs of temperature control. When the temperature of the water in the channel is higher than 0 °C and there is no need for temperature control, the electricity generated by solar panels can also be integrated into the power grid for grid-connected utilization.
During the heating process, the water storage tank operates in a manner of variable temperatures and a constant capacity. The heat transfer of the water in the water storage tank unit by the solar panel through the electric heating rod to the water tank, the heat loss of the water tank itself, and the heat changes caused by cold water injection and hot water outflow need to be considered. A large number of simulations have been performed for structural optimization. In this paper, a heated water storage tank with a ratio of direct bottom surface to height of 1:1 is selected, and a conical spiral electric heating rod with a diameter of 0.4 m is equipped. The core temperature calculation formula is shown as follows [21]:
T s , o u t = 2.291 × 10 7 P r Q i n
where T s , o u t is the stable outlet water temperature of the water storage tank, °C; P r is the power of the electric heating rod, W ; and Q i n is the inlet flow, m 3 / s .

2.1.3. Ice Melting in Water Conveyance Channels

For open waters without floating ice, the water temperature, ice concentration, and freezing rate of the channel will also change with the change in the external environment. If the ambient temperature decreases, the solar radiation decreases, or the wind speed increases, etc., the channel may have ice conditions, so it is assumed that the length of the interval from the calculating point at the entrance of channel to the point where the water temperature of the channel is equal to 0 °C is taken as the non-freezing length. The non-freezing length is not only related to the meteorological conditions but is also affected by hydraulic conditions and is a variable affected by many factors, as shown in Figure 6. There are many methods to calculate the length: the heat balance method, numerical simulation method, empirical formula method, etc. For the Hebei section of the middle route of the South-to-North Water Transfer Project, the research team calculated a large number of working conditions (such as the varying meteorological variables and hydraulic conditions) through the continuous equation of water temperature and frazil ice and obtained the multivariate nonlinear fitting formula [37], as shown in Equation (3).
L s = 3538.83 + 237.54 l n ( 10 5 × T i n 4.2 × 10 4 ) + 5.6 T a 3.19 v w i n d + 11.19 B + 12473.58 V + 32.85 n r o u
where, L s is non-freezing length, m ; T i n is inlet water temperature at the starting point of the channel, °C; T a is the air temperature, °C; v w i n d is the wind speed, m / s ; B is the width of the water surface, m ; V is the velocity of the flow, m 3 / s ; and n r o u is the slope coefficient.
To achieve ice-free water conveyance, the non-freezing length must be greater than or equal to the length of the channel, and if it is less than the length of the channel, corresponding ice-melting measures need to be taken. If the above two melting measures are adopted, the parameters in the formula for calculating the non-freezing length of the channel will be changed. When the solar heating gallery is laid, the actual temperature corresponds to the core temperature. The actual wind speed is equal to the difference between the velocity of the flow and the ventilation speed.
T a = T h
v w i n d = | v a v w |
Using a heated water storage tank, the inflow water temperature is equal to the temperature of the mixed flow.
T i n = α Q i n T s , o u t + ( Q Q i n ) T w Q
where, α is the selected parameter that determines whether to take corresponding ice-melting measures, α = 0   or   1 ;   Q and T w are the water flow and water temperature of channel, m 3 / s and °C.
Under normal circumstances, hydraulic structures and ice-melting measures divide a channel into multiple unit sections. To improve the calculation accuracy and speed, the non-freezing length of n unit sections is expressed, as shown in Equation (7). When L s L , it indicates that the ice-melting measures adopted can realize ice-free water conveyance in the channel.
L s = L s 1 + L s 2 + L s n
where, L s n is the non-freezing length of the unit n section, and n is the number of unit sections.

2.2. Single-Objective Function

The single-objective optimization problem is the optimal solution selected from all possible alternatives to solve the problem according to the objective function, constraints, and conditions. It is explained from the direction of a mathematical theory; that is, the problem of finding the minimum value on a given set is studied. The single-objective optimization problem can obtain the undisputed optimal solution within the specified range. In general, it can be defined in the following form:
{ min f ( x ) = f 1 ( x ) subject   to g j ( x ) 0 ,   j = 1 , 2 ,   , q h j ( x ) = 0 ,   j = q + 1 , q + 2 , , m
where x = [ x 1 , x 2 ,   , x n ] S , x is the decision variable; S is the search space range of the decision variable, satisfied by l i x i u i , 1 i n , where l i and u i are the upper and lower bound constraints of the decision variable x i ; f ( x ) is the objective function; g j ( x ) has j inequality constraints; and h j ( x ) has m q equality constraints. In addition, the feasible solution that satisfies all constraints constitutes the feasible domain of the objective function.

2.3. Genetic Algorithm

A genetic algorithm (GA) is a kind of randomized search method evolved from the evolutionary law of biology (survival of the fittest and survival of the fittest genetic mechanism). It has inherent implicit parallelism and a better global optimization ability. The probabilistic optimization method can automatically obtain and guide the optimized search space and adaptively adjust the search direction without the need for definite rules. The goal of an optimal solution process based on a genetic algorithm is to arrange the problems to be solved into strings according to certain coding rules and introduce the genetics theory. The specific steps are as follows:
Step 1: The chromosome population is initialized under certain constraints, and each chromosome is encoded with vector u . The component of vector u can be understood as a gene, which corresponds to a certain decision vector of the chromosome.
Step 2: According to the objective function value corresponding to each chromosome and the constraints, the objective function value is called the fitness value of the corresponding chromosome. The fitness value determines the fitness degree of the chromosome and also determines the useful value of the chromosome.
Step 3: The chromosomes are arranged in order from high to low according to the fitness values of the chromosomes, and the chromosomes with high fitness values are selected to generate high-quality chromosome groups for reproduction.
Step 4: Progeny chromatids are generated through basic genetic operations such as crossover and mutation, in which the progeny of chromosomes generated using mutation operations have mutant genes that their parents do not have.
Step 5: The chromosome population is updated, steps 2–4 are repeated, and when the adaptation value of each chromosome no longer changes, the global optimal solution can be output.

3. A Case Study

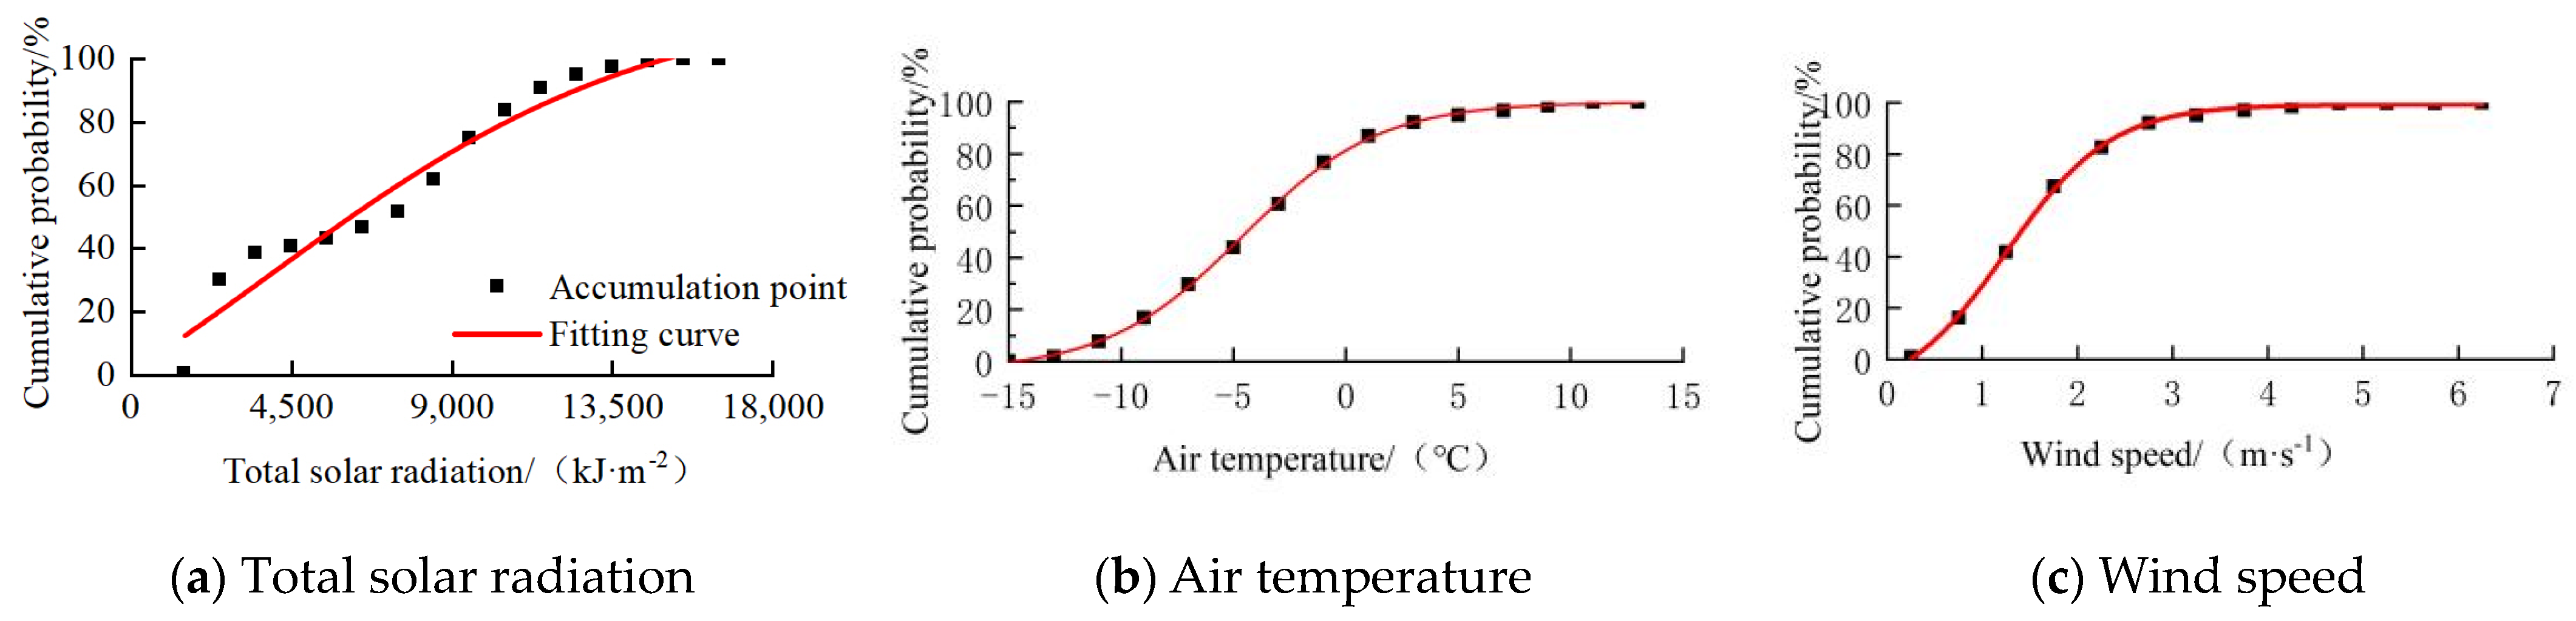
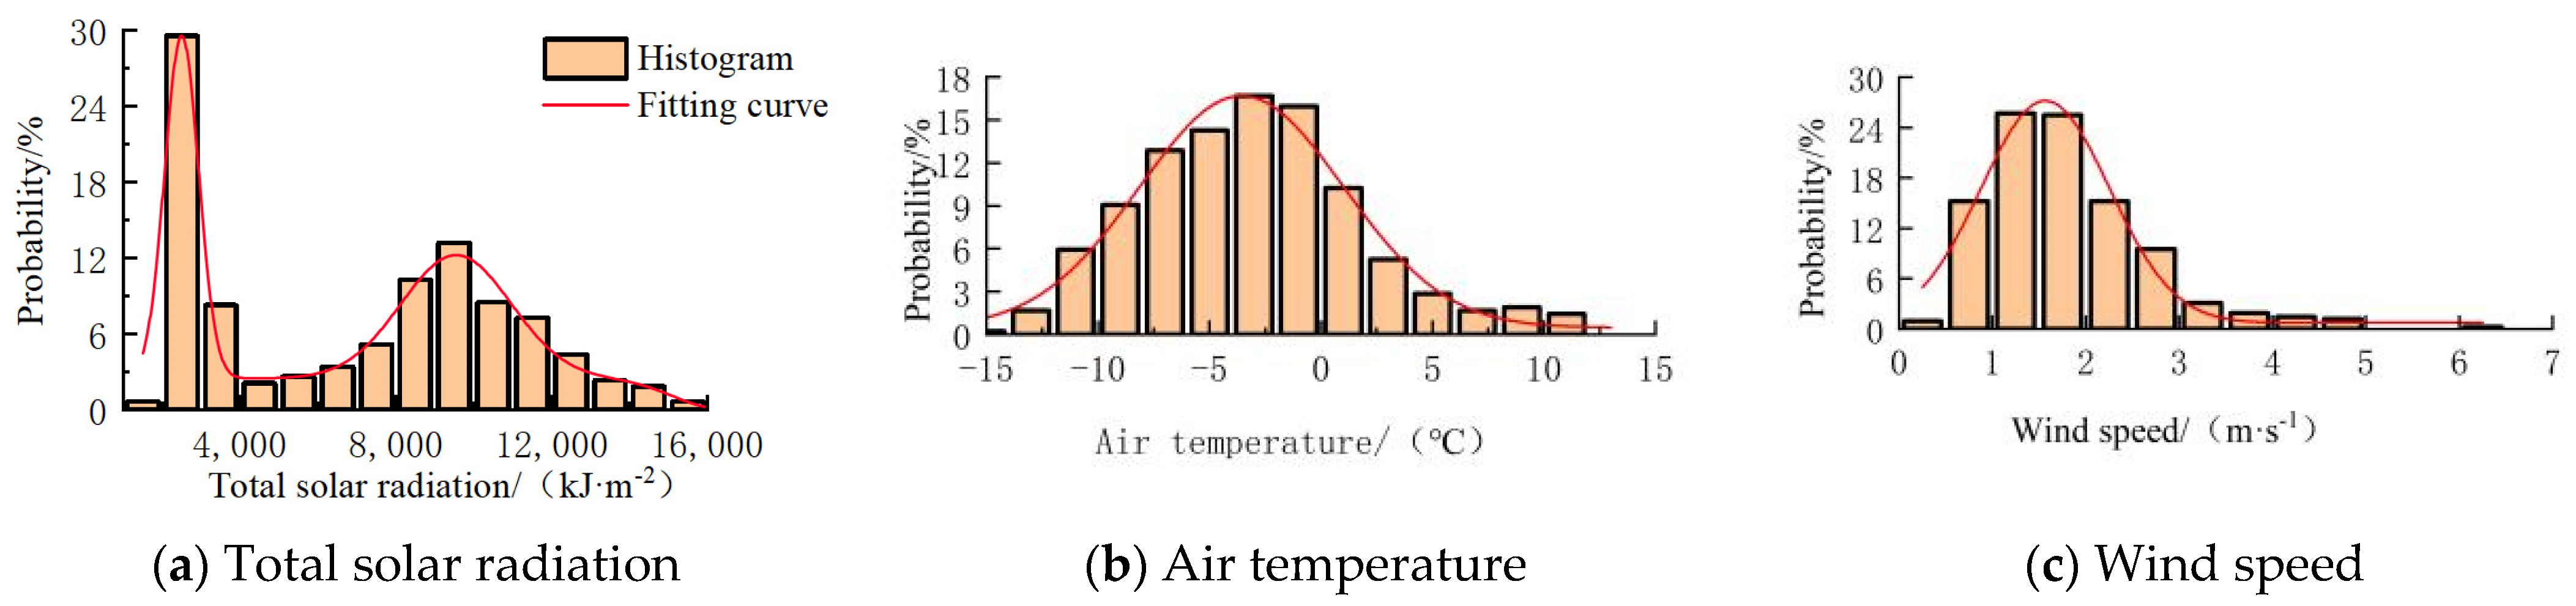
3.1. Basic Data Description

Taking the Zhanghe control gate–Mangniu control gate section in the Hebei section of the middle route of the South-to-North Water Diversion Project as the research object, the total length is 32 km . The project’s location is shown in Figure 7. This section mainly passes through HanDan, so meteorological data such as the wind speed, air temperature, and total solar radiation of Handan City from 2000 to 2018 are used. The data are from the National Meteorological Information Center and the National Tibetan Plateau Data Center [34], and the vector data and raster data are from the Geospatial Data Cloud [38] and the National Fundamental Geographic Information System [39].
The channel is divided into 34 sections, each of which is about 1000 m, except for special sections. The solar heating gallery and heated water storage tank are laid on the open channel due to the constraints of channel type, construction difficulty, and cost. Among them, six heated water storage tanks and 16.7 km of heating gallery are laid, and their specific positions and scales are shown in Table 1 and Table 2 and Figure 8.

3.2. Objective Functions and Decision Variables

The core of the optimization in this paper is not to optimize the type and position of the ice-melting measure, but to determine the best operation mode for the heating tanks by varying the temperature and flow when the specific position is determined.

3.2.1. Objective Functions

The goal is to minimize the total operating cost in the regulation process of all heated water storage tanks as follows:
F 1 = m i n i m i z e n c = 0 N C C I n Y C o s t n c
C I n Y C o s t n c = n c = 0 N C P r n c × h o u r n c × p r i c e e
where F 1 is the total operating cost of all heated water storage tanks, CNY; C I n Y C o s t n c is the operating cost of the n c heated water storage tank, CNY; N C is the number of heated water storage tanks; P r n c is the total heating and pumping power of the injection point of the n c heated storage tank, kw ; h o u r n c is the running time of the injection point of the n c heated water storage tank, h ; p r i c e e is average price per kilowatt-hour, CNY / ( kw · h ) .

3.2.2. Decision Variables

The injection flow C I n Q n c and water temperature C I n T n c from the injection point of the n c heated storage tank to the channel were taken as the decision variables.

3.2.3. Constraint Conditions

The constraints mainly include the non-freezing length, injection flow, injection water temperature, heating power, and other constraints, as follows:
(1)
Constraints on the injection flow:
C I n Q n c m i n C I n Q n c C I n Q n c m a x
Q i n i t i a l + C I n Q 1 + C I n Q 2 + C I n Q n c Q m a x
(2)
Constraints on the injection water temperature:
C I n T n c m i n C I n T n c C I n T n c m a x
(3)
Constraints on the non-freezing length of each channel:
P i l e N u m b e r i + 1 P i l e N u m b e r i L s i
(4)
Equation (3) is used to calculate the non-freezing length and node water temperature, so that the length of each redivided channel meets the conditions, then the time–history change curve of the water temperature of the whole channel can be obtained. The constraints on the heating power of the heated water storage tank are as follows:
C I n T n c = 2.291 × 10 7 P r n c C I n Q n c
P r 1 + P r 2 + P r n c P r t o t a l
where C I n Q n c m i n , C I n Q n c m a x , C I n T n c m i n , and C I n T n c m a x are the minimum and maximum of the flow and water temperature from the injection point of the n c heated water storage tank to the channel, m 3 / s and °C; Q i n i t i a l is the initial flow of the channel, m 3 / s ; Q m a x is the maximum of the design flow for the channel, m 3 / s ; P i l e N u m b e r i and P i l e N u m b e r i + 1 are the stake numbers at the i and i + 1 points in the channel; L s i is the non-freezing length of the i section of the channel due to the channel being redivided, with ice-melting measures as the dividing node,   m , i = 1 , 2 , , ( N C + N Z + 2 ) ; N Z is the number of solar heating galleries; and P r t o t a l is the total operating power of all heated water storage tanks, kw .

3.3. Model Solving Procedure

To solve the problem of finding the optimal solution of the simulation model, this paper uses MATLAB R2018b to write the genetic algorithm optimization code. In the process of modeling, a constraint processing method combining the penalty function and feasibility rule is selected, and some constraints that are easy to transform are generated using the penalty function method to generate new objective functions for processing, and the remaining constraints are used as screening conditions to generate new initial populations. Then, the calculation is carried out according to the basic steps of the genetic algorithm in Section 2.3 until the optimal regulating scheme of each heated water storage tank is selected. The optimization framework of this paper is shown in Figure 9.

3.4. Setting of the GA Optimization

In this study, the population size and maximum algebra are 80 and 500, the selection probability is 0.7, the crossover probability is 0.8, and the mutation probability is 0.05. The parameter selection of the GA algorithm not only refers to the previous research work and professional knowledge, but also makes a lot of calculations and pre-tests to achieve the best balance between the calculation time and the result accuracy. In addition, as long as the end of the evolution condition is satisfied, that is, the number of iterations meets the maximum algebra and the objective function reaches the preset requirements and tends to be stable, the evolution of the population will stop.

4. Result and Discussion

In this section, the concept of a comprehensive satisfaction rate is first introduced, and then in the first part, based on this concept, the optimization regulating process of each ice-melting measure under different comprehensive satisfaction rates is simulated, and the relationship between the satisfaction rate and operating cost is found. Then, in the second and third parts, the optimization regulating process of each ice-melting measure under different water flow rates, water levels in front of the gate, and comprehensive satisfaction rates is simulated. In the fourth part, the relationship between the water flow, downstream depth before the gate, comprehensive satisfaction rate, and operation cost is analyzed, and the corresponding relationship formula is obtained. Finally, in the fifth part, the benefits of each part of the ice-melting measure are analyzed comprehensively, so as to provide technical support for the future development prospects of ice-free water transmission in channels during the winter.

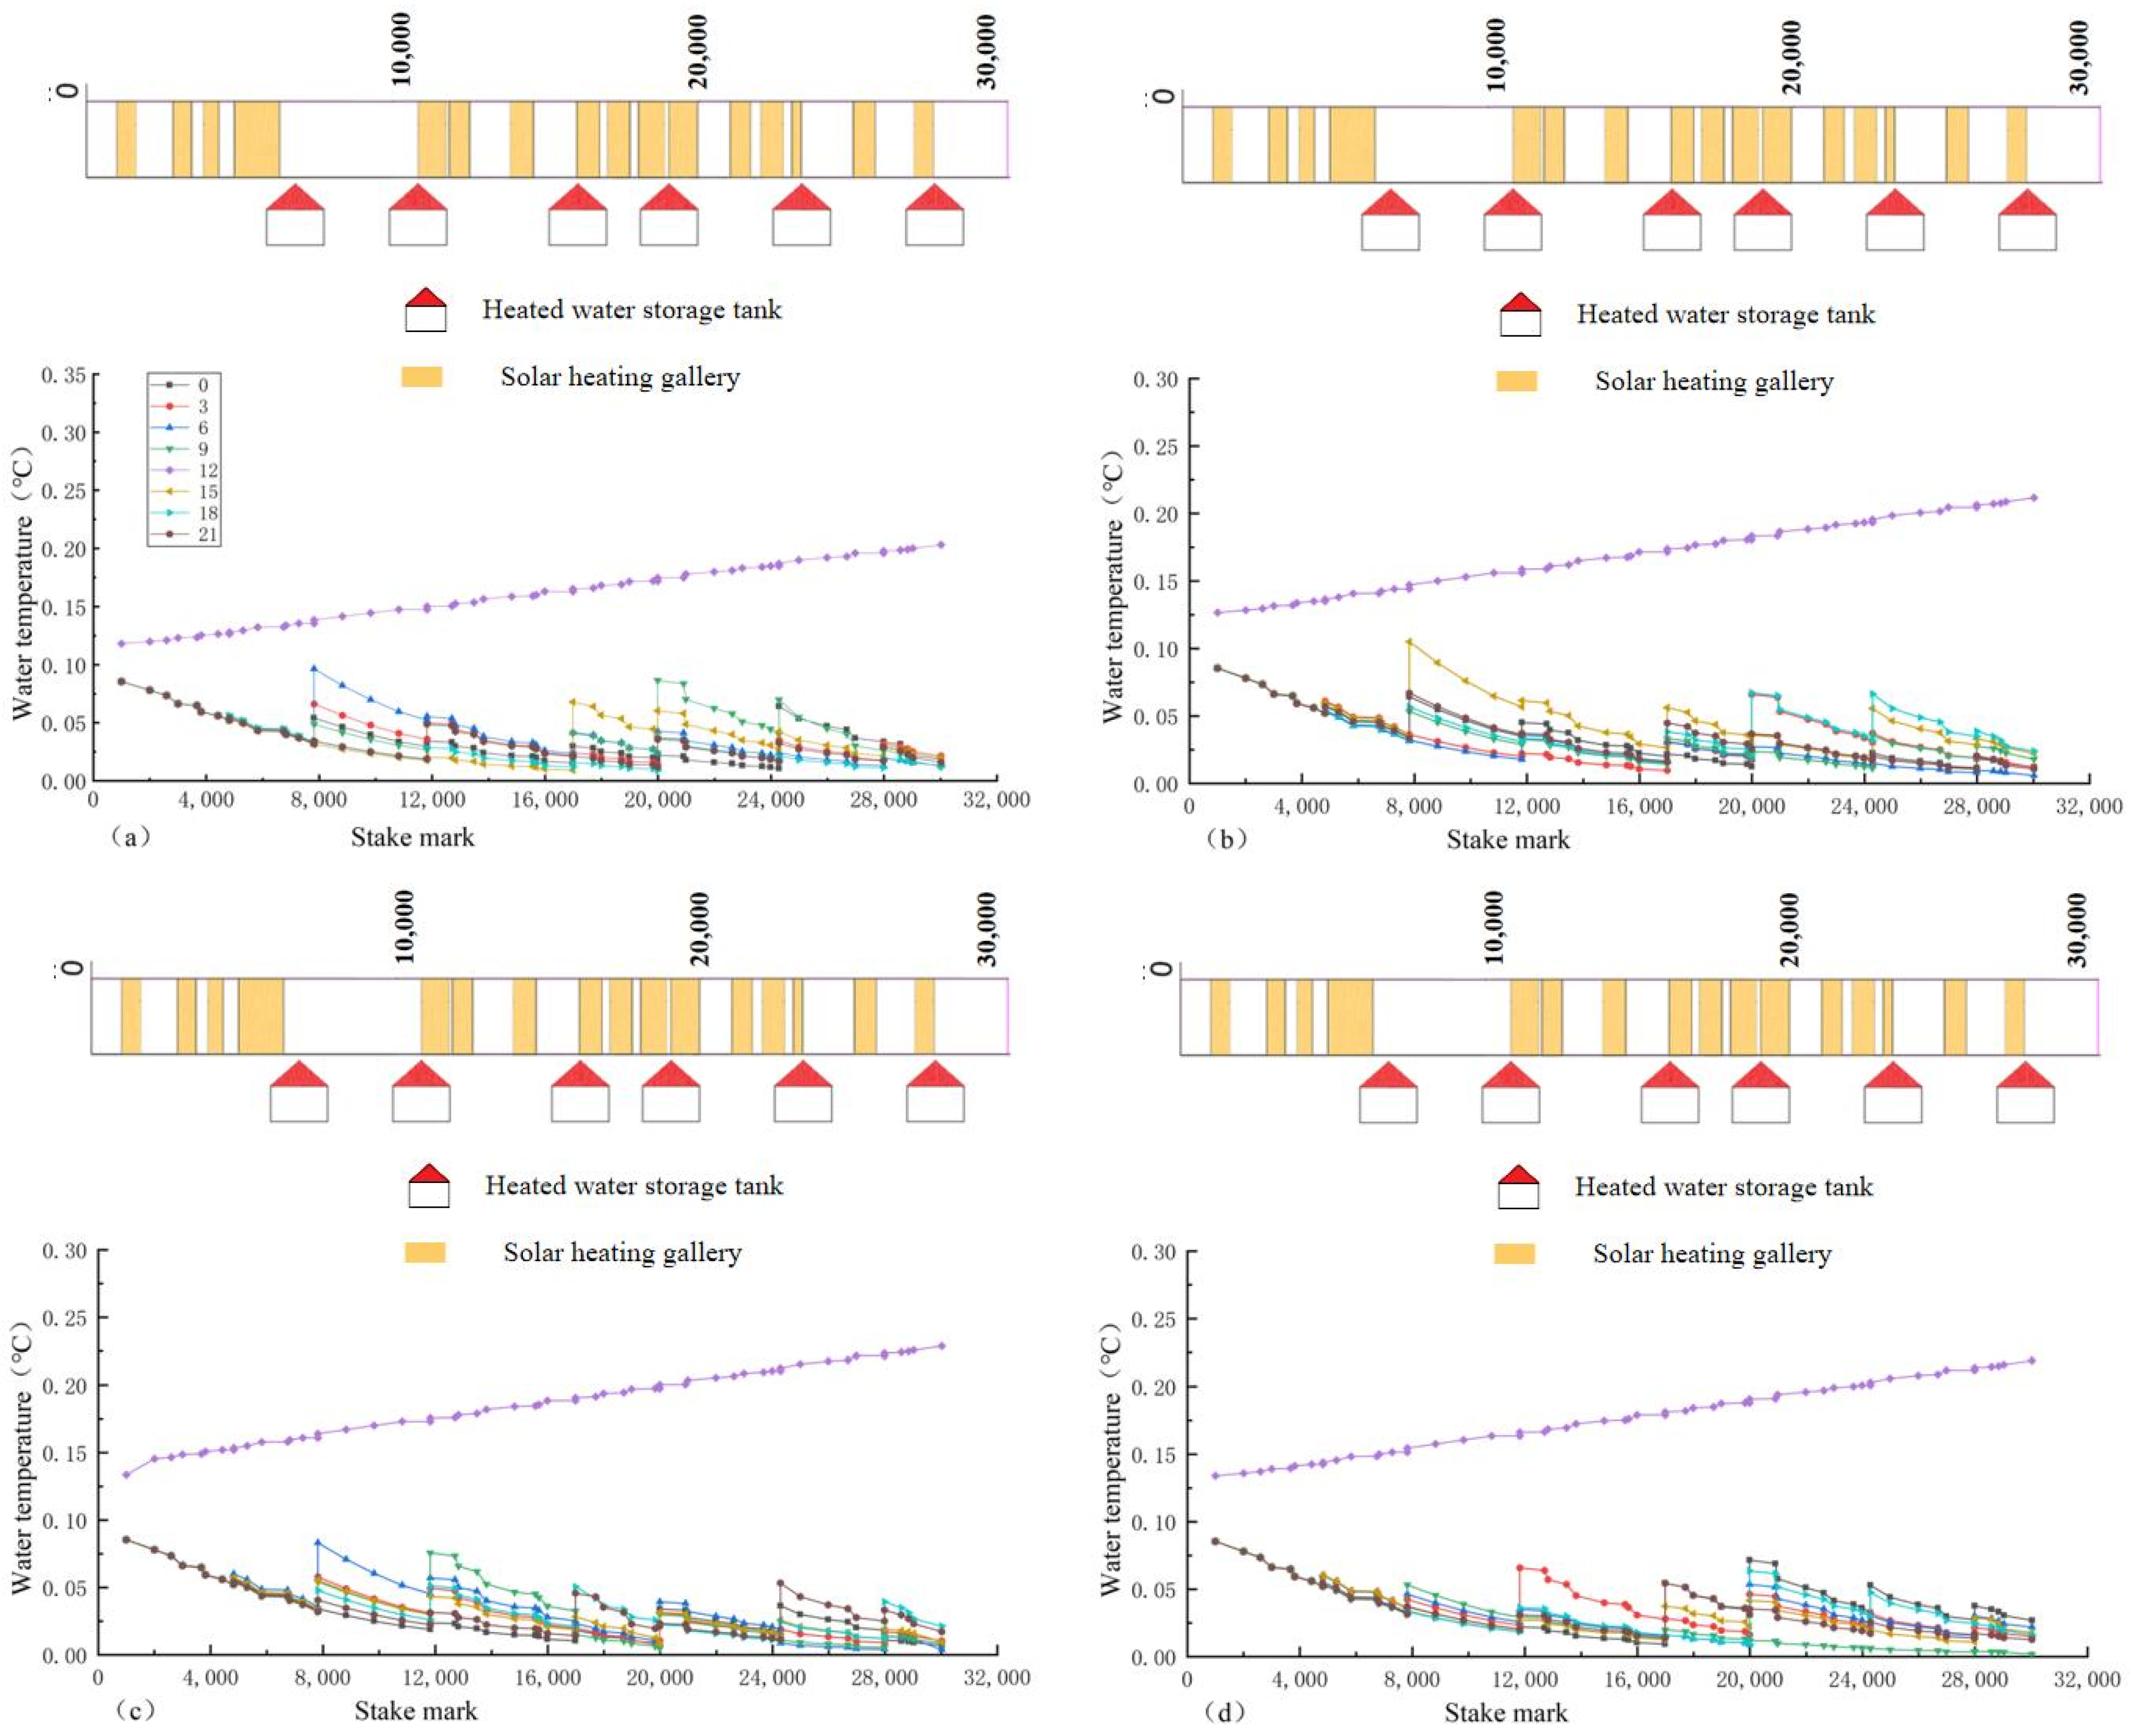
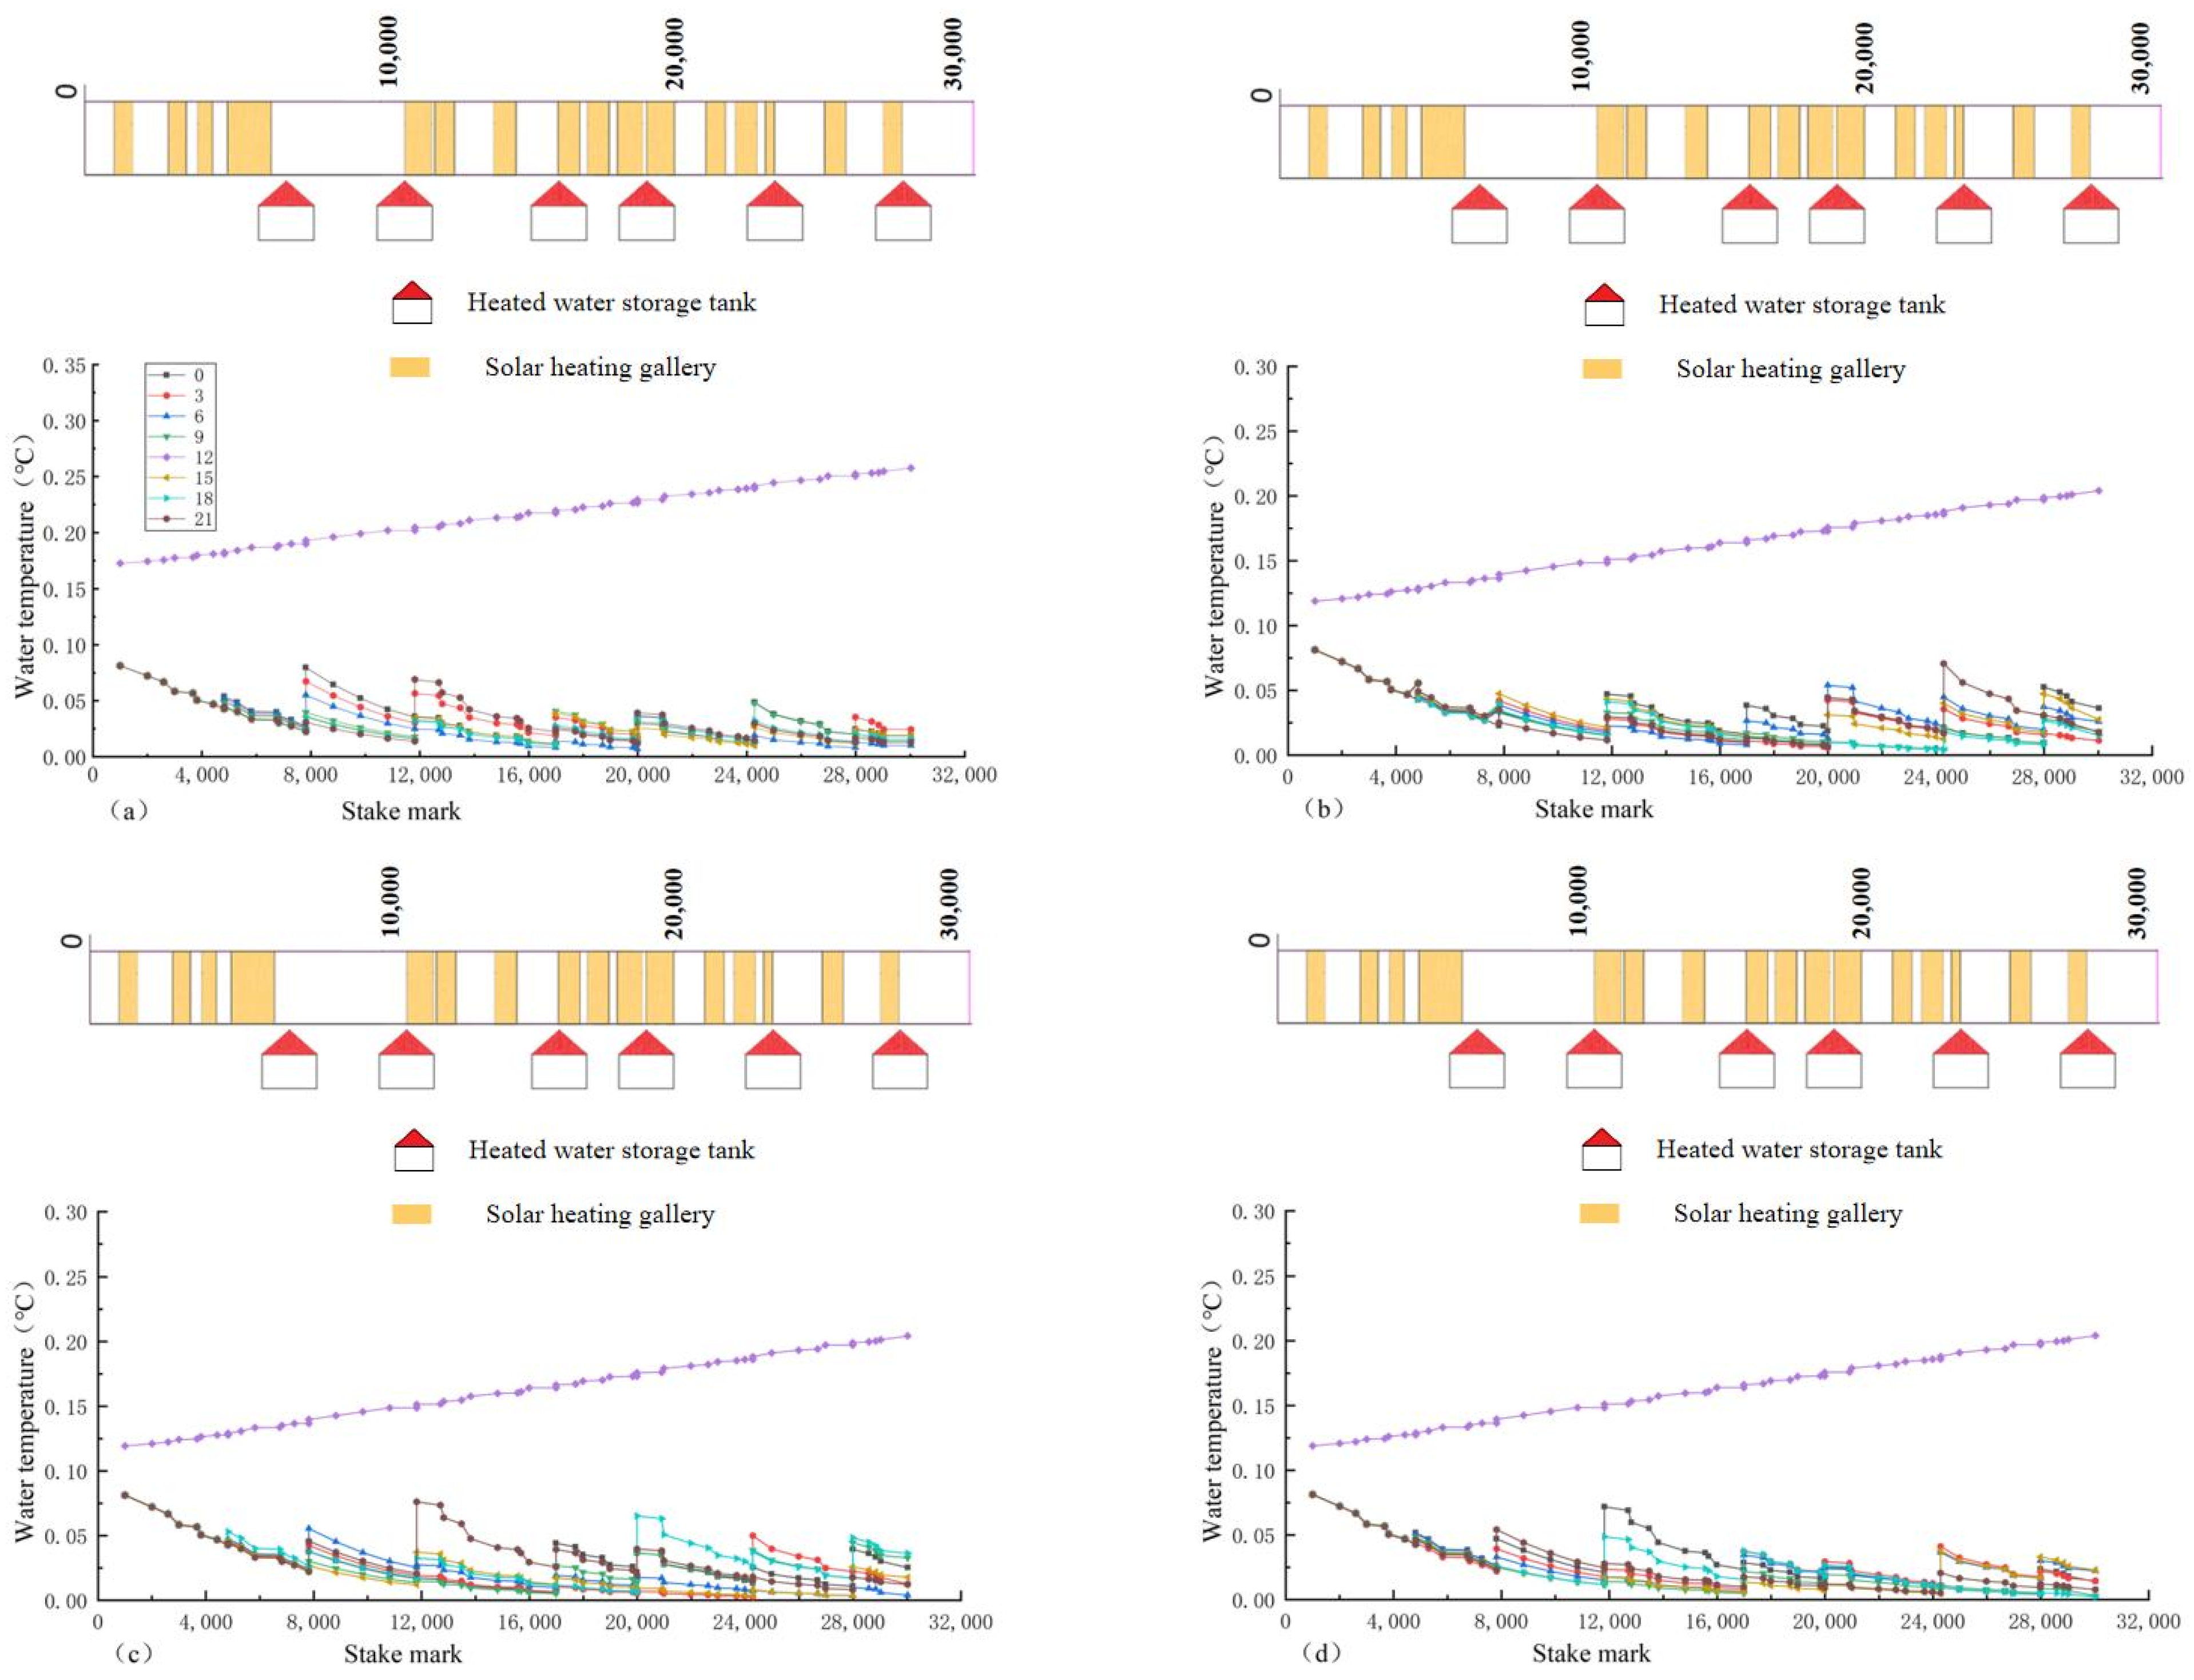
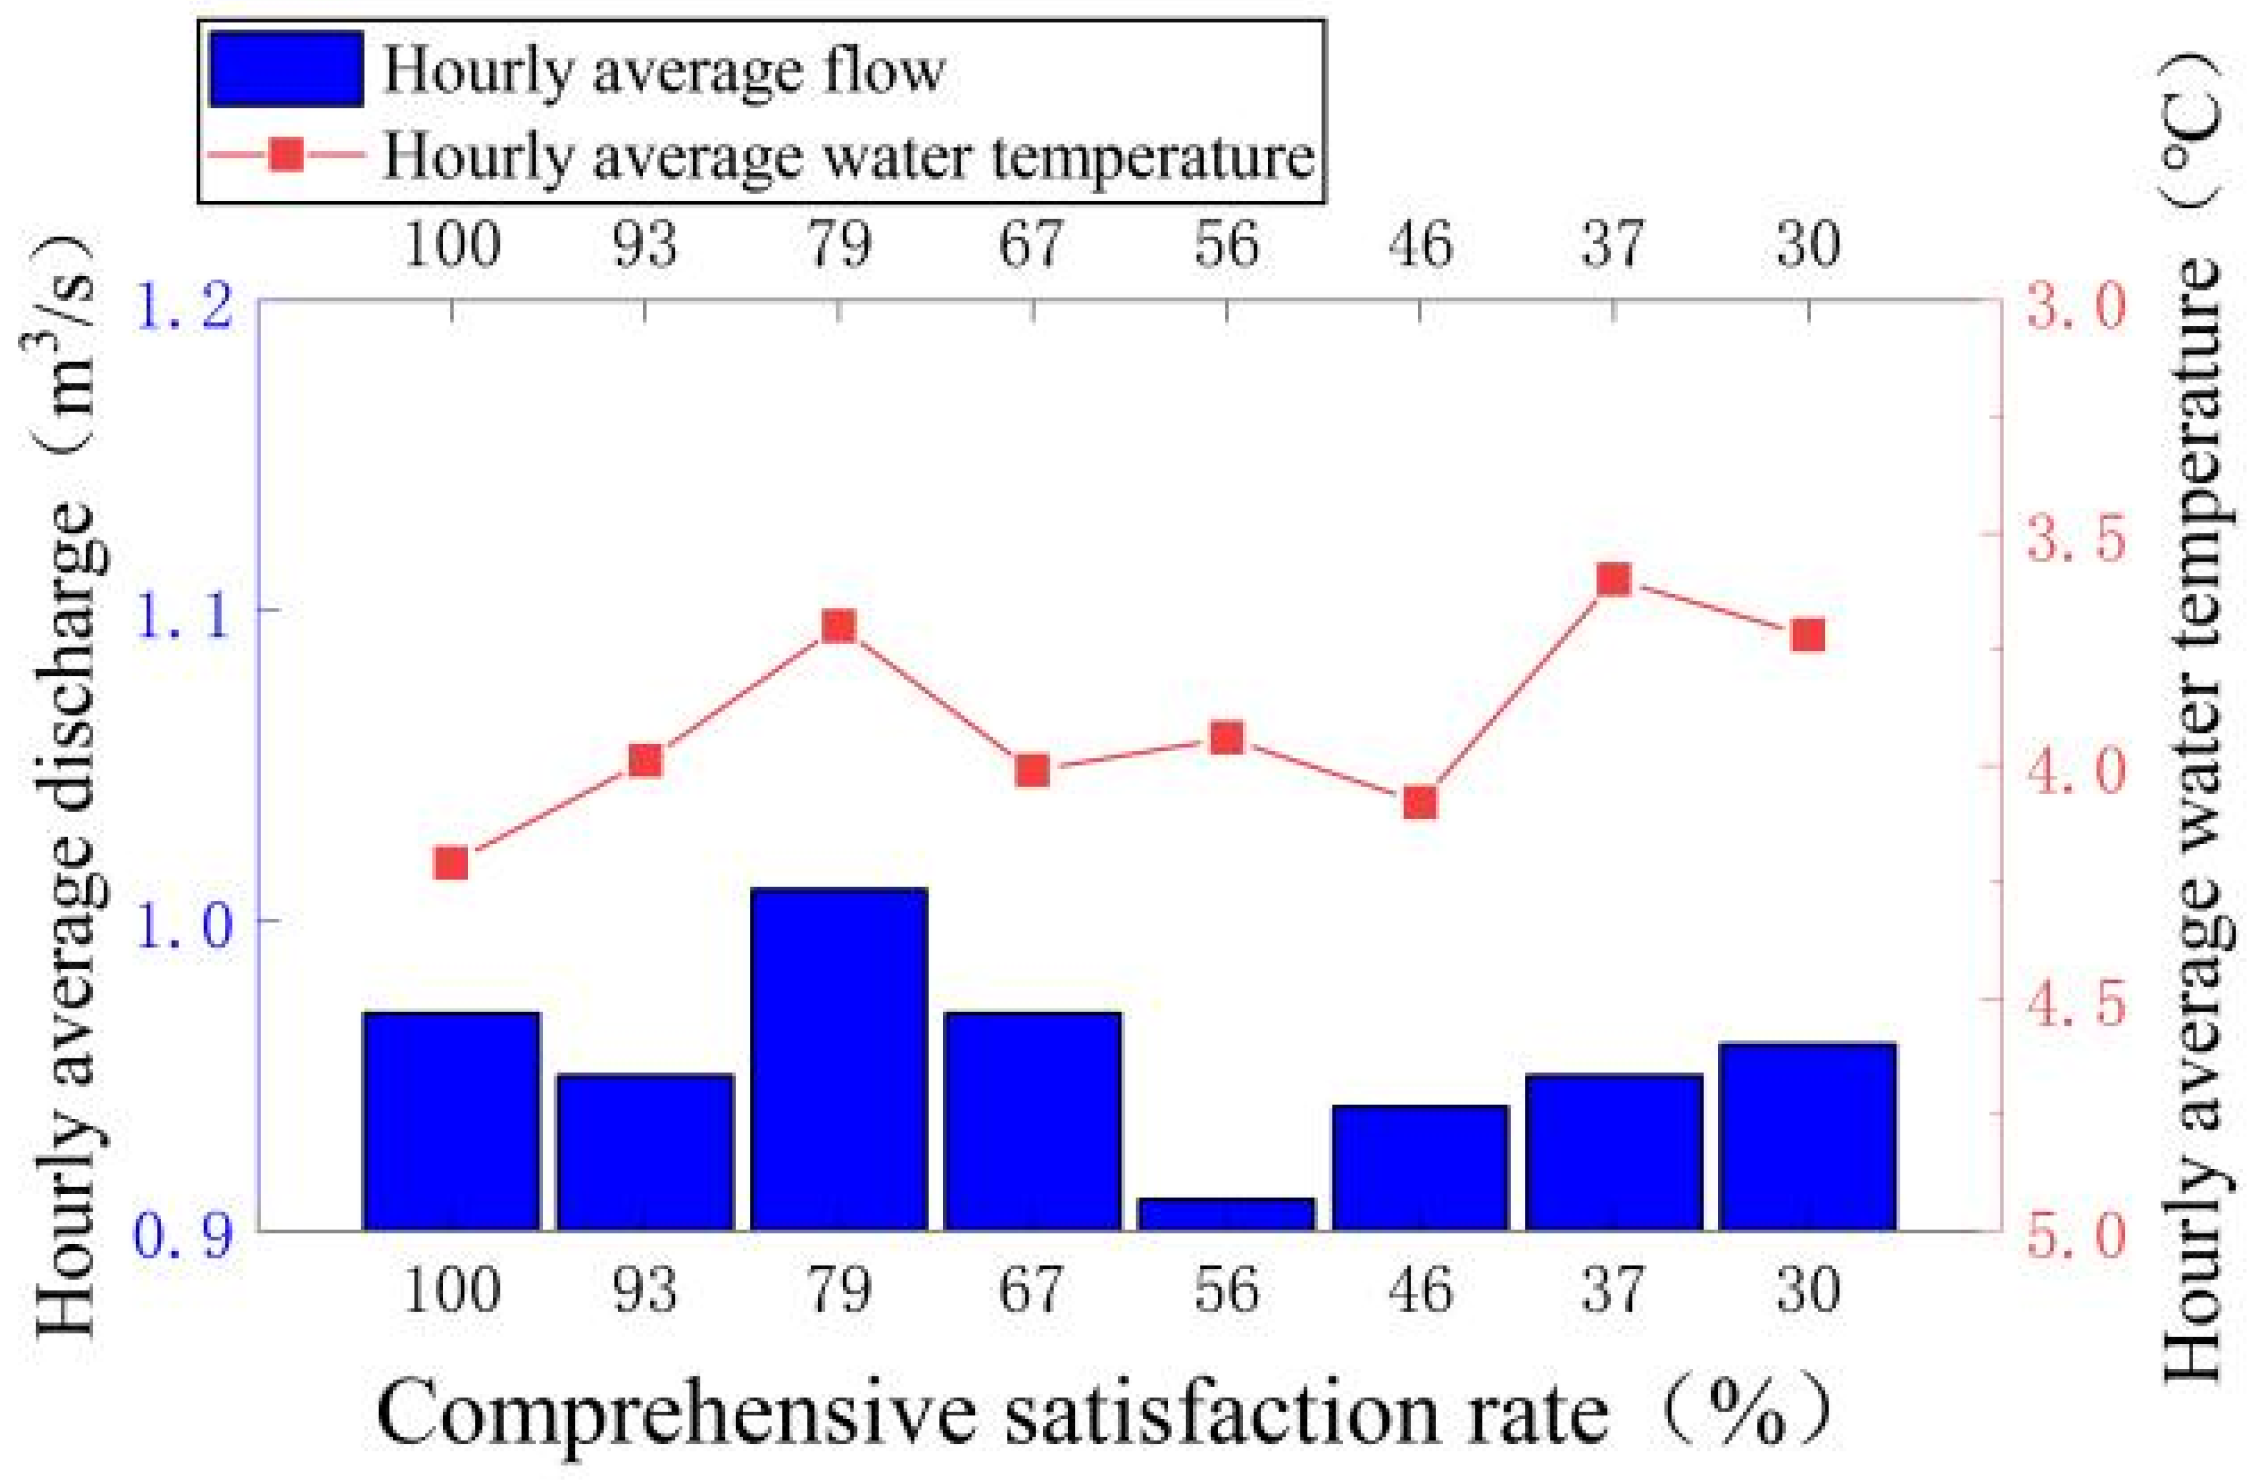
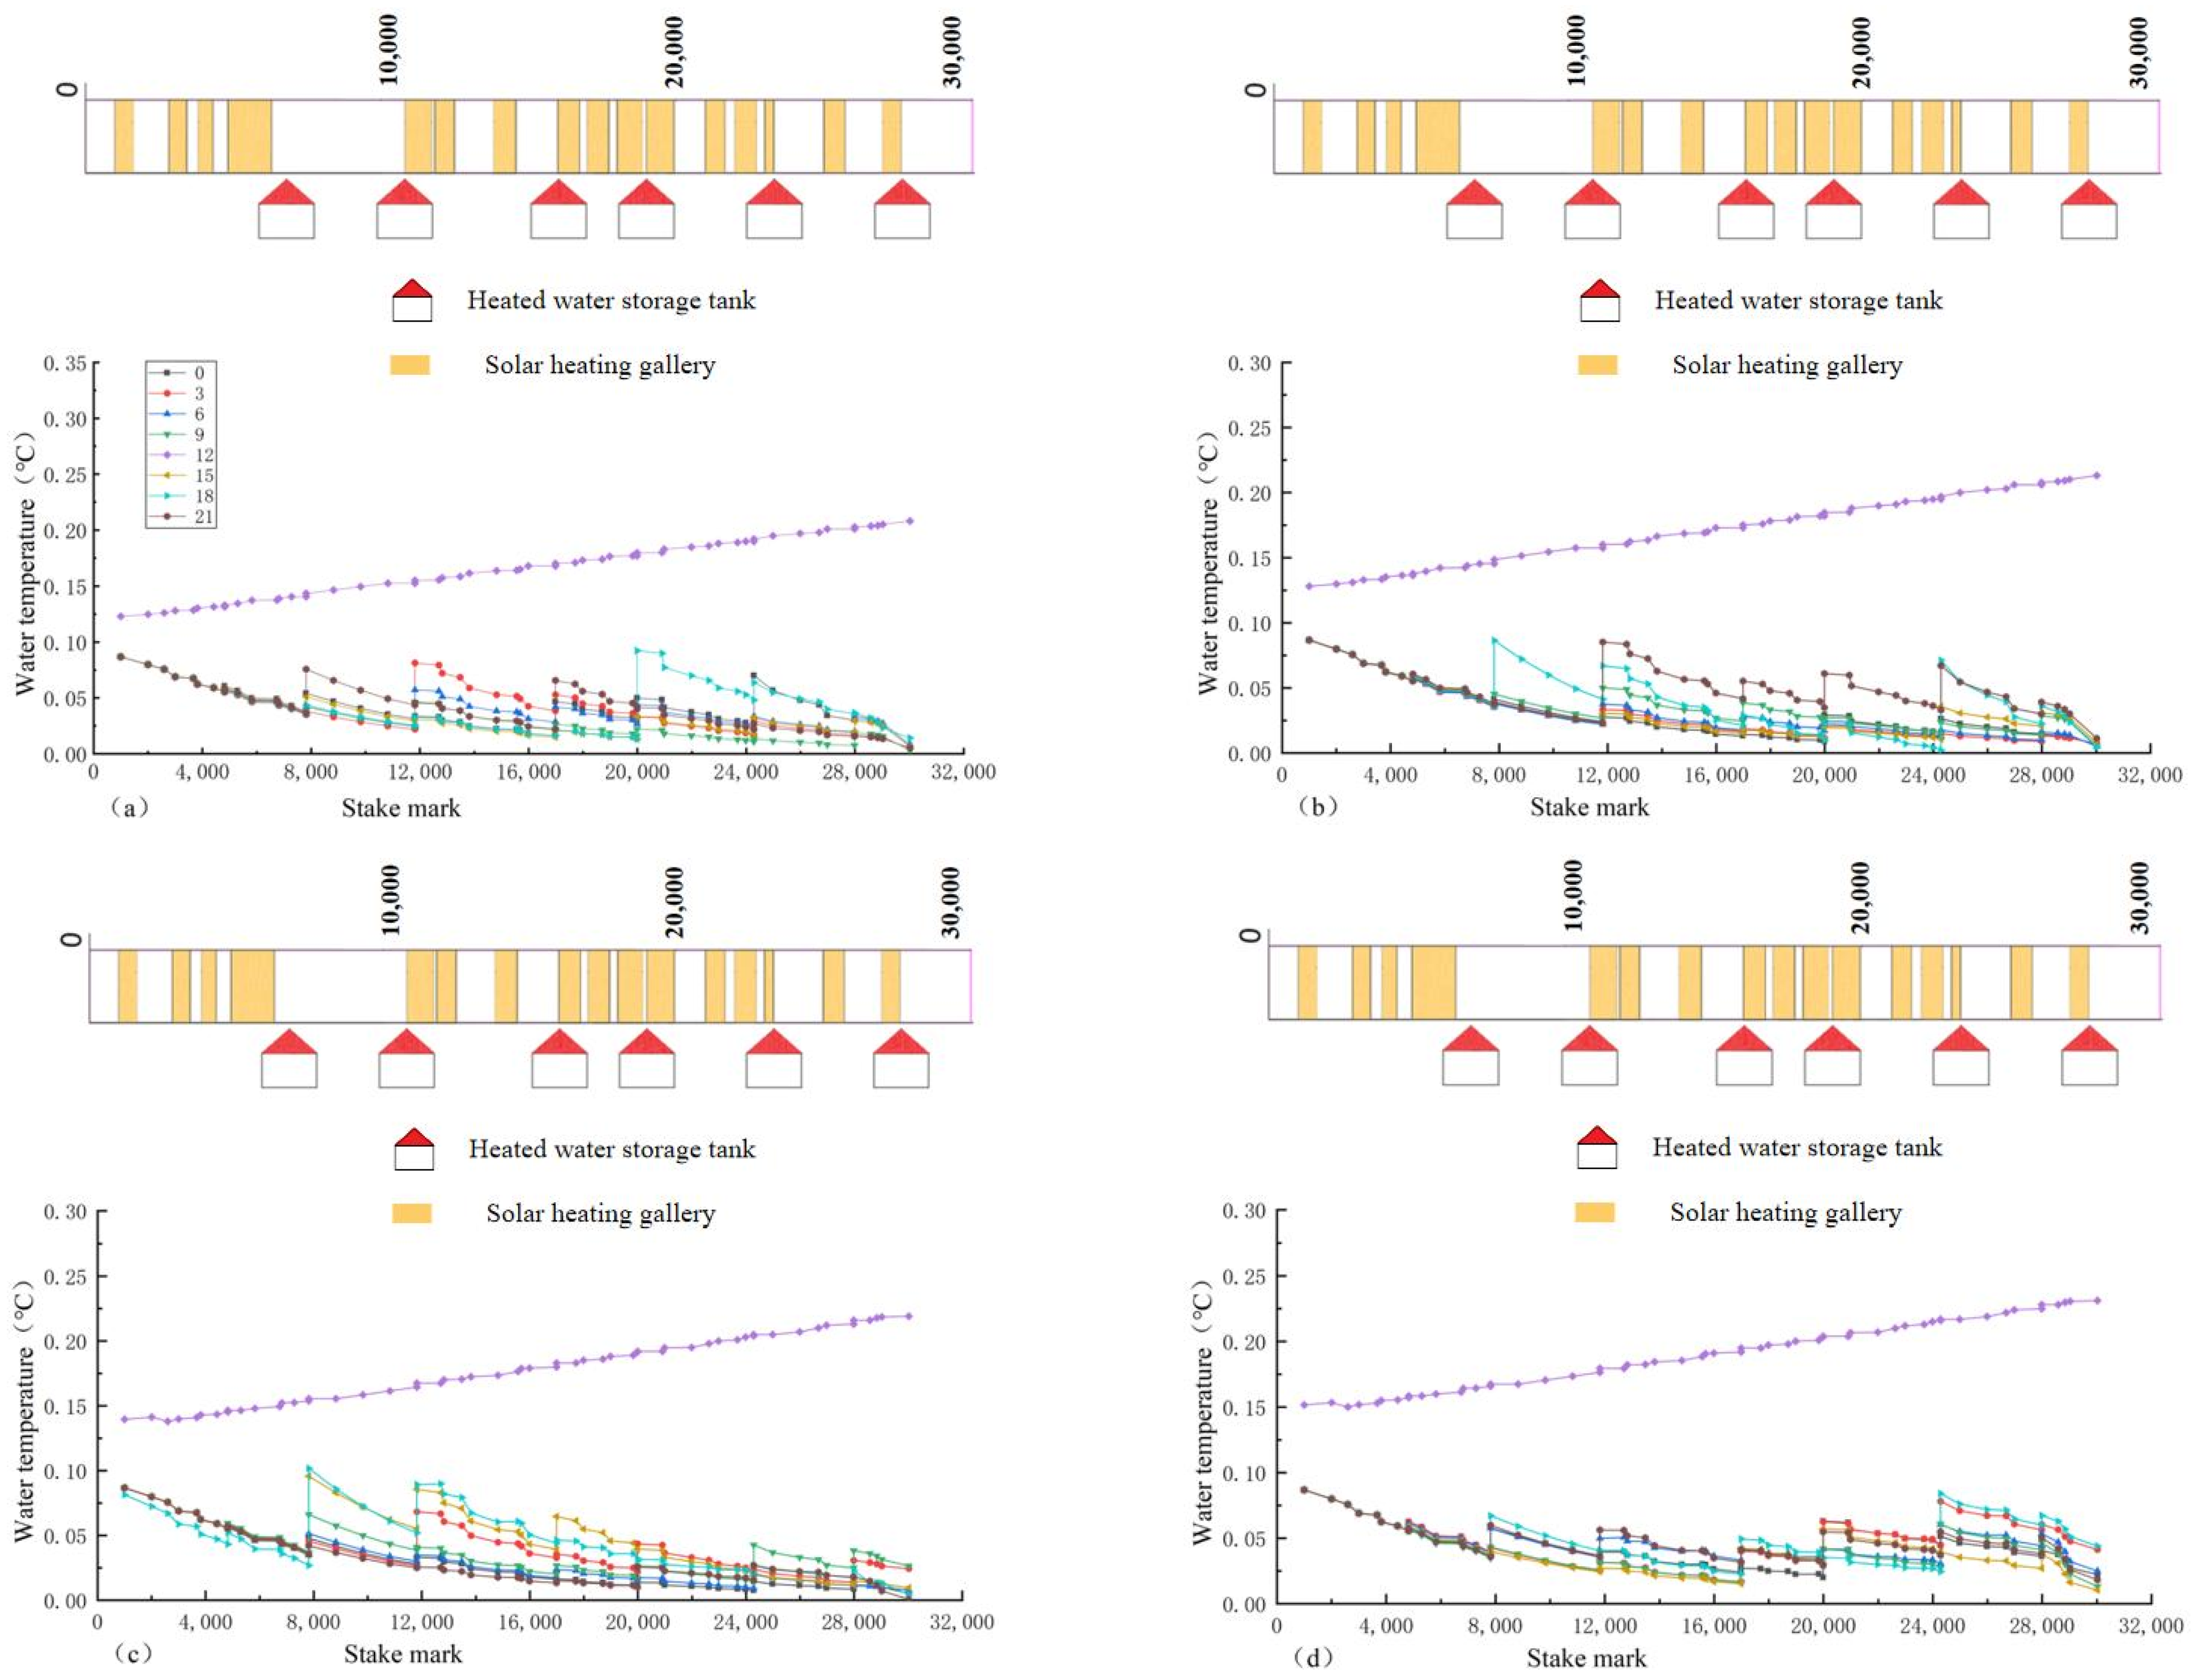
4.1. Analysis of Results of Different Comprehensive Satisfaction Rates

Combined with the heat exchange process of the water body in the channel, it can be seen that the three meteorological parameters of total solar radiation, temperature, and wind speed are the key indicators affecting the heat change and are also the main disaster risk factors of the icecondition. Limited by the daily scale of meteorological data, the empirical distribution curve and the corresponding probability density histogram can be drawn through the large capacity of measured data for the above indicators, and then the two can match each other to fit the corresponding probability density function, so that the probability of any indicator satisfying less than a certain value can be obtained. Therefore, the concept of a “comprehensive satisfaction rate” is put forward, which is defined as the probability of the event that several indicators meet at the same time is less than the relative value. In order to solve the regulation problem of ice-melting measures under extreme conditions or typical working conditions, the method of combining the meteorological probability is adopted instead of analyzing the actual meteorological conditions. Based on the correlation between the indicators, the joint probability density function is constructed by using the multiple correlation coefficient between the temperature, wind speed, and radiation, and the probability of the occurrence of product events is used to represent the possibility of the simultaneous occurrence of three evaluation indicators under different probability. Then, the comprehensive satisfaction rate can be expressed as:
P ( T m , V m , S m ) = P ( T m ) P ( V m ) P ( S m ) 1 ρ T V S 2
where P ( T m , V m , S m ) is the comprehensive satisfaction rate; P ( T m ) , P ( V m ) , and P ( S m ) are the probabilities that the three indexes of temperature, wind speed, and radiation are each less than a corresponding value; and ρ T V S is the correlation coefficient between the temperature, wind speed, and radiation.
Based on the measured meteorological data of Handan City from November to February of each year from 2000 to 2018, the empirical distribution curves and probability density histograms are drawn, as shown in Figure 10 and Figure 11. Then, Spass mathematical analysis software was used to fit them. After the variance test, it was found that the empirical distribution curves for the air temperature, wind speed, and radiation showed a first-order exponential form, so the ExpDec function model was adopted, and its expression is shown in Table 3. Through a linear regression calculation of the data, we conclude that the multiple correlation coefficient of the wind speed and total solar radiation on the air temperature in Handan City is 0.388, and the probability of corresponding regression model is 0, which is less than the significance level of 0.05, indicating that the linear model analyzed is valid.
Due to seasonal influences, the total solar radiation value in December is smaller than that in November and January. The preprocessing and variance analysis show that the probability density curve is multi-modal and composed of multiple first-order indices. Its probability density curve consists of the superposition of three Gauss first-order exponential functions, as shown in Equation (18).
F ( R s ) = 0.01 + 0.44 e 2 ( R s 498.89 248.34 ) 2 + 0.2 e 2 ( R s 2680 1323.87 ) 2 + 0.03 e 2 ( R s 10630 3773 ) 2
According to the above formula and the measured meteorological data, the values of air temperature, wind speed, and radiation and the corresponding comprehensive satisfaction rate under different cumulative probabilities were calculated, respectively (in Table 4).
According to the limitation of the meteorological data and the need of actual regulations, the daily meteorological data are decomposed according to the empirical distribution, and the daily variation process with a 3 h interval is obtained. The regulation of ice-melting measures has repeatability in the time scale; that is, similar regulation processes are generated using the same principle and model. Therefore, one-day meteorological processes corresponding to each comprehensive satisfaction rate in Table 4 are selected for optimal regulation. The genetic algorithm was used to calculate the optimal regulate model of the heating gallery and the heated water storage tank, and the operation process of the outlet water temperature and flow of the heated water storage tank as well as the effect of heat preservation and heating of the heating gallery under different comprehensive satisfaction rates were obtained. Figure 12, Figure 13 and Figure 14 show the flow and water temperatures of the heated storage tank and the change process of the water temperature along the lines.
As can be seen from Figure 12, the variation trend for the flow rate is mainly in the concave shape of “high on both sides and low in the middle”. Meanwhile, it can see from Figure 14 that a purple upward slash will appear at 12:00. Under the current meteorological conditions (temperature, wind speed, and radiation), the water body of the channel is in a state of heat absorption and warming between 12:00 and 14:00, so it does not require ice-melting measures to regulate it. As can be seen from Figure 14, the water temperature along the lines is affected by the injection flow and injection water temperature at the water injection point and is mainly in a “ladder-like” shape. Whenever the water injection point of the heated storage tank is encountered, the water temperature of the node will be obviously raised, and heat will continue to be provided to the following channel section. Then, the temperature range increase for the water injection node is calculated, and the results are shown in Figure 15. It can be seen from the figure that the temperature range increase of the heated water storage tank fluctuates greatly, mainly between 0.5–2, and the temperature increase ranges for the front and back tanks are inversely proportional, and the two are complementary. In addition, it can be seen from Figure 14 that the heating gallery has a good insulation effect. During operation regulation, the heating gallery can greatly improve the air layer temperature and reduce the wind speed, thus reducing the heat loss. Taking No. 2 + 300 of the solar heating gallery and No. 2 + 800 of the no solar heating gallery as an example, the decreasing trend in the water temperature of the channel paved with the heating gallery was significantly slower than that of the channel without paving the heating gallery, and the decreasing difference was about 12.5%, as shown in Figure 16. At the same time, it is found that the time change in the water temperature presents a “convex” shape, rising first and then decreasing with time, indicating that except between 12:00 and 14:00, appropriate heat is added to make it run at the freezing point for the remainder of the time, so as not to waste energy as much as possible.
After the daily variation process of the outlet water temperature and flow of the heated water storage tank is known, the overall analysis is carried out. The results are shown in Table 5 and Figure 17.
It can be seen from Table 5 that the overall variation range of the hourly average flow and water temperature is not very large, indicating that with a decrease in the comprehensive satisfaction rate, the outlet flow of the heated water storage tank is arranged in a small amplitude, which not only ensures that the water in the storage tank is heated more evenly and stably, but also reduce the fluctuation of the water level in the channel so as to realize ice-free water conveyance in the channel and ensure the safety of water conveyance. It can be seen from Figure 17 that the flow and water temperature present a “fluctuating complementary” relationship; that is, the overall trend is fluctuating, and the local flow and water temperature have an inverse relationship between them. The flow fluctuates in a small range, while the water temperature shows a trend of decreasing fluctuation, and the water temperature and flow complement each other in a local range to ensure the energy required. The average hourly operating cost gradually decreases with the decrease in the comprehensive satisfaction rate, but when the comprehensive satisfaction rate is less than 56%, the change range of the operating cost slows down and does not change significantly, mainly because the meteorological conditions do not change significantly when the comprehensive satisfaction rate is small.

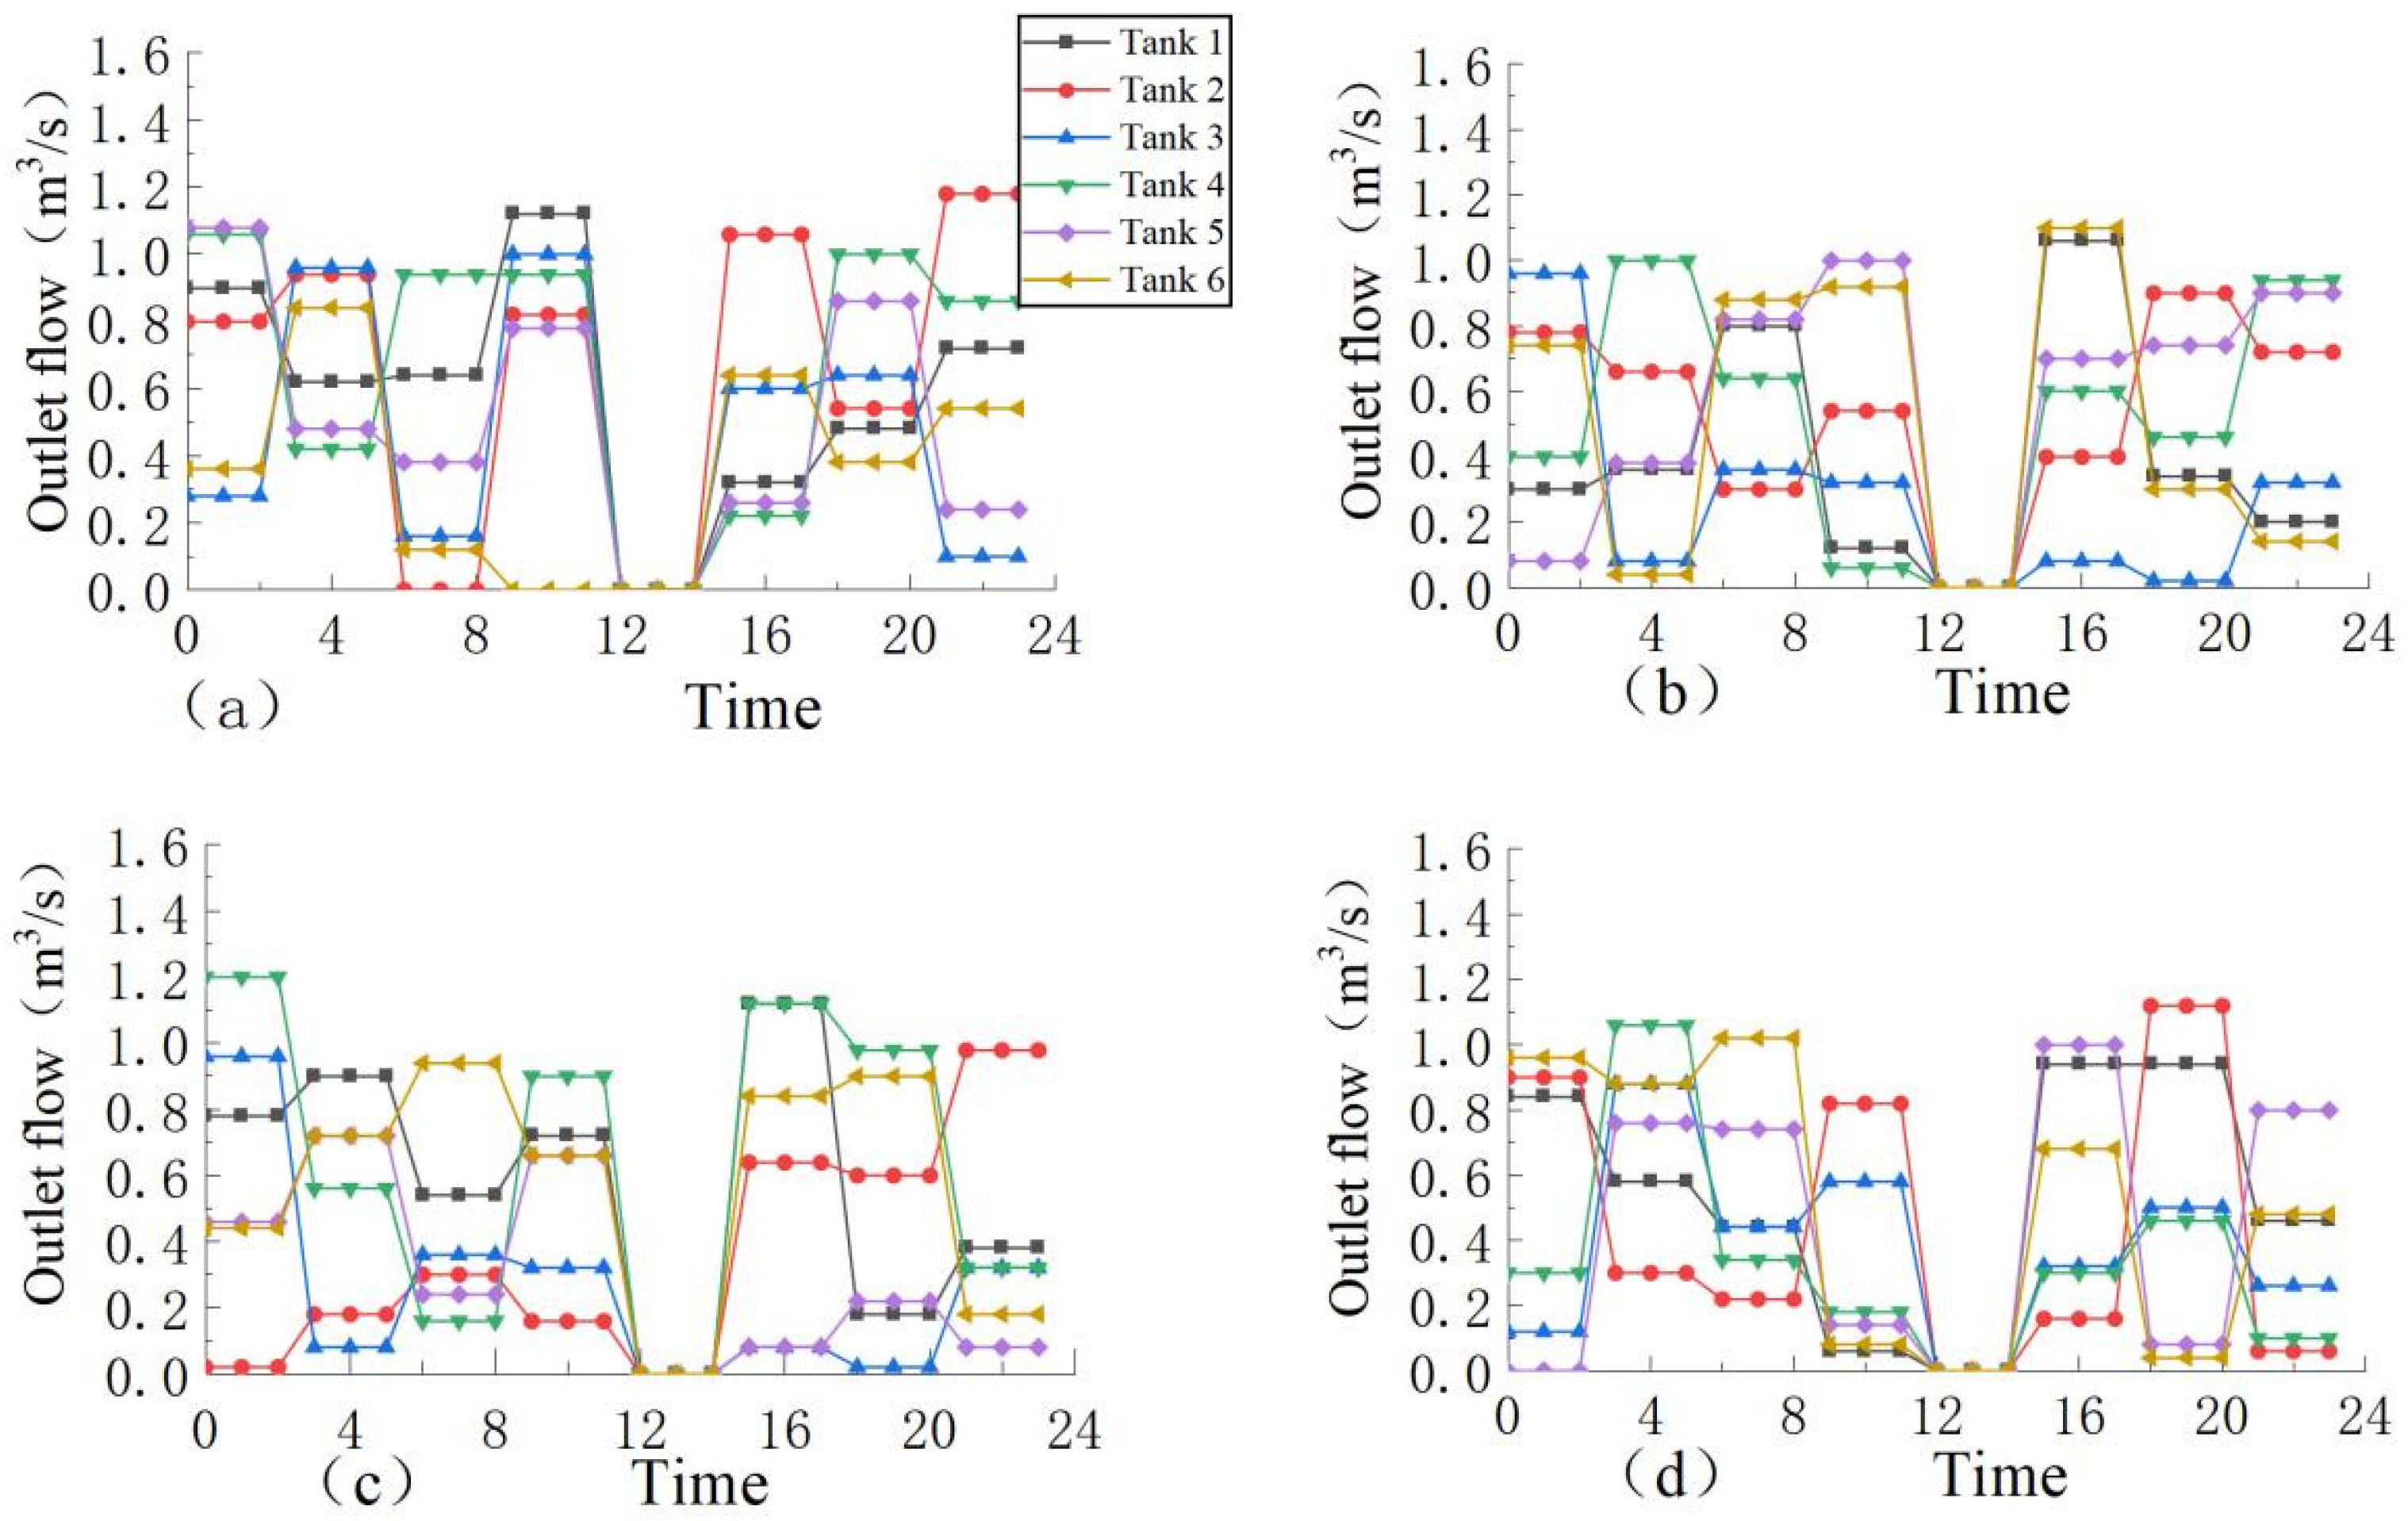
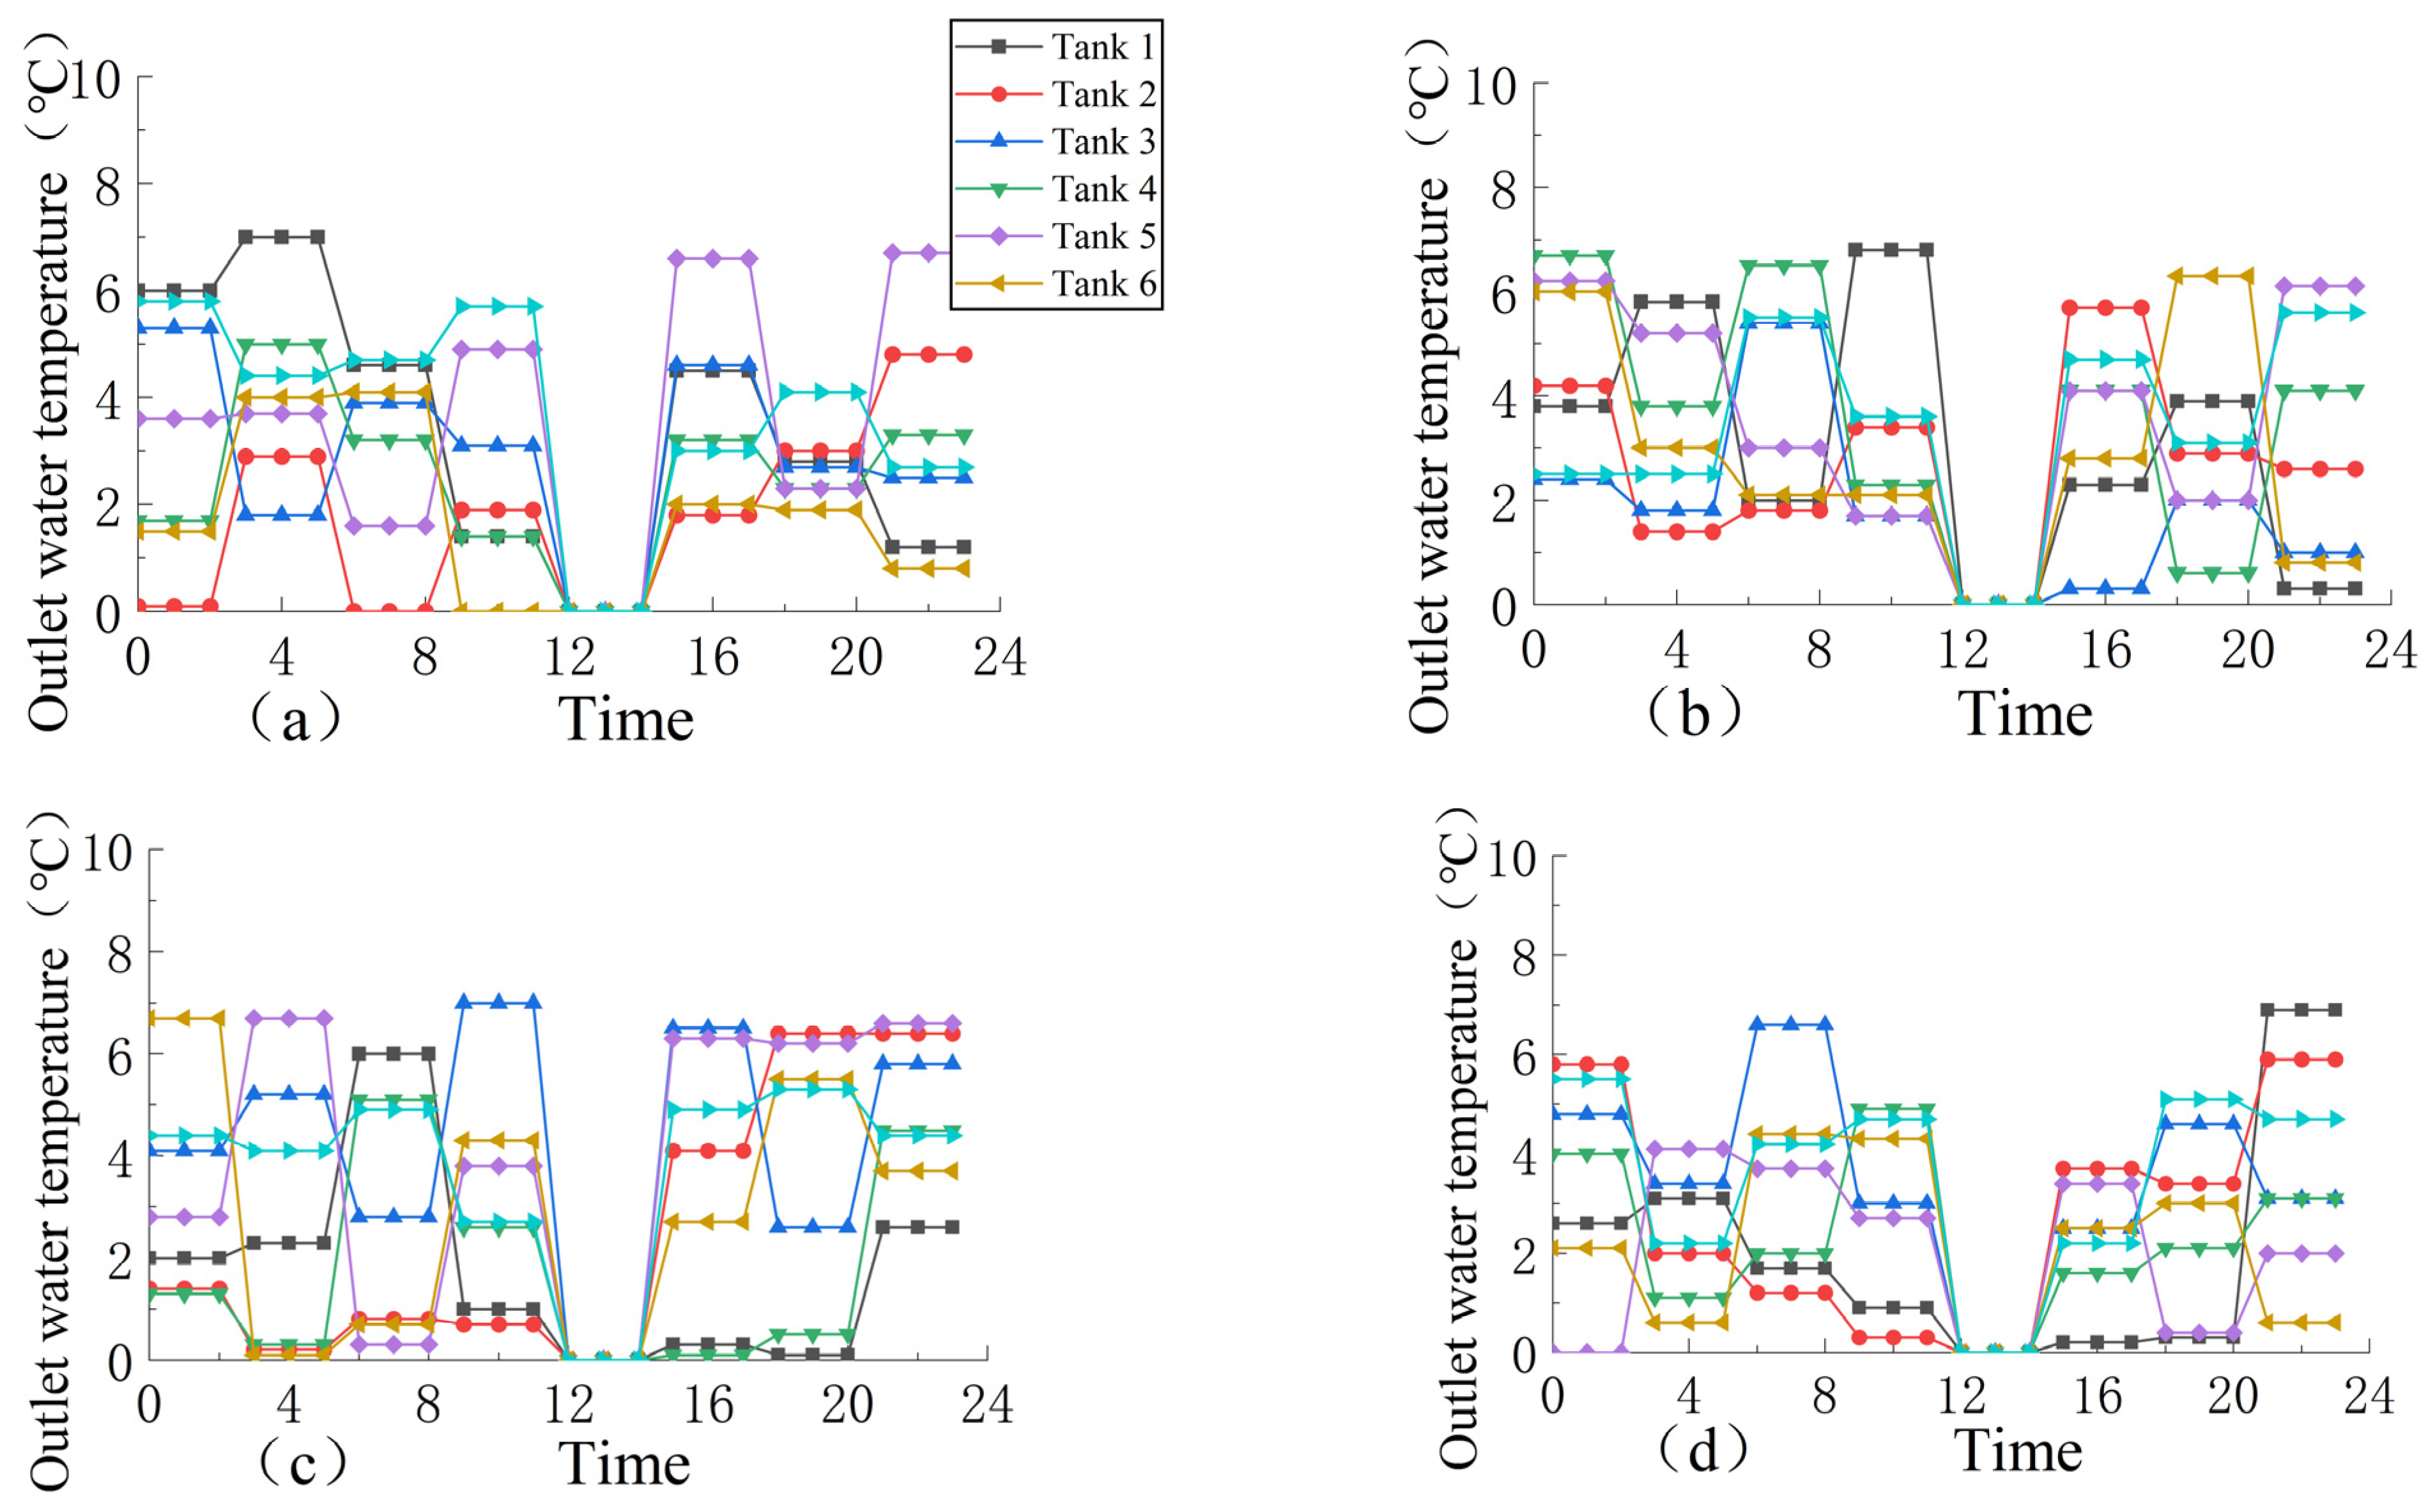
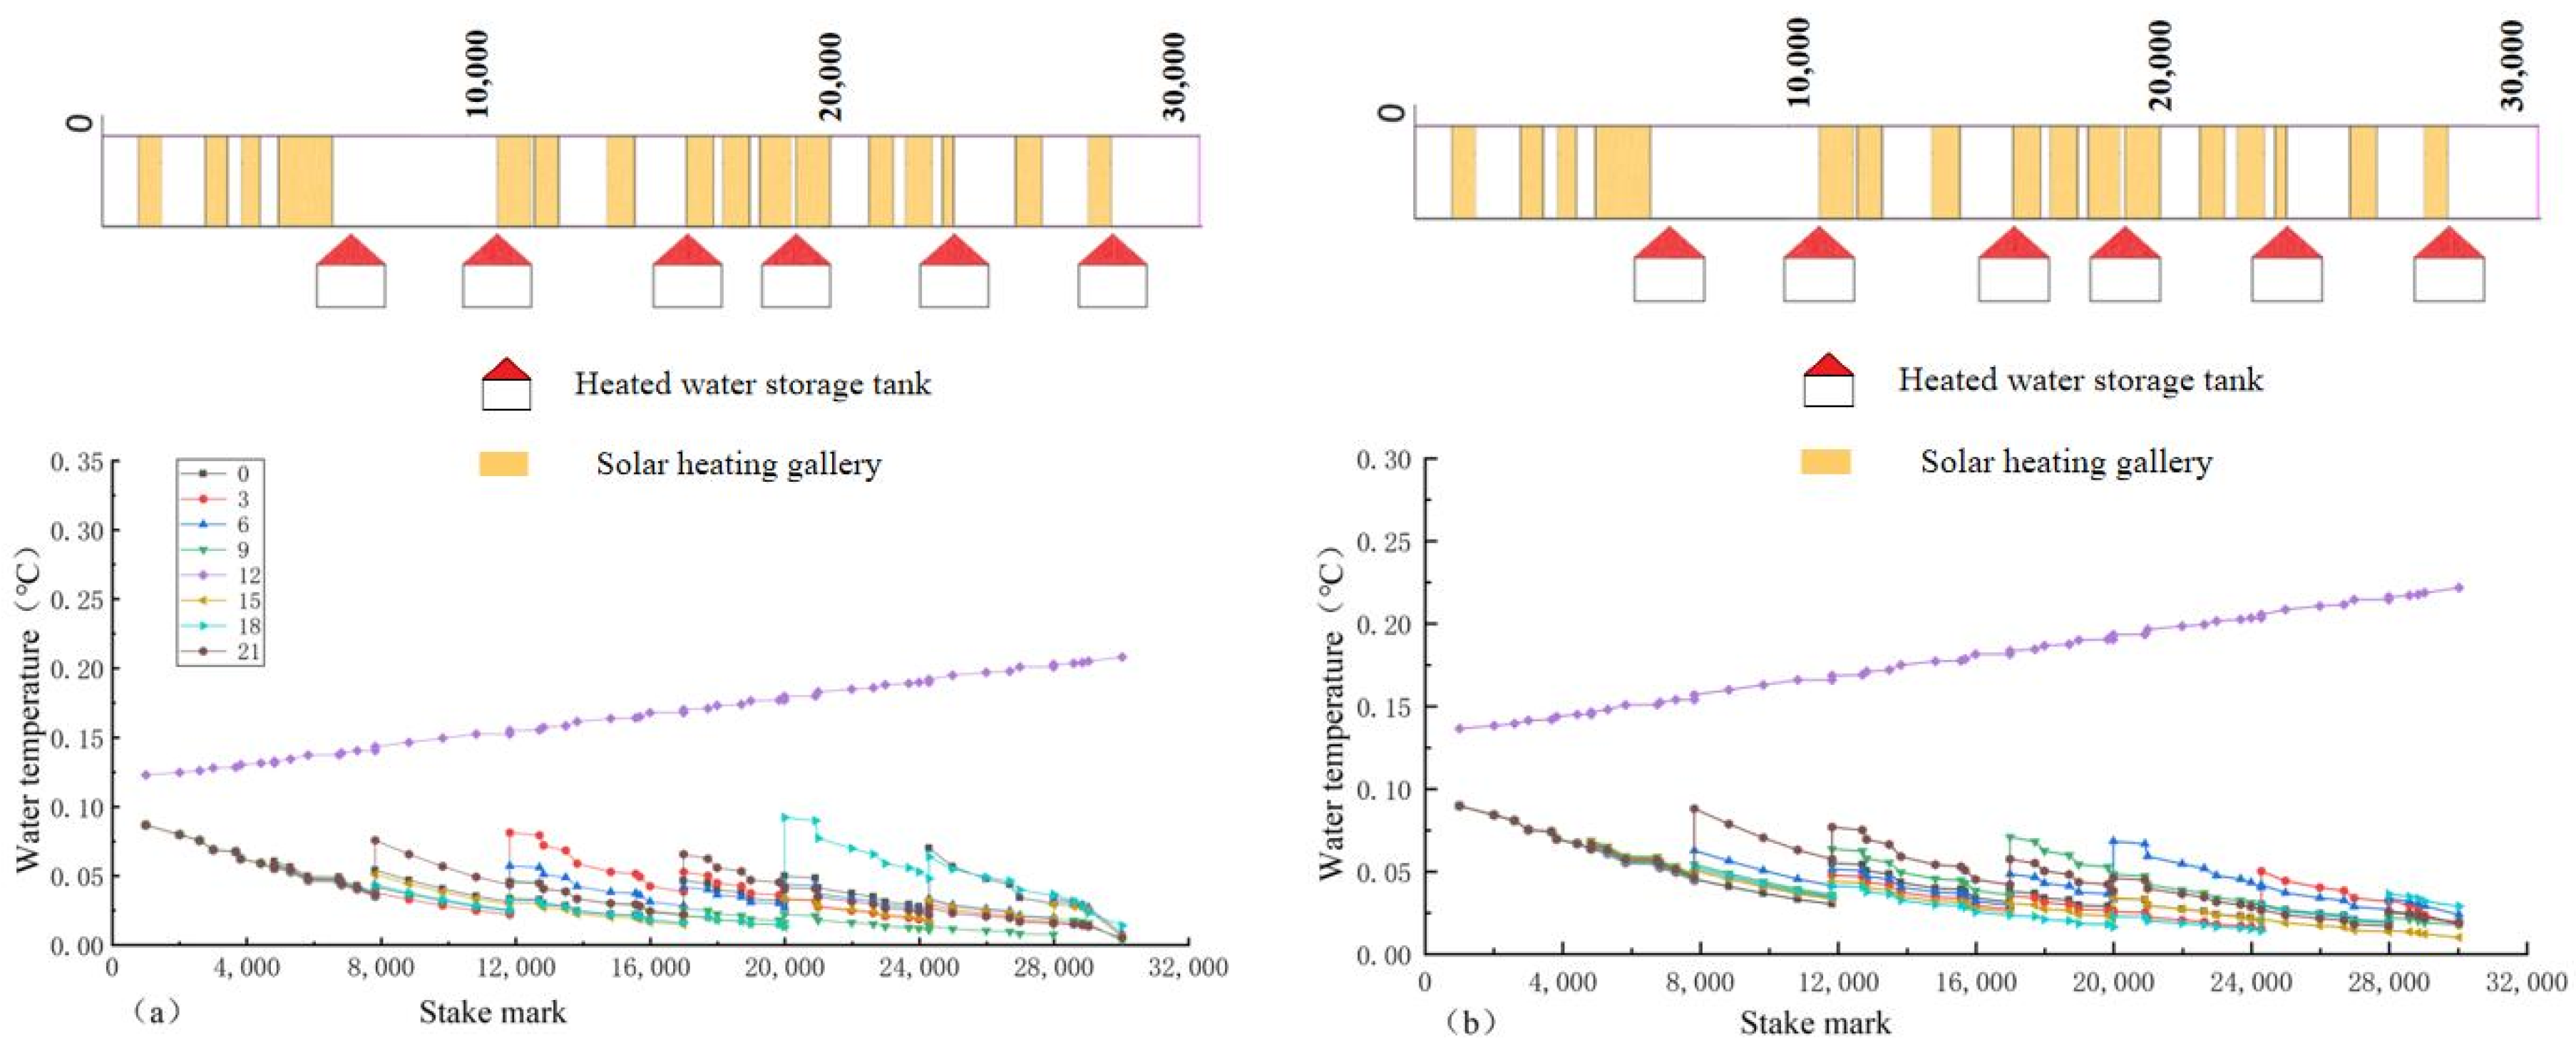
4.2. Analysis of the Influence of Water Flow

In the actual project, the comprehensive satisfaction rate is not directly related to the water flow. When the operator carries out high flow, ice-free water transfer facing extreme weather, it is necessary to regulate the ice-melting measures and increase the operating cost and special needs. Based on the data query of the water flow of previous projects, taking the flow of 140 m 3 / s and 180 m 3 / s as the research objects, the optimal regulating process of the two measures under eight different comprehensive satisfaction rates was calculated. The specific results are shown in Figure 18 and Figure 19.
It can be seen from Figure 18 and Figure 19 that the variation trend for the water temperature along the lines under different water flow rates is the same, showing a “ladder-like” pattern. The increase in the water flow will cause the water level of the channel to rise, the water surface area to increase, and the heat loss will also increase. However, the velocity of flow also increases to a certain extent, which enhances the heat transfer efficiency and is beneficial for increasing the non-freezing length. According to the above calculation results, the changes in the velocity under different water flows are obtained, and the comprehensive satisfaction rates are 79% and 37%, as shown in Table 6. As can be seen from the table, the operating costs also increase with the increase in water flow, but under the strong control of the velocity of the flow, its growth rate slows down to a certain extent. When the comprehensive satisfaction rate is 79%, the growth rate decreases from 17.7% to 11.7% every time the water flow increases by 40 m 3 / s , while when the comprehensive satisfaction rate is 37%, the growth rate decreases from 20.8% to 17.2%. It can be seen that with the decrease in the comprehensive satisfaction rate, the range of its growth rate also decreases. Finally, the change curve for the operating cost per kilometer of the channel with different comprehensive satisfaction rates under different water flow rates is drawn, as shown in Figure 20.
It can be seen from Figure 20 that the water flow is positively correlated with the operating cost per kilometer of the channel, and the operating cost increases with the increase in the water flow rate. At the same time, the increase in the velocity of the flow will extend the non-freezing length and restrain the increase in the operating cost. It can be seen from the figure that with the increase of water flow, the change in the cost gradually decreases. In combination with the overall chart, although the increase in the water flow rate will increase the operating cost, it can be found that the operating cost is still within a reasonable acceptable range, and the change range of the flow is greater than the change range of the cost, about 6%. Therefore, in an actual operation, a reasonable water flow rate can be selected to maximize the comprehensive benefit.

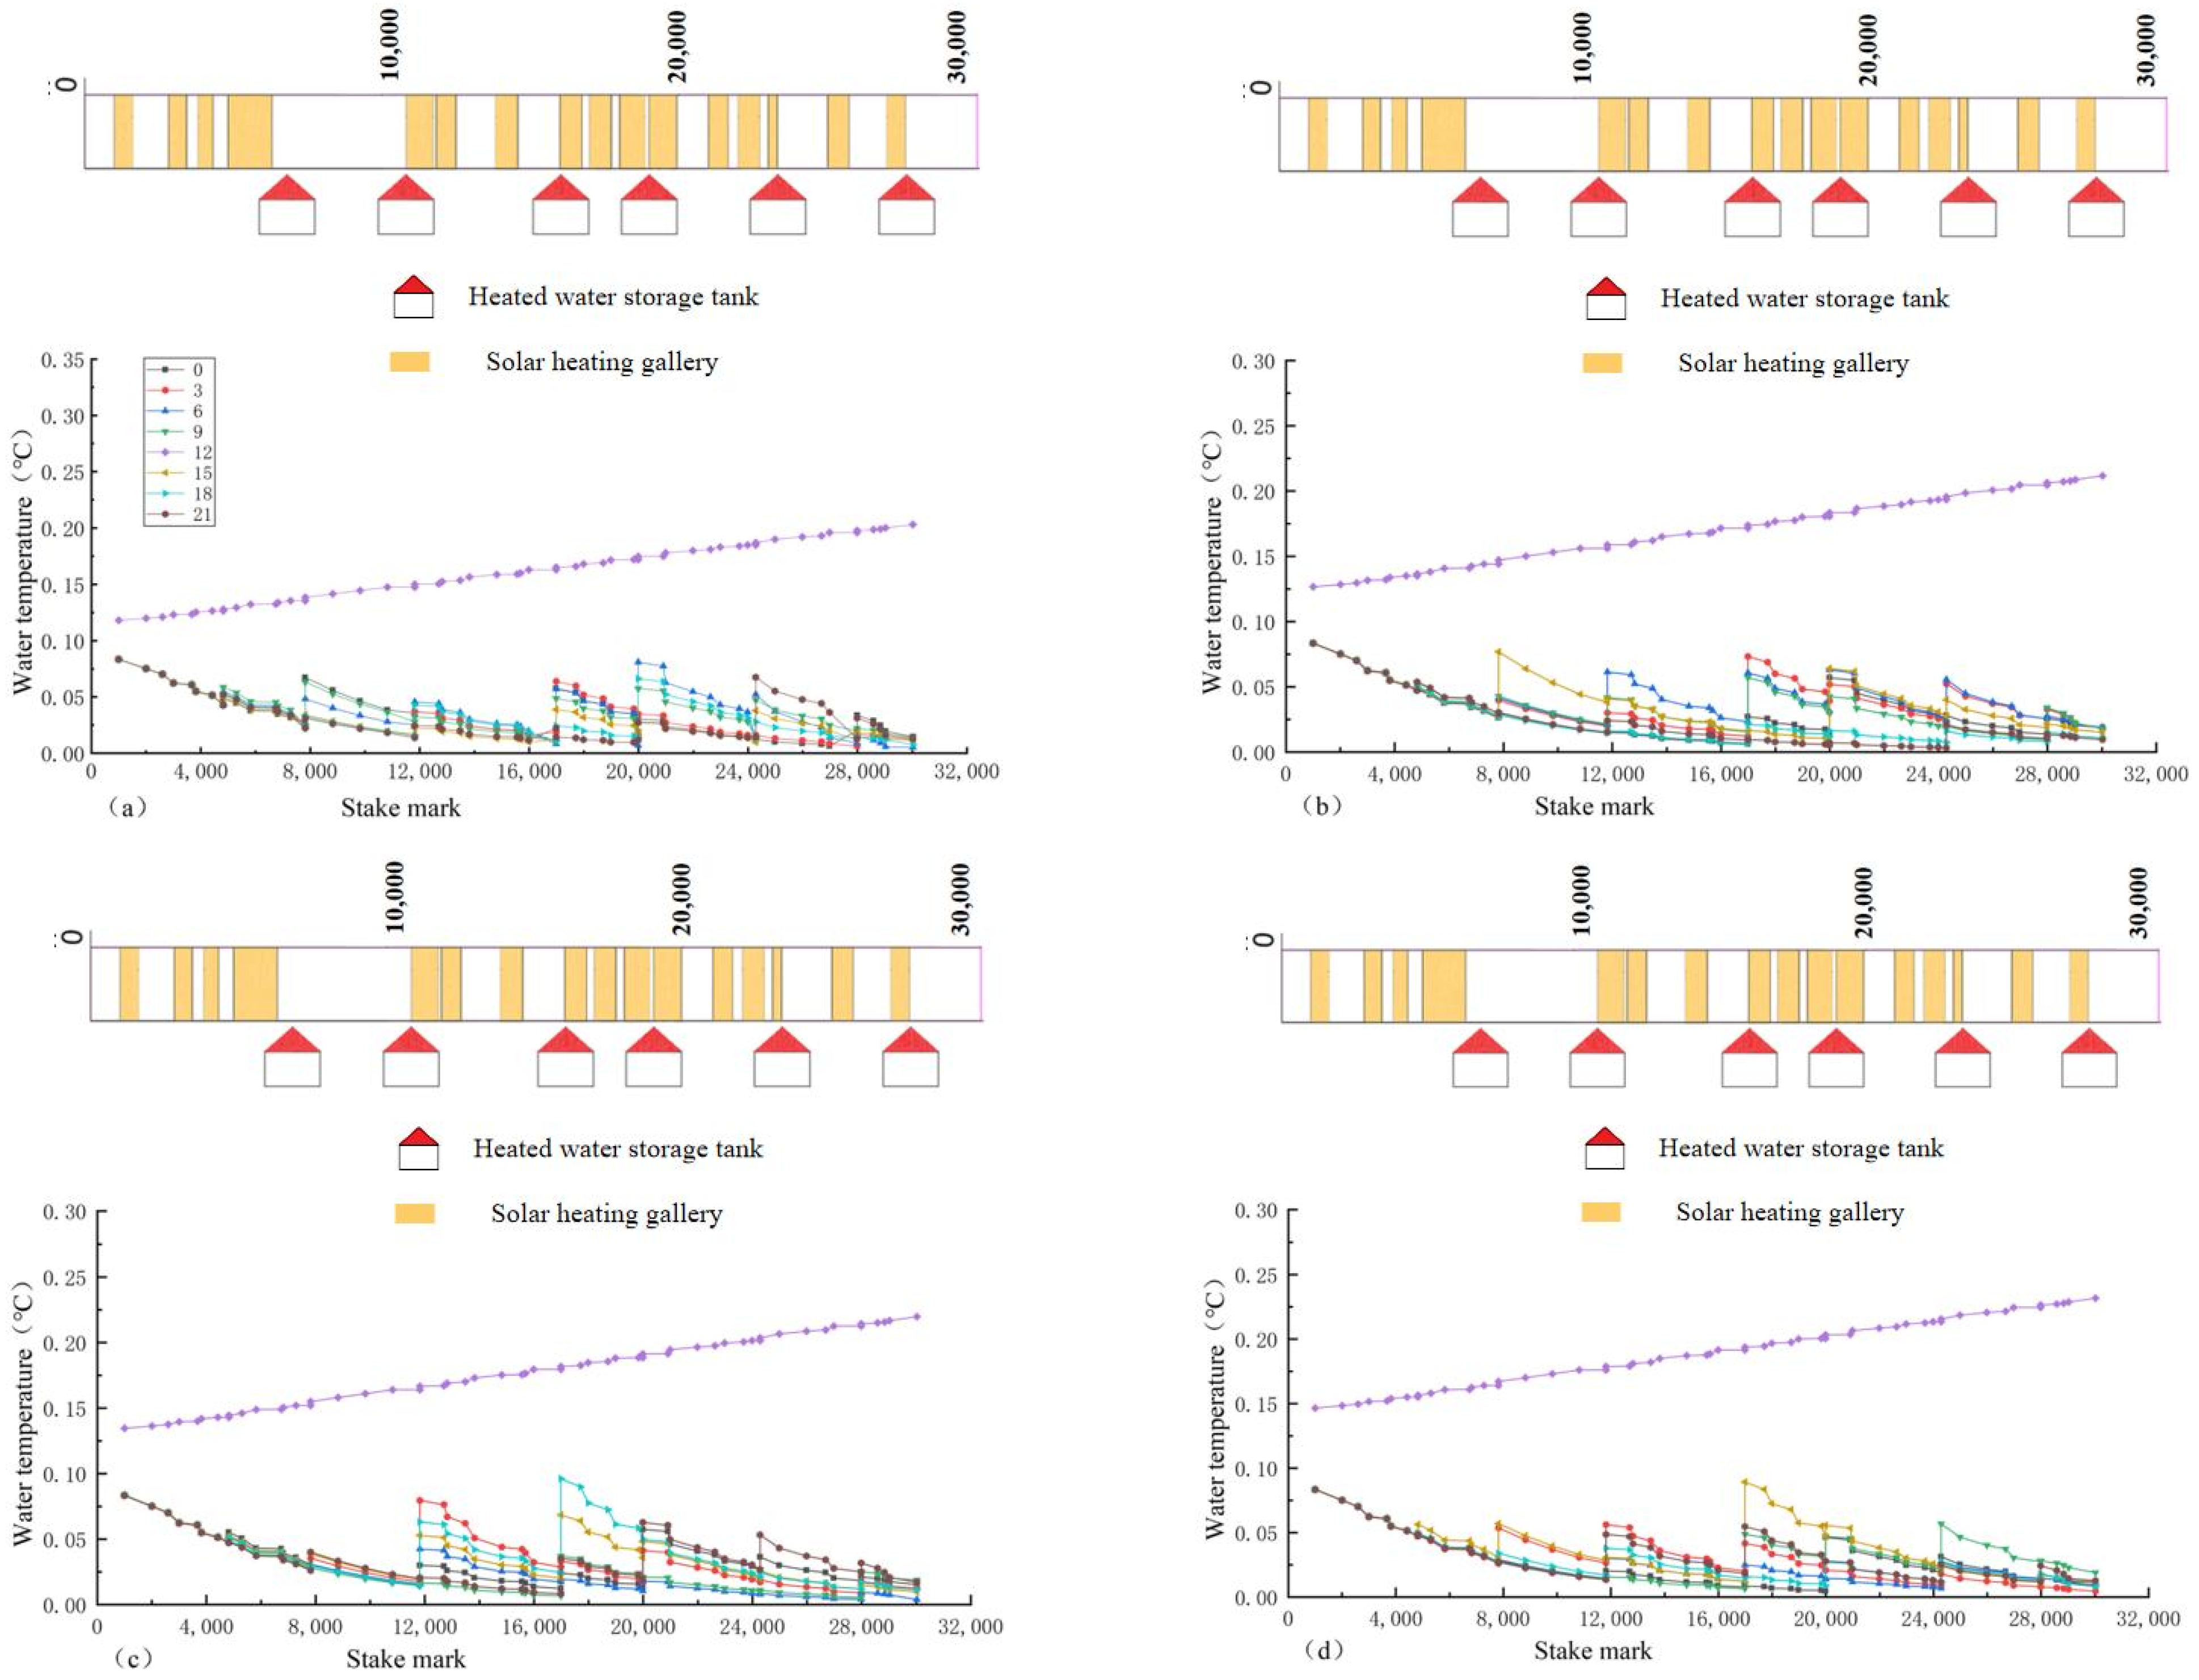
4.3. Analysis of the Influence of Downstream Depth before the Gate

Under the conventional operation mode, the channel section is operated with a downstream depth of 6 m. Therefore, with the change range of 0.5 m, the optimal regulatory process of each ice-melting measure, with the downstream depth being 5.5 m and 5 m, under eight different comprehensive satisfaction rates is calculated, respectively. The specific results are shown in Figure 21 and Figure 22.
As can be seen from Figure 21 and Figure 22, the water temperature of the channel under different downstream depths shows the same trend, all of which are in the shape of a “ladder”, but the fluctuation degrees are different. When the water flow is unchanged, changing the downstream depth is mainly to change the flow area so as to change the velocity of the flow; the basic principle is the same as changing the water flow. Therefore, the relationship between the downstream depth, comprehensive satisfaction rate, and operating cost can be obtained under the same water flow. The three-dimensional figure of the velocity of flow, comprehensive satisfaction rate, and operating cost is shown in Figure 23, and the two-dimensional figure of the downstream depth, comprehensive satisfaction rate, and operating cost per kilometer of channel is shown in Figure 24. According to the three-dimensional figure, the relationship between the operating cost C o s t , comprehensive satisfaction rate P , and velocity of flow V is fitted, and the relationship is shown as follows:
C o s t = 75.02 + 0.22 P 73.47 V
where C o s t is the operating cost of all ice-melting measures, CNY; and P is the comprehensive satisfaction rate.
According to Figure 24, there is a positive correlation between the downstream depth and the operating cost per kilometer of the channel. As the downstream depth decreases and the velocity of flow increases, the operating cost per kilometer of the channel also decreases. At the same time, it is found that the gradient of operating cost reduction also decreases, and the cost reduction rate decreases from 8.1% to 4.8% for every 0.5 m reduction in the downstream depth. It can be seen that the value of the downstream depth should be within a reasonable range, and the change in the water level and cost-effective ratio should be taken into account when determining the downstream depth to ensure the safe and efficient operation of the project.

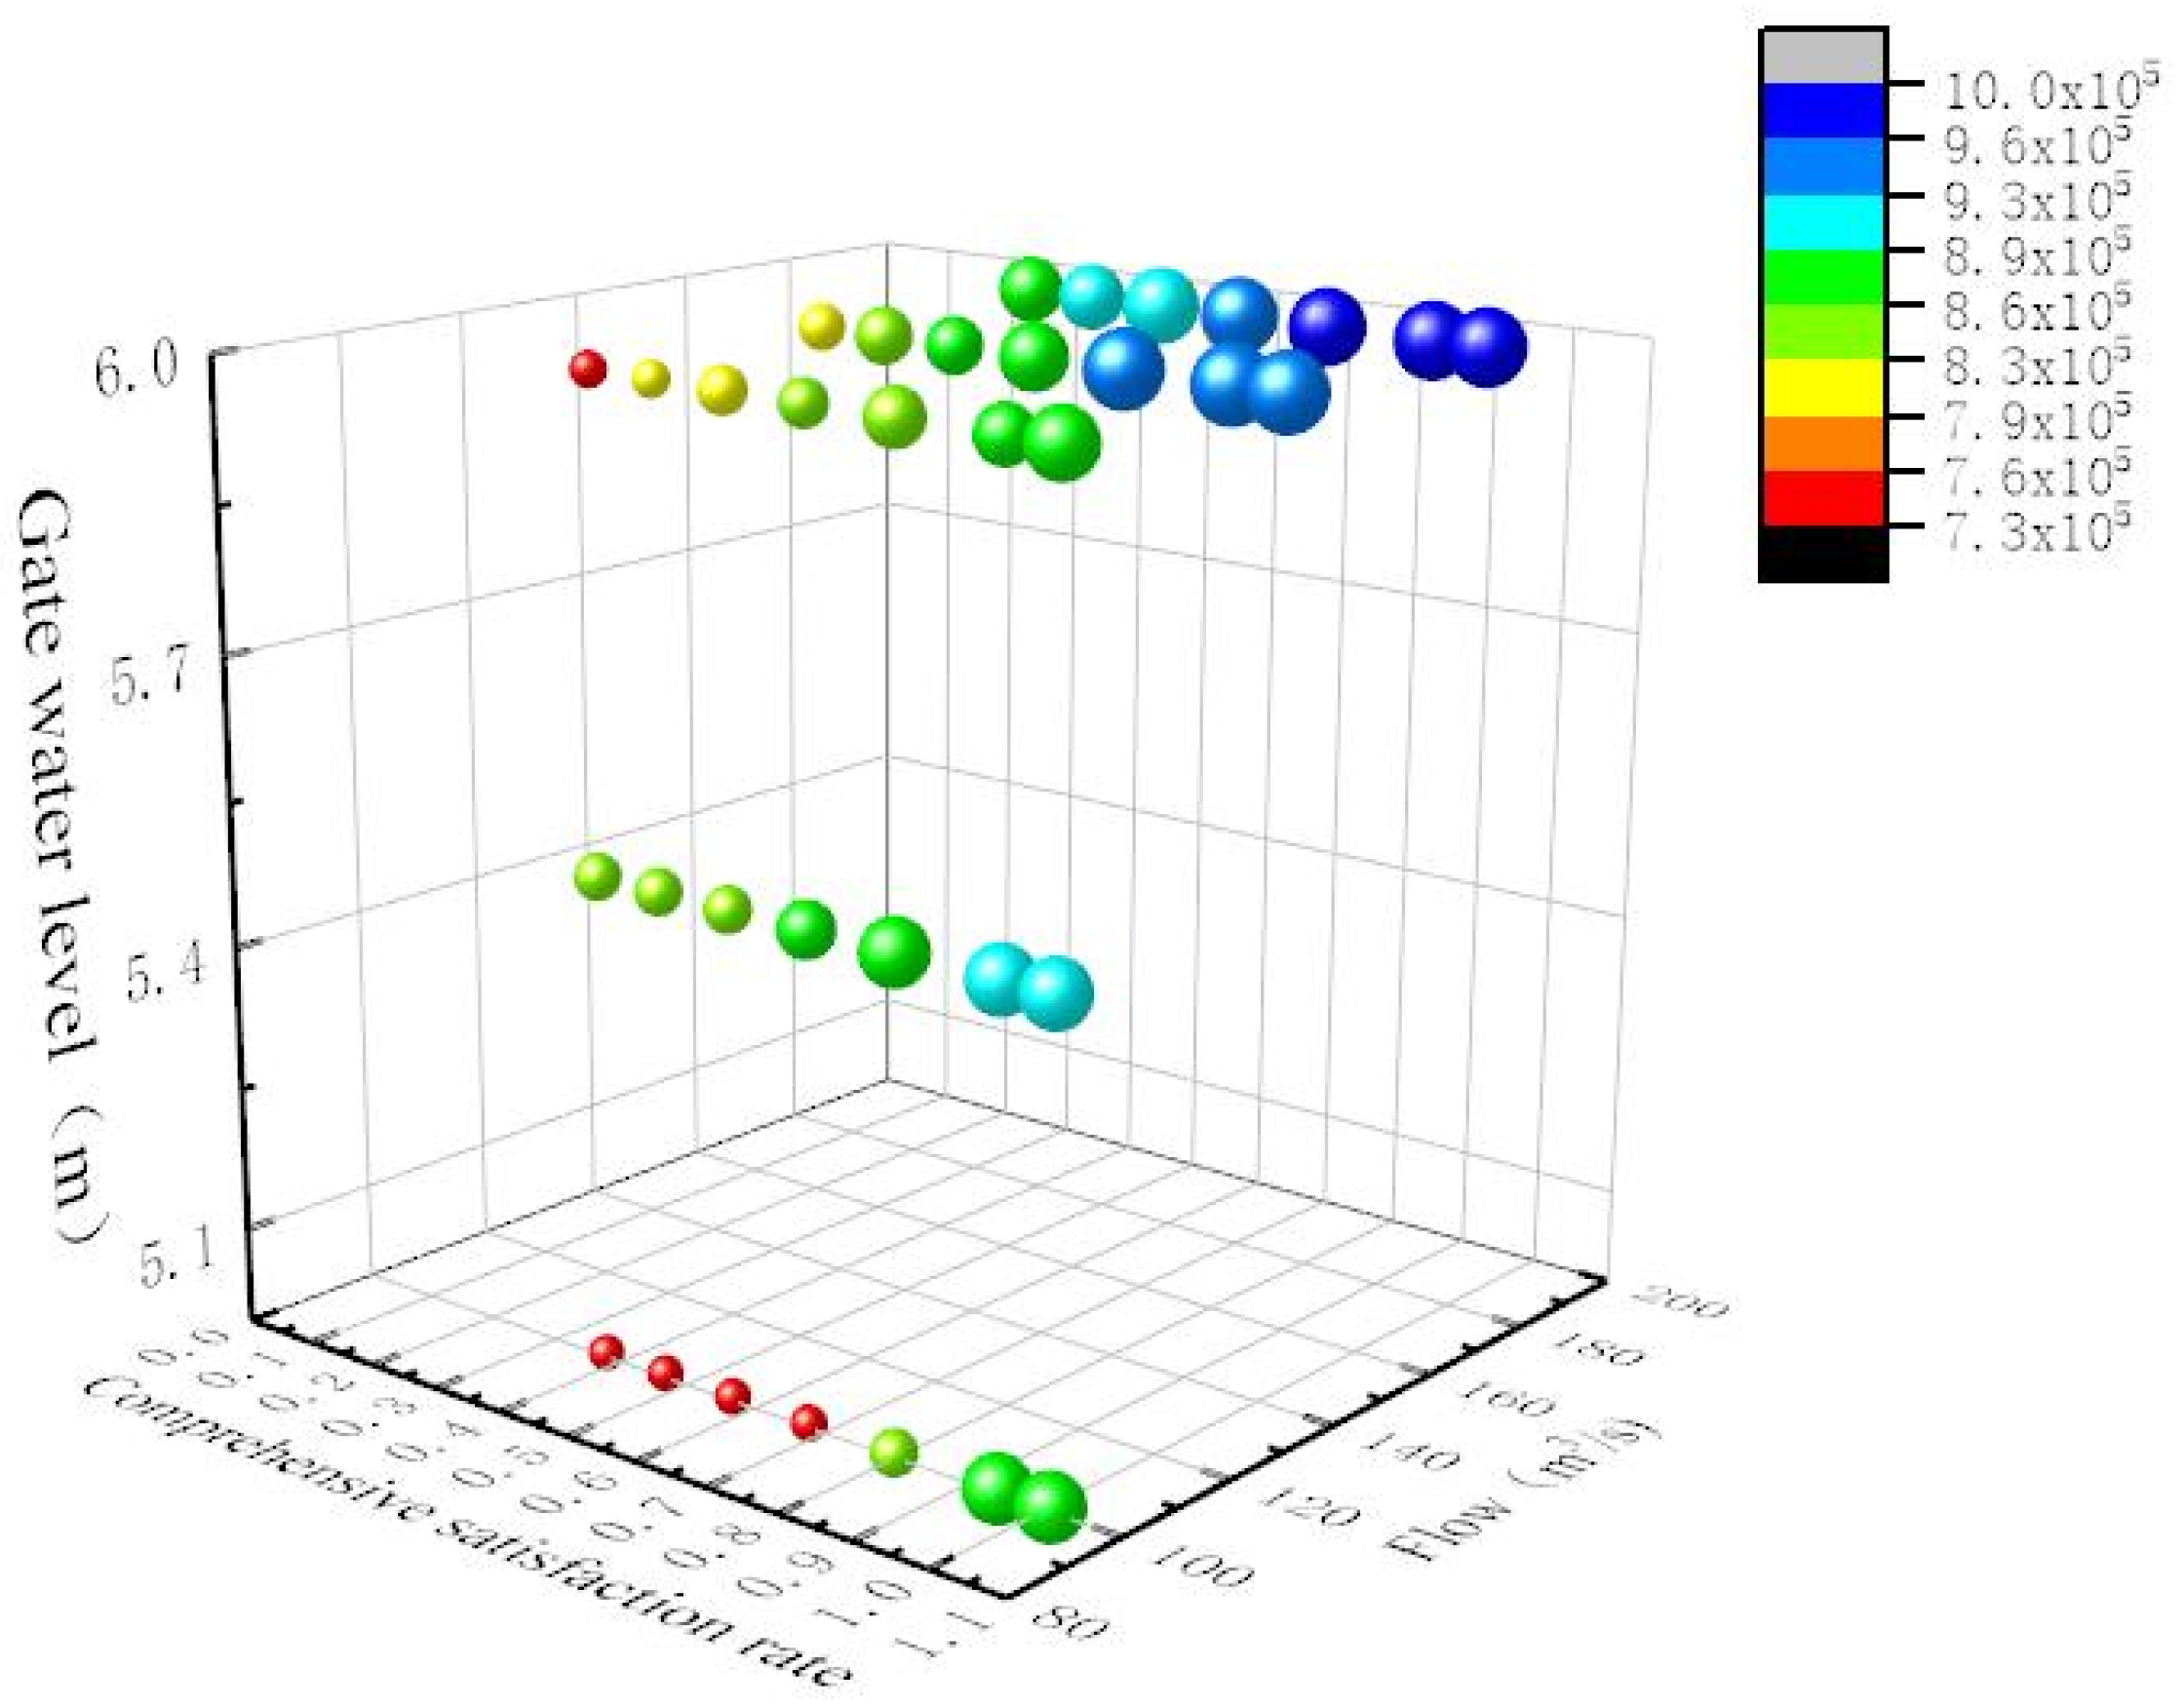
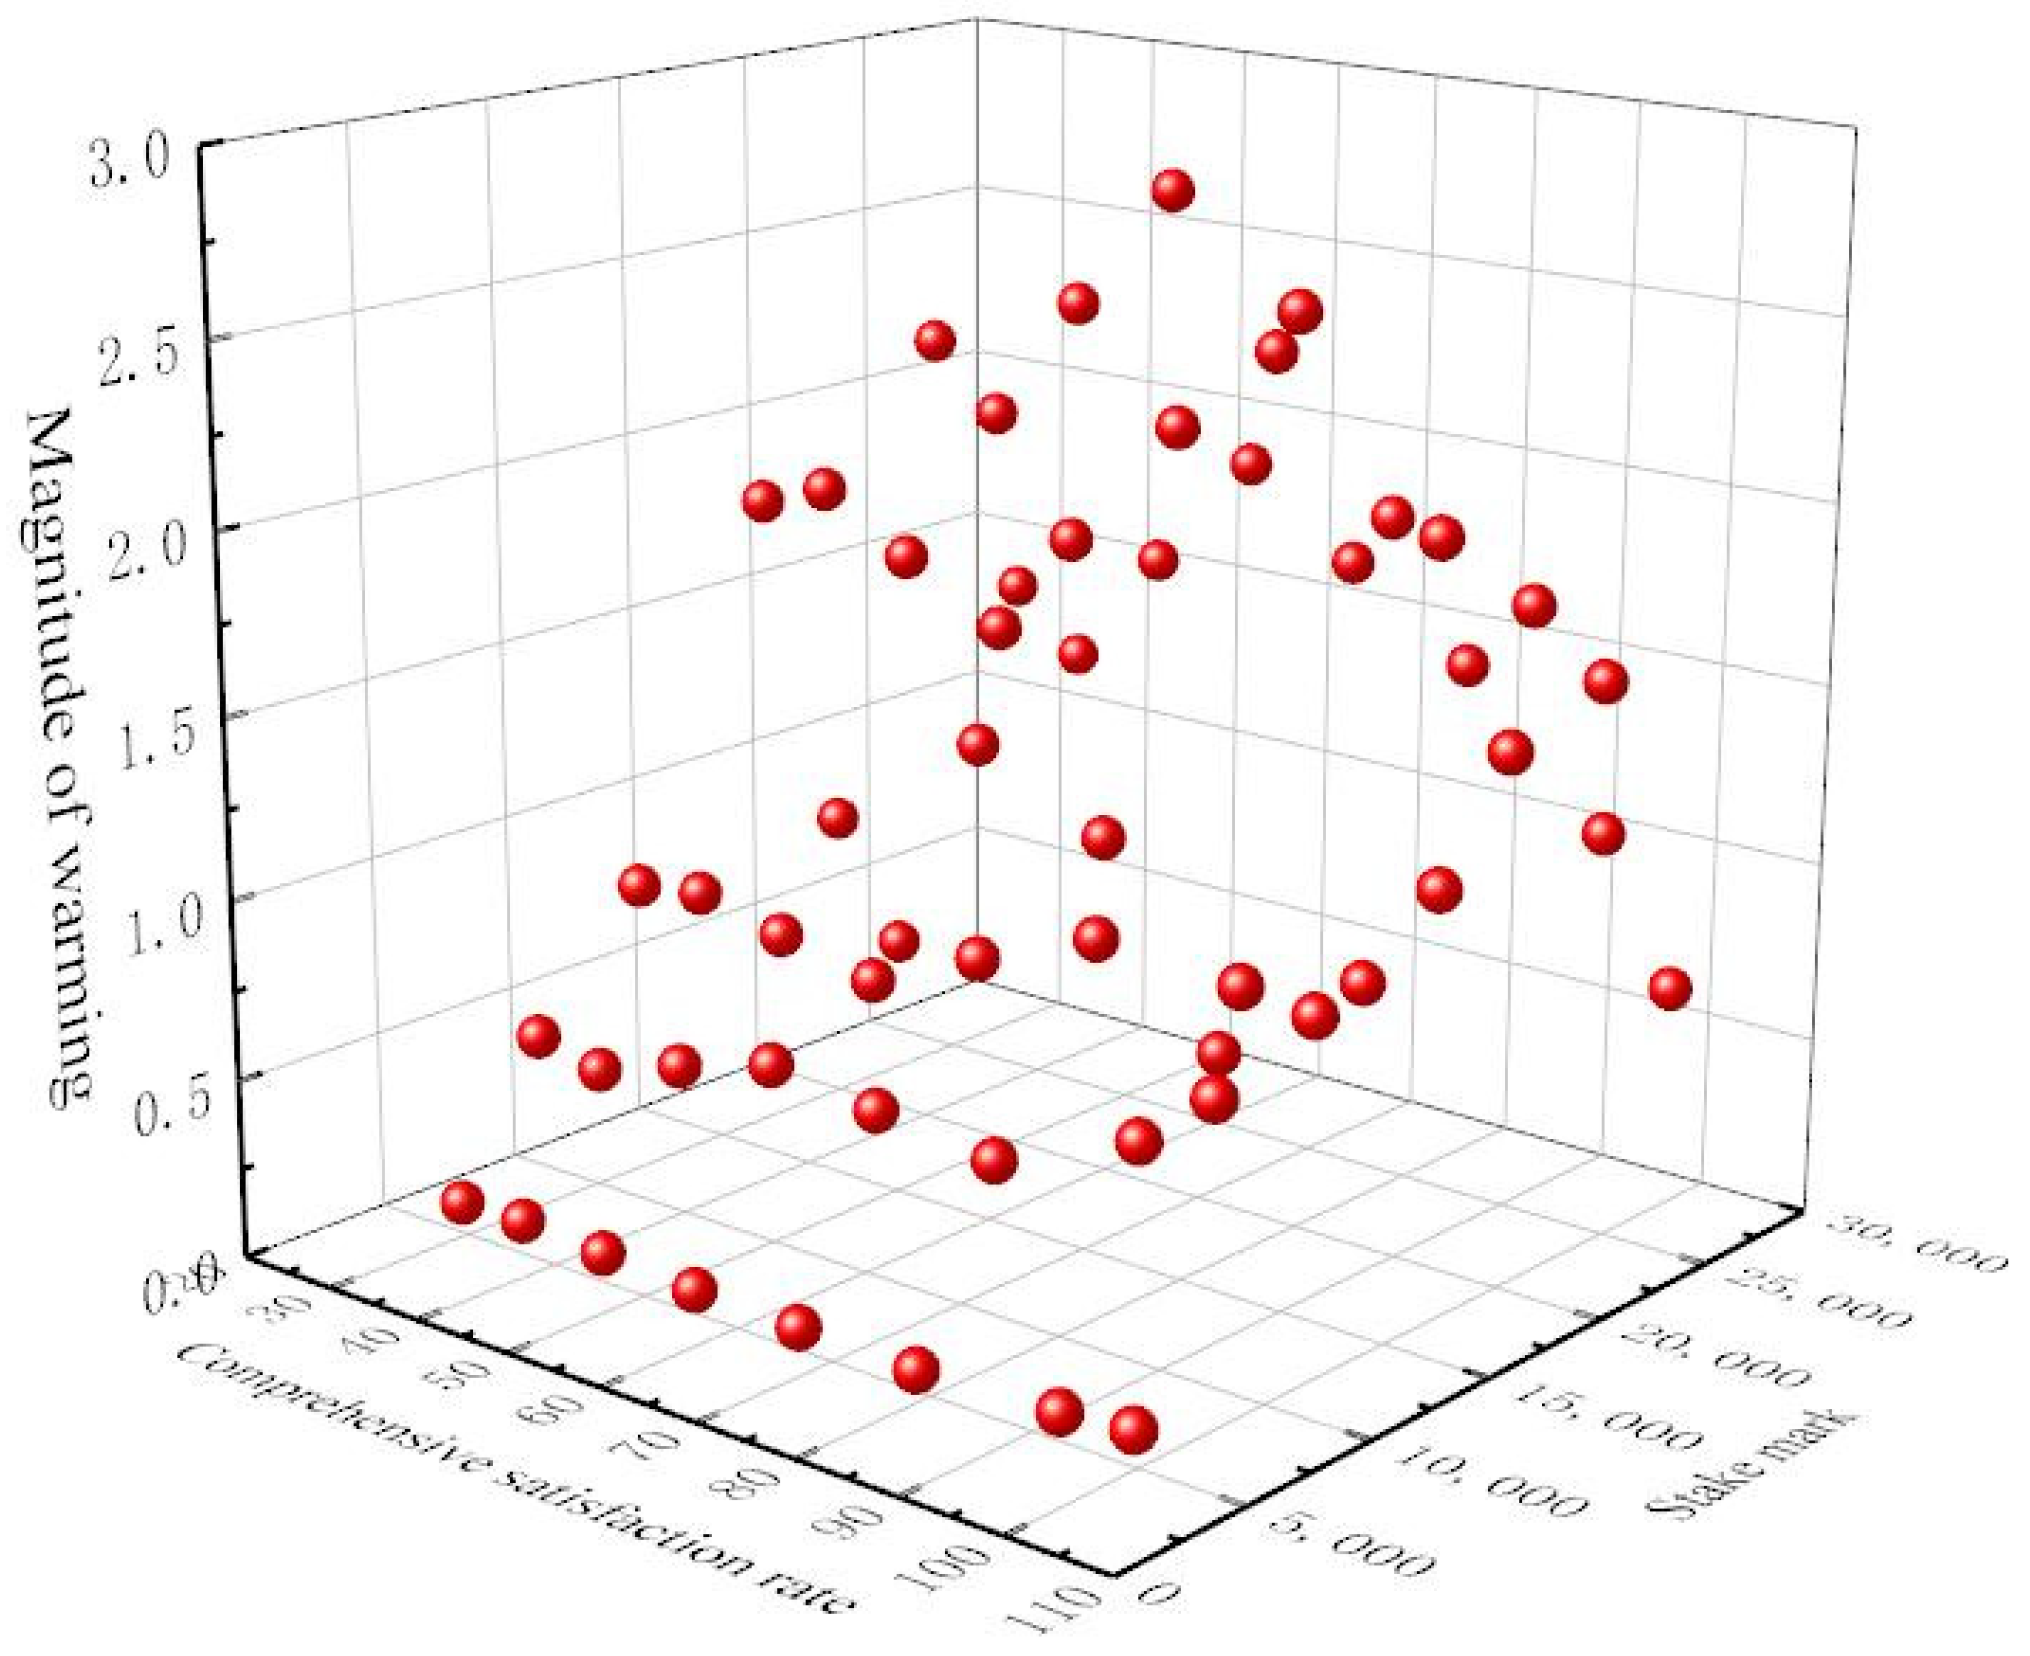
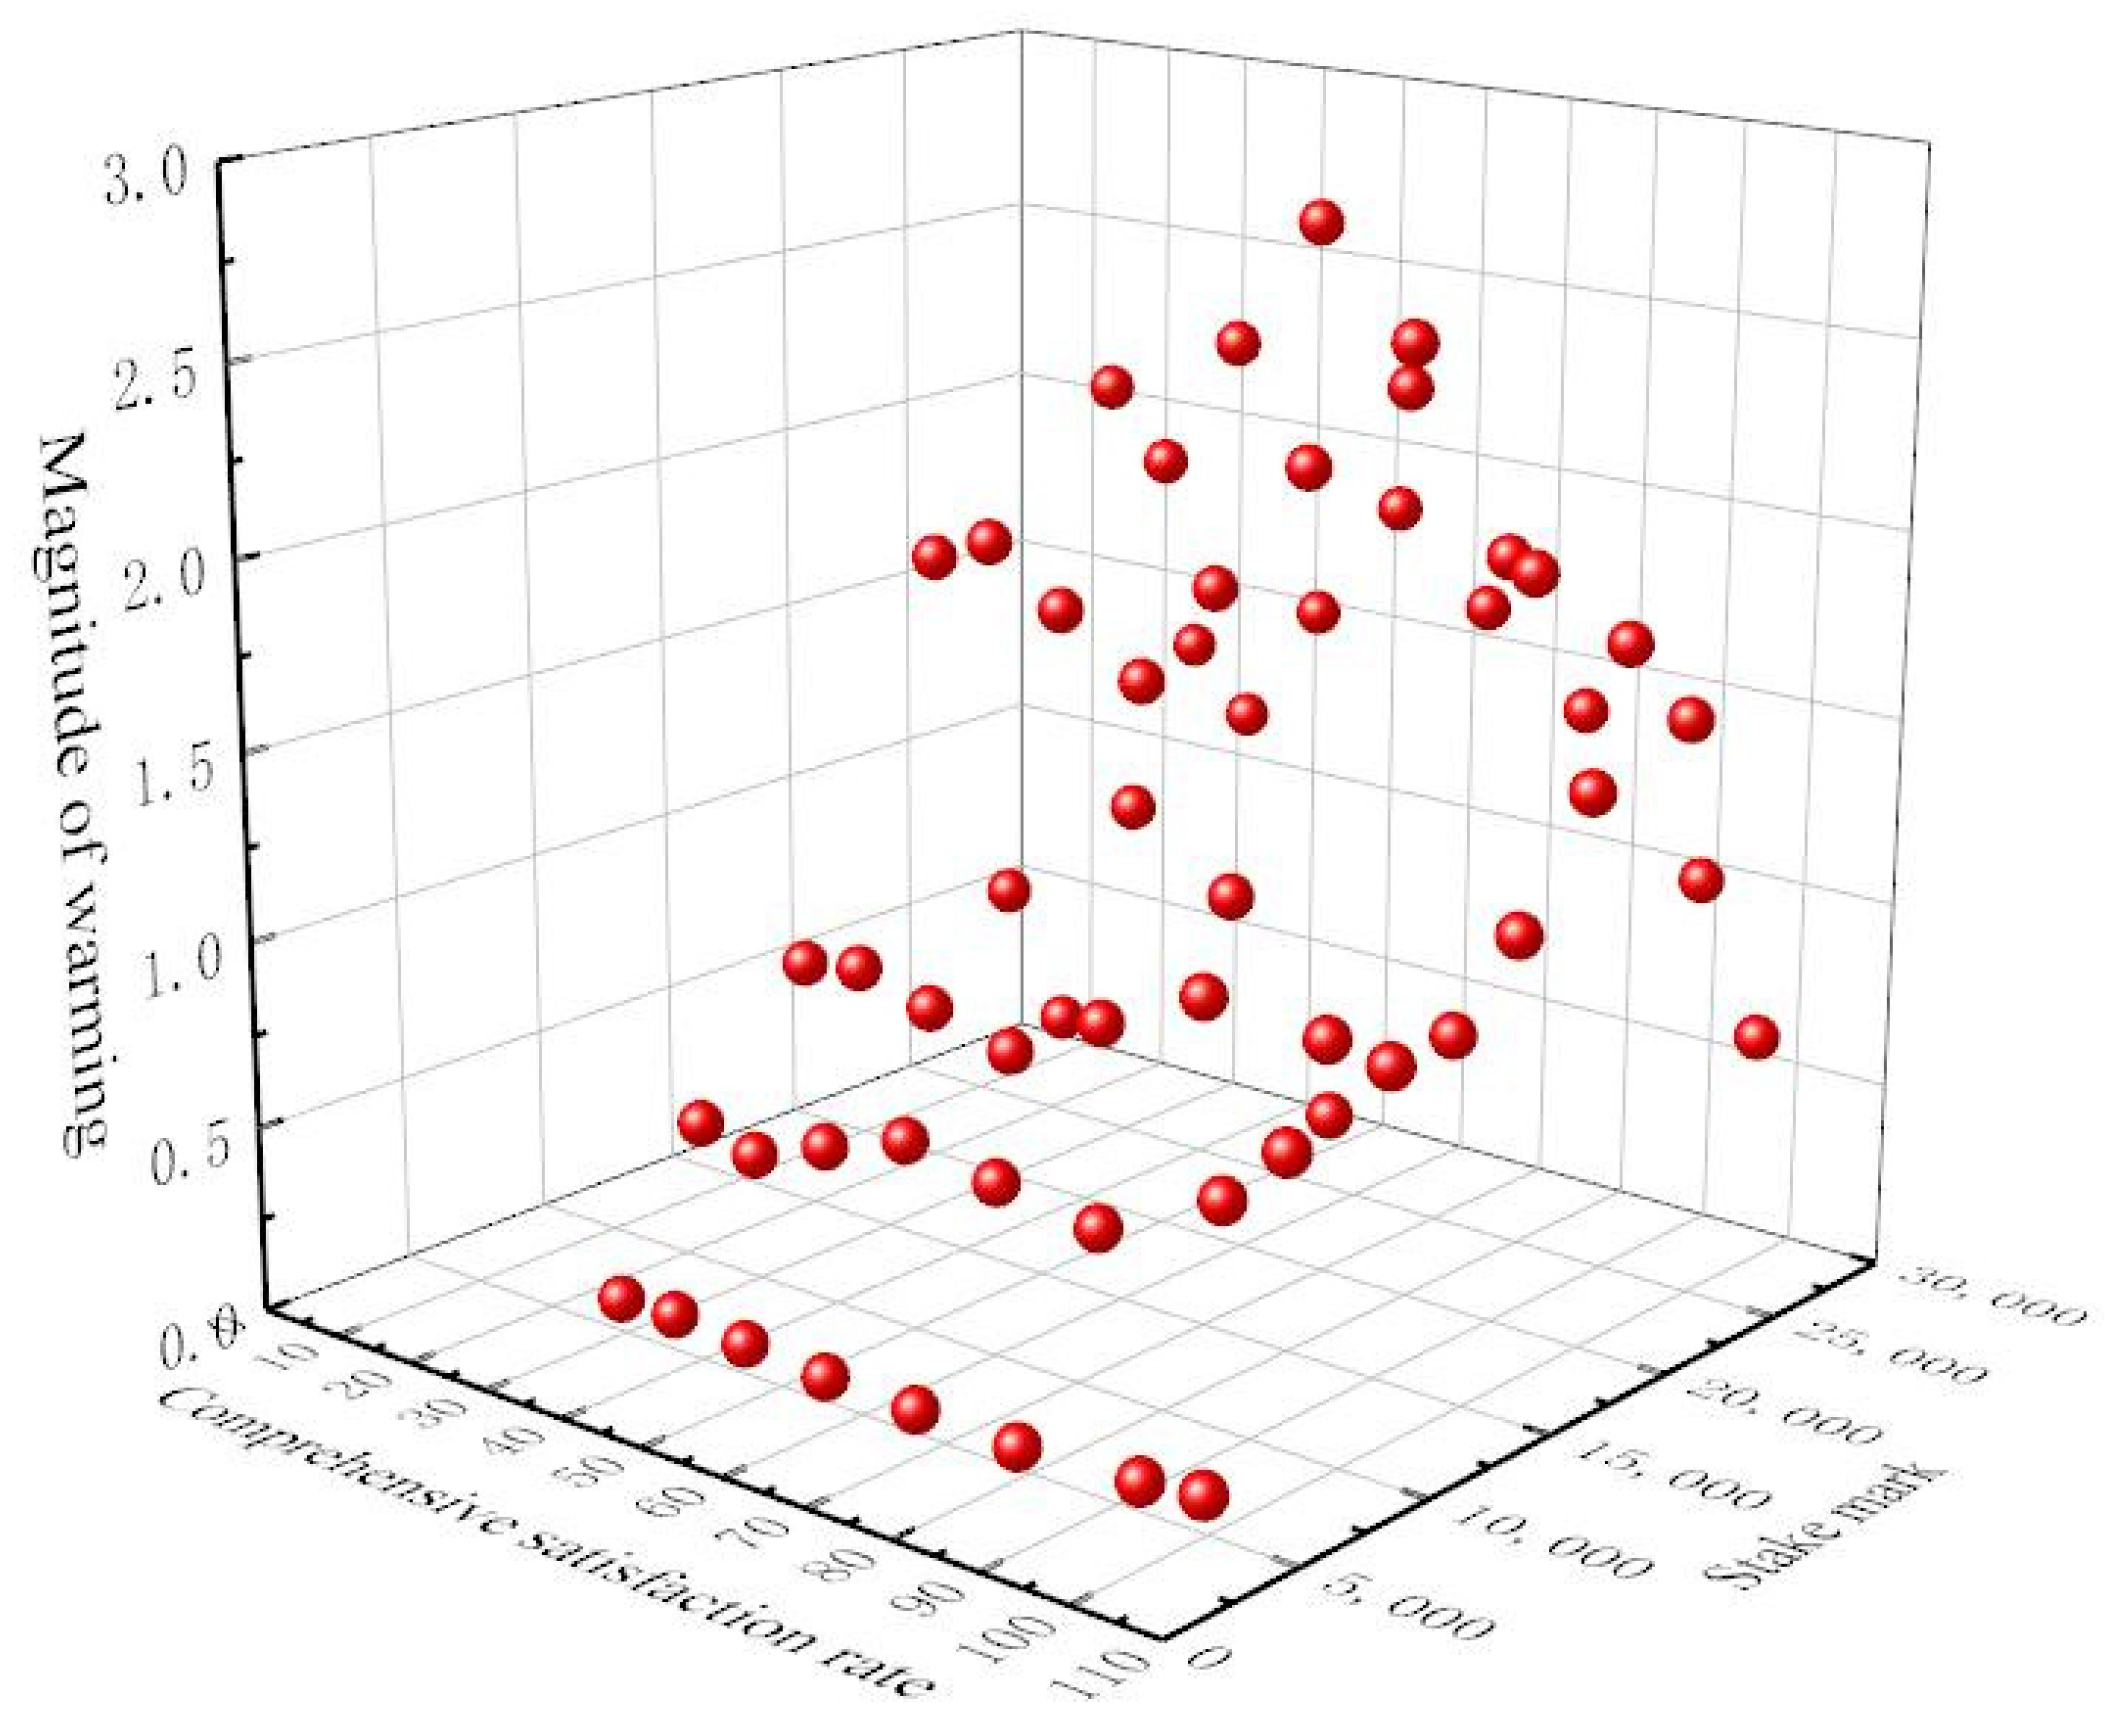
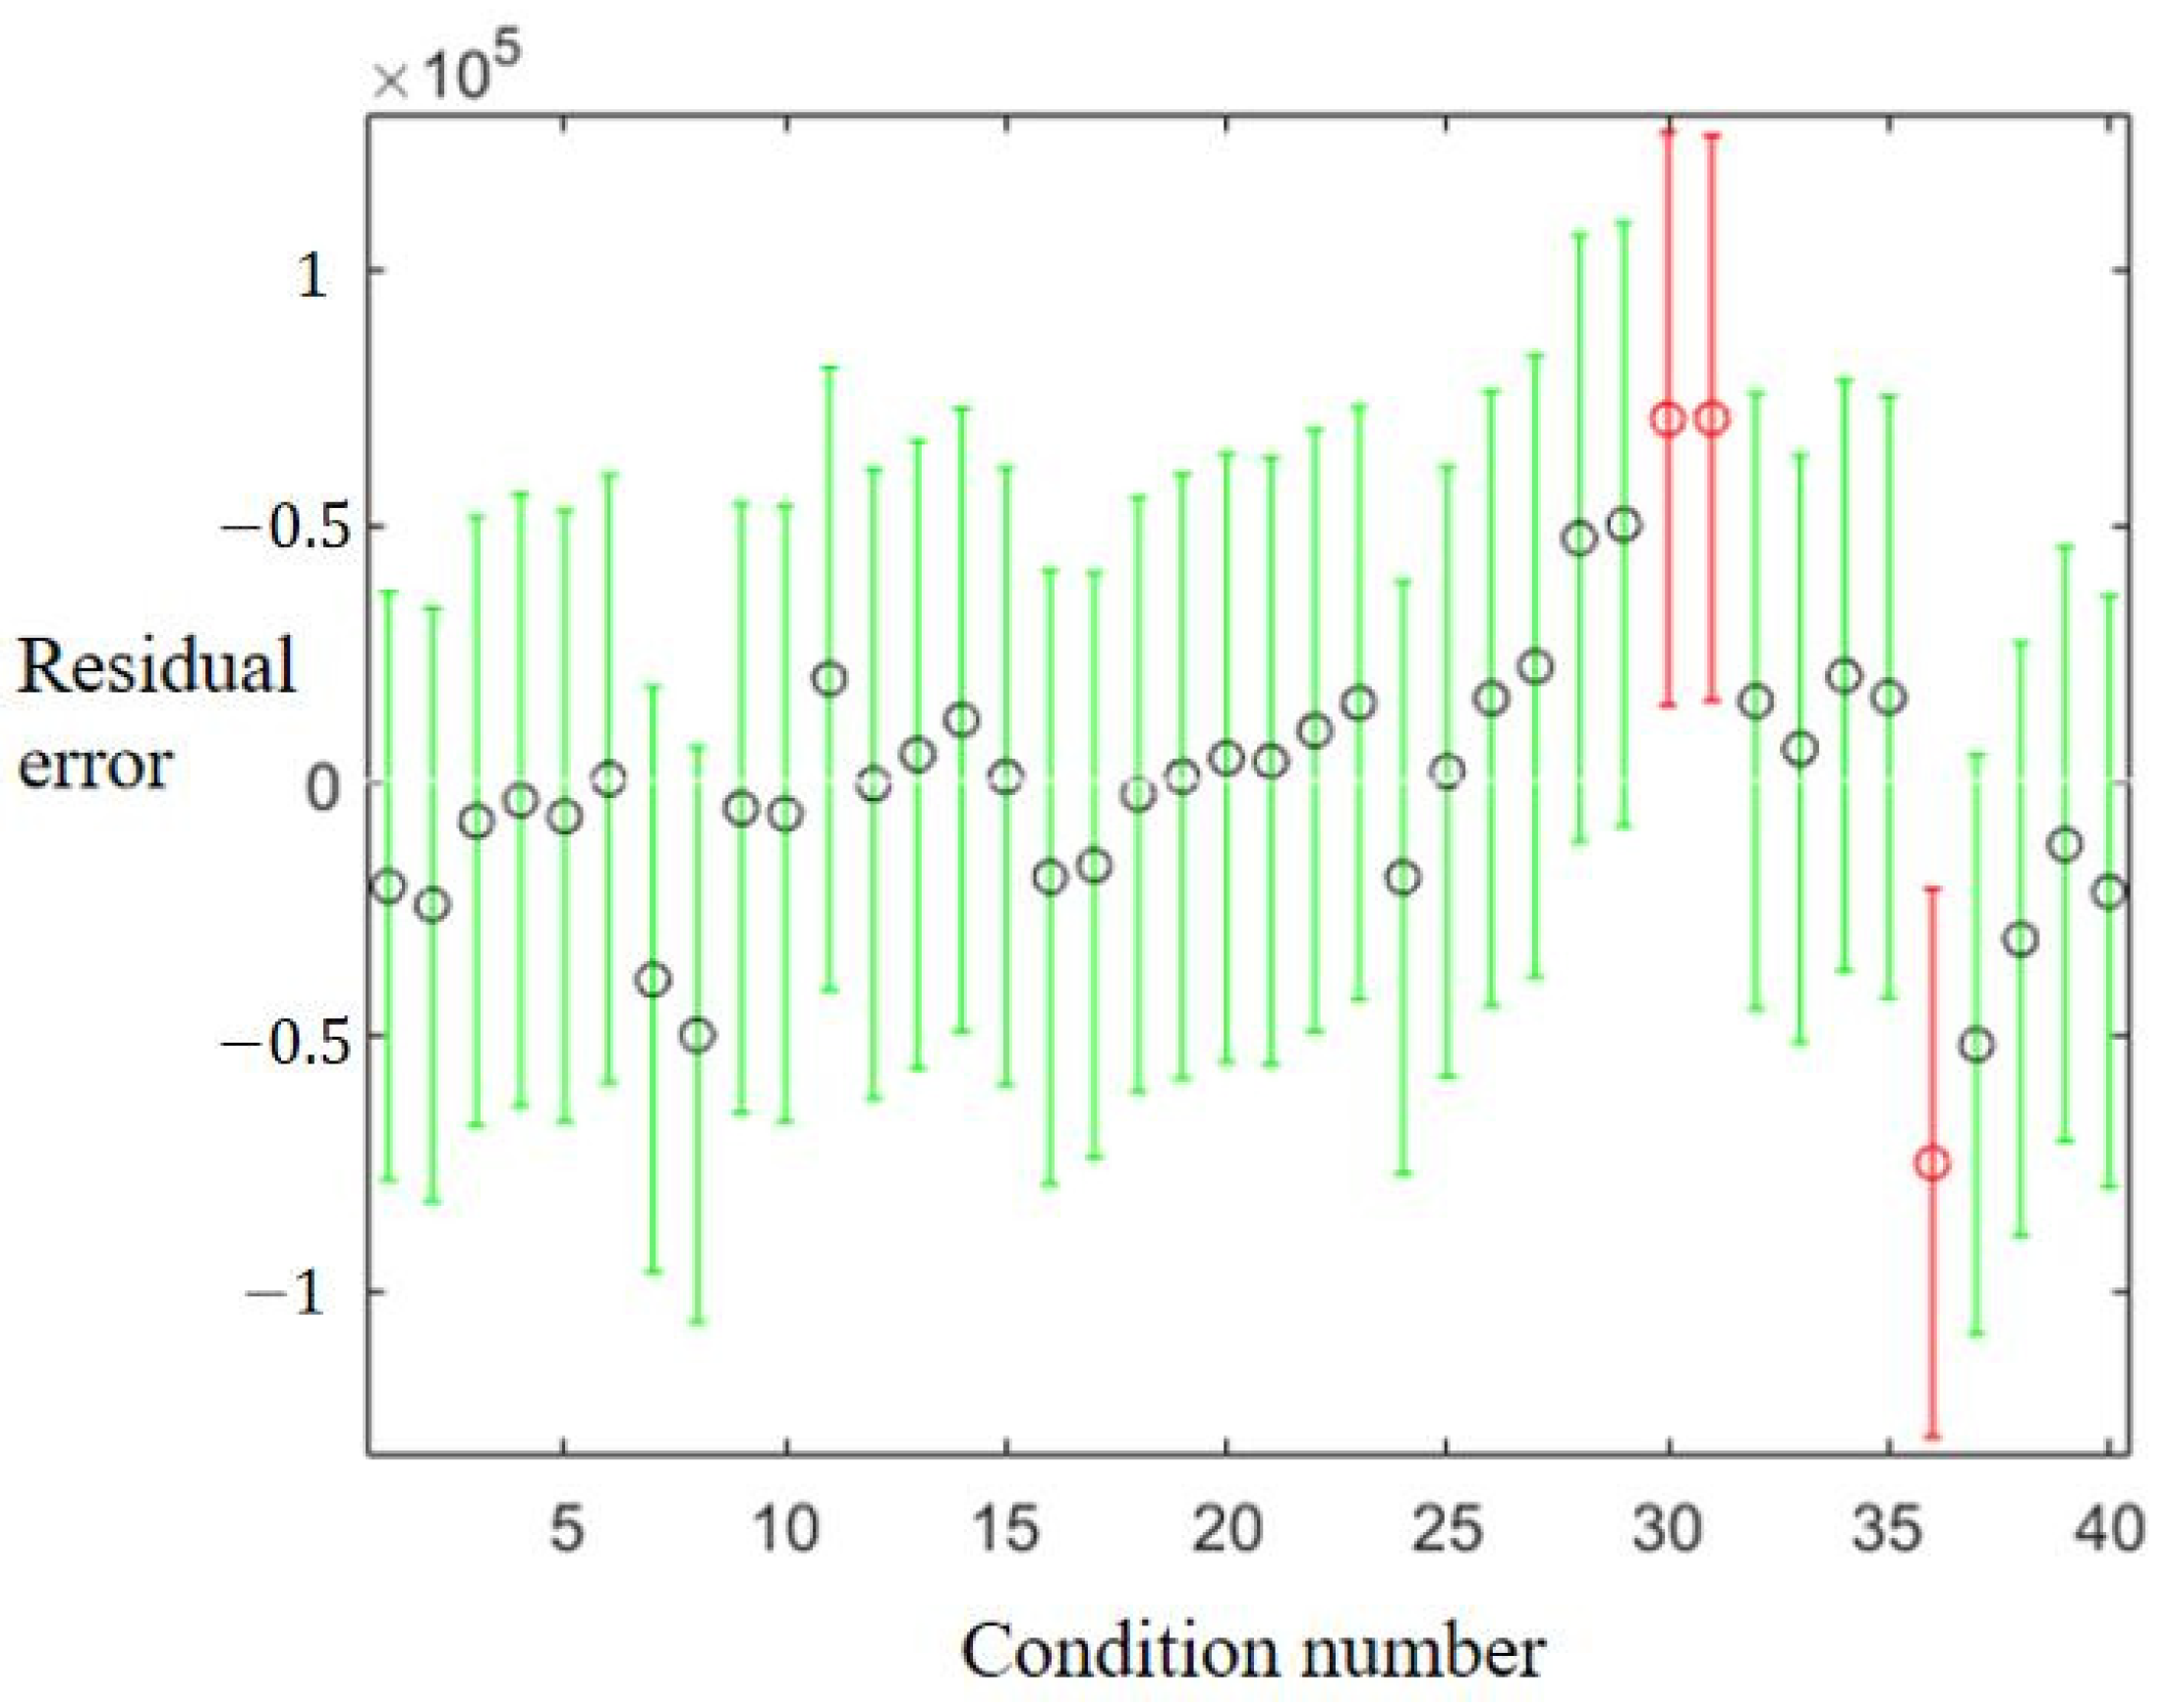
4.4. Multi-Factor Relationship Fitting

According to all the above calculation conditions, a total of 40 working conditions, with the comprehensive satisfaction rate, water flow, and downstream depth as influencing factors, are selected as fitting objects, and their specific information is shown in Figure 25. Then, correlation fitting is carried out to obtain the mathematical relationship formula of the operation cost C o s t , comprehensive satisfaction rate P , water flow Q , and downstream depth H g when installing the solar heating device, as shown in Equation (20).
C o s t = 3.87 × 10 5 + 2.1 × 10 5 P + 1240 Q + 0.31 × 10 5 H g
Then, the residual calculation is carried out on the fitting relation, as shown in Figure 26, where the green is the residual range, and the black point is the actual operating cost value. It can be seen from the figure that the error is 92.5% within the reasonable range, which is within the permissible range. To better verify the accuracy of the relationship, five kinds of condition combinations are randomly generated, and their errors are analyzed. The calculation results are shown in Table 7.
It can be seen from the table that the error rate of these 10 condition combinations is small, all within the allowable range of 5%, so it can be concluded that the fitted relationship has good accuracy and reliability and provides technical support and reference for future parameter simulations.

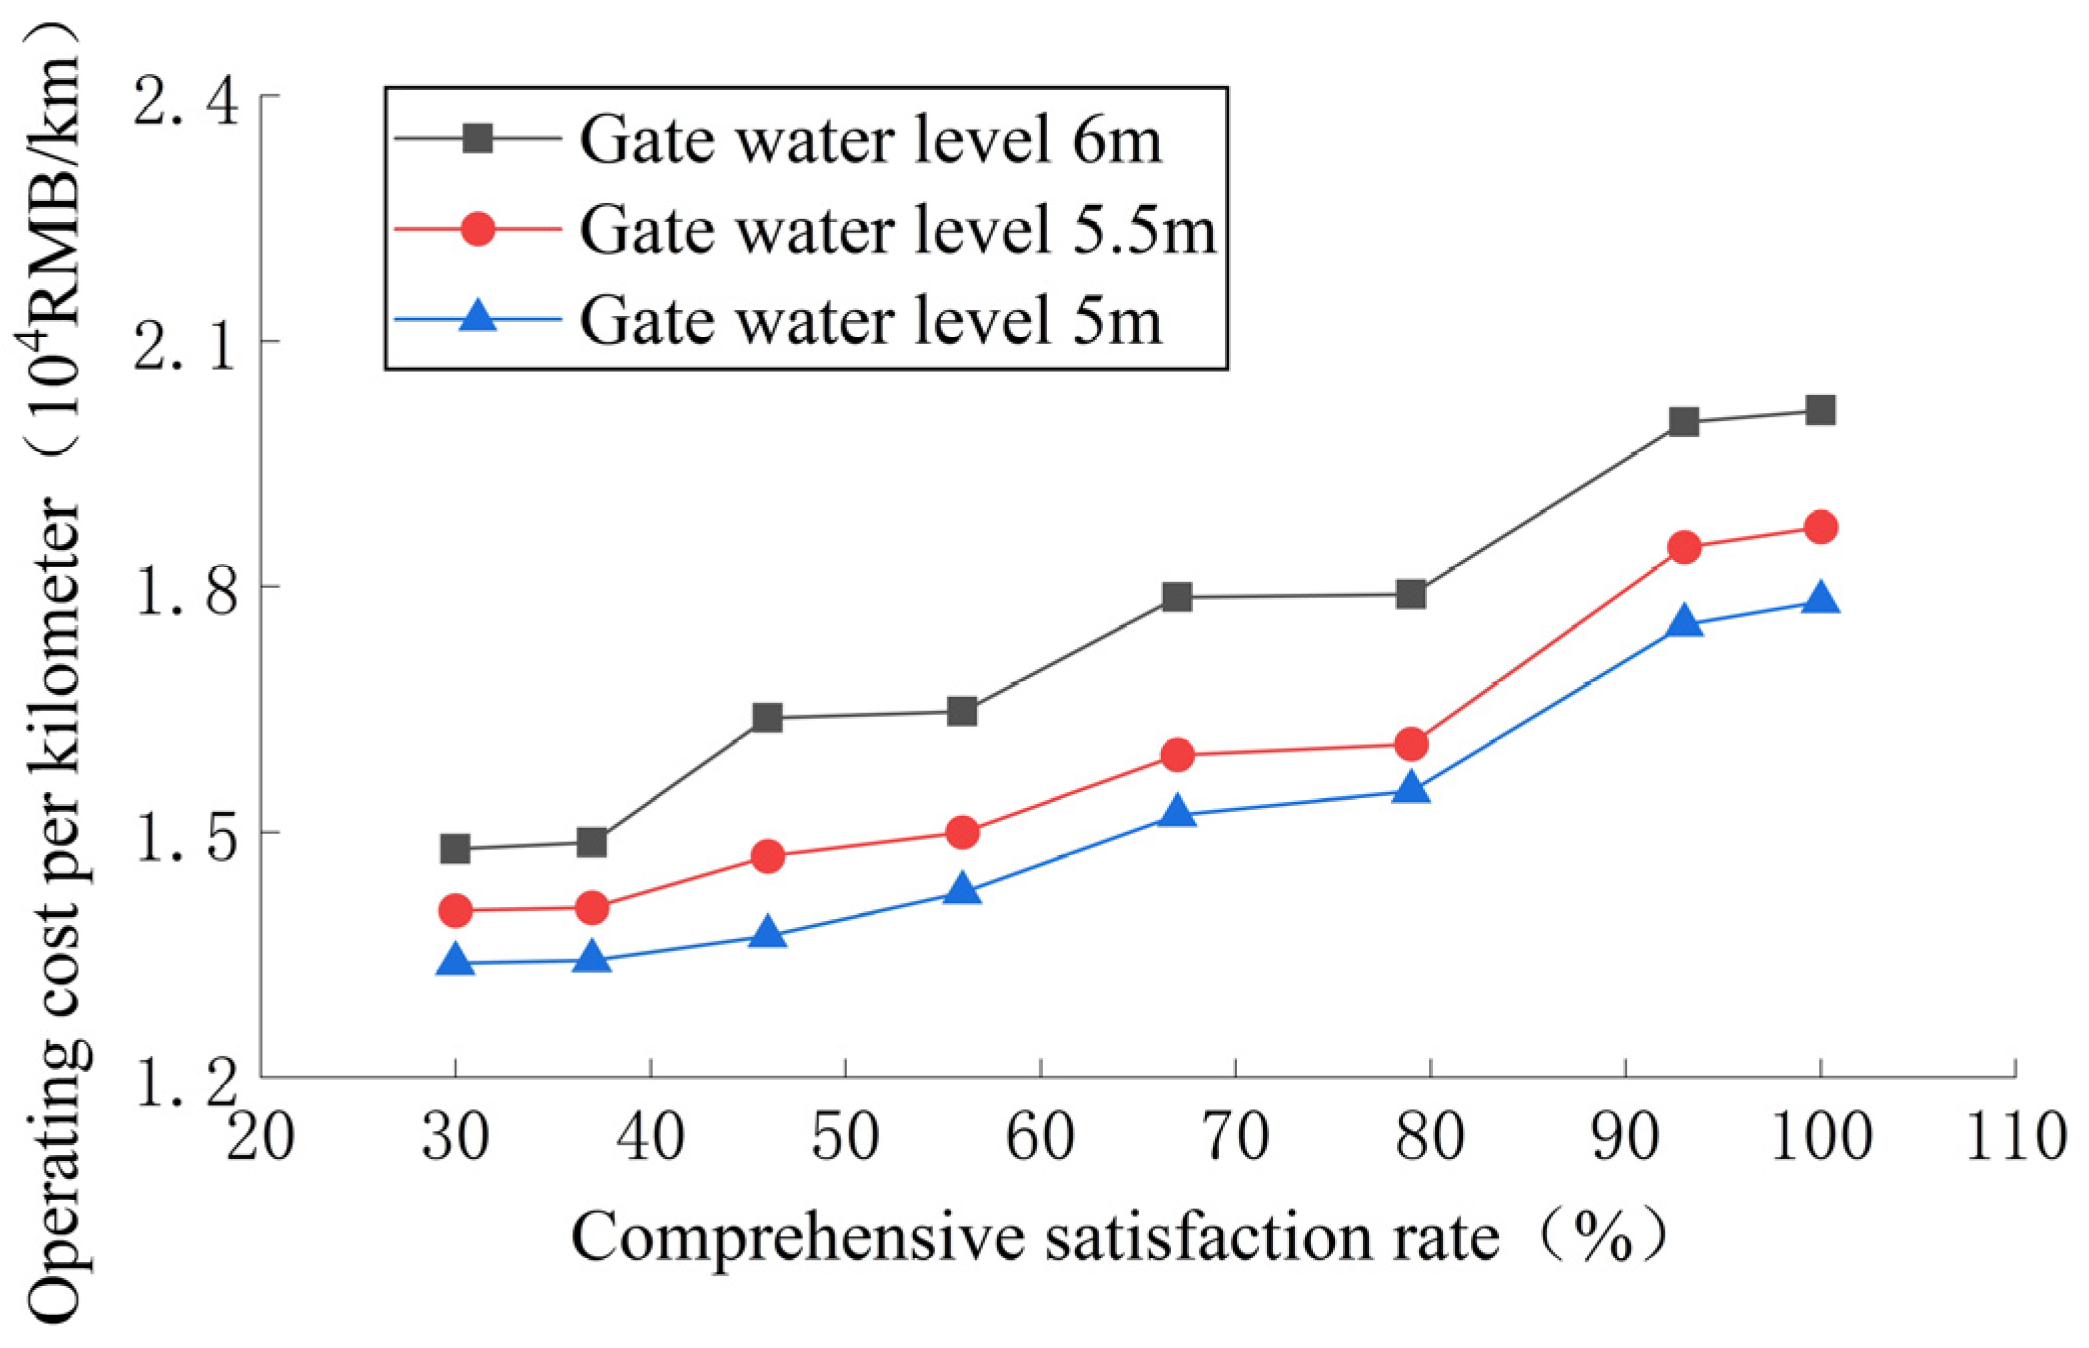
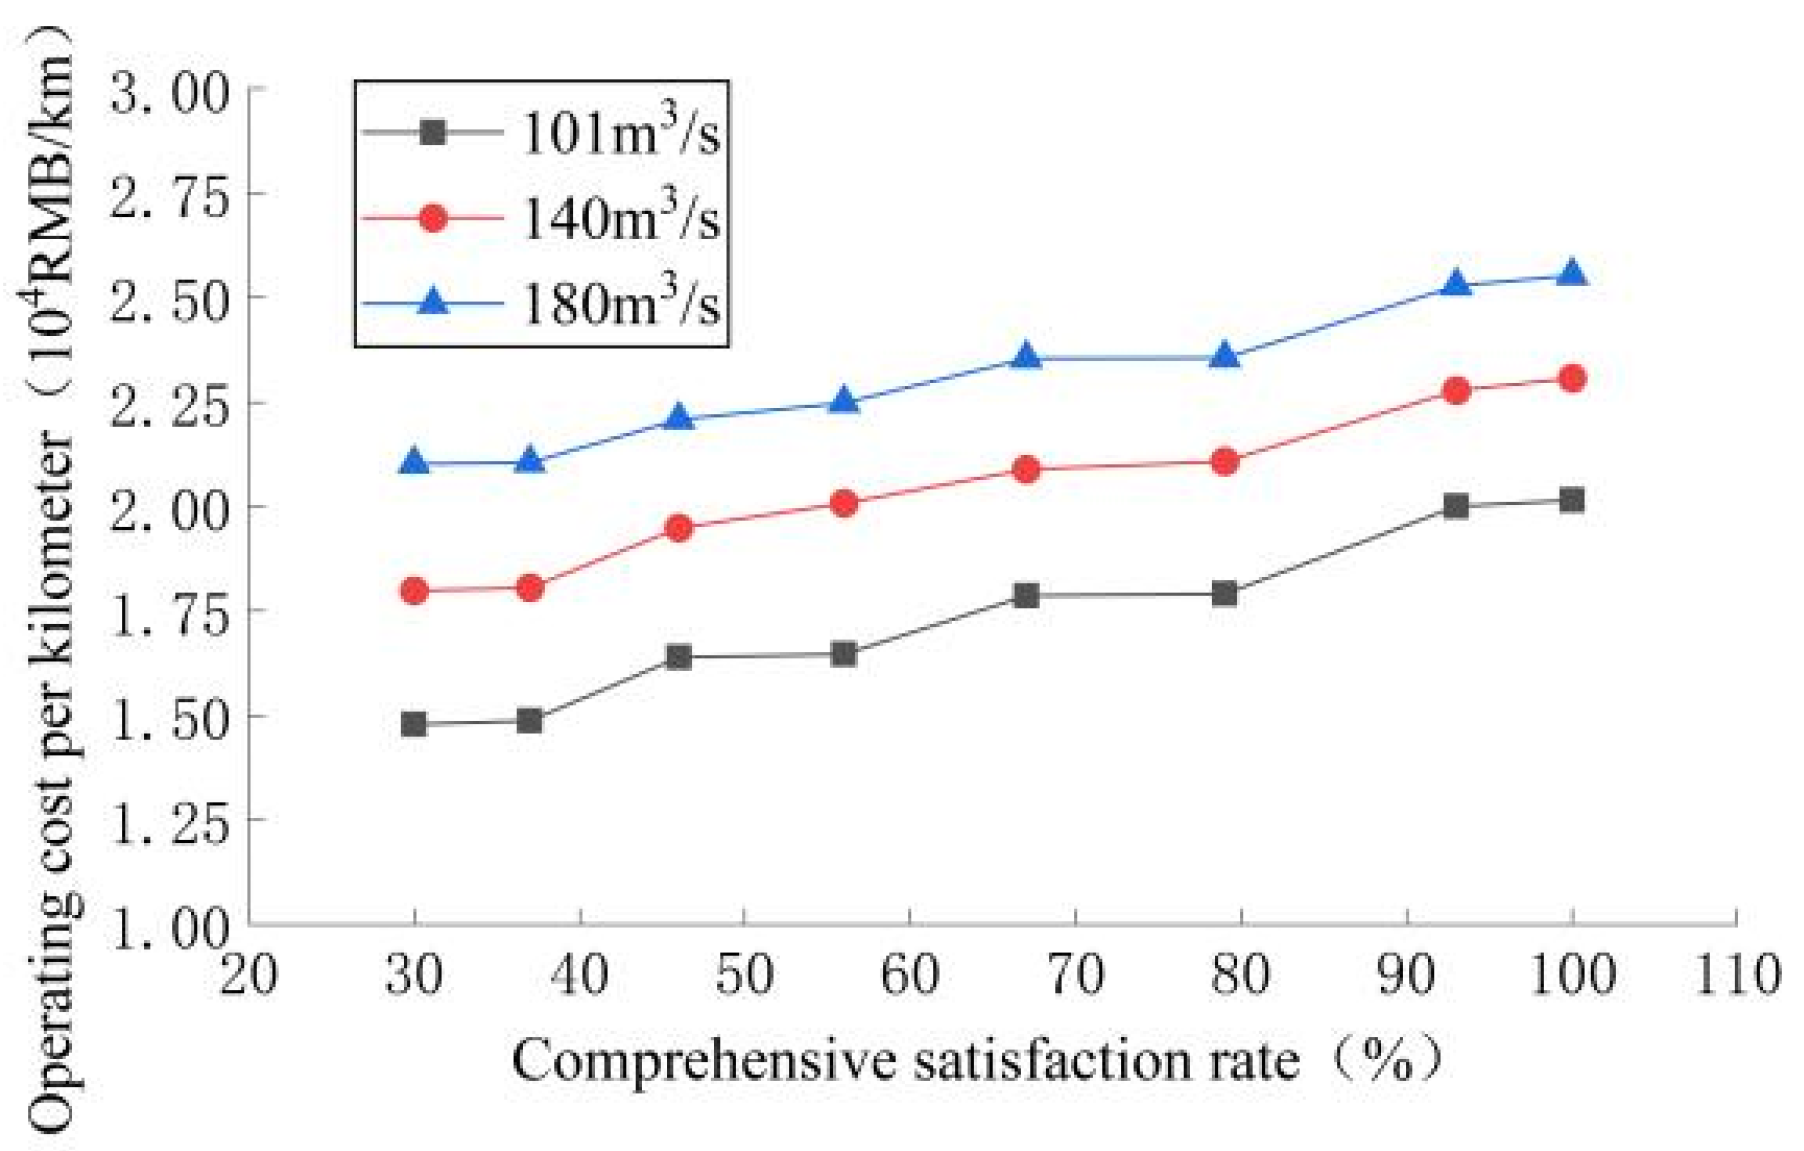
4.5. Cost and Benefit Analysis

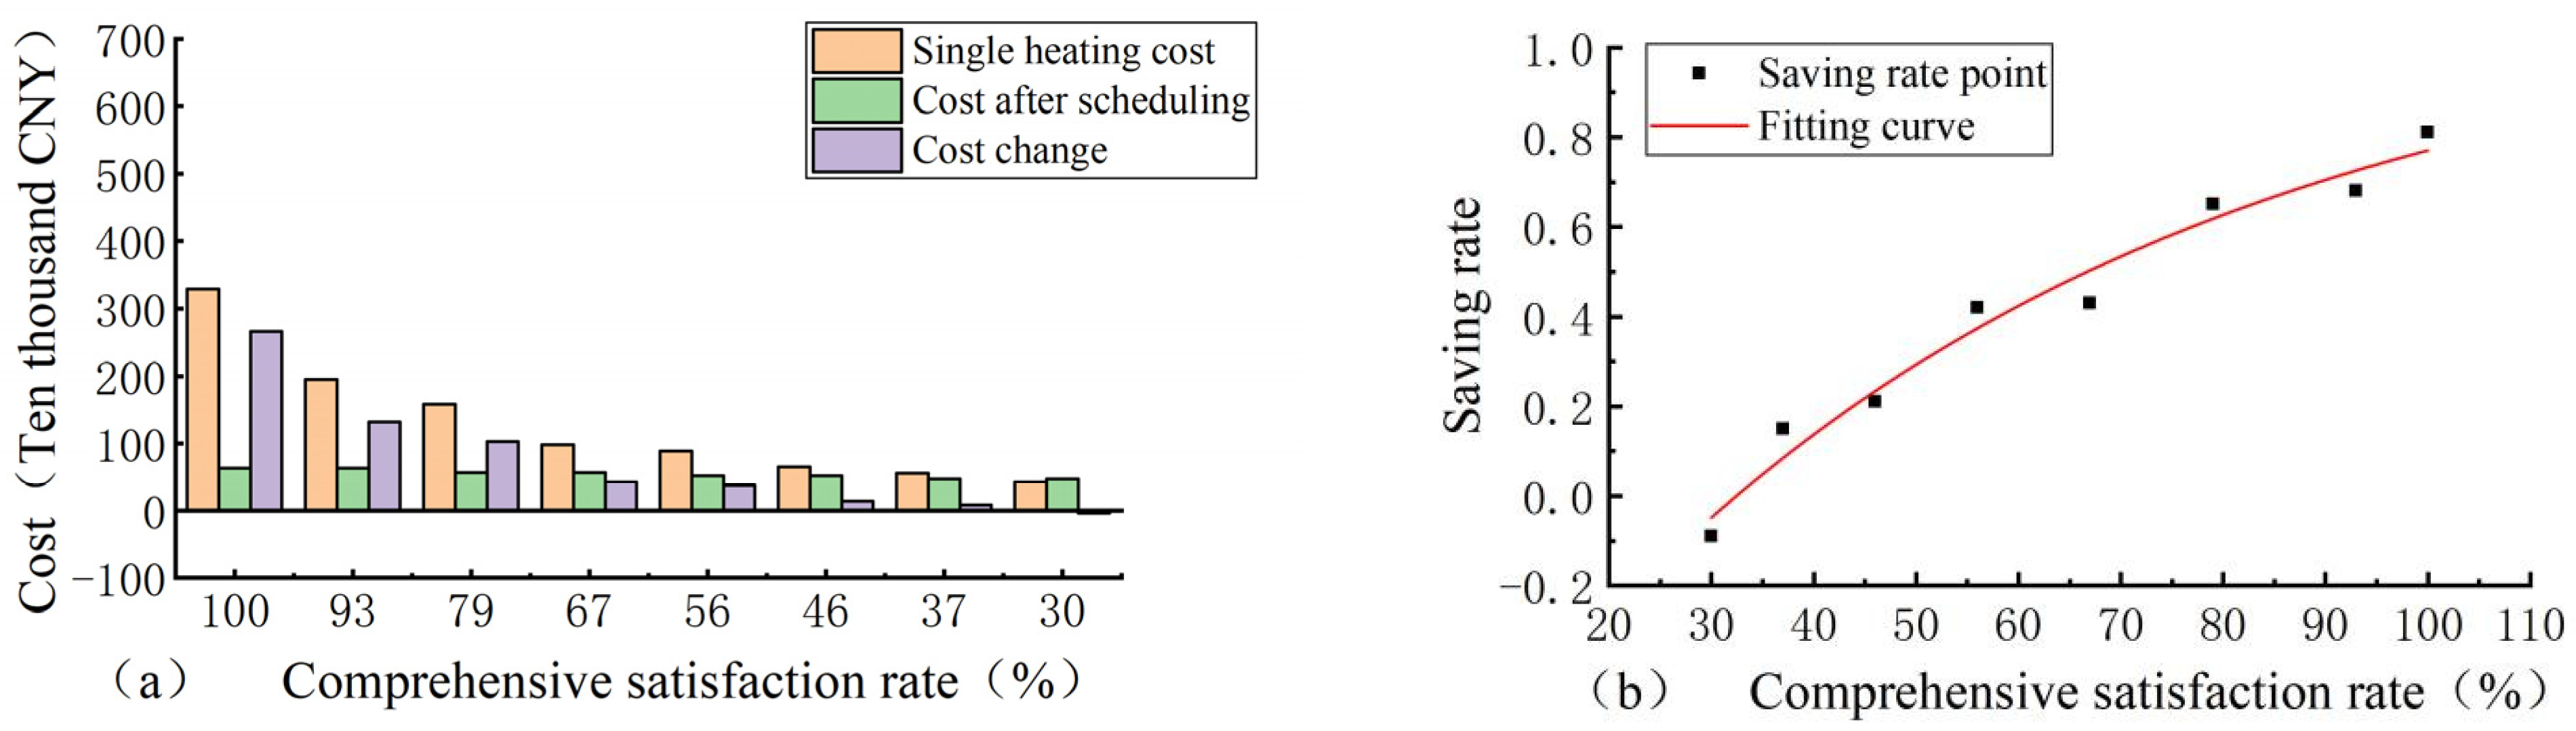
4.5.1. Cost Comparison

When the installation position and scale of each ice-melting measure are determined, the operating cost of the ice-melting measure under the different comprehensive satisfaction rate can be obtained. According to the heat balance theory, the single heating cost (direct heating using electrical energy in theory) of ice-free water conveyance can be simply calculated initially, and the two are compared, and the specific results are shown in Table 8.
It can be seen from Table 8 that the cost of the two ice-melting combination measures after regulation is lower than that of a single heating cost. With a decrease in the comprehensive satisfaction rate, the change in the cost gradually becomes smaller, indicating that the ice-melting measures can better cope with harsher meteorological conditions. With an improvement in the meteorological conditions, the economic advantages of ice-melting measures will be weakened. To further analyze the variation rules of the satisfaction rate and cost of each combination, the bar chart and the fitting curve of the cost-savings rate were drawn, as shown in Figure 27.
It can be seen from Figure 27a that the cost changes for the ice-melting measures go through three stages: “high and low”, “high, middleand low”, and “low, middleand low”. The whole cost-change process highlights the role of the solar heating gallery, and its thermal insulation effect is very obvious under bad meteorological conditions. However, when the comprehensive satisfaction rate is 30%, it is found that the operating cost of the ice-melting measures is slightly higher than that of direct channel heating. According to Table 8, the main reason is that the proportion of costs generated by pumping water increases, resulting in a decrease in the temperature increase efficiency. It can be seen from Figure 27b that the cost-saving rate of ice-melting measures increases with the comprehensive satisfaction rate, which can be fitted using the Boltzmann function. In ice-free water transmission, the cost-saving rate of laying solar heating devices is expressed as follows:
p c = 1.12 293.8 / ( 1 + e P 287.87 57.51 )

4.5.2. Benefit Analysis

By employing a solar heating gallery and heated water storage tanks to realize ice-free water transport, the benefits can be divided into three parts: water transport flow benefits, power generation benefits, and water-saving benefits. The benefit of water transport refers to the benefit of directly increasing the water transport flow which can be obtained according to the increased water volume and local water price. Solar power generation in the solar heating gallery is carried out throughout the year, and the annual power generation benefits can be obtained according to the basic information of the heating gallery facilities and the solar radiation data for many years. In addition, the water-saving benefits are mainly the benefits of reducing surface evaporation and indirectly reducing water consumption in thermal power generation. According to the actual monitoring data, the Dalton model is used to calculate the average daily evaporation of the channel section. Its expression is
E v a = 0.138 β [ 7.735 ( 1 S ) × 10 7.63 T a 241.9 + T a + 0.19 ] × ( 1 + 0.725 w 10 )
where β is the check value of the evaporation amount of the natural water body and evaporation pond, α = 0.93 ; S is the relative humidity of air, %; and w 10 is the average wind speed at the height of 10 m of the weather station, m / s .
In Section 4.2, the operating cost per kilometer under different flow and comprehensive satisfaction rates is shown. Combined with the basic data on photovoltaic panels in Table 2, the average water transfer flow benefit, power generation benefit, and water saving benefit can be calculated using the calculation methods of photovoltaic power generation and evaporation, and the calculation results are shown in Table 9.
As can be seen from Table 9, the benefits generated when the ice-melting measures are employed are very considerable. The benefit of water transport flow increases with the increase in the water transport flow and the power generation benefit is only affected by the length of the solar heating gallery, so it will not change with other factors. With the increase in the water transfer flow rate, the width of the channel will also increase, and the water saving benefit will also increase. In addition, assuming the most extreme case, that is, the 90-day water transport flow in the winter operation period is 180 m3/s, the comprehensive satisfaction rate is 100%, and the operating cost is CNY 0.8 million per day, then the total operating cost is nearly CNY 72 million, and the comprehensive total benefit is nearly CNY 220 million, which is about three times the operating cost. Through consulting the data, it is found that the installation cost of the heating gallery is 831.9 CNY / m 2 , and the installation cost of the heated water storage tank is 6710.1 CNY / m 3 . The NPVs of the ice-melting measures can be calculated using the following equation:
N P V = C 0 + t = 1 z t E t C t ( 1 + r ) t
where C 0 is the initial cost of the ice-melting measures, CNY; E t is the annual benefit of the ice-melting measures, CNY; z t is the operation period of the ice-melting measures, z t = 20 ; C t is the annual operating cost of the ice-melting measures, CNY; and r is the discount rate, r = 8 % .
According to the above, it can be calculated that the 20-year NPV after the implementation of ice-melting measures is CNY 786 million. Therefore, the use of heating galleries and heated water storage tanks for temperature regulation and ice melting has a good economic value. Therefore, it provides technical support for the development of ice-free water conveyance in the future.

5. Conclusions

This paper introduces the basic principles of two kinds of ice-melting measures: a solar heating corridor and heated water storage tank. On this basis, the operation principle of the water conveyance channel to realize ice-free water conveyance is obtained. Then, based on the meteorological data distribution and probability theory, the concept of a “comprehensive satisfaction rate” is introduced. Then, combined with the theory of the single-objective optimization algorithm, optimal regulating models of ice-melting measures are built. Finally, taking the Zhanghe control gate in the north section of the middle route of the South-to-North Water Transfer Project as the research object, the corresponding theoretical optimization and operation, the influence rules of different factors and the comparative analysis of costs are carried out. The main research results are as follows:
(i)
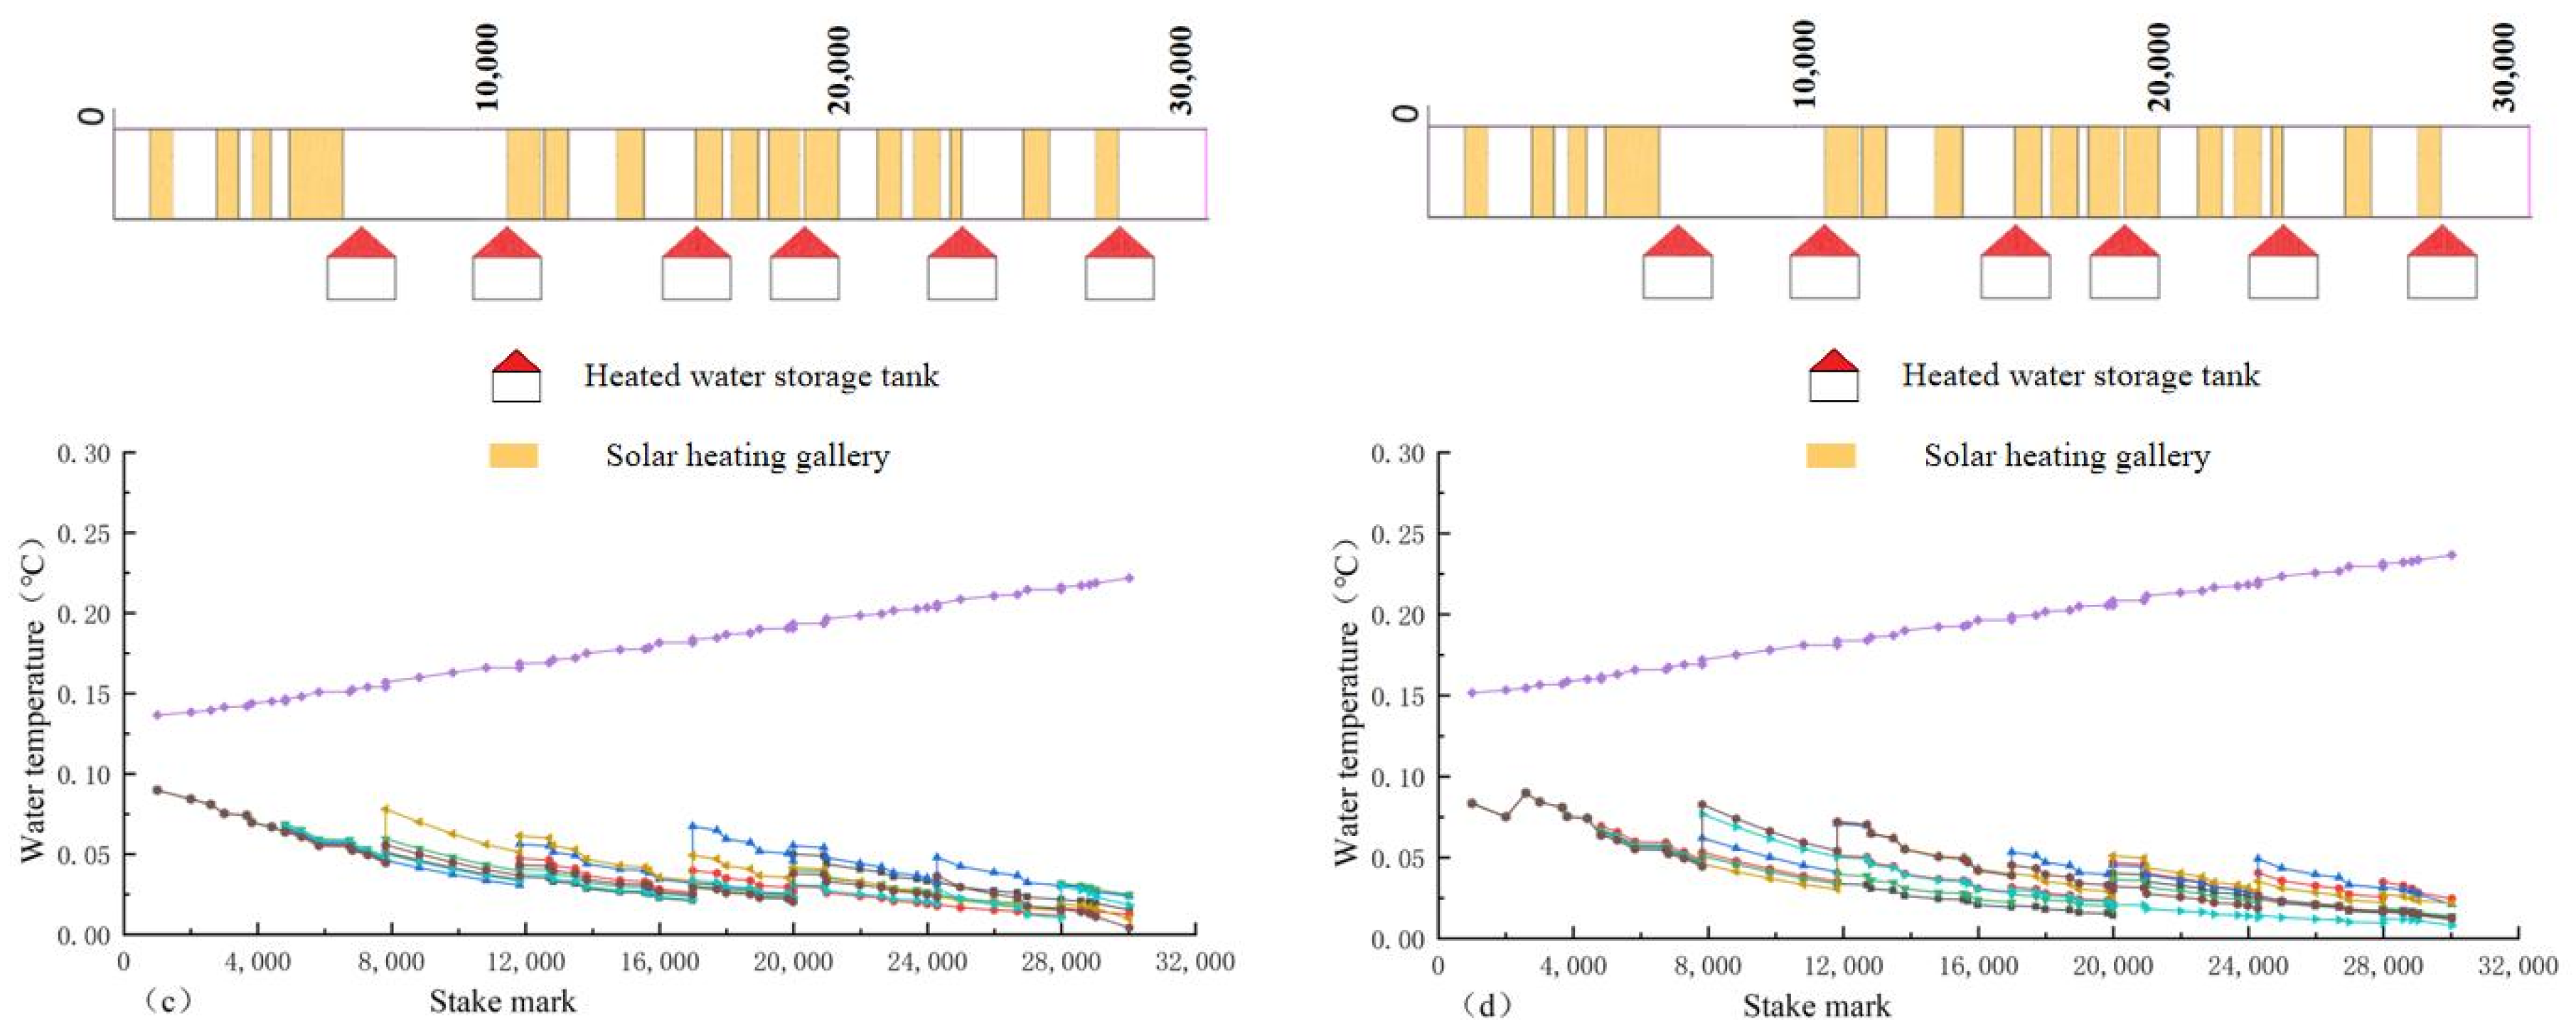
Under the optimal regulation of the two ice-melting measures, the overall water temperature along the lines presents a “ladder shape”, and the average hourly flow and water temperature have the characteristics of overall unity and local complementarity. The higher the comprehensive satisfaction rate, the greater the average hourly operating cost, but when the comprehensive satisfaction rate is less than 56%, the change range of the operating cost slows down and has no obvious change. The decreasing trend in the water temperature of the channel with the heating gallery is much slower than that without the heating gallery, and the decrease range is 15%.
(ii)
With an increase in the water flow, the operating cost also increases, but under the strong control of the velocity of the flow, its growth rate slows down to a certain extent, and the average growth rate decreases from 18.3% to 13.1% when the water flow rate increases by 40 m 3 / s . With a decrease in the downstream depth in front of the gate, the velocity of the flow increases, the heat transfer efficiency increases, and the operating cost decreases.
(iii)
Through the analysis of the costs and benefits of the ice-melting measures, with the decrease in the comprehensive satisfaction rate, their operating costs gradually becomes smaller, and the cost advantages of the ice-melting measures compared with other methods gradually diminish. In addition, the benefits of water transfer flow, power generation, and water saving are very considerable, far exceeding the operating costs, which shows that the ice-melting measures have broad prospects.
(iv)
The change in the operating costs of the ice-melting measures is a relatively dynamic process, which will vary with the change in the location and scale of the ice-melting measures. The research conclusions in this paper are only applicable to the research object in this paper, but the research method in this paper can be extended to other similar projects and has a good guiding significance.

Author Contributions

D.Y., J.L., X.Z. and Y.C., collected data and established the models. D.Y., J.L., X.Z. and Y.C., conducted the analysis. D.Y., J.L. and X.Z. developed the first draft of the article. All authors oversaw the development of the article and contributed to the revisions. All authors have read and agreed to the published version of the manuscript.

Funding

The authors are grateful for financial support from the Program of the National Natural Science Foundation of China, under the grant numbers U20A20316 and 51909186.

Data Availability Statement

Data is contained within the article.

Acknowledgments

The authors would like to thank the reviewers and editors whose critical comments were very helpful in preparing this article.

Conflicts of Interest

The authors declare no conflicts of interest.

Abbreviations

PVphotovoltaic
PV/Tphotovoltaic–solar-thermal
ITCinvestment tax credit
PTCproduction tax credit
WSPVwater surface photovoltaic
PHSpumped hydro storage
CSAcrow search algorithm
CSAAC-APCSA with an adaptive chaotic awareness probability
GAgenetic algorithm
PSOparticle swarm optimization
IRPGindependent regional power grid
NPVnet present value

References

  1. Wang, L.Z. Status and Prospect of Green Energy. World Sci. Technol. Res. Dev. 2003, 5, 49–53. [Google Scholar] [CrossRef]
  2. Makkonen, L.; Tikanmäki, M. Modelling Frazil and Anchor Ice on Submerged Objects. Cold Reg. Sci. Technol. 2018, 151, 64–74. [Google Scholar] [CrossRef]
  3. Wazney, L.; Clark, S.P.; Malenchak, J.; Knack, I.; Shen, H.T. Numerical Simulation of River Ice Cover Formation and Consolidation at Freeze-Up. Cold Reg. Sci. Technol. 2019, 168, 102884. [Google Scholar] [CrossRef]
  4. Zhao, X. Research on Water Delivery Capacity and Ice Hazard Control of Large-Scale Water Conveyance Project in the Ice Period; Tianjin University: Tianjin, China, 2011. [Google Scholar]
  5. Liu, G.; Guan, G.; Wang, C. Transition Mode of Long Distance Water Delivery Project before Freezing in Winter. J. Hydroinform. 2013, 15, 306–320. [Google Scholar] [CrossRef]
  6. Mu, X.P.; Chen, W.X.; Liu, S.; Zhong, H.R.; Zhang, X.Y. Study on hydraulic control conditions of main canal in South-to-North Water Diversion Middle Route Project. J. Chin. Inst. Water Resour. Hydropower Res. 2018, 16, 90–97. [Google Scholar] [CrossRef]
  7. Mu, X.P.; Chen, W.X.; Guo, X.C.; Cui, W. Study on long-distance water transfer channel with thermal insulation cover in winter. J. Hydraul. Eng. 2013, 44, 1071–1079. [Google Scholar] [CrossRef]
  8. Wang, Y.; Zhang, C.; Wang, Z.; Zhu, X.; Cai, Z.; Jiang, H. Research on Film Insulation Technology for Artificial, Open Water Delivery Canals Based on Solar Heat Radiation Utilization. Sustainability 2022, 14, 5720. [Google Scholar] [CrossRef]
  9. Dehghan, A.A.; Dehghani, A.R. Experimental and Theoretical Investigation of Thermal Performance of Underground Cold-Water Reservoirs. Int. J. Therm. Sci. 2011, 50, 816–824. [Google Scholar] [CrossRef]
  10. Liu, L.; Sun, Q.; Li, H.; Yin, H.; Ren, X.; Wennersten, R. Evaluating the Benefits of Integrating Floating Photovoltaic and Pumped Storage Power System. Energy Convers. Manag. 2019, 194, 173–185. [Google Scholar] [CrossRef]
  11. Zeng, M.; Li, C.; Zhou, L. Progress and Prospective on the Police System of Renewable Energy in China. Renew. Sustain. Energy Rev. 2013, 20, 36–44. [Google Scholar] [CrossRef]
  12. Bird, L.; Lew, D.; Milligan, M.; Carlini, E.M.; Estanqueiro, A.; Flynn, D.; Gomez-Lazaro, E.; Holttinen, H.; Menemenlis, N.; Orths, A.; et al. Wind and Solar Energy Curtailment: A Review of International Experience. Renew. Sustain. Energy Rev. 2016, 65, 577–586. [Google Scholar] [CrossRef]
  13. Michael, S. Global Market Outlook for Solar Power 2021–2025; Solar Power Europe: Brussels, Belgium, 2021; Volume 7, pp. 1–68. [Google Scholar]
  14. Colmenar-Santos, A.; Buendia-Esparcia, Á.; de Palacio-Rodríguez, C.; Borge-Diez, D. Water Canal Use for the Implementation and Efficiency Optimization of Photovoltaic Facilities: Tajo-Segura Transfer Scenario. Sol. Energy 2016, 126, 168–194. [Google Scholar] [CrossRef]
  15. Liu, Z.; Zhang, Z.; Zhuo, R.; Wang, X. Optimal Operation of Independent Regional Power Grid with Multiple Wind-Solar-Hydro-Battery Power. Appl. Energy 2019, 235, 1541–1550. [Google Scholar] [CrossRef]
  16. Ma, C.; Liu, Z.; He, W. Water Surface Photovoltaic along Long-Distance Water Diversion Projects and Its Co-Benefits. J. Clean. Prod. 2022, 331, 129924. [Google Scholar] [CrossRef]
  17. Blake, M. The long read: Canal-top solar solutions. PV Magazine, 11 June 2022. [Google Scholar]
  18. Wolf, M. Performance Analyses of Combined Heating and Photovoltaic Power Systems for Residences. Energy Convers. 1976, 16, 79–90. [Google Scholar] [CrossRef]
  19. Chow, T.T.; He, W.; Ji, J. An Experimental Study of Façade-Integrated Photovoltaic/Water-Heating System. Appl. Therm. Eng. 2007, 27, 37–45. [Google Scholar] [CrossRef]
  20. Rounis, E.D.; Athienitis, A.K.; Stathopoulos, T. Multiple-inlet Building Integrated Photovoltaic/Thermal system modelling under varying wind and temperature conditions. Sol. Energy 2016, 139, 157–170. [Google Scholar] [CrossRef]
  21. Ji, Y.S. Research on Solar Energy Temperature Increasing and Temperature Control Device for Long Distance Water Conveying Channel; Tianjin University: Tianjin, China, 2022. [Google Scholar]
  22. BanJiu, C.R.; Cao, S.Y.; Li, R.; Liu, X.N. New Exploration on Solar Energy Deice Hydropower Plant in Tibet. China Rural Water Hydropower 2003, 6, 22–24. [Google Scholar]
  23. Carbonell, D.; Philippen, D.; Haller, M.Y.; Frank, E. Modeling of an Ice Storage Based on a De-Icing Concept for Solar Heating Applications. Sol. Energy 2015, 121, 2–16. [Google Scholar] [CrossRef]
  24. Zhang, Y.N. Study on the Influence of Recharge and Pumping on Water Temperature of Baiquan Underground Reservoir and the Optimization Operation Mode of Multiple Wells; Tianjin University: Tianjin, China, 2022. [Google Scholar]
  25. Spencer, R.S.; Macknick, J.; Aznar, A.; Warren, A.; Reese, M.O. Floating Photovoltaic Systems: Assessing the Technical Potential of Photovoltaic Systems on Man-Made Water Bodies in the Continental United States. Environ. Sci. Technol. 2019, 53, 1680–1689. [Google Scholar] [CrossRef]
  26. Kumar, M.; Kumar, A. Performance Assessment of Different Photovoltaic Technologies for Canal-Top and Reservoir Applications in Subtropical Humid Climate. IEEE J. Photovolt. 2019, 9, 722–732. [Google Scholar] [CrossRef]
  27. McKuin, B.; Zumkehr, A.; Ta, J.; Bales, R.; Viers, J.H.; Pathak, T.; Campbell, J.E. Energy and Water Co-Benefits from Covering Canals with Solar Panels. Nat. Sustain. 2021, 4, 609–617. [Google Scholar] [CrossRef]
  28. Zhang, N.; Chen, G.; Xu, Y.; Xu, X.; Yu, L. Power Generation, Evaporation Mitigation, and Thermal Insulation of Semitransparent Polymer Solar Cells: A Potential for Floating Photovoltaic Applications. ACS Appl. Energy Mater. 2019, 2, 6060–6070. [Google Scholar] [CrossRef]
  29. Zhou, Y.; Chang, F.J.; Chang, L.C.; Lee, W.D.; Huang, A.; Xu, C.Y.; Guo, S. An Advanced Complementary Scheme of Floating Photovoltaic and Hydropower Generation Flourishing Water-Food-Energy Nexus Synergies. Appl. Energy 2020, 275, 115389. [Google Scholar] [CrossRef]
  30. Ye, B.; Jiang, J.; Liu, J. Feasibility of Coupling Pv System with Long-Distance Water Transfer: A Case Study of China’s “South-to-North Water Diversion”. Resour. Conserv. Recycl. 2021, 164, 105194. [Google Scholar] [CrossRef]
  31. Wang, G.Z. Optimization distribution model for groundwater and water diverted from the Yellow river. J. Water Resour. Water Eng. 2004, 15, 44–48. [Google Scholar]
  32. Yang, L.L.; Wang, Y.X.; Xie, X.M.; Ye, Y.; Ding, F. Study on Water Resources Allocation Model Based on Joint Operation of Surface Water and Ground Water. Water Resour. Power 2010, 28, 23–26. [Google Scholar]
  33. Makhdoomi, S.; Askarzadeh, A. Optimizing Operation of a Photovoltaic/Diesel Generator Hybrid Energy System with Pumped Hydro Storage by a Modified Crow Search Algorithm. J. Energy Storage 2020, 27, 101040. [Google Scholar] [CrossRef]
  34. Edwards, K.C.; Finn, D.P. Generalised Water Flow Rate Control Strategy for Optimal Part Load Operation of Ground Source Heat Pump Systems. Appl. Energy 2015, 150, 50–60. [Google Scholar] [CrossRef]
  35. Das, B.K.; Zaman, F. Performance Analysis of a PV/Diesel Hybrid System for a Remote Area in Bangladesh: Effects of Dispatch Strategies, Batteries, and Generator Selection. Energy 2019, 169, 263–276. [Google Scholar] [CrossRef]
  36. Kusakana, K. Hybrid DG-PV with Groundwater Pumped Hydro Storage for Sustainable Energy Supply in Arid Areas. J. Energy Storage 2018, 18, 84–89. [Google Scholar] [CrossRef]
  37. Zhang, Y. Research on Water Temperature Prediction and Water Temperature Control for Ice-Damage-Free Water Delivery in the Middle Route o South-to-North Water Transfer Project Trunk Canal; Tianjin University: Tianjin, China, 2022. [Google Scholar]
  38. Fang, S.; Mao, K.; Xia, X.; Wang, P.; Shi, J.; Bateni, S.M.; Xu, T.; Cao, M.; Heggy, E.; Qin, Z. Dataset of Daily Near-Surface Air Temperature in China from 1979 to 2018. Earth Syst. Sci. Data 2022, 14, 1413–1432. [Google Scholar] [CrossRef]
  39. Feng, F.; Wang, K. Merging Ground-Based Sunshine Duration Observations with Satellite Cloud and Aerosol Retrievals to Produce High-Resolution Long-Term Surface Solar Radiation over China. Earth Syst. Sci. Data 2021, 13, 907–922. [Google Scholar] [CrossRef]
Figure 1. Picture of ice-melting well of the Hongshanzui Power Station, in the southern margin of the Zhunge Basin, China.
Water 16 01039 g001
Figure 2. Picture of photovoltaic panel laying in water conveyance channel [15].
Water 16 01039 g002
Figure 3. The specific working principle of PV/T air solar panels [21].
Water 16 01039 g003
Figure 4. The specific working principle of solar heating gallery [21].
Water 16 01039 g004
Figure 5. The structure of the heated water storage tank [21].
Water 16 01039 g005
Figure 6. Basic principles of ice melting in water conveyance channels.
Water 16 01039 g006
Figure 7. Schematic diagram of the Hebei section in the Middle Route Project of South-to-North Water Conveyance Project.
Water 16 01039 g007
Figure 8. The position of the heating gallery and heated water storage tank.
Water 16 01039 g008
Figure 9. Optimization regulating model of ice-melting measures based on genetic algorithm.
Water 16 01039 g009
Figure 10. Empirical distribution curves of total solar radiation, air temperature, and wind speed in Handan.
Water 16 01039 g010
Figure 11. Probability density curves of total solar radiation, air temperature, and wind speed in Handan.
Water 16 01039 g011
Figure 12. When the water flow is 101 m 3 / s , the time–history variation of the outlet flow of the heated storage tank is shown under different comprehensive satisfaction rates: (a) 100%; (b) 79%; (c) 56%; and (d) 37%.
Water 16 01039 g012
Figure 13. When the water flow is 101 m 3 / s , the time–history variation of the outlet water temperature of the heated storage tank is shown under different comprehensive satisfaction rates: (a) 100%; (b) 79%; (c) 56%; and (d) 37%.
Water 16 01039 g013
Figure 14. When the water flow is 101 m 3 / s , the change process of the water temperature along the lines is shown under different comprehensive satisfaction rates: (a) 100%; (b) 79%; (c) 56%; (d) 37%.
Water 16 01039 g014
Figure 15. Three-dimensional diagram of temperature increase amplitudes in water injection nodes under different comprehensive satisfaction rates.
Water 16 01039 g015
Figure 16. Amplitude variation in the water temperature and time variation in the water temperature of piles No.2 + 300 and No.2 + 800 under comprehensive satisfaction rates is 100%.
Water 16 01039 g016
Figure 17. The change process of the hourly average flow and hourly average water temperature under different comprehensive satisfaction rates.
Water 16 01039 g017
Figure 18. When the water flow is 140 m 3 / s , the change process of the water temperature along the lines is shown under different comprehensive satisfaction rates: (a) 100%; (b) 79%; (c) 56%; and (d) 37%.
Water 16 01039 g018
Figure 19. When the water flow is 180 m 3 / s , the change process of the water temperature along the lines is shown under different comprehensive satisfaction rates: (a) 100%; (b) 79%; (c) 56%; and (d) 37%.
Water 16 01039 g019aWater 16 01039 g019b
Figure 20. The change curve for the operating cost per kilometer of the channel under different water flow and different comprehensive satisfaction rates.
Water 16 01039 g020
Figure 21. When the water flow is 101 m 3 / s and the downstream depth is 5 m, the change process of the water temperature along the lines is shown under different comprehensive satisfaction rates: (a) 100%; (b) %; (c) 56%; and (d) 37%.
Water 16 01039 g021
Figure 22. When the water flow is 101 m 3 / s and the downstream depth is 5.5 m, the change process of the water temperature along the lines is shown under different comprehensive satisfaction rates: (a) 100%; (b) 79%; (c) 56%; and (d) 37%.
Water 16 01039 g022
Figure 23. Three-dimensional graph of the velocity, comprehensive satisfaction rate, and operating cost at the same velocity.
Water 16 01039 g023
Figure 24. Variation curve of the operating cost per kilometer of channel under different downstream depths and different comprehensive satisfaction rates.
Water 16 01039 g024
Figure 25. Relationship diagram of four factors: comprehensive satisfaction rate, water flow, downstream depth, and operating cost.
Water 16 01039 g025
Figure 26. Residual results diagram of the mathematical relation in operation mode: red means greater error; green means less error.
Water 16 01039 g026
Figure 27. (a) Bar chart of the cost combination of ice-melting measures; (b) savings rate fitting curve.
Water 16 01039 g027
Table 1. Basic information of Zhanghe control gate–Mangniuhe control gate section.
Design Flow for Ice Cover OperationVelocitySlope CoefficientWater DepthBottom Width Canal Length
78 m3/s0.4 m/s26 m23.5 m30.4 m
Table 2. Basic information of solar heating gallery and heated water storage tank.
NameCollectorPhotovoltaic Panel
Structure ParametersSize/mEfficiencyAir hole diameter/mHeat collection efficiencyTemperature coefficientPower generation efficiency
Value2 × 1 × 0.2265%0.1865%0.417%
NameWater tankElectric heating rod
Structure ParametersRadius/mHeight/mNumber of coilsHeight/mDiameter/mTotal length/m
Value3683.60.375.48
Table 3. Empirical distribution curve functions of water temperature and wind speed in Handan City.
City NameTemperature Probability Density FunctionFit DegreeWind Speed Probability Density FunctionFit Degree
Handan F ( T a ) = 0.49 + 16.2 e 2 ( T a + 35.63 91.62 ) 2 0.97 F ( v w ) = 0.74 + 26.48 e 2 ( v w 15.65 13.76 ) 2 0.96
Note: In the table, F ( T a ) , F ( v w ) is the probability density of air temperature and wind speed.
Table 4. Values of air temperature, wind speed, and radiation and corresponding comprehensive satisfaction rates under different cumulative probabilities.
Cumulative Probability (%)10095908580757065
Temperature   ( ° C ) −15−13.4−11.8−10.6−9.4−8.2−7−6.3
Wind   speed   ( m / s )6.34.52.62.42.22.01.81.6
Total   solar   radiation   ( kJ / m 2 )1788 1788 1788 2039 2281 2523 2765 4234
Comprehensive satisfaction rate (%)10093796756463730
Table 5. Calculation results of average hourly flow temperature and operating cost of heated water storage tank under different comprehensive satisfaction rates.
Ice-Melting MeasuresComprehensive Satisfaction Rates (%)Average Hourly Flow ( m 3 / s · h )Average Hourly Water Temperature ( ° C / h )Average Hourly Operating Cost ( Yuan / h )
Heating gallery + heated water storage tank1000.573.4224,262
930.583.1624,068
790.473.4621,325
670.543.3421,272
560.453.5819,449
460.493.3719,343
370.483.2217,363
300.443.2317,257
Table 6. Changes in the velocities and operating costs of different flow channels with comprehensive satisfaction rates of 79% and 37%.
Comprehensive Satisfaction Rate (%)7937
Flow ( m 3 / s )101140180101140180
Velocity of flow ( m / s )0.470.660.830.470.660.83
Operating cost ( CNY   10 5 )5.626.617.394.675.646.61
Table 7. Basic information and calculation results of 8 kinds of combined working conditions.
Number P (%) Q
( m 3 / s )
H g   ( m )Actual Value
( CNY   10 5 )
Predicted Value ( CNY   10 5 )Error Rate (%)
1621675.89.129.040.9
2761475.89.539.094.9
3801445.48.589.014.8
4841745.69.259.532.9
54812357.577.954.8
Table 8. When the water flow is 101 m 3 / s , the cost calculation results after single heating and ice-melting measures are shown for ice-free water conveyance.
Comprehensive Satisfaction Rate (%)Single Heating Charge
( 10 5 CNY/Day)
Cost after Regulating
( 10 5 CNY/Day)
Cost Change
( 10 5 CNY/Day)
Saving Rate
10032.906.3226.570.81
9319.476.2813.190.68
7915.835.6210.210.65
679.785.614.180.43
568.885.173.710.42
466.515.141.370.21
375.524.670.850.15
304.254.64−0.39−0.09
Table 9. Calculation results of the average water transfer flow benefit, power generation benefit, and water saving benefit generated by employing the ice-melting measures.
Flow
(m3/s)
Flow Benefit
( 10 6 CNY/Day)
Power Generation Benefit
( 10 7 CNY/Year)
Water Saving Benefit
( 10 6 CNY/Year)
1010.314.844.07
1400.844.844.33
1801.384.844.76
Disclaimer/Publisher’s Note: The statements, opinions and data contained in all publications are solely those of the individual author(s) and contributor(s) and not of MDPI and/or the editor(s). MDPI and/or the editor(s) disclaim responsibility for any injury to people or property resulting from any ideas, methods, instructions or products referred to in the content.

