1. Introduction
In recent years, natural disasters have occurred more frequently, causing serious economic losses, human casualties, and ecological damage, and natural disasters have gradually become one of the most challenging issues facing society today [
1]. Reports from the Center for Research on the Epidemiology of Disasters (CRED) often emphasize statistics on the occurrence of floods, deaths, and economic losses in order to provide a comprehensive review of their importance in the field of natural disasters. According to CRED, in 2021, a total of 432 catastrophic events were recorded, which is considerably higher than the average of 357 annual catastrophic events for 2001–2020. Floods dominated these events, with 223 occurrences, up from an average of 163 annual flood occurrences recorded across the 2001–2020 period. During its monsoon season (June to September), India experienced a series of deadly floods that claimed 1282 lives. In July, the Henan Flood in China was particularly severe, resulting in 352 deaths, 14.5 million people affected, and a cost of USD 16.5 billion. In the same month, the Nuristan Floods in Afghanistan resulted in 260 fatalities. In July, the Central European Floods and subsequent landslides resulted in USD 40 billion of economic costs in Germany alone and stood as the second most costly disaster. It can be seen that among the various types of natural disasters, floods are the most common and far-reaching, devastating many flood-prone cities worldwide. With climate change, floods are occurring more often, and cities that are more resilient to these events can reduce the damage caused and also speed up recovery. In light of these challenging circumstances, assessing the resilience of cities has emerged as an important topic in many research fields [
2].
This observation is further corroborated by the rising number of flood-related fatalities, particularly evident when streams traverse urban centers and are situated in close proximity to road networks, as depicted in the literature [
3,
4]. For example, in October 2011, central Thailand experienced the worst flooding in 50 years, submerging tens of thousands of hectares of farmland, causing tens of thousands of people to evacuate their homes, and turning the districts of Ayutthaya, Pathum Thani, and Nakhon Sawan, just north of Bangkok, into swamp [
5]. Floods in Bangladesh in 2019 resulted in the destruction of some 30,000 houses, the total destruction of four dams, and the inundation of 8200 hectares of land, killing 75 people and affecting 6 million people [
6]. In August 2022 Pakistan’s heavy rainfall resulted in 1033 deaths and 1527 injuries, and many of the rivers within its borders have reached extraordinarily high water levels [
7]. In August of the same year, the capital of South Korea, Seoul, and surrounding areas were hit by the heaviest rainfall in 80 years, with parts of Seoul receiving the largest amount of precipitation since 1942 [
8]. In June 2008, Shenzhen, Guangdong Province, China, was hit by a rare mega-rainfall, which seriously affected the lives of local residents and public order, resulting in six deaths and more than 2500 people involved in rescue and relief efforts [
9]. In July, the historically rare extraordinarily heavy rainfall struck China’s Henan Province again, and Zhengzhou City in particular suffered major casualties and property damage, resulting in 14,786,000 people in the province being affected, 398 people dead and missing, and direct economic losses totaling 120.6 billion yuan [
10]. According to the United Nations Office for Disaster Risk Reduction (UNISDR), one-third of the world’s natural disasters and economic losses are related to flooding [
11], so extra attention needs to be paid to urban resilience.
In the face of increasing severity and frequency of severe floods, how to improve urban flood resilience has become a pressing issue, and researchers and practitioners internationally are actively seeking responses. Bethuel proposed a Disaster Management Cycle (DMC) for preparing for and responding to flood disasters in two coastal provinces of South Africa [
12], and also assessed the relationship between devastating flood disasters and climate change to provide urban recovery measures; Gorata [
13] used the DMC cycle to assess Botswana’s overall national disaster management strategy and planning program in Gaborone to provide guidance for future assessments of urban resilience; Nazia, by comparing human casualties and infrastructure losses caused by floods in Bangladesh in 1988, 2004, and 2022, argued that Bangladesh needs to improve its policies to establish a robust disaster management system and for this purpose proposed a flood management strategy [
14] to enable the city to recover quickly in the face of future disasters. To achieve more effective flood management, China has developed the theory of sponge city and applied it in practice [
15]. Fang developed a hand-drawn flood frequency analysis (FFA)-synthetic rating curve (SRC) method [
16] and applied it to a coastal watershed in China, which is feasible in predicting flood susceptibility to improve urban resilience.
Disaster resilience has its origins in the social sciences rather than ecology and has been interpreted as the ability of social systems to respond to and recover from disasters, and to reorganize, change, and learn from threats. Disaster resilience is a dynamic process in which community and individual characteristics (e.g., social capital, economic capital, governance, well-being) influence the ability to respond, recover, reorganize, and change. Resilience underpins disaster management approaches in many jurisdictions across the globe. For example, Australia’s National Disaster Resilience Strategy (NDRS) recognizes the need to build resilience to natural hazards as a shared responsibility of individuals, governments, businesses, and communities. In the United States, the Strategic Foresight Initiative seeks to help emergency management prepare for an uncertain future and recognizes the centrality of fostering disaster-resilient communities. The United Kingdom’s National Security Strategy asserts the importance of resilience to national prosperity in uncertain times, including natural disasters.
Urban resilience is a new concept centered on urban risk crises that can effectively compensate for the limitations of traditional risk management models based on defensive strategies, and building resilient cities has become a central issue in urban planning and risk management. Urban resilience can offset urban flood vulnerability through absorptive, adaptive, or transformative capacity (three different forms of resilience). This reduces the risk of urban flooding through resilience. The adaptive capacity of urban resilience has been demonstrated in Bangkok, Thailand, where underground facilities have been constructed to store excess rainfall and prevent flooding, and in Johannesburg, South Africa, where residents are making concerted efforts to improve public spaces. The assessment of urban resilience has also been studied by many scholars, and Wang et al. provided new insights into the trend of flood research by examining the frontiers of flood research from 2000 to 2021 [
17]. Yan et al. [
18] took Guangdong Province in China as an example, and established a mixed-effects model (ME) and a multilevel mixed-evaluation model (MHEM) for disaster loss and resilience in the urban area, respectively, to construct a disaster-resilience model MHEM), constructed a post-disaster recovery curve and quantitatively evaluated the post-disaster urban resilience. Liu et al. explored the resilience of Zhengzhou City based on NPP-VIIRS nighttime optical data [
19] and other multi-source data, using the rainstorm event that occurred in Zhengzhou City on 20 July 2021 as an example. Moghadas et al. developed a multi-criteria decision-making (MCDM) tool to measure flood resilience in Tehran [
20]. Tayyab et al. developed the Urban Flood Resilience Model (UFResi-M) [
21] to compare the urban resilience of two regions through data processing and analysis. Naveen conducted a comprehensive and systematic literature review on Urban Flood Resilience Assessment (UFRA) [
22] to address the problems of inadequate urban preparedness, poor response, and lengthy recovery process, which covers the process of urban flood resilience assessment, and provides guidance for constructing a state-of-the-art framework for urban resilience assessment provided guidance.
Climate change is a global issue that affects a wide range of human settlements, but the impacts are expected to be more severe in cities, where the majority of the world’s population now lives. Ironically, many of these urban areas are located in places that are prone to a variety of natural and man-made disasters. A number of disaster events have shown that complexity and uncertainty lead to very different recovery trajectories for different communities and regions after a disaster event [
23,
24]. Adaptation to climate change is one area where resilience has been integrated into policies and programs, and Australia’s National Climate Resilience and Adaptation Policy proposes that a climate-resilient Australia supports prosperity and well-being by building the resilience of communities, economies, and environments to a variable and changing climate [
25]. Rapid urbanization and climate change trends are leading to rising disaster risks, and there is an urgent need to improve “urban resilience”. Urban resilience responds to three converging global megatrends: Climate change, urbanization, and globalization. Urban resilience requires cities to take a holistic view of their capacities and risks, which is not an easy task. Therefore, resilient policies and plans can be developed in response to or in preparation for shocks such as natural disasters, climate change, or economic uncertainty. Given the growing recognition of the need to prepare for both foreseeable and unforeseeable shocks, we predict that the integration of resilience into public policies and plans will continue to increase over the next decade.
Resilience is becoming a prominent goal of international development policy. In this area, there are discussions or plans to incorporate resilience into frameworks, as well as plans to measure resilience. Relatively few previous studies have quantified urban resilience. Therefore, the outstanding contribution of this study is the establishment of an urban flood resilience assessment model, which brings great help to flood resilience assessment. In addition, based on the flood disaster perspective, this study systematically evaluates cities at various stages of flood disasters, constructs an indicator system for urban flood resilience, applies the D-number theory-analysis of hierarchy (AHP) model, and applies it to three Chinese cities using the VIse Kriterijumski Optimizacioni Racun (VIKOR) method to evaluate and analyze their disaster resilience. their resilience to disasters to be assessed and analyzed, which is another contribution of this study. The model will have the ability to assess the level of urban flood resilience and suggest improvements. The results of the study reveal the influence of key factors and provide a reference point for improving flood resilience in similar flood-prone cities.
Hence, the research objectives are as follows: (1) Drawing on appropriate data, to build a model to assess the flood resilience of cities; (2) to analyze what strategies should be adopted to improve the resilience of urban flooding; and (3) to provide recommendations towards helping to prevent and mitigate the effects of flooding in these three cities as well as similar cities around the world. The structure of this paper is as follows: In the next section, we carry out the construction of evaluation indicators. In
Section 3, the research methodology is elaborated. In
Section 4, the flood resilience of the three cities is evaluated based on the data. In
Section 5, the results of the study are obtained and analyzed. In
Section 6, the final discussion is summarized.
2. Construction of the Indicator System
In the development of flood assessment indicator systems, most scholars have adopted these from economic, social, and ecological aspects. For example, by analyzing the formation and influencing factors of flood disasters in the Wucheng Xiyu area; Ko used the socio-demographic, sense of locality, social adaptive capacity, flood risk level, and social resilience of the community [
26] as five components to assess the resilience of the society to floods. After reviewing the natural disaster resilience-related literature, Sun constructed a regional flood resilience evaluation index system and adopted five dimensions of nature, society, economy, technology, and management that were found to have the greatest impact on flood resilience [
27].
Whereas traditional indicator systems do not take disaster processes into account, the uncertainty of external shocks makes it necessary to include disaster processes in the assessment of urban flood resilience. Yu et al. proposed a “resistance-adaptation-recovery” [
28] assessment framework for the three phases of urban flood disasters (before, during, and after the flood disaster) in Shenzhen, China. Based on the natural geographic and socio-economic data, Gao constructed a flood disaster indicator system for the Wucheng Xiyu area with three main indicators of disaster-causing factors, disaster-conceiving environment, and disaster-bearing body [
29]. Ma et al. started from the whole process of urban storm flood development to conduct a rational and quantitative evaluation of the city’s ability to cope with storm floods and constructed an indicator system for the evaluation of regional flood risk based on the three attributes of vulnerability, adaptability, and recoverability [
30]. Ma Rongyong conducted a risk evaluation of Nanning City’s flood disaster from the two aspects of flood hazard and flood vulnerability [
31] by establishing evaluation indexes. Yuan Zihan conducted a risk evaluation of the flood disaster in Nanning City from the theory of natural disaster risk and selected the disaster-causing factors and four other indicators [
32] as the evaluation system, to develop a comprehensive risk zoning map of torrential rainfall and flooding in Heilongjiang Province. Zhang Yaowen comprehensively integrated disaster-causing factors including the environment, the exposure, the susceptibility to damage, and prevention and mitigation of disasters and other evaluation dimensions [
33], to improve the flood disaster risk index model. They used multifactorial statistical synthesis and evaluation methods to calculate the risk of floods in county units of the Beijing–Tianjin–Hebei region.
Through extensive reading and summarizing of the literature, this study considers the whole process of natural disaster occurrence, and constructs flood resilience evaluation indexes from four dimensions: Hazardousness of disaster-causing factors, sensitivity of disaster-conceiving environments, susceptibility of disaster-bearing bodies, and vulnerability of disaster prevention and mitigation. These shall now be described.
2.1. Hazardousness of Disaster-Causing Factors
The occurrence of flooding is closely related to the magnitude of rainfall, so the risk is characterized by the average annual rainfall [
34] and sewage treatment capacity [
35]. Average annual rainfall is an important indicator of a region’s climate, and is an important reference for water resource management, agricultural production, ecosystem restoration, and environmental monitoring. With the rapid development of the human economy and the intensification of climate change, greater attention needs to be paid to these meteorological indicators in order to better cope with the challenges posed by the natural environment. In today’s society, environmental protection is of equal importance as urban economic issues in the development of cities. Wastewater treatment work promotes the healthy development of cities based on its positive impact on both urban ecology and urban economy. Furthermore, sewage treatment can indicate the level of development within a city, where an effective sewage treatment of high capacity is indicative of a resilient city. In addition, sewage treatment as an important aspect of urban environmental protection, can also characterize a city’s economic situation, i.e., demonstrating the development and construction capacity of a city’s economy as well as the overall development of the environment. Therefore, good urban sewage treatment can promote the development of urban environmental protection and the overall development of the city.
2.2. Sensitivity of the Environment to Flood Disasters
In this study, the sensitivity of disaster-prone environments is assessed from three factors: The area of the administrative area [
36], the number of shelters [
37], and the length of drainage pipes [
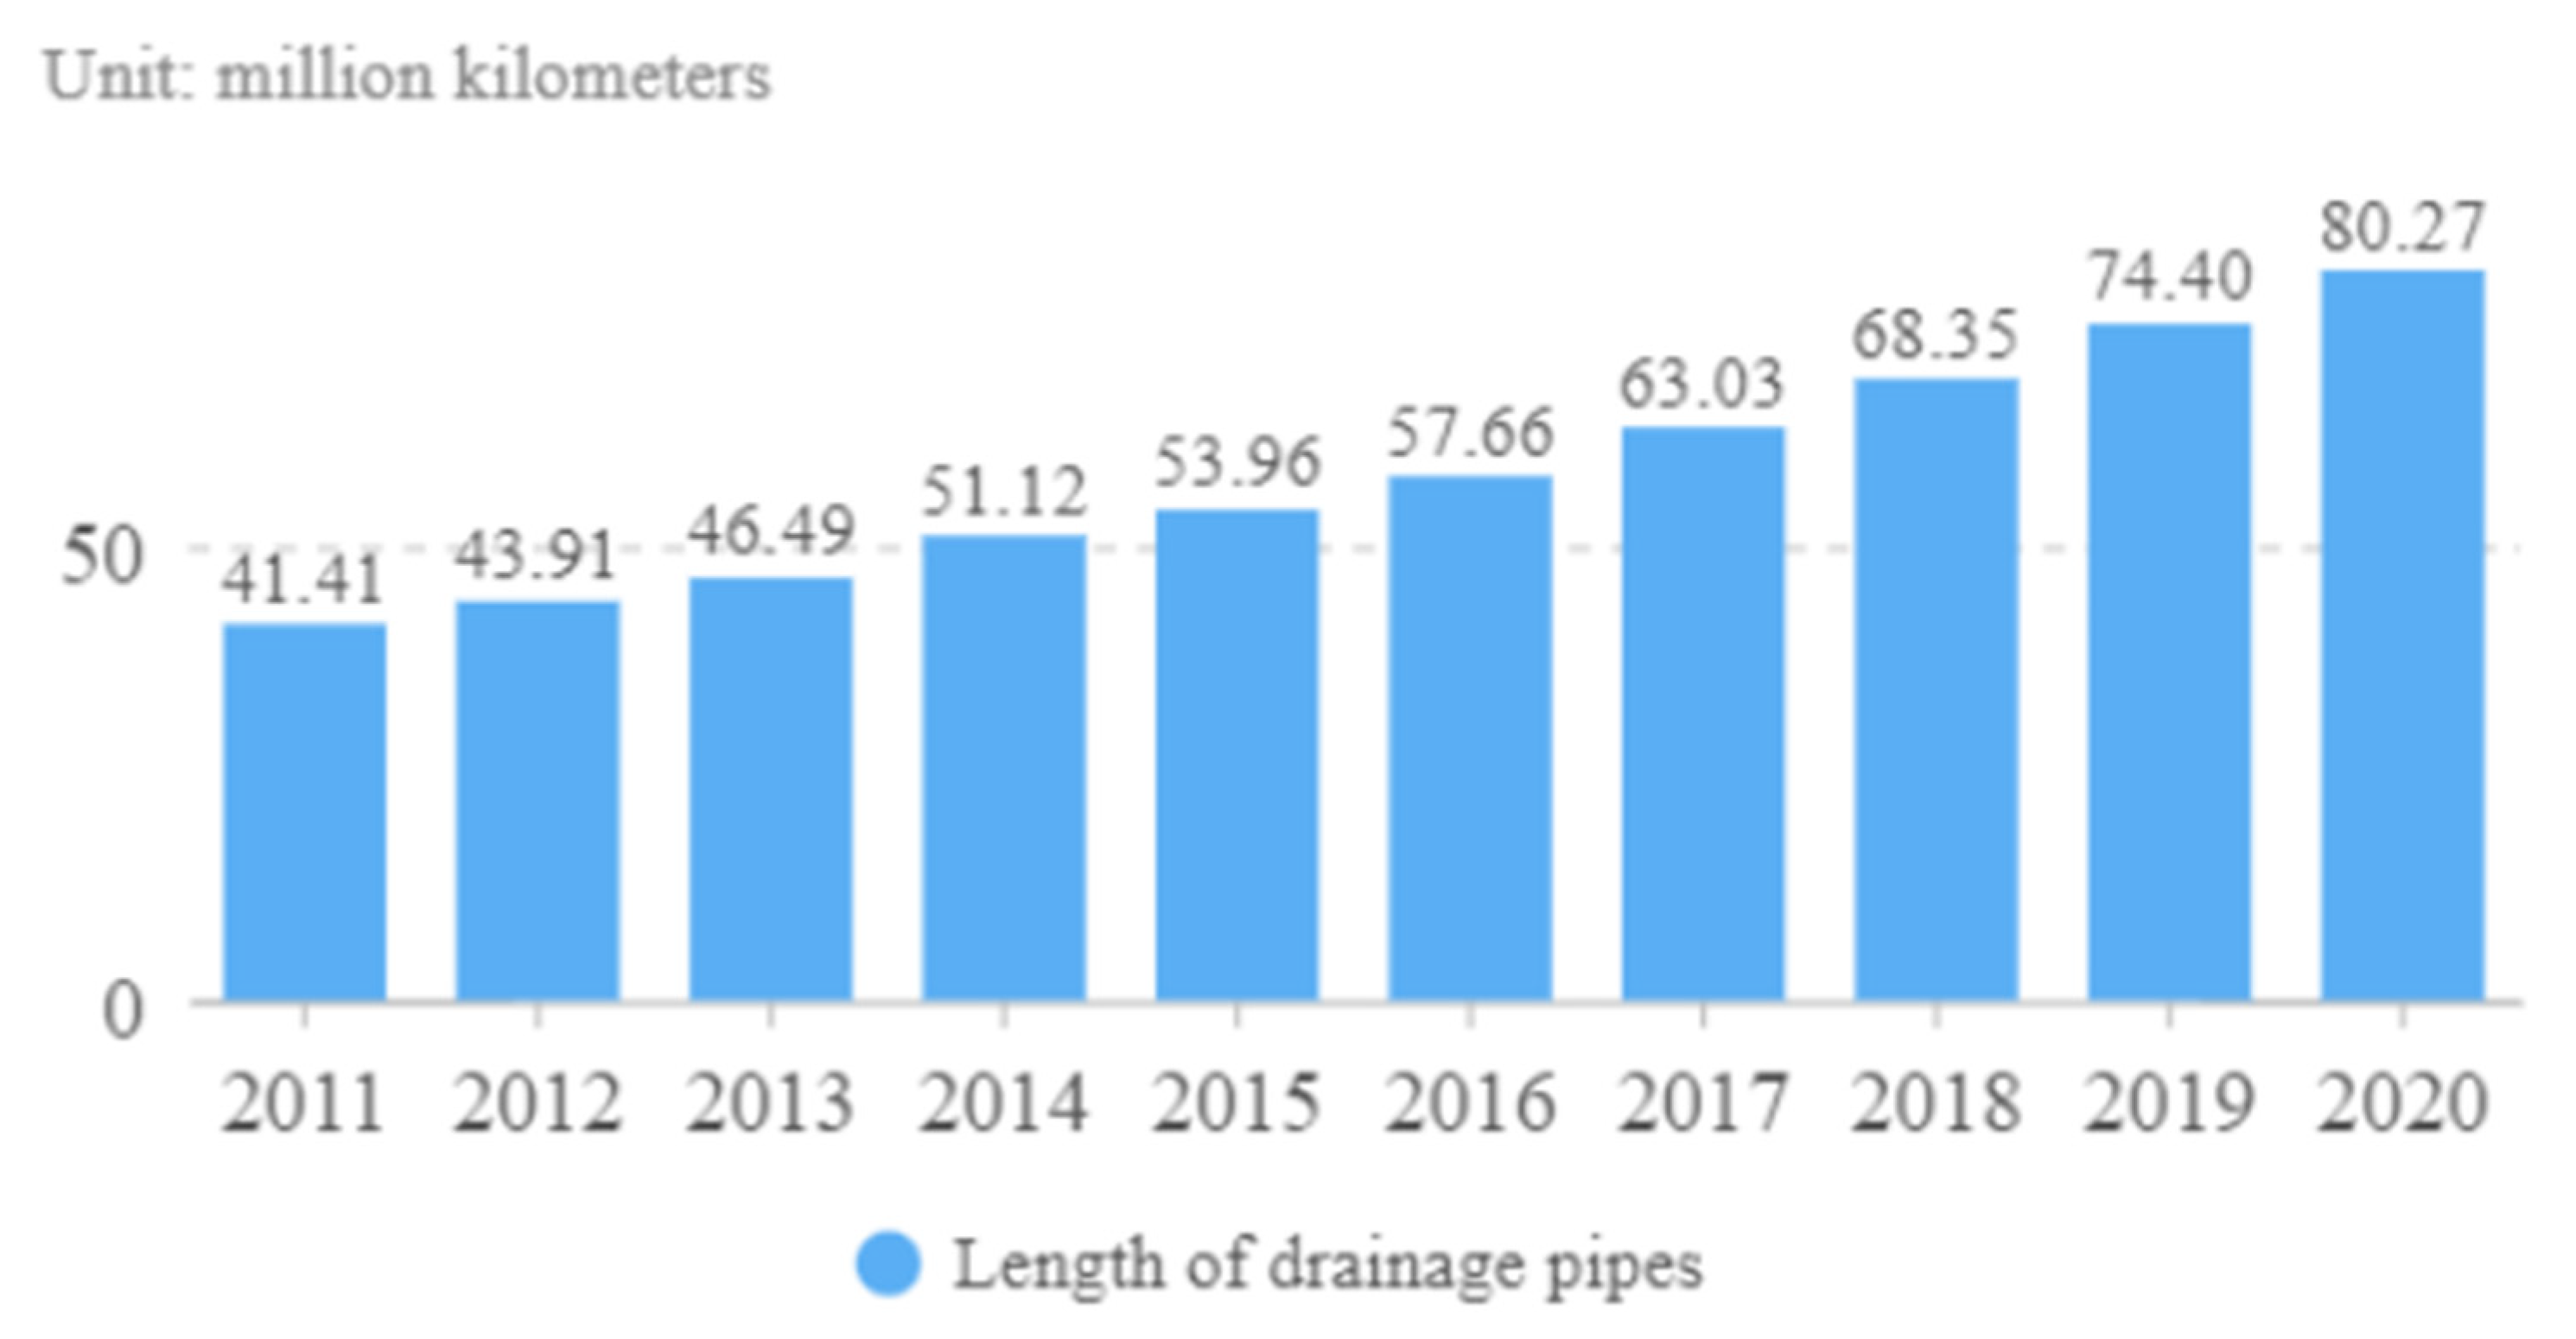
38]. Area is an important indicator of the national perspective, which directly affects the levels of urbanization, while the administrative area reflects the size of the geographical area of the urban jurisdiction, which is important for the overall planning of urban construction and infrastructure. The number of evacuation sites is a measure representing the capacity for the resettlement of victims of public emergencies. Shelter is a measure for resettling victims of public emergencies, which is especially important in the event of a disaster. Higher-quality shelter facilities will help to reduce the damage caused by such disasters. The emergency shelters that have been built in China still have problems such as unsound systems, inadequate mechanisms, and little role in disaster avoidance Flood Resilience Evaluation Indicator System. The overall length of drainage pipes is a major indicator of the drainage infrastructure, which demonstrates the city’s ability to drain water in the event of a flood. In recent years, the length of China’s drainage pipes has been growing, and the total length of drainage pipes will reach 802,700 km in 2020 (displayed in
Figure 1), but there is still a small gap between the per capita possession and density of pipeline network and developed countries, and the overall pipeline network construction capacity is insufficient. At the same time, in China’s urban drainage network, there are certain blind construction, network aging, pipeline repair is seriously inadequate and other problems, resulting in drainage network leakage and damage pipe bursts, groundwater contamination, and other incidents occur from time to time.
2.3. Susceptibility of Disaster-Bearing Bodies
Disaster-bearing bodies mainly include human beings themselves and the economic base and spatial environment on which they depend for their survival. The analysis of flood vulnerability refers to the likelihood of disaster-bearing bodies in the study area being exposed to flooding and its consequences. For the analysis of vulnerability, considering the representativeness of the indicators and the availability of data, the degree of aging [
39], urbanization rate [
40], population density [
41], and per capita disposable income of the residents [
42] were selected as the evaluation indicators of vulnerability. According to international standards, when the proportion of people aged 65 and above in a country or region exceeds 7%, it means that it has entered aging. A serious degree of aging represents a decline in the working population, which will lead to increased pressure on the urban economy, as well as an inability to secure the supply of human resources in demand and make evacuation difficult in the event of a disaster. The urbanization rate can promote economic development. Cities gather human, financial, and material resources, forming an efficient production and service system, which can improve the country’s economic efficiency. The urbanization rate represents the level of urbanization of a region. The higher the level of urbanization, the better its social development and the higher the corresponding social elasticity. The development of a region is closely related to the growth rate of its resident population. A large resident population is an affirmation of urban and regional development, and is also conducive to disaster resilience. Higher population density indicates a more efficient use of urban space and a higher degree of urbanization, but it also brings problems such as vehicle congestion, which in turn affects urban resilience. Per capita disposable income reflects the economic strength of households, shows the people’s ability to save themselves and each other in the event of a disaster, and to a certain extent represents the region’s ability to withstand disasters.
2.4. Vulnerability to Disaster Prevention and Mitigation
Vulnerability refers to the ability of human society and the natural environment to withstand and recover from disasters. Vulnerability depends on factors such as the level of socio-economic development, infrastructure development, emergency response capacity and social organization. Areas with lower levels of economic development usually have higher vulnerability because they lack sufficient resources to withstand and respond to disasters. In contrast, areas with well-developed infrastructure and emergency response systems have higher resilience. In addition, assessing the exposure of different regions can help us understand which regions are more vulnerable and need more attention. Therefore, vulnerability to disaster prevention and mitigation is analyzed in terms of medical assistance capacity [
43], public transportation service capacity [
44], gross domestic product (GDP) [
36], and general public budget income [
45], and the ability to resist, recover and rebuild after being affected by disasters. Medical aid capacity represents the level of medical care in the region, reflected in the number of medical and health institutions and the number of beds, as well as by the planned construction of medical infrastructure. Higher levels of medical treatment capacity will enable more people to be treated after a disaster, enabling faster recovery. A high-quality public transportation system is linked to high energy efficiency, low emissions, and low noise pollution. This reduces the pressure on the environment and promotes the sustainable development of the city, while easing the pressure on urban transportation and improving urban resilience. Gross domestic product (GDP) represents the level of regional economic development, reflecting the scale and growth rate of economic activity in a region, and is an important indicator of the level of economic development. GDP growth is usually associated with employment growth and improved living standards and is conducive to improving post-disaster resilience. General public budget revenues are often arranged to protect and improve people’s livelihoods and promote economic and social development, which enables cities to respond in a timely manner before, during and after a disaster, thereby improving disaster and post-disaster resilience.
The evaluation system of the assessment indicators is shown in
Table 1.
3. Research Methods
Flood risk management and flood resilience have been the subject of much research by scholars, leading to the development of evaluation methods using a range of methodological approaches. Chen Xue created a 0.01° grid [
46] based on meteorological data, socio-economic data, and geographic information data to refine risk assessment and zoning of flooding in Harbin, China. Zhu et al. used the fuzzy-DEMATEL method [
47] to determine the key influencing factors and their interactions on the flooding resilience of Chinese cities. Zhang Wei quantitatively analyzed the risk of heavy rainfall flooding using fuzzy mathematical analysis [
48] on the basis of obtaining indicator weights based on hierarchical analysis (AHP) and entropy weighting method (EWM). Ji and Chen used TOPSIS tools to evaluate the resilience of Suzhou, Wuxi, and Changzhou [
49].
Wang Shiliang took 11 cities of Inner Mongolia as the study area and used the entropy weight method and TOPSIS method [
50] to explore the differences in the level of urban resilience and the spatial characteristics of urban resilience. Sun took the Yangtze River Delta as the study object, established a flood disaster risk analysis model, used the entropy weight method to calculate the index weights, and used three multi-criteria decision-making [
51] (MCDM) methods for comparative analysis of flood disaster risk in four administrative regions. Most of the traditional research methods are to weigh and sum the indicator values of each scenario to obtain the comprehensive attribute values of each scenario, and then rank them according to their size. A common weakness in these approaches has been the reliance on individual experience and reasoning of professional decision makers, leading to the presence of subjectivity in their findings. This research proposes an improved research model that introduces a new method of hesitant fuzzy linguistic item sets into the evaluation process, combining the D-number theory, the AHP, and the VIKOR method to rank the flood resilience of the city based on the calculation of the weights of the indicators.
Table 2 shows a summary of the methodology used in this research.
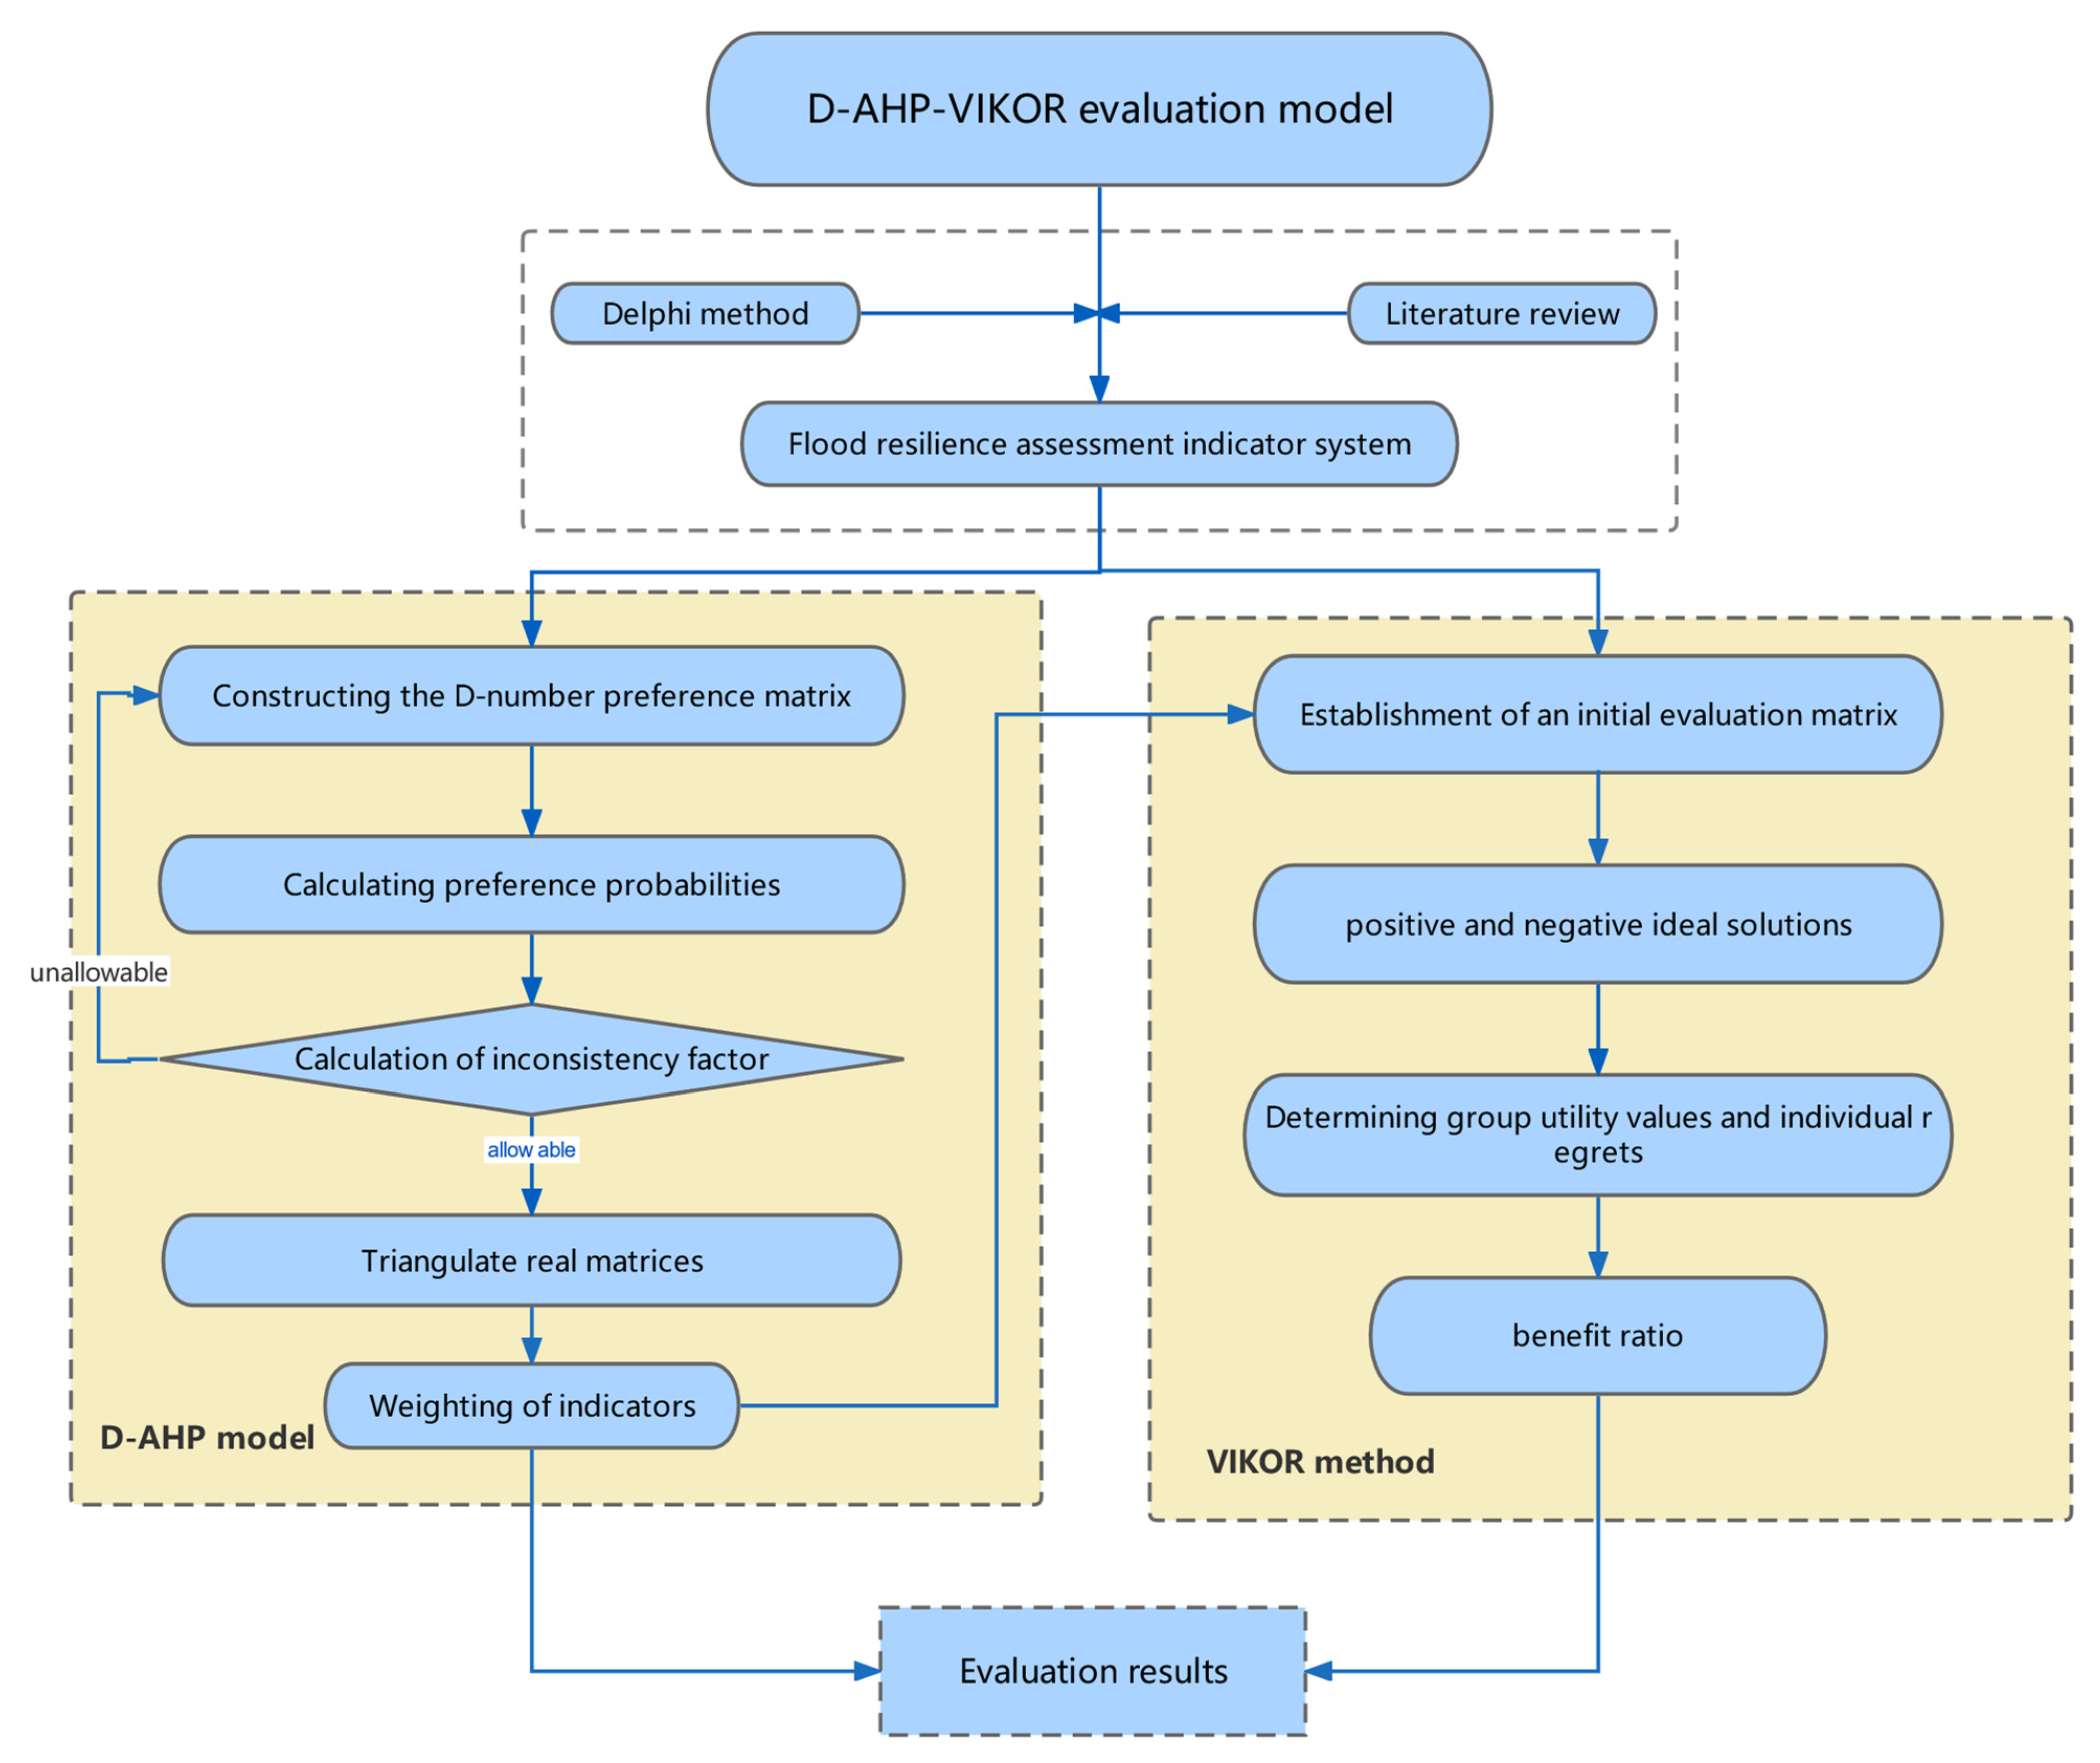
The comprehensive evaluation framework developed for this research is shown in
Figure 2. First, the urban flood resilience index system was constructed through a review of the literature and findings from a Delphi study. Then, the elements related to the decision-making objectives were decomposed into a hierarchical structure of top-level objectives, intermediate-level guidelines, and bottom-level programs according to the hierarchical relationships. These were identified using the D-number theory and hierarchical analysis method (AHP) [
52] to clarify the relationships and influences between the indicators and to derive the weights of each indicator. Finally, the VIKOR method [
53] was used to evaluate the flood recovery capacity of the three study areas.
3.1. Construction of the D-AHP Model
D-number theory is an extension of Dempster–Shafer evidence theory, and which can better describe and deal with uncertain information. D-number theory has been applied in different fields of research to achieve robust results, but not in the area of flood resilience. Therefore, in this research, D-number theory is used in the study of urban flood resilience assessment for the first time.
Definition 1. Let Ω be a finite non-empty set and the D-number be a mapping defined by D: that satisfies the condition and D(∅) = 0. Where: ∅ is the empty set and B is the subset of Ω If , then it means that the information represented by the number D is complete. Conversely, the information is incomplete.
Definition 2. Let D = {(b1, v1), (b2, v2), …, (bi, vi), …, (bn, vn)} be a D-number. Then the fusion of D numbers is
The integration of D numbers can be referred to as the I-value.
Definition 3. Let there exist a set of evaluation samples U, based on U × U in the form of fuzzy sets with fuzzy preference relations as
Expressed in matrix form as R = [rij]n×n, assumewhere rij denotes the degree of preference of expert Ui over expert Uj, the assignment of rij and its corresponding meaning are as follows.
Definition 4. The D-number preference relation RD is a collection of indicators U in the form of a D-number matrix with
Expressed in matrix form as RD = [Dij]n×n, assume Included among theseDji = {(1 − bij1, v1ij ), (1 − bij2, v2ij ),…, (1 − bijm, vijm)}, ∀i, j ∈ {1, 2,…, n}; bijk ∈ [0, 1], ∀k ∈ {1, 2,…, m}; Dii = {(0.5, 1.0)}, ∀i ∈ {1, 2, · · ·, n}; bijk denotes how important the kth expert thinks the ith option is relative to the jth option; vijk denotes the expert’s support for that level of importance.
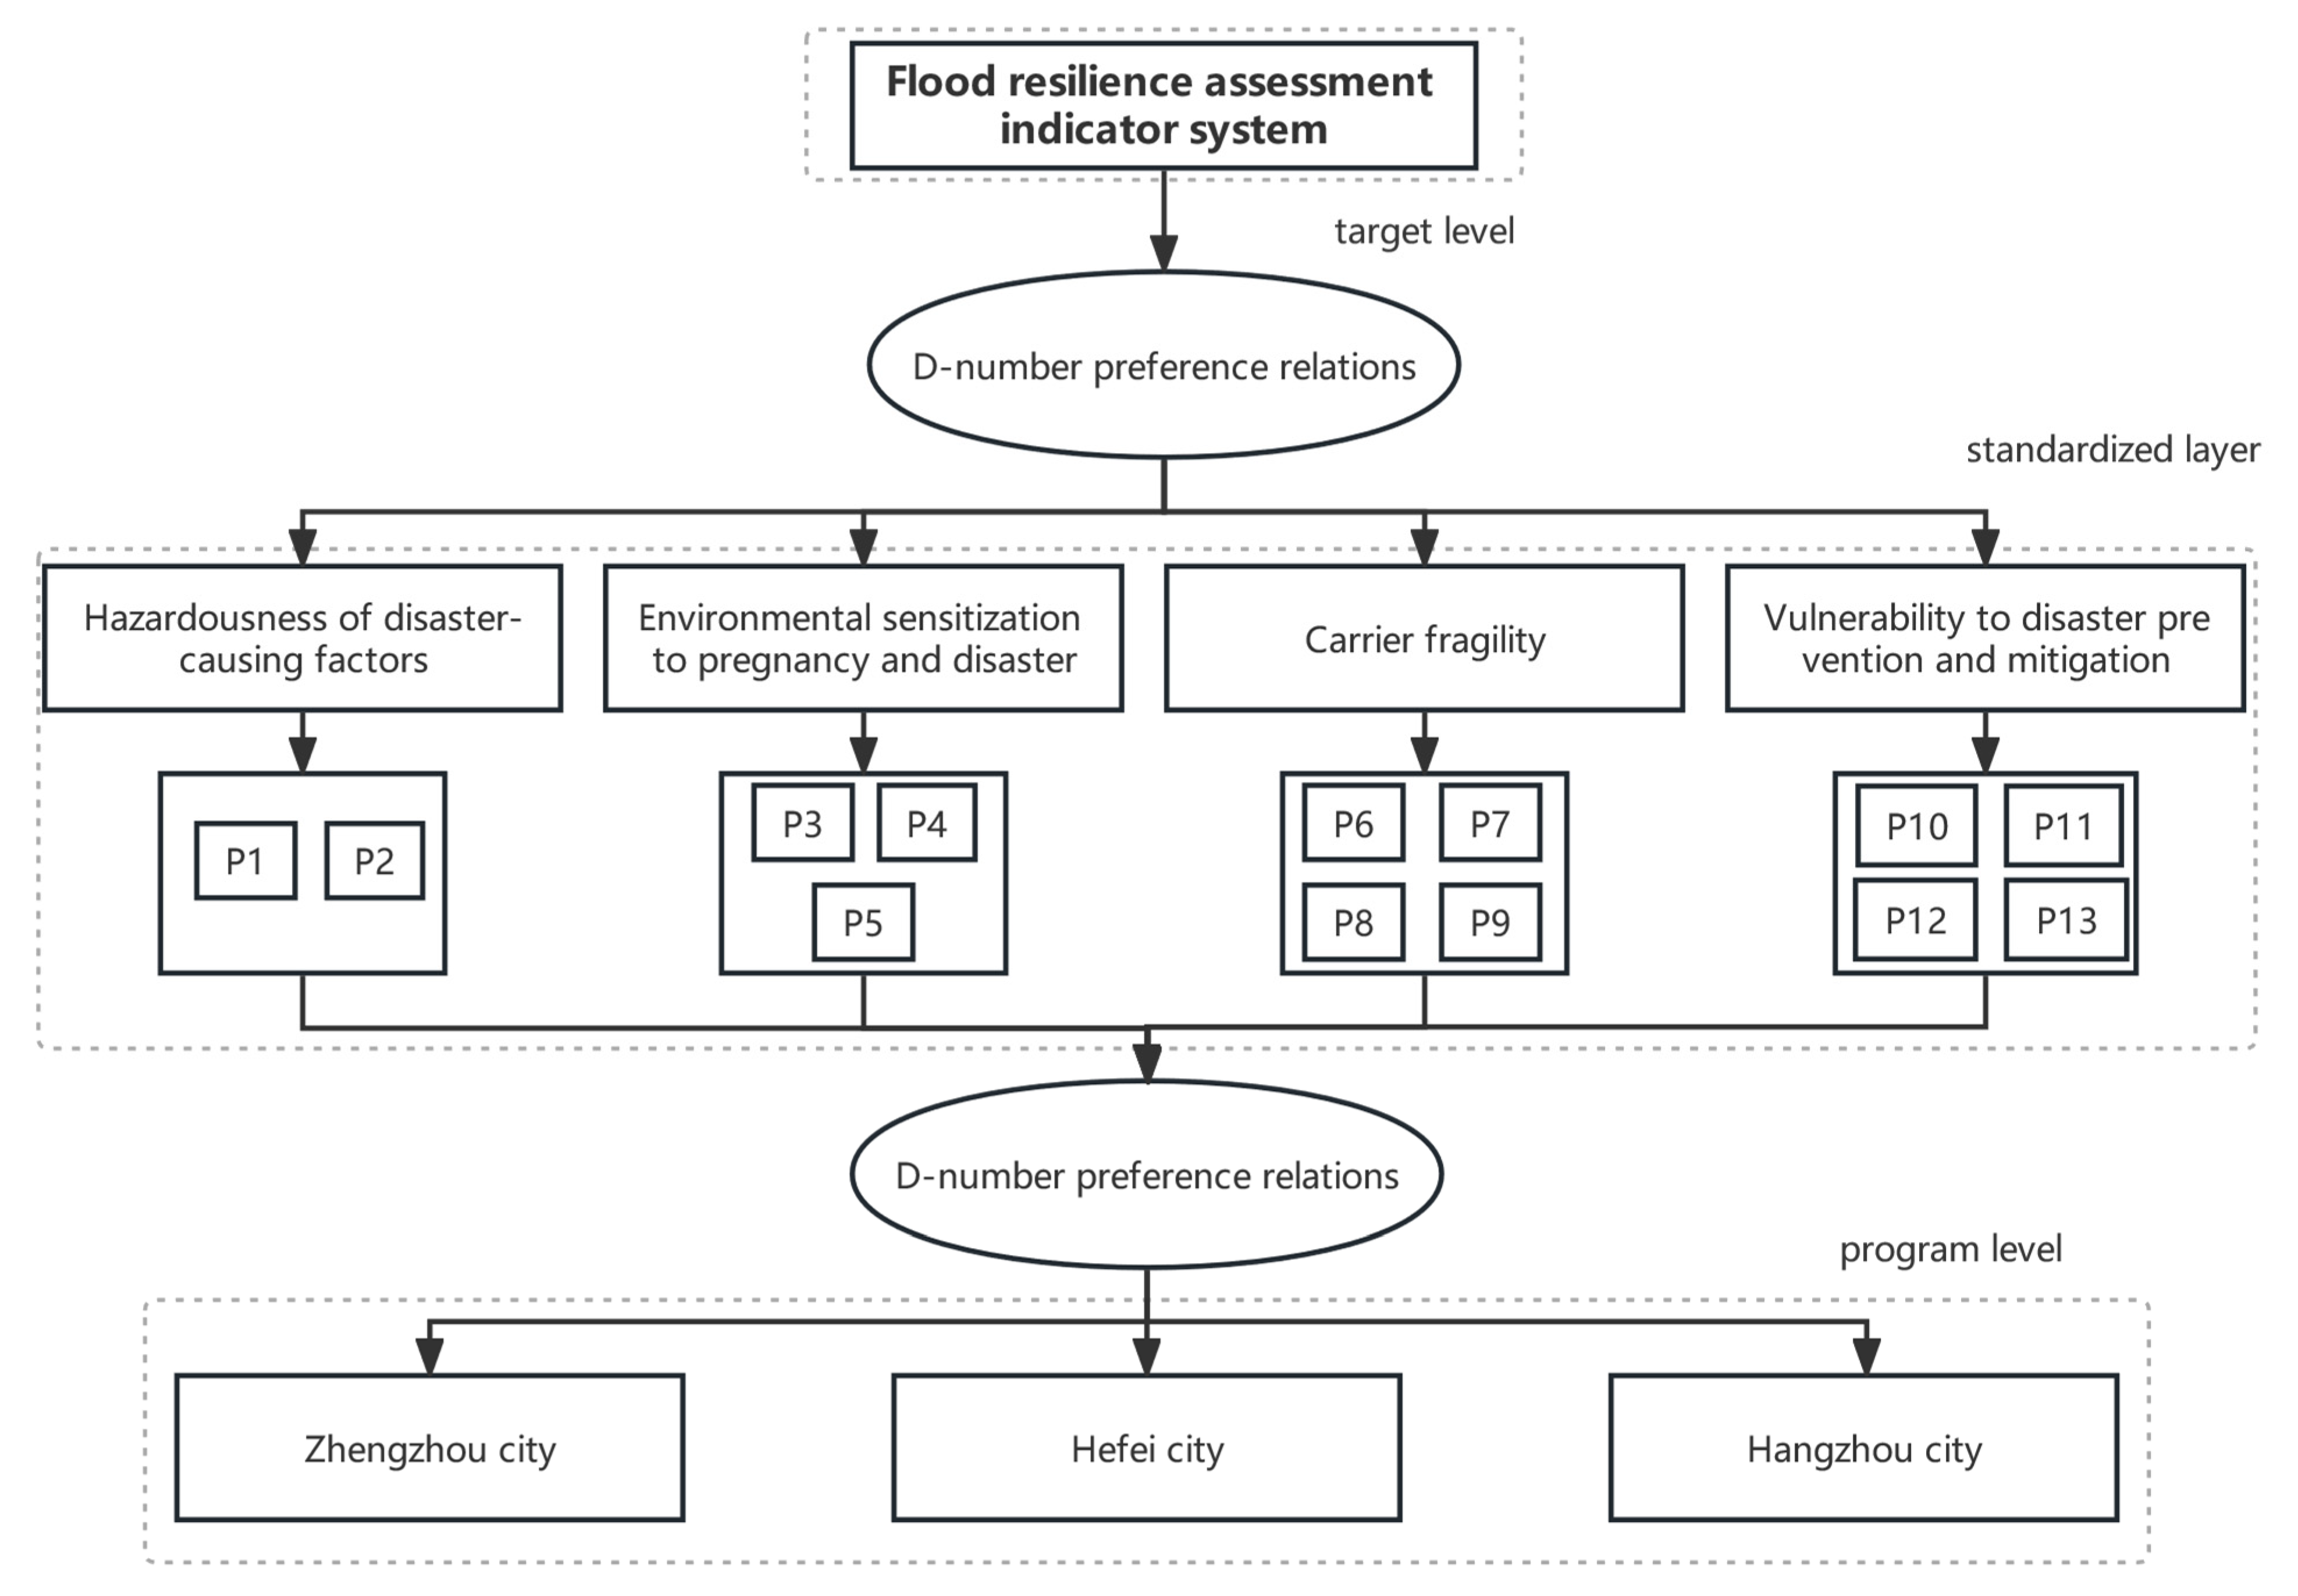
The AHP method needs to manually compare and assign weights to different factors, which is easily affected by personal subjective bias, while the D-AHP method obtained by combining the D-number theory with the AHP, which solves the indicator weights from the D-number preference relationship and combines the AHP hierarchy structure with the layer-by-layer integration of the weights of the indicators at all levels, can be better applied to the complex assessment decision-making problems under the uncertain information environment, which reduces the errors caused by the subjective factors of the AHP method and effectively reduces the impact of uncertainty on the assessment results in the assessment process. This reduces the errors caused by subjective factors in the AHP method, and also effectively reduces the impact of uncertainty in the assessment process on the assessment results, which makes the results more scientific and accurate. The D-AHP hierarchy is shown in
Figure 3.
The basic steps of the D-AHP method are as follows:
Step 1: Organize assessment experts to compare the indicators in pairs and construct the D-number preference matrix RD.
Step 2: Transform the D-number preference matrix RD into the real-number matrix RC using the D-number fusion formula.
Step 3: Construct the probability matrix RP based on the determinant matrix RC, and calculate the preference probabilities among the pairwise comparisons.
Step 4: Calculate the sum of each row of the RP matrix and sort it by size, and then obtain the triangularized matrix RPT based on the matrix ordering.
Step 5: Triangulate the real matrix RC according to the triangularized matrix RPT to get the triangularized real matrix RCT.
Step 6: Calculate the relative weight of each indicator according to the matrix. In calculating the weights, the inconsistency coefficient is calculated by the following formula:
where n denotes the number of indicators compared in pairs.
3.2. VIKOR Method
The VIKOR method is optimized according to the size of its distance from the ideal indicator value. The basic steps are as follows:
- (1)
Normalize the original matrix scaling, i.e., convert a measured expression into a dimensionless one.
- (2)
Find positive and negative ideal solutions.
- (3)
Determine the group utility value Si and the individual regret value Ri.
- (4)
Calculate the benefit ratio Q.
v is the decision mechanism coefficient of the “most criteria” strategy, which reflects the importance of the criteria or the preference of the decision maker. In this paper, we take
v = 0.5.
Eventually, the benefit ratio of each program can be obtained, and the smaller the benefit ratio, the better, using the benefit ratio to rank the evaluation object.
4. Empirical Analysis
4.1. Overview of the Study Area
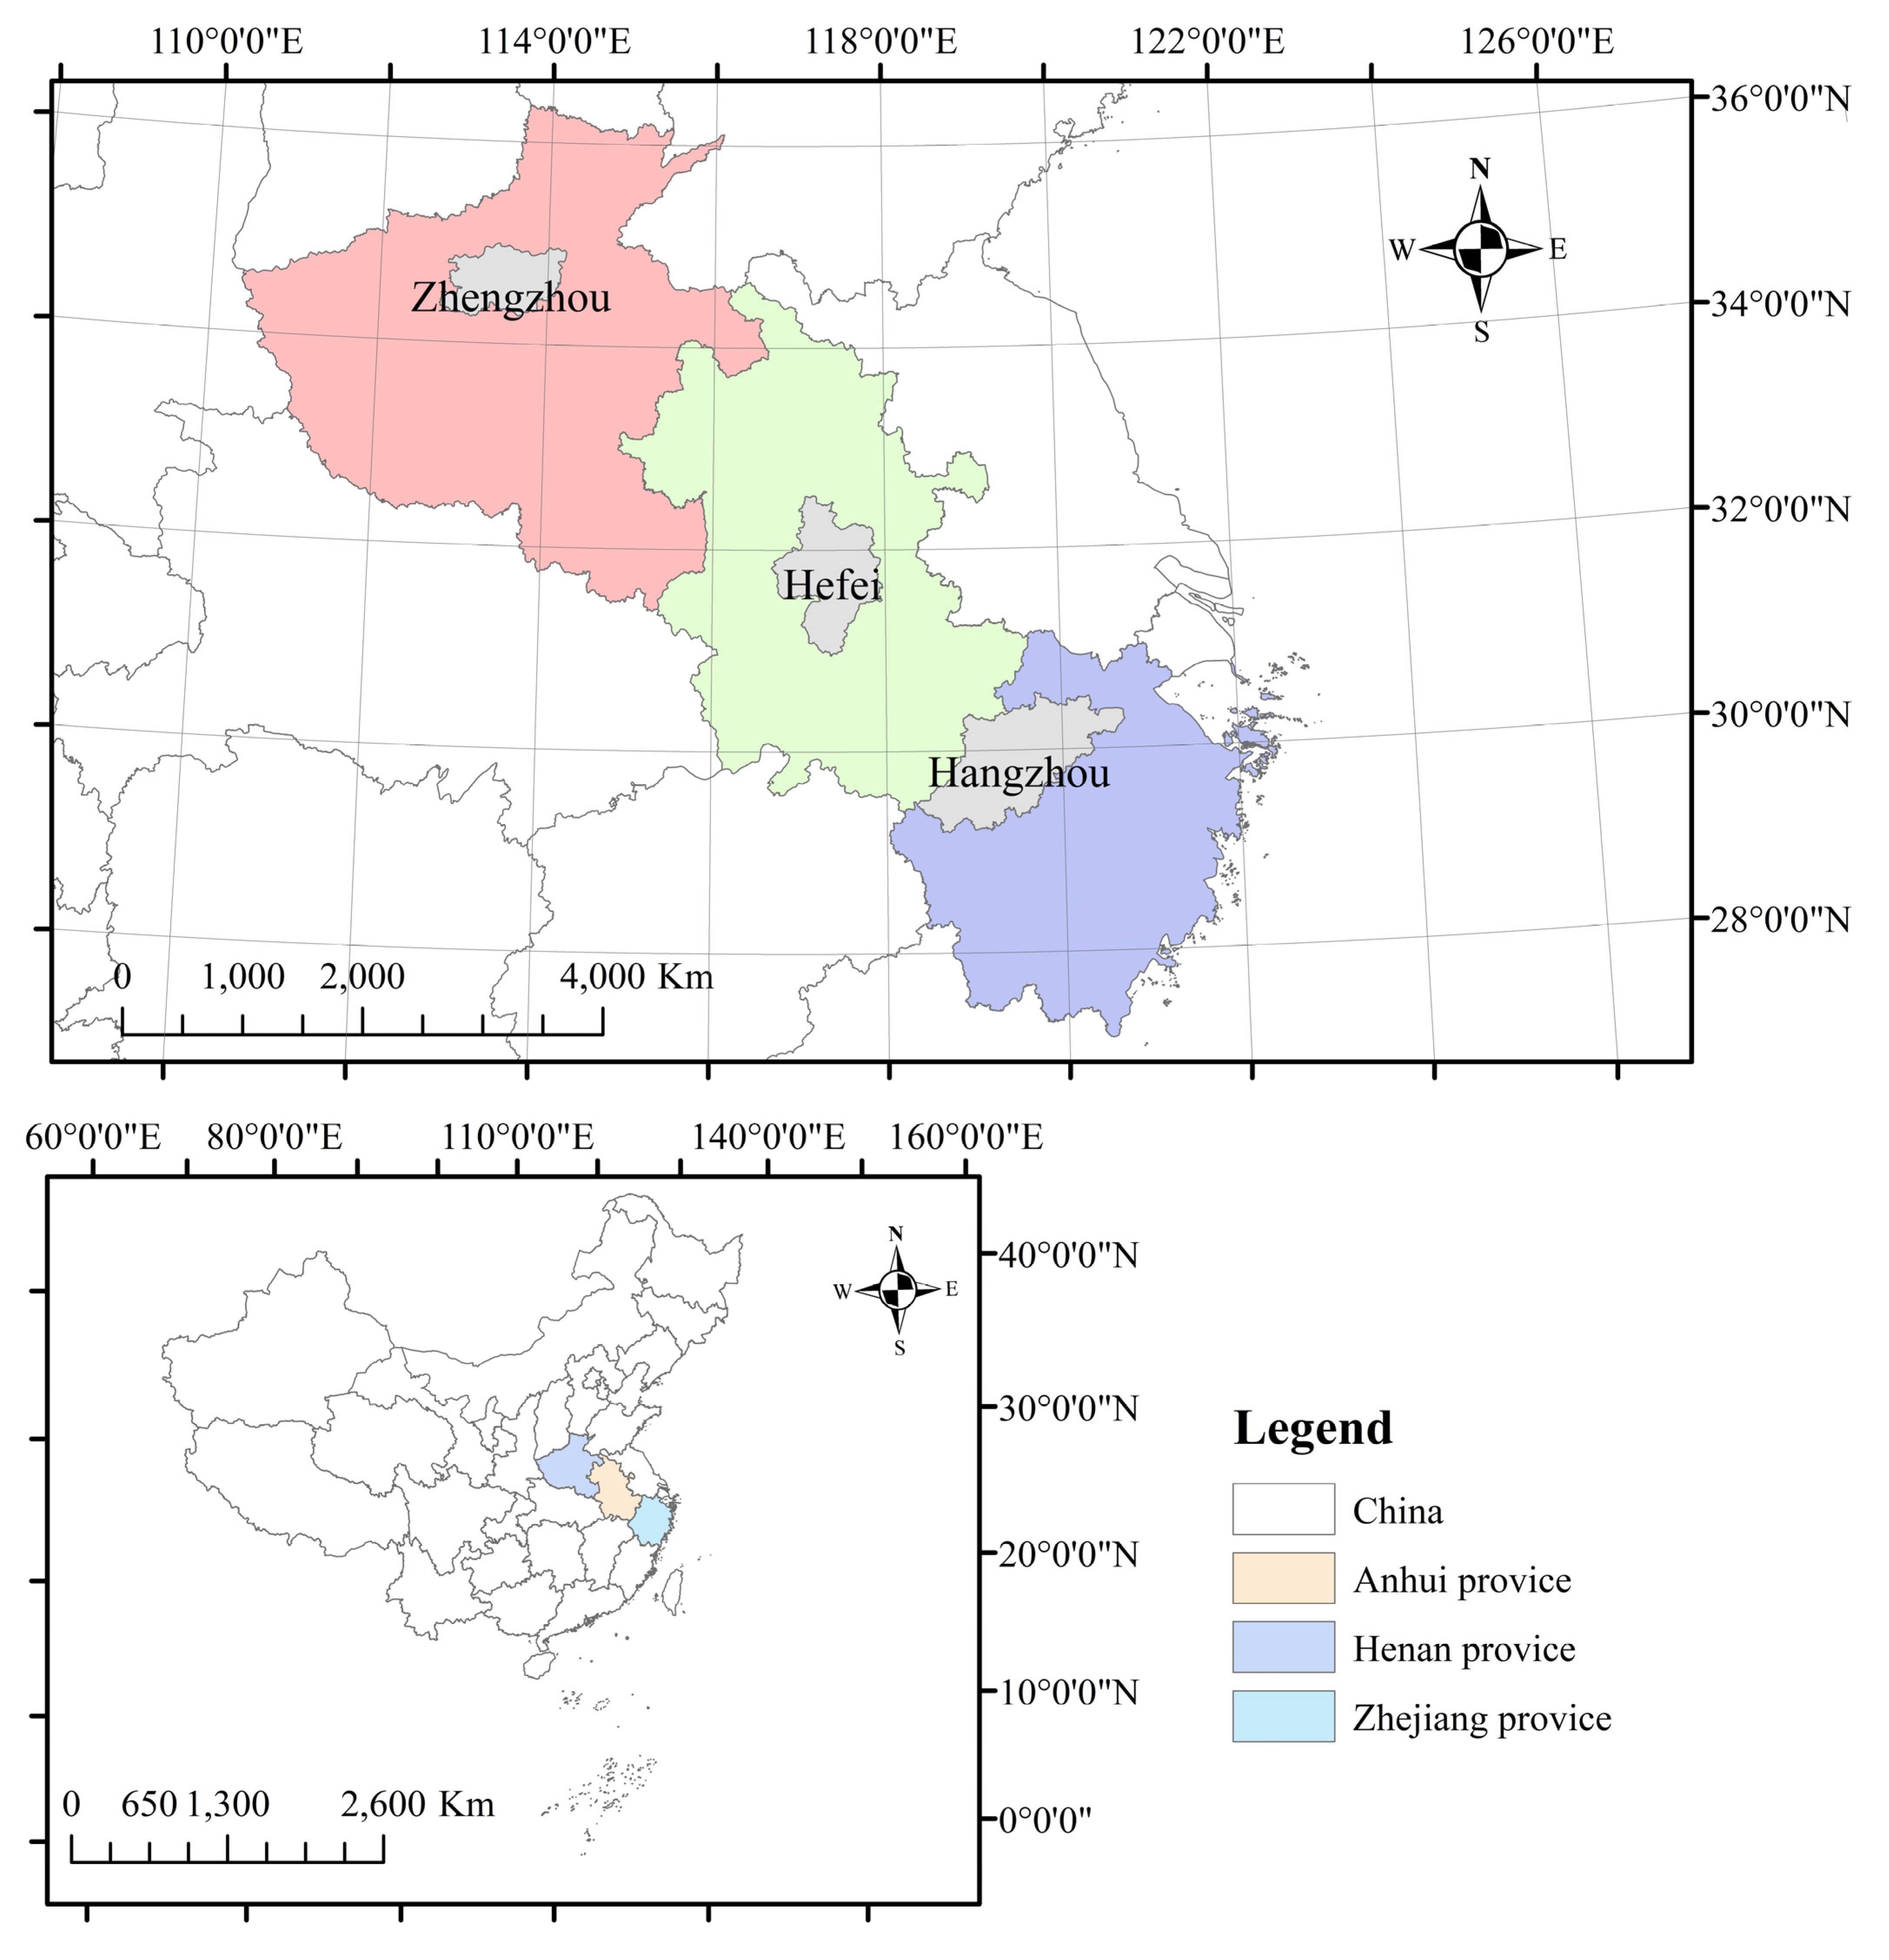
Zhengzhou City, Hefei City, and Hangzhou City in China are selected for this study, which are economically developed and have high levels of urban agglomeration, all of which are prone to severe urban flooding, and all of which are areas that will be more severely affected by flooding in 2021, as shown in
Figure 4. The emergence of Typhoon No. 6 in 2021, so-called “Fireworks”, brought intense rainstorms, strong winds, and even tornadoes to many parts of the country. Many yellow, orange, and red rainstorm warnings were issued, and the amount of rainfall in many places exceeded historical records. The typhoon “fireworks” had a huge impact on rainfall in China, causing extreme rainfall in many places, which not only affected people’s normal life but also caused many casualties and economic losses in many provinces.
Among them, the Henan region received the most precipitation and was the most affected. Zhengzhou City is the capital city of Henan Province and the political, economic, and cultural center of the Central Plains. However, due to its location in the middle plain of the Yellow River, Zhengzhou City is prone to flooding when there is too much rain. Rainfall in the region is concentrated in the summer, with June and September accounting for about 60% of the annual rainfall. Historically, Zhengzhou City has experienced several instances of flooding, causing serious impacts on the lives and properties of its citizens. In July 2016, Zhengzhou City was once again hit by torrential rains, with a rainfall of 350 mm, which overwhelmed the city’s drainage system and flooded many roads, paralyzing traffic, flooding the homes of its citizens, and causing substantial property damage. In July 2018, Zhengzhou City was once again hit by torrential rains, with a rainfall of 380 mm. Flooding in the city was again serious, with severe waterlogging in several sections, traffic was blocked, and people’s lives were seriously affected. On 20 July 2021, flooding caused by extreme rainfall resulted in 380 deaths, 40.9 billion yuan in direct economic losses, and huge losses of life and property. Overall, Zhengzhou City has suffered serious flooding situations under all the heavy rainfall attacks, which have brought serious impacts on citizens’ lives and properties.
Hefei City is located in the central part of Anhui Province, in the middle of the Yangtze River and Huaihe River, the surface water system is more developed, and rainfall is concentrated in the summer, with an average annual rainfall of more than 1000 mm. Short-term heavy precipitation is the main cause of urban flooding. In July 2018, Hefei City suffered short-term heavy precipitation, heavy rainfall caused waterlogging on the Maanshan road. In July 2020, Hefei, Anhui Province, was severely flooded by the impact of heavy rainfall weather, and many vehicles were flooded, and the roads were submerged. In July 2021, Hefei City experienced sudden heavy rainfall, and some of the low-lying sections of the urban area were flooded, leading to people being trapped, and vehicles flooded on the day the Hefei meteorological department issued a red warning signal for heavy rainfall, causing the suspension of several indoor railroad lines and forcing the suspension of high-altitude and outdoor operations.
Hangzhou is located in the Yangtze River Delta and the Qiantang River basin, with a complex and diverse topography, a dense network of rivers and lakes, and abundant precipitation, and is subject to typhoons and floods year-round. 2020 During the plum season, Hangzhou City was hit by continuous and prolonged heavy rainfall and flooding. 2021 When the fireworks logged on to Hangzhou in 2021, the Qiantang River was in flood season, and Hangzhou was hit by a major downpour, resulting in traffic disruptions and the cancellation of flights at airports. 2023 July In July, heavy rains fell in some areas of Hangzhou, Zhejiang Province, and a village in Dayuan Town flooded suddenly, flooding the houses of many villagers’ homes and causing casualties and property damage.
4.2. Data Sources
In this study, the data came from two main elements, quantitative data came from the statistical yearbooks of each city for the year 2021, and stereotypical data were collected through the Delphi method. In this study, 40 experts were selected for the evaluation panel, and views were collected through a questionnaire survey distributed via e-mail. Three rounds of testing were conducted, with a return rate of more than 80%. In the Delphi method, the invited experts did not know each other and the evaluation was done anonymously. After three rounds of the experiment, the experts’ opinions were considered to be converging and demonstrating a consensus, enabling the Delphi process to be terminated. The characteristics of the expert group are shown in
Table 3.
5. Results and Analysis
5.1. Analysis of D-AHP Results
The experts’ views were used to calculate the weightings of importance for each of the indicators as follows:
Step 1: The assessment experts were organized to compare the indicators in pairs and to construct the D-number preference matrix
RD,
Step 2: Transform the D-number preference matrix
RD into the real-number matrix
RC using the D-number fusion formula.
Step 3: Construct the probability matrix
RP based on the determinant matrix
RC, and calculate the preference probabilities among the pairwise comparisons.
Step 4: Calculate the sum of each row of the R
P matrix and sort it by size, and then obtain the triangularized matrix
RPT based on the matrix ordering.
Ranking the indicators, the results obtained are: U2 > U1 > U3 > U4. This result shows that the degree of importance of the results of the assessment of flood resilience in descending order is: U2, U1, U3, and U4.
Calculation of inconsistency factor , the value is within tolerance.
Step 5: Triangulate the real matrix
RC according to the triangularized matrix
RPT to obtain the triangularized real matrix
RCT.
Step 6: Calculate the relative weight of each indicator according to the matrix.
where
ωUi denotes the weight of the ith level indicator in the flood resilience risk assessment system;
λ denotes the degree of credibility of the information, the value of which is related to the credibility of the participating experts, because the participating experts are experienced and have high credibility, so
λ = 2.
This leads to the following weights for the indicators at the normative level:
U1 = 0.300,
U2 = 0.450,
U3 = 0.200,
U4 = 0.050. From this, it can be seen that the greatest degree of influence is the sensitivity of the breeding environment
U2. Similarly, the weight of each secondary indicator relative to the first-level indicator of the guideline layer of flood resilience assessment and the comprehensive weight relative to the target layer can be found. The calculation results are shown in
Table 4, and
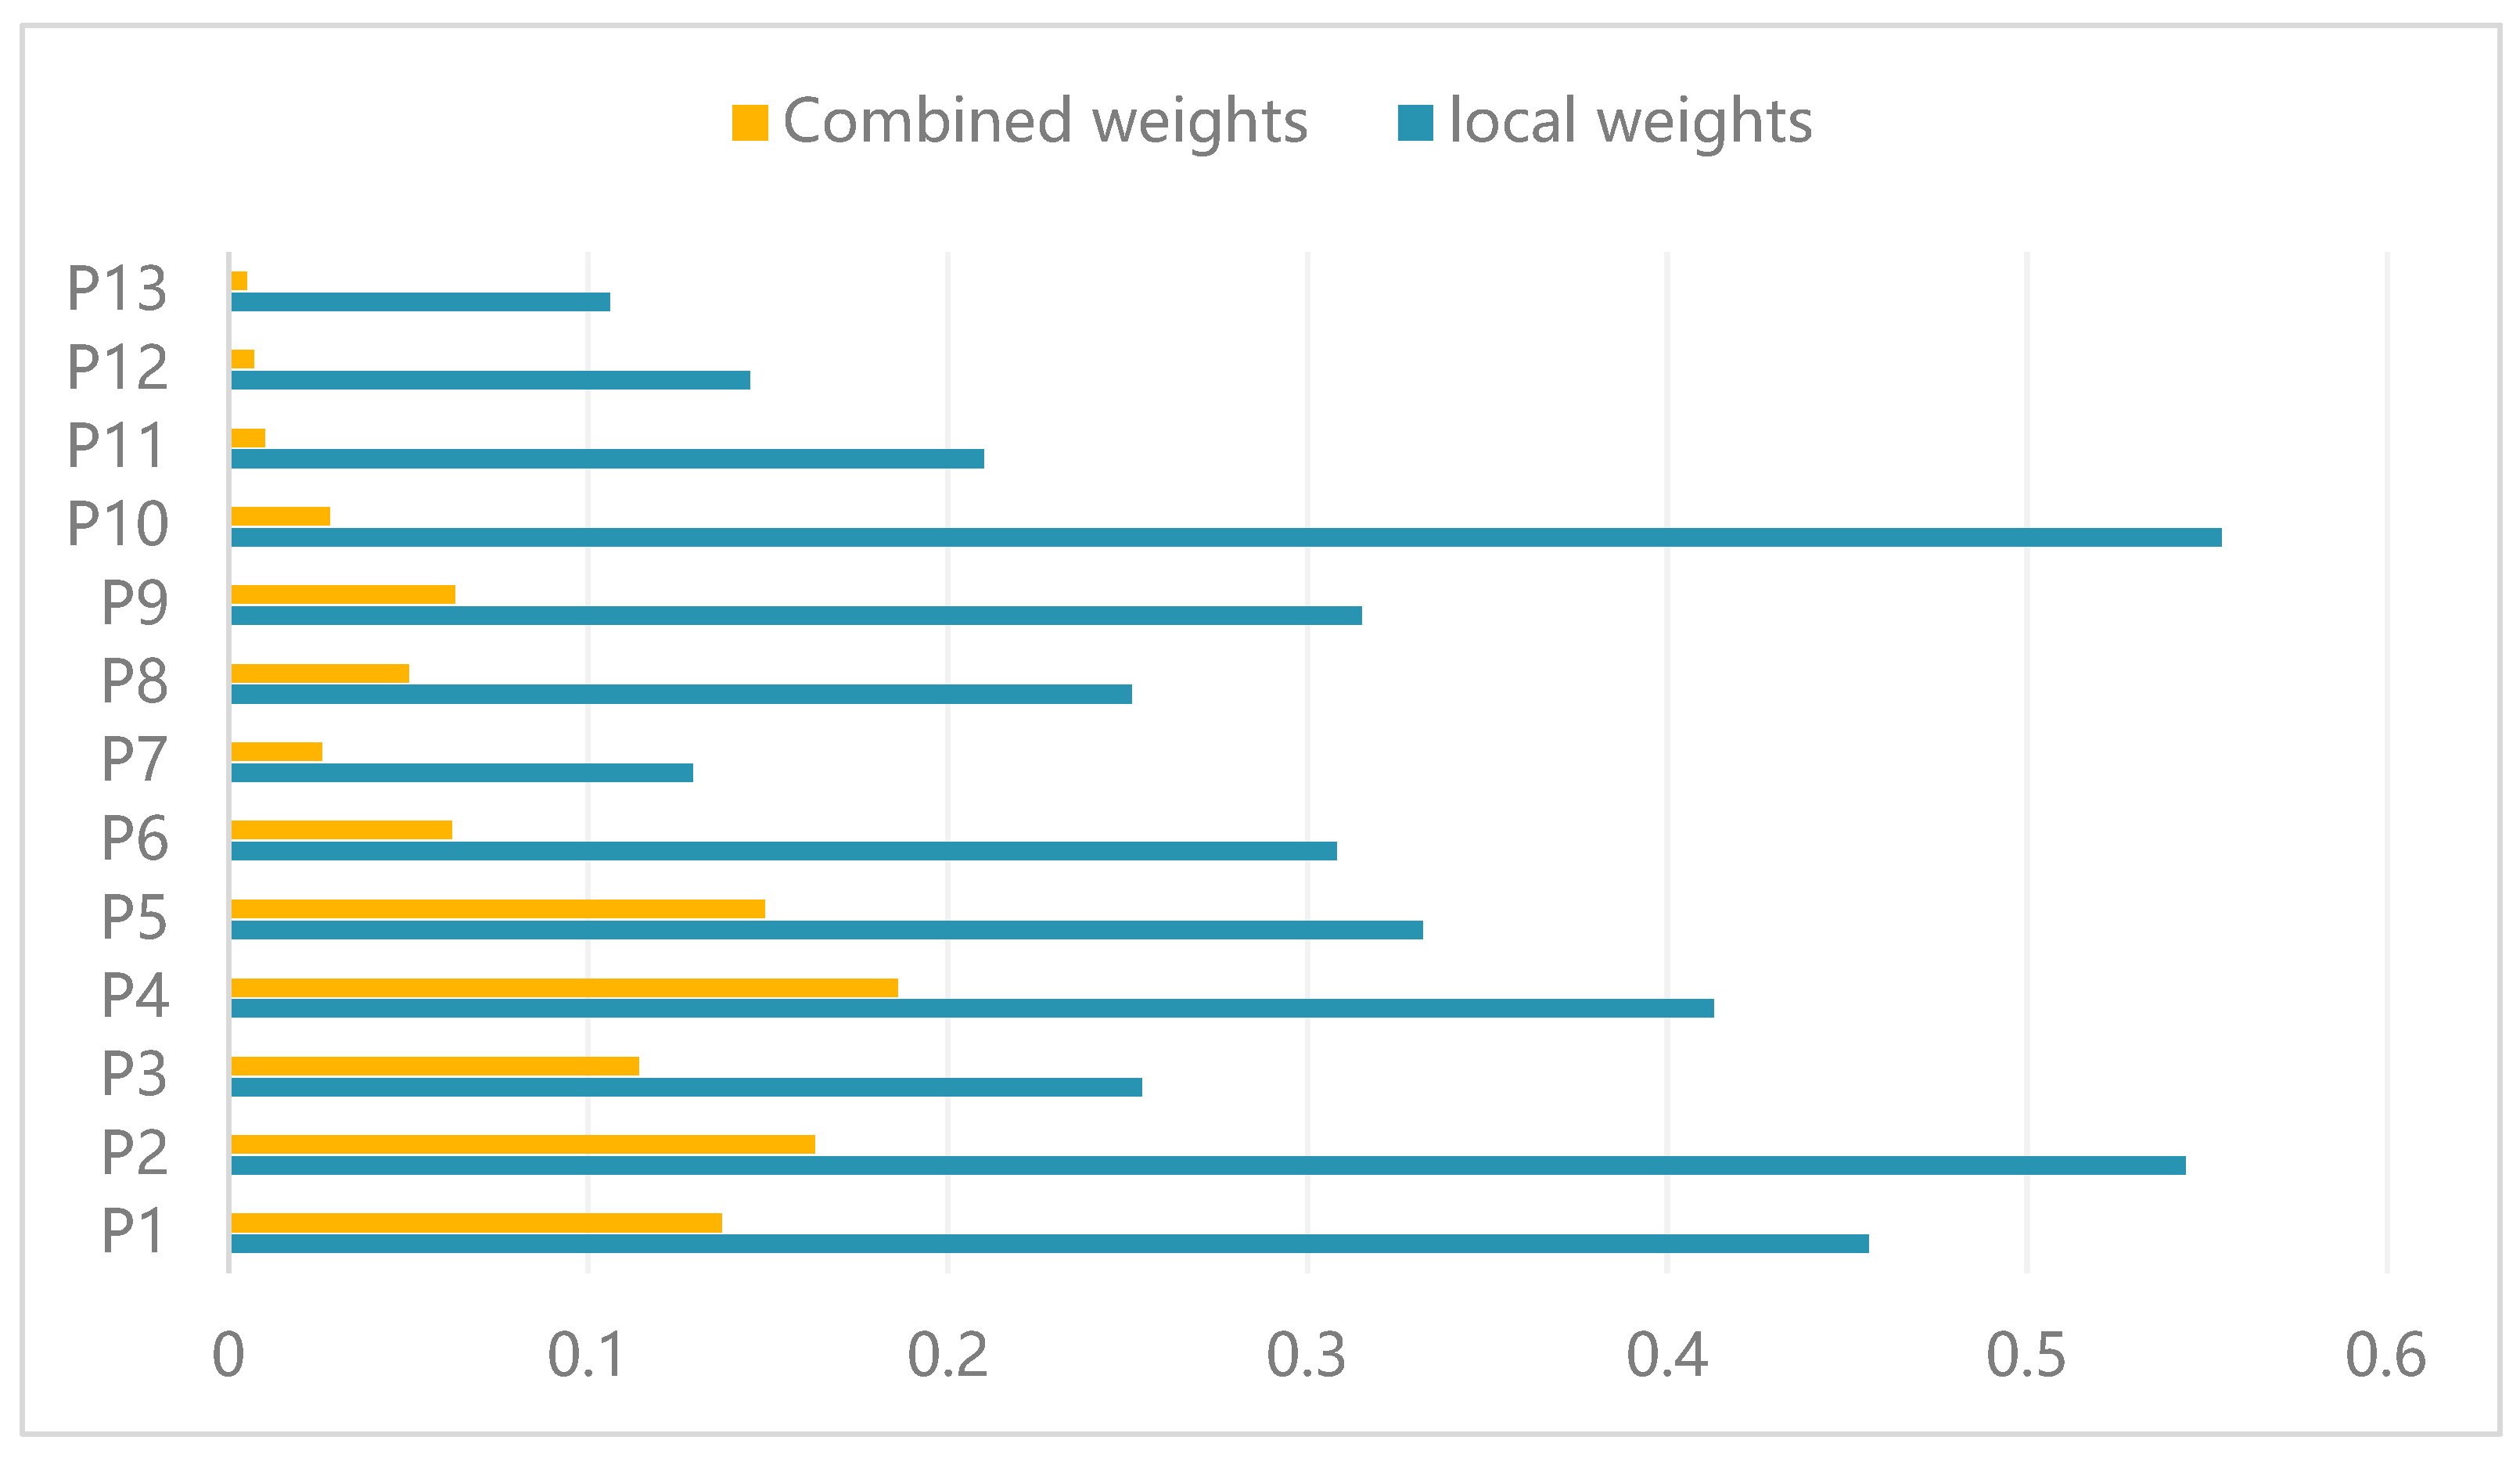
Figure 5 visualizes the weight gap of each indicator.
As can be seen from the weights obtained through D-AHP (
Table 4), in the indicator categorization layer, the sensitivity of the disaster-conceiving environment and the risk of the disaster-causing factors are the most critical factors affecting the city’s flood resilience. Among them, the main factor under the sensitivity of disaster-inducing environment is the number of shelters P4, which is a key factor for cities in the event of a major flooding event and enables a strong flood response system. The main influence factor in the risk of disaster-causing factors is the sewage treatment capacity P2. Strengthening of the treatment of urban sewage can improve a city’s functionality, and greatly promote the development of urban environmental protection. Urban water management and sewage treatment have become an important element of modern urban infrastructure and urban development. Where a city’s sewage treatment capacity is strong, when subjected to heavy rainstorms, the city will have a large buffer for the impact.
5.2. Analysis of VIKOR Method Results
(1) Based on the opinions of the expert panel, the initial evaluation matrix was constructed, and the standardized matrix was obtained by applying Formula (5), and the results are shown in
Table 5.
(2) Determine the positive and negative ideal solutions corresponding to the indicators according to Equations (6) and (7), as shown in
Table 6.
(3) The group utility value, individual regret value, and interest ratio are derived from Equations (8)–(10), as shown in
Table 7. Sorting by benefit ratio Q, there are Hefei City > Hangzhou City > Zhengzhou City.
The VIKOR assessment model shows that Hefei has the smallest benefit ratio (refer to
Table 7), which means that Hefei has the most effective flood resilience and is more capable of coping with emergencies. Hangzhou is in second place, while Zhengzhou has the lowest level of flood resilience.
5.3. Analysis of Flood Resilience in the Three Cities
In terms of the risk of disaster-causing factors, the national average annual precipitation in 2021 was 691.6 mm, while the average annual rainfall of Zhengzhou City was 1570.5 mm, this being the highest among the three cities. Zhengzhou City’s sewage treatment capacity is the weakest, so the damage caused was more serious. Hence in the future, Zhengzhou needs to invest in its sewage treatment plant capacity and capability, including aspects such as the development of a complete set of management mechanisms, integrated planning approaches, the adoption of a scientific approach to layout, enhancement of the institutional management, development of supervision and towards improving the overall quality and efficiency of the system. At the same time, all three cities need to monitor and forecast heavy rainfall in a timely manner and regularly inspect urban drainage facilities to ensure that they are able to respond and recover quickly in the event of flooding.
In terms of the sensitivity of the disaster-conceiving environment, Zhengzhou performs better than Hefei and Hangzhou City. Both Hefei and Hangzhou City perform poorly due to the low number of places of refuge (P4) which is also the most critical factor in the sensitivity of the disaster-conceiving environment. Shelter places play an important role in being able to respond to major disaster events, and the construction of shelter places is one of the important measures to improve the city’s ability to cope with sudden events. Shelter helps to protect people and minimize disaster losses, so these two cities should focus on the construction of disaster prevention infrastructure and scientifically increase the number of emergency shelter places. In response to extreme weather conditions (such as earthquakes, droughts, and floods) the planning and construction of emergency shelters to cope with different types of events is crucial. Cultural buildings, gymnasiums, parks, green spaces, plazas, schools, and playgrounds can all be converted and prepared for emergency shelters; while the functions of emergency shelters will be improved by promoting the integration of emergency shelter functions into new buildings, venues, and spaces. Emergency supplies should also be well stocked to meet the needs of emergency shelters in a timely manner.
From the point of view of susceptibility of disaster-bearing bodies, Zhengzhou City’s urbanization rate (P7) and population density (P8) perform poorly, while Hefei City’s degree of aging (P6) is also poor. Zhengzhou City’s urbanization rate is low, which hinders its economic development, and the city has a large resident population and a high population density. In the case of floods, the higher the population density, the greater the range of personnel affected by the disaster. Therefore, when Zhengzhou City faces flooding caused by heavy rainfall, it is necessary to evacuate the people in the areas most affected by the disaster in a timely manner, so as to reduce the damage and losses caused. As for the city of Hefei, the degree of aging is an important factor affecting the resilience of the city. The more elderly people in a city, the more people will be waiting for rescue in emergencies, which is likely to result in more casualties, and at the same time, it will also bring a lot of problems to society, such as hindering the development of the economy, and the supply of labor force, and so on. Therefore, with regard to the elderly population, the relevant authorities should take into account the actual situation, map out the basic situation of all elderly people in the community, and formulate a plan for the implementation of rescue and assistance, such as the establishment of community-based elderly service organizations.
In terms of vulnerability to disaster prevention and mitigation, Zhengzhou and Hangzhou are less resilient in terms of medical aid capacity (P10), which plays a very important role in the event of a disaster. In emergencies, time is life, and medical rescue teams need to be activated quickly to organize and dispatch rescue personnel and equipment in order to arrive at the disaster site as soon as possible. These two cities should strengthen their medical infrastructure in the future, expand their medical personnel construction teams, improve public health services, enhance their ability to respond quickly, establish a sound early warning mechanism, and establish close cooperation with relevant departments to strengthen the basic security for disaster prevention. Hefei ranks lowest among the three cities in terms of general public budget revenue and GDP, which represents the level of regional economic development, reflecting the level of regional economic resilience, and correlates with job growth and higher living standards, which is conducive to improving post-disaster resilience. Low general public budget revenue and GDP will affect the social security system during floods, thus affecting the region’s ability to prevent and mitigate disasters. Hefei’s GDP and general public budget revenue are not conducive to improving its ability to prevent and mitigate disasters, so it should steadily expand the scale of its investment in its future development; actively engage in investment promotion in an effort to develop its economy; strengthen the development of its infrastructure, create more employment opportunities for its people and strive to raise the income level of the population.
6. Discussion
This study proposes a novel modeling approach to quantify urban flood resilience, the D-AHP model, and applies the model to three Chinese cities using the VIKOR method, which in turn assesses the resilience of the three cities in the face of flooding. The D-AHP model was analyzed to derive the weights of the indicators. The three cities were analyzed and ranked using the VIKOR analysis, indicating that the D-AHP-VIKOR modeling approach is highly operational in such practical applications.
On the assessment framework of flood resilience, this study proposes a novel modeling method to quantify urban flood resilience, which is a major innovation of the article. Correctly identifying indicators is of great significance for flood resilience assessment, and in previous studies, most of the urban flood resilience assessment has been conducted to construct the indicator system from the dimensions of society, economy, environment, and ecology, which does not take into account the whole cycle of disaster occurrence. The assessment of urban flood resilience needs to take into account the entire cycle of natural disasters, including before the flood, when the flood occurs, and the entire stage of post-disaster recovery. This study proposes an assessment framework for flood resilience that takes into account the characteristics of the whole process of flood occurrence, constructs evaluation indicators based on the structure of the city system, adopts the D-AHP model, scores the importance of the indicators with the help of the knowledge and experience of experts to ensure that the results are more in line with the reality, and then quantitatively analyzes the flood resilience of the three cities with strong objectivity by using the VIKOR method. In fact, there are many factors affecting the assessment of flood resilience, and due to limitations, it is not possible to evaluate the many factors one by one, and only the factors with greater influence can be selected among the many factors to construct the indicator system, and in the future, there is a hope to form a unified set of flood resilience evaluation indicator system.
Second, Henan, Anhui, and Zhejiang provinces are adjacent to each other; Zhengzhou is located in the north-central part of Henan and in the middle and lower reaches of the Yellow River; Hefei is located in the central part of Anhui, between the Yangtze River and the Huaihe River; and Hangzhou is located in the northern part of Zhejiang, on the south-eastern coast of China, and on the southern flank of the Yangtze River delta. These areas have high vulnerability and flood risk, and the three cities are located within different watersheds. In this case, these three regional cities are selected as research objects, and the flood resilience of these three regions is further studied to analyze the flood resilience influencing factors, so that the results have more accuracy and objectivity. In addition, the initial data of D-number theory and AHP in this study come from the opinions of the expert group, which makes the evaluation results more in line with the actual situation. Moreover, the VIKOR method was applied to the evaluation of flood resilience of three cities by utilizing the statistical almanac data, which made the evaluation results of the comprehensive evaluation model more reliable.
The results of the study show that the sensitivity of the disaster-conceiving environment has a profound impact on flood prevention and mitigation, and that the risk of the disaster-causing factors also affects the level of flood resilience to a great extent. In terms of weighting, the number of shelters and the average annual rainfall are critical factors. In general, most urban floods are caused by heavy rainfall [
54]. In 2021, Zhengzhou City had the highest average annual rainfall and therefore caused the most damage, which is consistent with the study results. Vulnerability reflects the ability of people to cope with such events. The number of shelters can effectively avoid casualties and reduce disaster losses. To address these issues, the three cities need to monitor and forecast heavy rainfall, expand green areas, protect ecosystems, and regularly inspect urban waterproofing and drainage infrastructures to ensure that they can respond and recover quickly in the event of flooding. Attention also needs to be paid to specific areas of the city that are prone to flooding, such as rivers and estuaries, which tend to collect large amounts of water; areas around lakes and reservoirs are also susceptible to flooding. Especially in Zhejiang Province, which is near the sea, meteorological disasters such as typhoons and hurricanes may trigger a surge of seawater, and low-lying areas are more susceptible to the combined effects of seawater and rainfall. With regard to the number of evacuation sites, emphasis should be placed on the construction of disaster prevention infrastructure, increasing the number of emergency evacuation sites in a scientific manner, and improving the functions and facilities of emergency evacuation sites. Do a good job of stockpiling emergency supplies to respond to the needs of evacuation in a timely manner. From the results of the study, the improvement of the flood resilience of the three cities needs to be based on the main influencing factors of urban development, tailored to the local conditions, to develop measures to improve the resilience of urban flooding, to strengthen the construction and maintenance of the urban drainage system, to improve the city’s flood control capacity, and to further strengthen the preventive measures to cope with the possible future heavy rainfall weather. In the future, it will be possible to build more complete urban drainage systems to reduce the impact of flooding and protect the lives and properties of citizens.
Despite these important findings, this study has some shortcomings that need to be recognized. There are some limitations in the indicators selected for this study, and in the future, we can consider constructing a more comprehensive indicator system in more aspects to enhance the reliability of the results; this study utilized expert scoring to obtain the initial data, and when there is disagreement among the expert group, only the generally accepted and valid data are retained, which may lead to some inaccuracies; in the construction of the model, the combination of the D-number theory and the AHP method, although the D-number theory eliminates the subjective influence of AHP, it cannot be avoided completely, the next step can be taken to explore the form of combining with objective methods, such as TOPSIS method combination. These issues need to be further strengthened and improved through further research, a variety of data support, and the use of a variety of methods is the next step in the direction of efforts.


