
Evaluating the Human–Water Relationship over the Past Two Decades Using the SMI-P Method across Nine Provinces along the Yellow River, China

Abstract
:1. Introduction
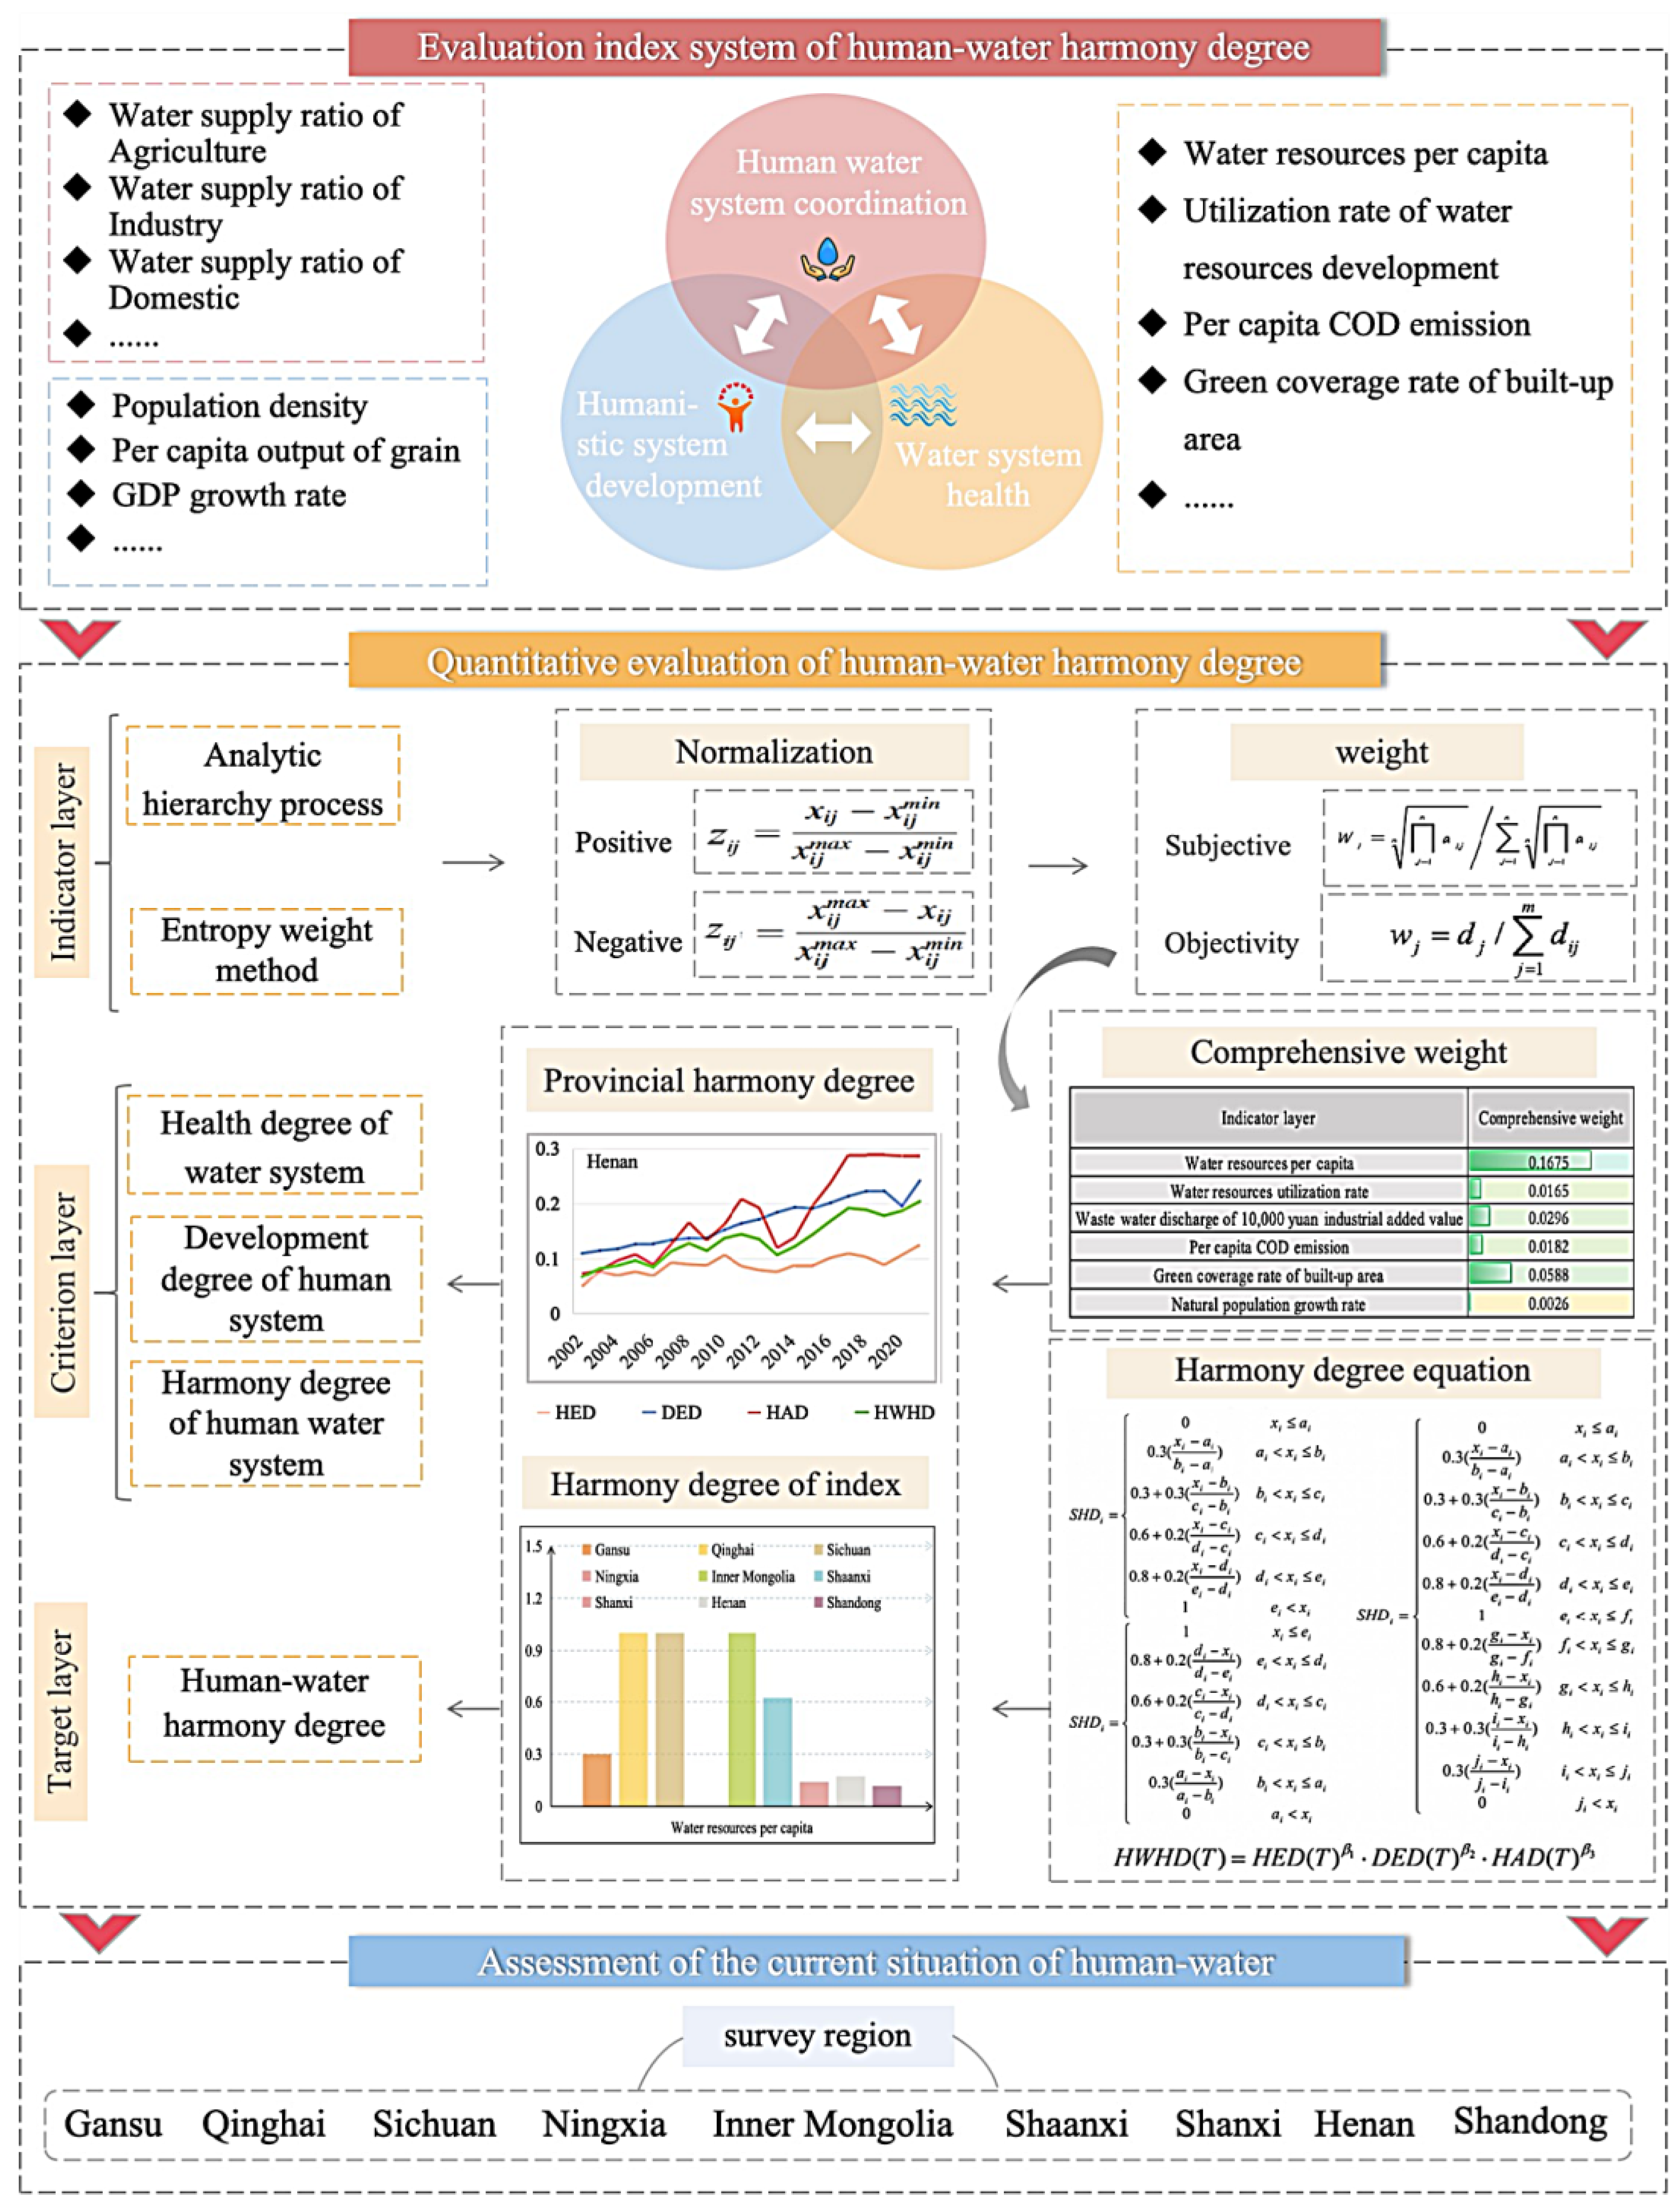
2. Methods
2.1. Calculation of Comprehensive Weight
2.2. Calculation of HWHD
3. Case Study
4. Results
4.1. Result of Weight
4.2. Temporal Variation of HWHD

| Indicator Layer | Subjective Weight | Objective Weight | Comprehensive Weight |
|---|---|---|---|
| Water resources per capita | 0.0238 | 0.1859 | 0.1675 |
| Water resources utilization rate | 0.1190 | 0.0037 | 0.0165 |
| Waste water discharge per CNY 10,000 of industrial added value | 0.1071 | 0.0073 | 0.0296 |
| Per capita COD emission | 0.0357 | 0.0135 | 0.0182 |
| Green coverage rate of built-up area | 0.1429 | 0.0109 | 0.0588 |
| Natural population growth rate | 0.0039 | 0.0178 | 0.0026 |
| Urbanization rate | 0.0317 | 0.0216 | 0.0259 |
| population density | 0.0025 | 0.0339 | 0.0033 |
| Proportion of employees in the tertiary industry | 0.0051 | 0.0294 | 0.0057 |
| Engel’s coefficient for urban residents | 0.0204 | 0.0139 | 0.0107 |
| Per capita disposable income of urban residents | 0.0089 | 0.0586 | 0.0197 |
| Per capita disposable income of rural residents | 0.0089 | 0.0634 | 0.0214 |
| Per capita grain yields | 0.0143 | 0.0550 | 0.0298 |
| Per capita comprehensive water consumption | 0.0470 | 0.0142 | 0.0252 |
| Per capita GDP | 0.0145 | 0.0536 | 0.0294 |
| Per capita fiscal revenue | 0.0243 | 0.0634 | 0.0584 |
| Per capita total social fixed asset investment | 0.0131 | 0.0674 | 0.0335 |
| Proportion of output value of tertiary industry in GDP | 0.0183 | 0.0288 | 0.0199 |
| GDP growth rate | 0.0504 | 0.0206 | 0.0392 |
| Growth rate of output value of tertiary industry | 0.0223 | 0.0033 | 0.0028 |
| Water consumption per CNY 10,000 of GDP | 0.0251 | 0.0047 | 0.0045 |
| Water consumption per CNY 10,000 of industrial added output | 0.0381 | 0.0047 | 0.0067 |
| Irrigation water per mu of farmland | 0.0089 | 0.0116 | 0.0039 |
| Reuse rate of urban industrial water | 0.0138 | 0.0135 | 0.0071 |
| College students per 10,000 people | 0.0570 | 0.0288 | 0.0621 |
| Water supply ratio of agriculture | 0.0168 | 0.0237 | 0.0151 |
| Water supply ratio of industry | 0.0079 | 0.0395 | 0.0117 |
| Water supply ratio of domestic | 0.0376 | 0.0348 | 0.0496 |
| Water supply ratio of ecology | 0.0805 | 0.0725 | 0.2209 |
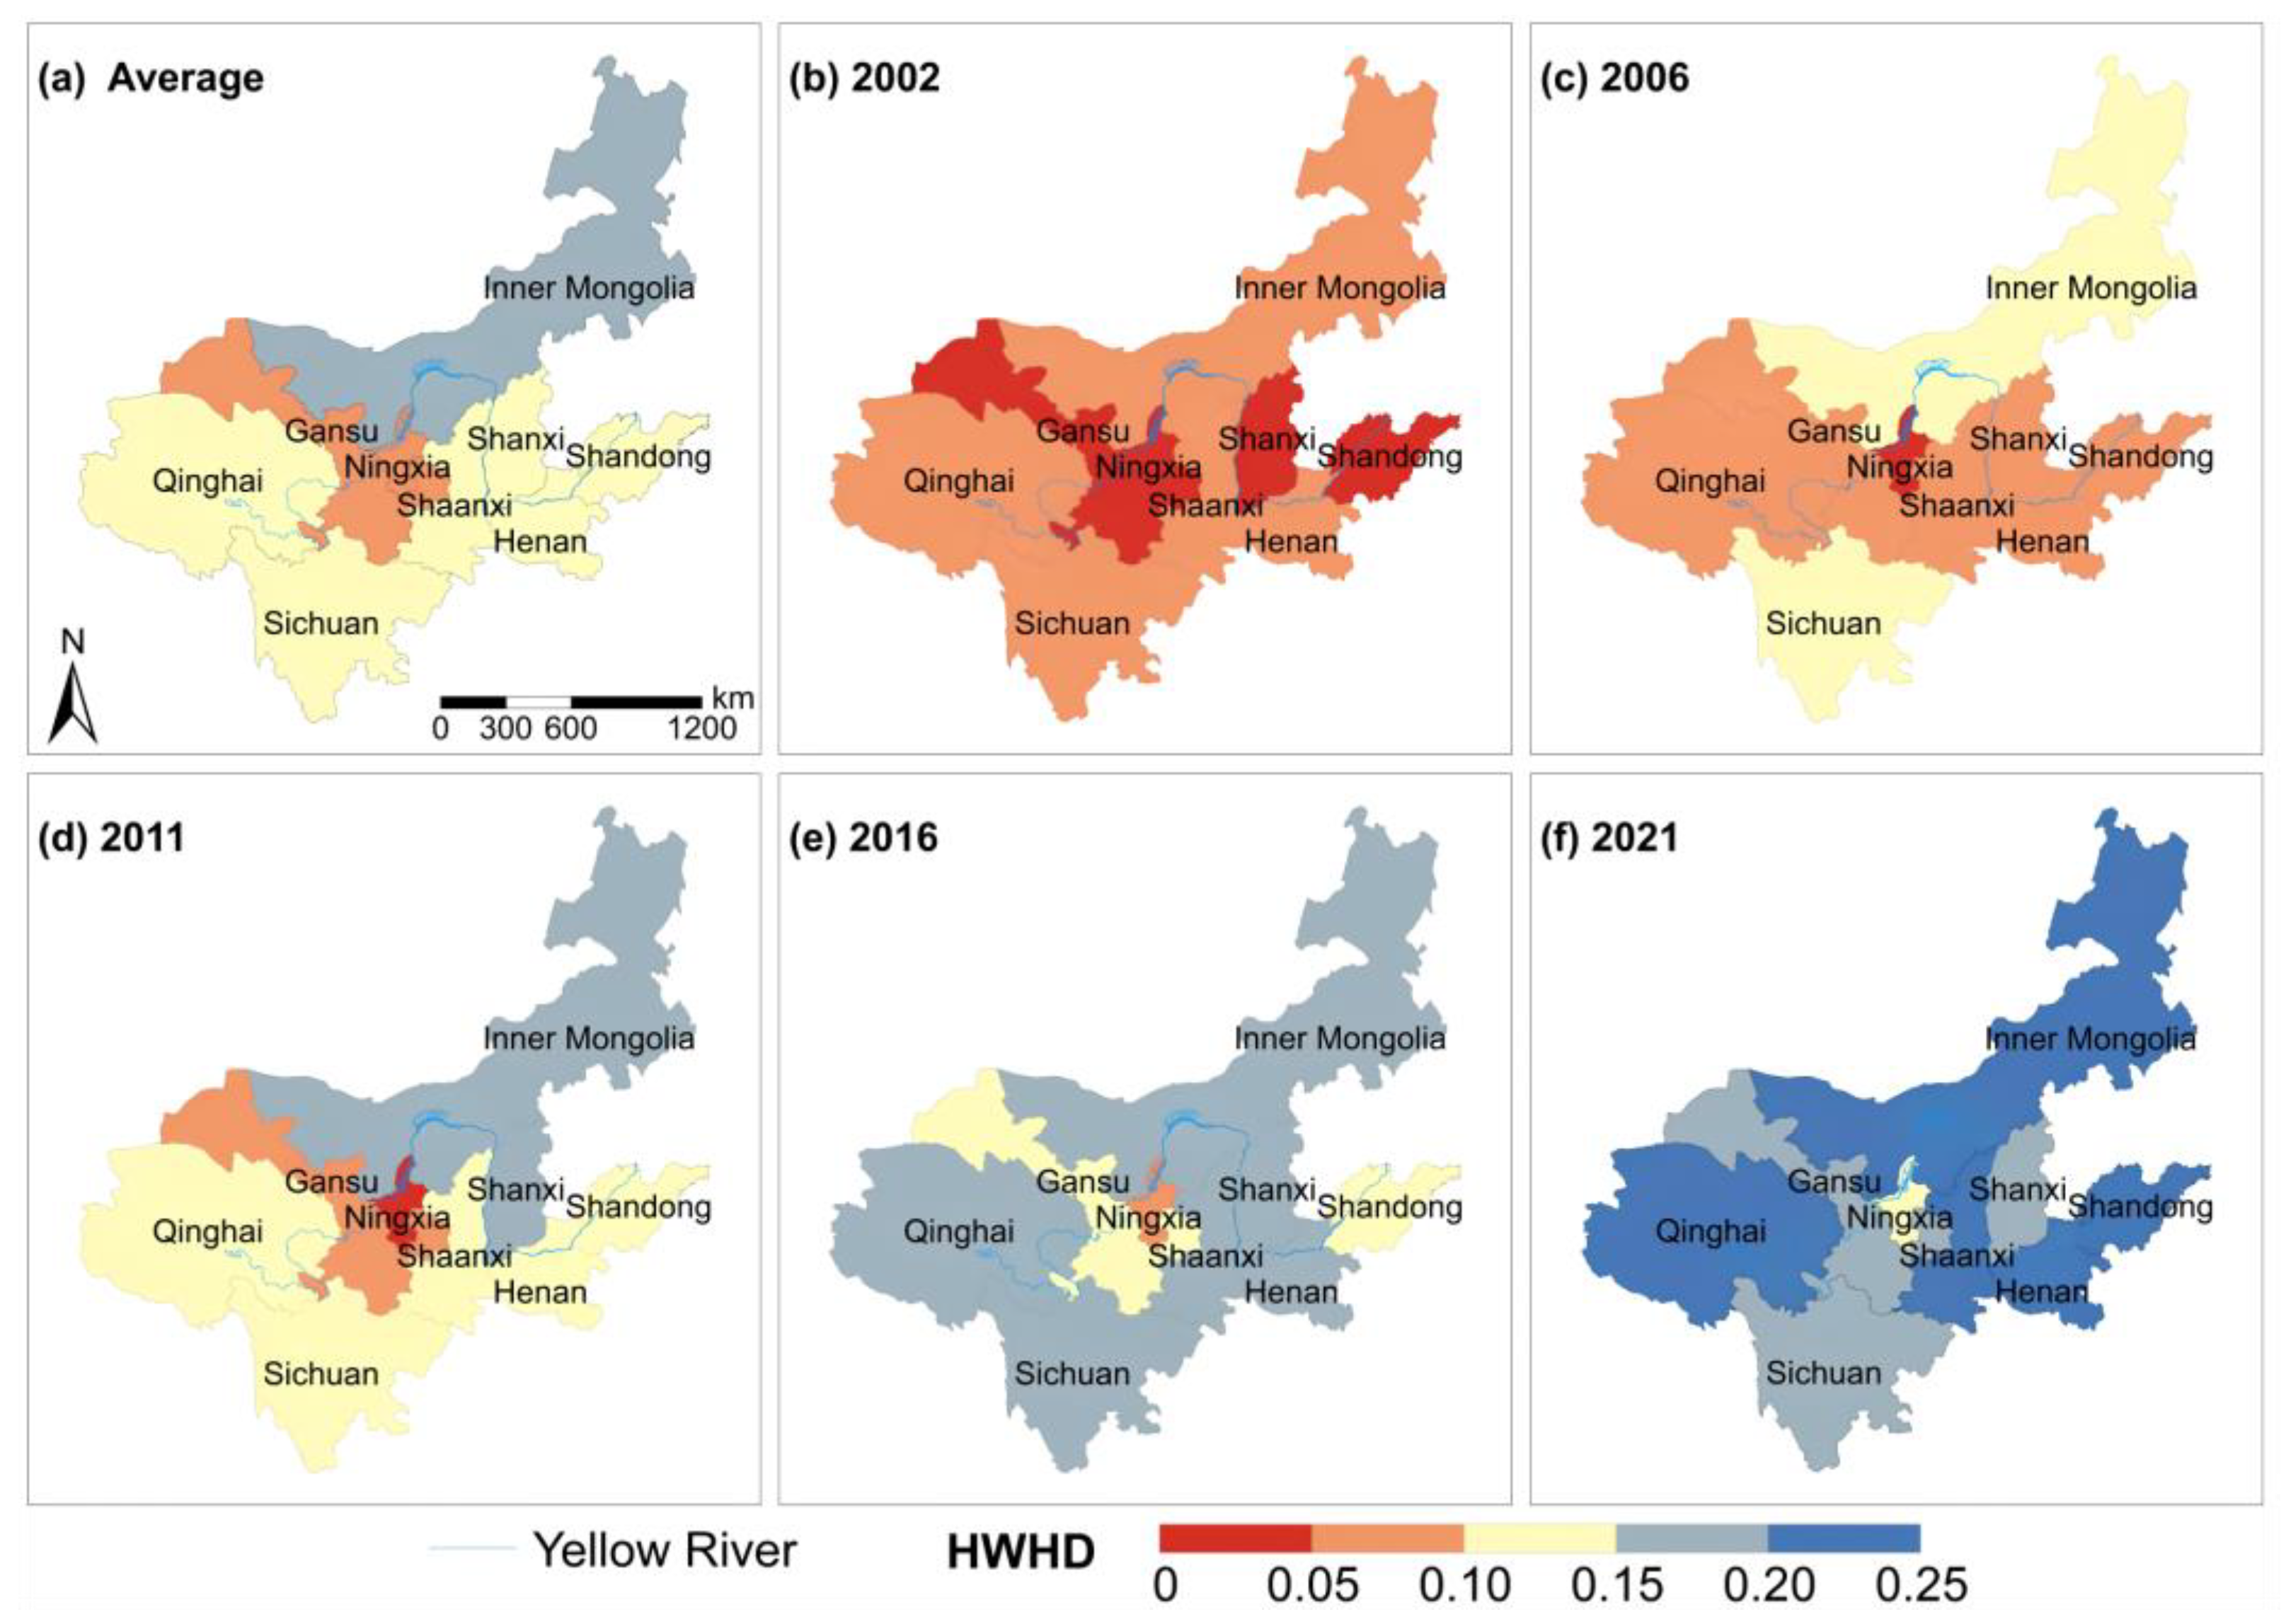
4.3. Spatial Variation of HWHD
4.4. The Evaluation Results of Three Subsystems
5. Discussion
6. Conclusions and Limitations
Author Contributions
Funding
Data Availability Statement
Conflicts of Interest
References
- Vörösmarty, C.J.; McIntyre, P.B.; Gessner, M.O.; Dudgeon, D.; Prusevich, A.; Green, P.; Glidden, S.; Bunn, S.E.; Sullivan, C.A.; Liermann, C.R.; et al. Global threats to human water security and river biodiversity. Nature 2010, 467, 555–561. [Google Scholar] [CrossRef]
- Mehta, L. Water and human development. World Dev. 2014, 59, 59–69. [Google Scholar] [CrossRef]
- Oki, T.; Kanae, S. Global hydrological cycles and world water resources. Science 2006, 313, 1068–1072. Available online: http://webofscience.clarivate.cn.libproxy.v.zzu.edu.cn/wos/alldb/full−record/INSPEC:13105253 (accessed on 30 December 2023). [CrossRef]
- Srinivasan, V.; Lambin, E.F.; Gorelick, S.M.; Thompson, B.H.; Rozelle, S. The nature and causes of the global water crisis: Syndromes from a meta−analysis of coupled human−water studies. Water Resour. Res. 2012, 48, W10516. [Google Scholar] [CrossRef]
- He, C.; Liu, Z.; Wu, J.; Pan, X.; Fang, Z.; Li, J.; Bryan, B.A. Future global urban water scarcity and potential solutions. Nat. Commun. 2021, 12, 4667. [Google Scholar] [CrossRef]
- Boulange, J.; Hanasaki, N.; Yamazaki, D.; Pokhrel, Y. Role of dams in reducing global flood exposure under climate change. Nat. Commun. 2021, 12, 417. [Google Scholar] [CrossRef]
- Nerubasska, A.; Palshkov, K.; Maksymchuk, B. A systemic philosophical analysis of the contemporary society and the human: New potential. Postmod. Open. 2020, 11, 275–292. [Google Scholar] [CrossRef]
- Zhou, A.; Zhang, Y.; Xie, S.; Chen, Y.; Li, X.; Wang, J.; Zou, J. Microplastics and their potential effects on the aquaculture systems: A critical review. Rev. Aquac. 2021, 13, 719–733. [Google Scholar] [CrossRef]
- Yoo, C.; Jun, C.; Zhu, J.; Na, W. Evaluation of Dam Water−Supply Capacity in Korea Using the Water−Shortage Index. Water 2021, 13, 956. [Google Scholar] [CrossRef]
- Schlosser, C.A.; Strzepek, K.; Gao, X.; Fant, C.; Blanc, É.; Paltsev, S.; Jacoby, H.; Reilly, J.; Gueneau, A. The future of global water stress: An integrated assessment. Earth’s Future 2014, 2, 341–361. [Google Scholar] [CrossRef]
- Mathias, J.M.; Thomas, R.B. Global tree intrinsic water use efficiency is enhanced by increased atmospheric CO2 and modulated by climate and plant functional types. Proc. Natl. Acad. Sci. USA 2021, 118, e2014286118. [Google Scholar] [CrossRef]
- Yu, L.; Gao, X.; Zhao, X. Global synthesis of the impact of droughts on crops’ water−use efficiency (WUE): Towards both high WUE and productivity. Agric. Syst. 2020, 177, 102723. [Google Scholar] [CrossRef]
- Garriga, R.G.; Foguet, A.P. Improved method to calculate a water poverty index at local scale. J. Environ. Eng. 2010, 136, 1287–1298. [Google Scholar] [CrossRef]
- Ladi, T.; Mahmoudpour, A.; Sharifi, A. Assessing impacts of the water poverty index components on the human development index in Iran. Habitat Int. 2021, 113, 102375. [Google Scholar] [CrossRef]
- Jia, Z.; Cai, Y.; Chen, Y.; Zeng, W. Regionalization of water environmental carrying capacity for supporting the sustainable water resources management and development in China. Resour. Conserv. Recycl. 2018, 134, 282–293. [Google Scholar] [CrossRef]
- Assefa, Y.T.; Babel, M.S.; Sušnik, J.; Shinde, V.R. Development of a generic domestic water security index, and its application in Addis Ababa, Ethiopia. Water 2018, 11, 37. [Google Scholar] [CrossRef]
- Ding, Y.; Tang, D.; Dai, H.; Wei, Y. Human−water harmony index: A new approach to assess the human water relationship. Water Resour. Manag. 2014, 28, 1061–1077. [Google Scholar] [CrossRef]
- Zuo, Q.; Diao, Y.; Hao, L.; Han, C. Comprehensive evaluation of the human−water harmony relationship in countries along the “belt and road”. Water Resour. Manag. 2020, 34, 4019–4035. [Google Scholar] [CrossRef]
- Zhou, Y.; Zou, S.; Duan, W.; Chen, Y.; Takara, K.; Di, Y. Analysis of energy carbon emissions from agroecosystems in Tarim River Basin, China: A pathway to achieve carbon neutrality. Appl. Energy 2022, 325, 119842. Available online: http://www.sciencedirect.com.libproxy.v.zzu.edu.cn/science/article/pii/S0306261922011114 (accessed on 30 December 2023). [CrossRef]
- Zhang, J.; Tang, D.; Wang, M.; Ahamd, I.; Hu, J.; Meng, Z.; Pan, S. A Regional Water Resource Allocation Model Based on the Human–Water Harmony Theory in the Yellow River Basin. Water 2023, 15, 1388. [Google Scholar] [CrossRef]
- Shi, Y.; Yang, S.; Chen, W.; Wang, X.; Feng, C. Research on the construction of a human−water harmony model in the Yellow River Basin. Water Policy 2023, 25, 742–757. [Google Scholar] [CrossRef]
- Ahmad, I.; Waseem, M.; Lei, H.; Yang, H.; Yang, D. Harmonious level indexing for ascertaining human–water relationships. Environ. Earth Sci. 2018, 77, 125. [Google Scholar] [CrossRef]
- Yin, L.; Feng, X.; Fu, B.; Wang, S.; Wang, X.; Chen, Y.; Tao, F.; Hu, J. A coupled human−natural system analysis of water yield in the Yellow River basin, China. Sci. Total Environ. 2021, 762, 143141. [Google Scholar] [CrossRef]
- Zuo, Q.; Zhang, Z.; Ma, J.; Li, J. Solutions to Difficult Problems Caused by the Complexity of Human–Water Relationship in the Yellow River Basin: Based on the Perspective of Human–Water Relationship Discipline. Water 2022, 14, 2868. [Google Scholar] [CrossRef]
- Xie, P.; Zhuo, L.; Yang, X.; Huang, H.; Gao, X.; Wu, P. Spatial−temporal variations in blue and green water resources, water footprints and water scarcities in a large river basin: A case for the Yellow River basin. J. Hydrol. 2020, 590, 125222. [Google Scholar] [CrossRef]
- Liu, S.; Zhao, L. Development and synergetic evolution of the water–energy–food nexus system in the Yellow River Basin. Environ. Sci. Pollut. Res. 2022, 29, 65549–65564. [Google Scholar] [CrossRef]
- Shannon, C.E. A mathematical theory of communication. Bell Syst. Tech. J. 1948, 27, 379–423. Available online: https://ieeexplore.ieee.org/document/6773024 (accessed on 30 December 2023). [CrossRef]
- Saaty, T.L. A scaling method for priorities in hierarchical structures. J. Math. Psychol 1977, 15, 234–281. [Google Scholar] [CrossRef]
- Ma, Y.; Shi, T.; Zhang, W.; Hao, Y.; Hung, J.; Lin, Y. Comprehensive policy evaluation of NEV development in China, Japan, the United States, and Germany based on the AHP−EW model. J. Clean. Prod. 2019, 214, 389–402. Available online: http://www.sciencedirect.com.libproxy.v.zzu.edu.cn/science/article/pii/S0959652618338277 (accessed on 30 December 2023). [CrossRef]
- Zuo, Q.; Zhang, Y.; Lin, P. Index system and quantification method for human−water harmony. J. Hydraul. Eng. 2008, 39, 440–447. Available online: http://webofscience.clarivate.cn.libproxy.v.zzu.edu.cn/wos/alldb/full−record/CSCD:3287618 (accessed on 30 December 2023).
- Zuo, Q.; Zhao, H.; Mao, C.; Ma, J.; Cui, G. Quantitative Analysis of Human−Water Relationships and Harmony−Based Regulation in the Tarim River Basin. J. Hydrol. Eng. 2015, 20, 1–11. [Google Scholar] [CrossRef]


| Criterion Layer | Classification Layer | Indicator Layer | Unit | Criterion Attribute | Worst Value | Difference Value | Pass Value | Optimal Value | Optimal Value |
|---|---|---|---|---|---|---|---|---|---|
| Health degree of water system | Water resources subsystem | Water resources per capita | Person | Positive | 130 | 1115 | 2100 | 2600 | 3100 |
| Water resources utilization rate | % | Negative | 100 | 80 | 60 | 42 | 24 | ||
| Water environment subsystem | Waste water discharge per CNY 10,000 of industrial added value | Ton | Negative | 80 | 53 | 26 | 20 | 14 | |
| Per capita COD emission | Ton | Negative | 0.04 | 0.03 | 0.02 | 0.011 | 0.002 | ||
| Water ecological subsystem | Green coverage rate of built-up area | % | Positive | 29 | 32 | 35 | 40 | 45 | |
| Development degree of human system | Social development subsystem | Natural population growth rate | ‰ | Negative | 10 | 8 | 6 | 4 | 2 |
| Urbanization rate | % | Positive | 37 | 43.5 | 50 | 65 | 80 | ||
| population density | Person/km2 | Negative | 4000 | 2300 | 650 | 400 | 148 | ||
| Proportion of employees in the tertiary industry | % | Positive | 20 | 34 | 48 | 59 | 70 | ||
| Engel’s coefficient for urban residents | % | Negative | 60 | 55 | 50 | 40 | 30 | ||
| Per capita disposable income of urban residents | Yuan | Positive | 7700 | 16,350 | 25,000 | 62,500 | 100,000 | ||
| Per capita disposable income of rural residents | Yuan | Positive | 2500 | 5650 | 8800 | 26,900 | 45,000 | ||
| Per capita grain yields | Kilogram | Positive | 14 | 232 | 450 | 1225 | 2000 | ||
| Per capita comprehensive water consumption | m3 | Negative | 800 | 610 | 420 | 290 | 160 | ||
| Economic development Subsystem | Per capita GDP | Yuan | Positive | 39,000 | 60,000 | 81,000 | 190,500 | 300,000 | |
| Per capita fiscal revenue | Yuan | Positive | 3500 | 8750 | 14,000 | 19,500 | 25,000 | ||
| Per capita total social fixed asset investment | Yuan | Positive | 17,000 | 68,500 | 120,000 | 1,060,000 | 2,000,000 | ||
| Proportion of output value of tertiary industry in GDP | % | Positive | 20 | 32.5 | 45 | 57.5 | 70 | ||
| GDP growth rate | % | Positive | 2 | 3.5 | 5 | 7 | 9 | ||
| Growth rate of output value of tertiary industry | % | Positive | 7 | 9 | 11 | 12 | 13 | ||
| Science and technology development subsystem | Water consumption per CNY 10,000 of GDP | m3 | Negative | 450 | 250 | 50 | 30 | 10 | |
| Water consumption per CNY 10,000 of industrial added output | m3 | Negative | 65 | 47 | 28 | 17 | 5 | ||
| Irrigation water per mu of farmland | Cubic meter | Negative | 450 | 400 | 350 | 245 | 140 | ||
| Reuse rate of urban industrial water | % | Positive | 22 | 55 | 88 | 93 | 98 | ||
| College students per 10,000 people | Person | Positive | 32 | 181 | 330 | 415 | 500 | ||
| Harmony degree of human water system | Water supply subsystem | Water supply ratio of Agriculture | % | Negative | 91 | 77 | 63 | 46.5 | 30 |
| Water supply ratio of Industry | % | Positive | 3 | 11.5 | 20 | 32.5 | 45 | ||
| Water supply ratio of Domestic | % | Positive | 5 | 9 | 13 | 15 | 17 | ||
| Water supply ratio of Ecology | % | Positive | 1 | 2.5 | 4 | 6 | 8 |
Disclaimer/Publisher’s Note: The statements, opinions and data contained in all publications are solely those of the individual author(s) and contributor(s) and not of MDPI and/or the editor(s). MDPI and/or the editor(s) disclaim responsibility for any injury to people or property resulting from any ideas, methods, instructions or products referred to in the content. |
© 2024 by the authors. Licensee MDPI, Basel, Switzerland. This article is an open access article distributed under the terms and conditions of the Creative Commons Attribution (CC BY) license (https://creativecommons.org/licenses/by/4.0/).
Share and Cite
Liu, L.; He, L.; Zuo, Q. Evaluating the Human–Water Relationship over the Past Two Decades Using the SMI-P Method across Nine Provinces along the Yellow River, China. Water 2024, 16, 916. https://doi.org/10.3390/w16070916
Liu L, He L, Zuo Q. Evaluating the Human–Water Relationship over the Past Two Decades Using the SMI-P Method across Nine Provinces along the Yellow River, China. Water. 2024; 16(7):916. https://doi.org/10.3390/w16070916
Chicago/Turabian StyleLiu, Lu, Liuyue He, and Qiting Zuo. 2024. "Evaluating the Human–Water Relationship over the Past Two Decades Using the SMI-P Method across Nine Provinces along the Yellow River, China" Water 16, no. 7: 916. https://doi.org/10.3390/w16070916