Article

An Ecology-Oriented Single–Multi-Objective Optimal Operation Modeling and Decision-Making Method in the Case of the Ganjiang River

1
School of Civil and Hydraulic Engineering, Huazhong University of Science and Technology, Wuhan 430074, China
2
Hubei Key Laboratory of Digital River Basin Science and Technology, Huazhong University of Science and Technology, Wuhan 430074, China
3
Institute of Water Resources and Hydropower, Huazhong University of Science and Technology, Wuhan 430074, China
*
Author to whom correspondence should be addressed.
Water 2024, 16(7), 970; https://doi.org/10.3390/w16070970
Submission received: 26 February 2024 / Revised: 22 March 2024 / Accepted: 23 March 2024 / Published: 27 March 2024
(This article belongs to the Section Hydrology)

Abstract

:
Hydro power has provided significant economic benefits to society due to its cleanliness and convenience. As the number of hydropower stations has increased, many serious ecological issues have also emerged. This study uses Wan’an Reservoir as its research object and investigates single–multi-objective optimal operation and decision-making regarding reservoirs for ecology-oriented operation, to meet ecological water demand and seek the optimal operation schemes for energy generation and ecological benefits. The full-process research is conducted based on the “objective-modeling constraint optimization scheme decision-making” framework. The Mann–Kendall test and ordered clustering method were used to diagnose the hydrological variation in the basin. Based on this, a hierarchical and phased ecological flow process was derived. The objectives were defined according to the flow process, and optimal operation models were constructed. The differential evolution algorithm (DE) and improved non-dominated sorting genetic algorithm-II (NSGA-II) were used to solve the models. A non-fitting curve method was used to determine the approximate inflection point of the Pareto front curve, and the curve was fitted linearly according to the approximate inflection point to obtain the conversion formula between the objectives. Based on the coefficient of variation and Mahalanobis distance, a new multi-attribute decision-making method for reservoir operation, CV-ITOPSIS, was constructed by improving the traditional TOPSIS. The results show that: (1) There is a piecewise linear contradiction between energy generation and ecological objectives, and the contradiction intensifies with an increase in incoming water frequency. (2) Before the approximate inflection point, the head significantly influences the conversion rate from the energy generation to ecology, while the discharge flow is the major influencing factor after the inflection point. The inflection point and the formula for the piecewise straight line can reveal the conversion law between the two objectives. (3) CV-ITOPSIS considers the degree of differentiation of index data and fully considers the correlation between indicators while retaining the good evaluation performance of the traditional method. It recommends the optimal benefit scheme for a multi-objective non-inferior solution set. The research results provide a theoretical foundation and decision support for the optimal ecological operation of the Ganjiang River Basin.

1. Introduction

Clean energy is becoming increasingly important in China’s power system, owing to the vigorous development of the “National Energy Security Strategy” and the “Carbon Neutrality” goal. As a clean energy source that can be efficiently regulated, hydropower has low development, operation, and maintenance costs and can replace fossil fuel energy without polluting the environment. Simultaneously, hydropower energy can flexibly and quickly adjust its peak and frequency according to the power demand. It compensates for the intermittency and fluctuation problems of new energy sources such as wind and solar energy and improves power grid stability. However, the development, construction, and operation of cascade reservoirs in basins have led to negative ecological impacts, such as reduced biodiversity in downstream river channels [1], reduced river connectivity [2], deterioration of water quality [3], and eutrophication [4]. Many reservoirs aim to maximize economic benefits [5], which destroys the flow characteristics that maintain river ecological stability to a certain extent and accelerates the degradation of river ecological functions.
The demand for ecological operations is increasing with the advancement of ecological civilization construction. The quantification of ecological flow is the premise and foundation of reservoir ecological operations [6]. At present, more than 200 kinds of ecological flow calculation methods [7] have been put forward at home and abroad, including hydrological, hydraulic, habitat simulation, and overall comprehensive analysis methods. These mainly include the Tennant method [8], 7Q10 method [9], wet perimeter method [10], base-flow ratio method [11], and improved methods. Some scholars have also studied ecological flow from the perspective of water temperature, critical water depth [12], and the life cycle of target species [13]. Runoff is a typical hydrological process characterized by certainty and randomness. Although ecological flow has obvious statistical characteristics, there should be a suitable range of changes. Moreover, considering the differences in the seasonal distribution of runoff during the year, most of the ecological flow calculation methods are not reasonable according to the annual unified guarantee rate. Secondly, on the lower limit threshold, the setting of the lower limit of ecological flow should be based on the low flow data in the dry season [14]. The original sequence characteristics are the foundation for ecological flow calculations. To avoid the impact of hydrological variations on the results, a variation diagnosis link was added to the calculation to ensure consistency in the hydrological sequence before and after the period [15].
To maximize the economic benefits of reservoirs, early operation studies typically focused on single objectives, such as energy generation [16], flood control [17], or irrigation [18]. Although this single-objective optimization method is simple and feasible, it cannot fully reflect the comprehensive benefits of the reservoir and cannot meet the needs of multiple stakeholders. Water resource management faces complex and diverse challenges with the development of an economic society and the requirements of a low-carbon society. Therefore, the single-objective optimization method can no longer meet the actual requirements of reservoir operation. Multi-objective optimization has gradually become the mainstream research direction for solving reservoir operation problems. The transformation from single-objective to multi-objective research is necessary to develop water resources and fully improve comprehensive reservoir benefits. There are typically two solutions for the multi-objective optimal operation of reservoirs: (1) Analyze the competition and coordination of objectives to achieve the transformation from a multi-objective problem to a single-objective problem, such as the main objective method [19], comprehensive index method [20], and comprehensive evaluation method [21]. (2) Adopt multi-objective evolutionary algorithms. Current research in this field mainly focuses on innovations in algorithm coupling [22], feasible search space [23], reference points [24], cloud models [25], and other aspects. In addition, some scholars innovate from the perspective of mechanisms. Bai et al. [26] proposed an innovative method that combined parallel mechanisms with optimization algorithms to analyze the optimal operating state and conversion law between the three objectives of power generation, irrigation, and ecology in the Heihe River Basin. Afshar et al. [27] proposed a parallel cellular automaton algorithm to solve the power generation–water supply operation problem of a single reservoir. Most research has focused on modeling and solving methods for multi-objective problems.
However, as a part of multi-objective problems, the decision-making problem of a non-inferior solution set is often ignored. How to find the most ideal or comprehensive solution from a set of non-inferior solutions is a widely studied problem. Previous research on multi-attribute decision-making has mainly focused on determining weights [28]. Researchers typically use the entropy weight method [29], analytic hierarchy process [30], fuzzy theory [31], multivariate statistical analysis [32], artificial neural networks [33], and other methods to solve problems. Some researchers have attempted to bypass the influence of these subjective factors. Wu et al. [34] introduced the concept of the marginal rate of transformation (MRT) in economics. They considered flood control and power generation to be two products of reservoirs and established a multi-objective optimal operation and scheme decision model to determine the water level scheme with the highest comprehensive benefit. Wei et al. [35] used the Golden Gorge as the research object and developed a coupling algorithm of NSGA-II (non-dominated sorting genetic algorithm-II) and SEABODE (successive elimination of alternative schemes based on the k-order and p-degree of efficiency) to solve the problem of multi-objective optimization and multi-attribute decision-making for reservoir operation (MODRO), which avoided the subjective factors of decision-makers and improved the comprehensive benefits of the reservoir. Among these typical solutions, the technique for order preference by similarity to an ideal solution (TOPSIS) is widely used in multi-attribute decision-making problems because of its simple operation and high comprehensibility. However, the traditional TOPSIS method does not consider the correlation between decision indicators or the impact of overlapping information between indicators on the decision-making processes [36]. Traditional methods use the entropy weight method to assign weights to decision indicators, which can easily cause unreasonable weight allocation in cases of strong correlations or different dimensions between indicators [32]. Considering the complexity of the objective world, an inevitable correlation exists between the indicators of the decision-making object. Therefore, adopting reasonable and applicable decision-making methods in reservoir operation schemes is of great practical significance.
In this study, an improved technique for order preference by similarity to an ideal solution method based on the coefficient of variation (CV-ITOPSIS) is proposed, which can effectively solve the problem of correlation between indicators. Taking the middle and lower reaches of the Ganjiang River as an example, the hierarchical and phased ecological flow process was first obtained using various ecological flow calculation methods based on the diagnosis of hydrological variation. Based on this, two single-objective optimal operation models with one maximizing energy generation and the other maximizing ecological guarantee degree, and a multi-objective model maximizing both were established. Second, the DE (differential evolution) algorithm [37,38] and improved NSGA-II [26,39] were used to solve the single- and multi-objective models, respectively. A non-fitting curve method was used to determine the approximate inflection point of the Pareto front curve, and the curve was fitted linearly according to the approximate inflection point to obtain the conversion formula between the objectives. Finally, the CV-ITOPSIS method was used to study the decision-making problem of multi-objective scheduling with non-inferior solution sets, providing a reference for actual operational decision-making in the Ganjiang River Basin.

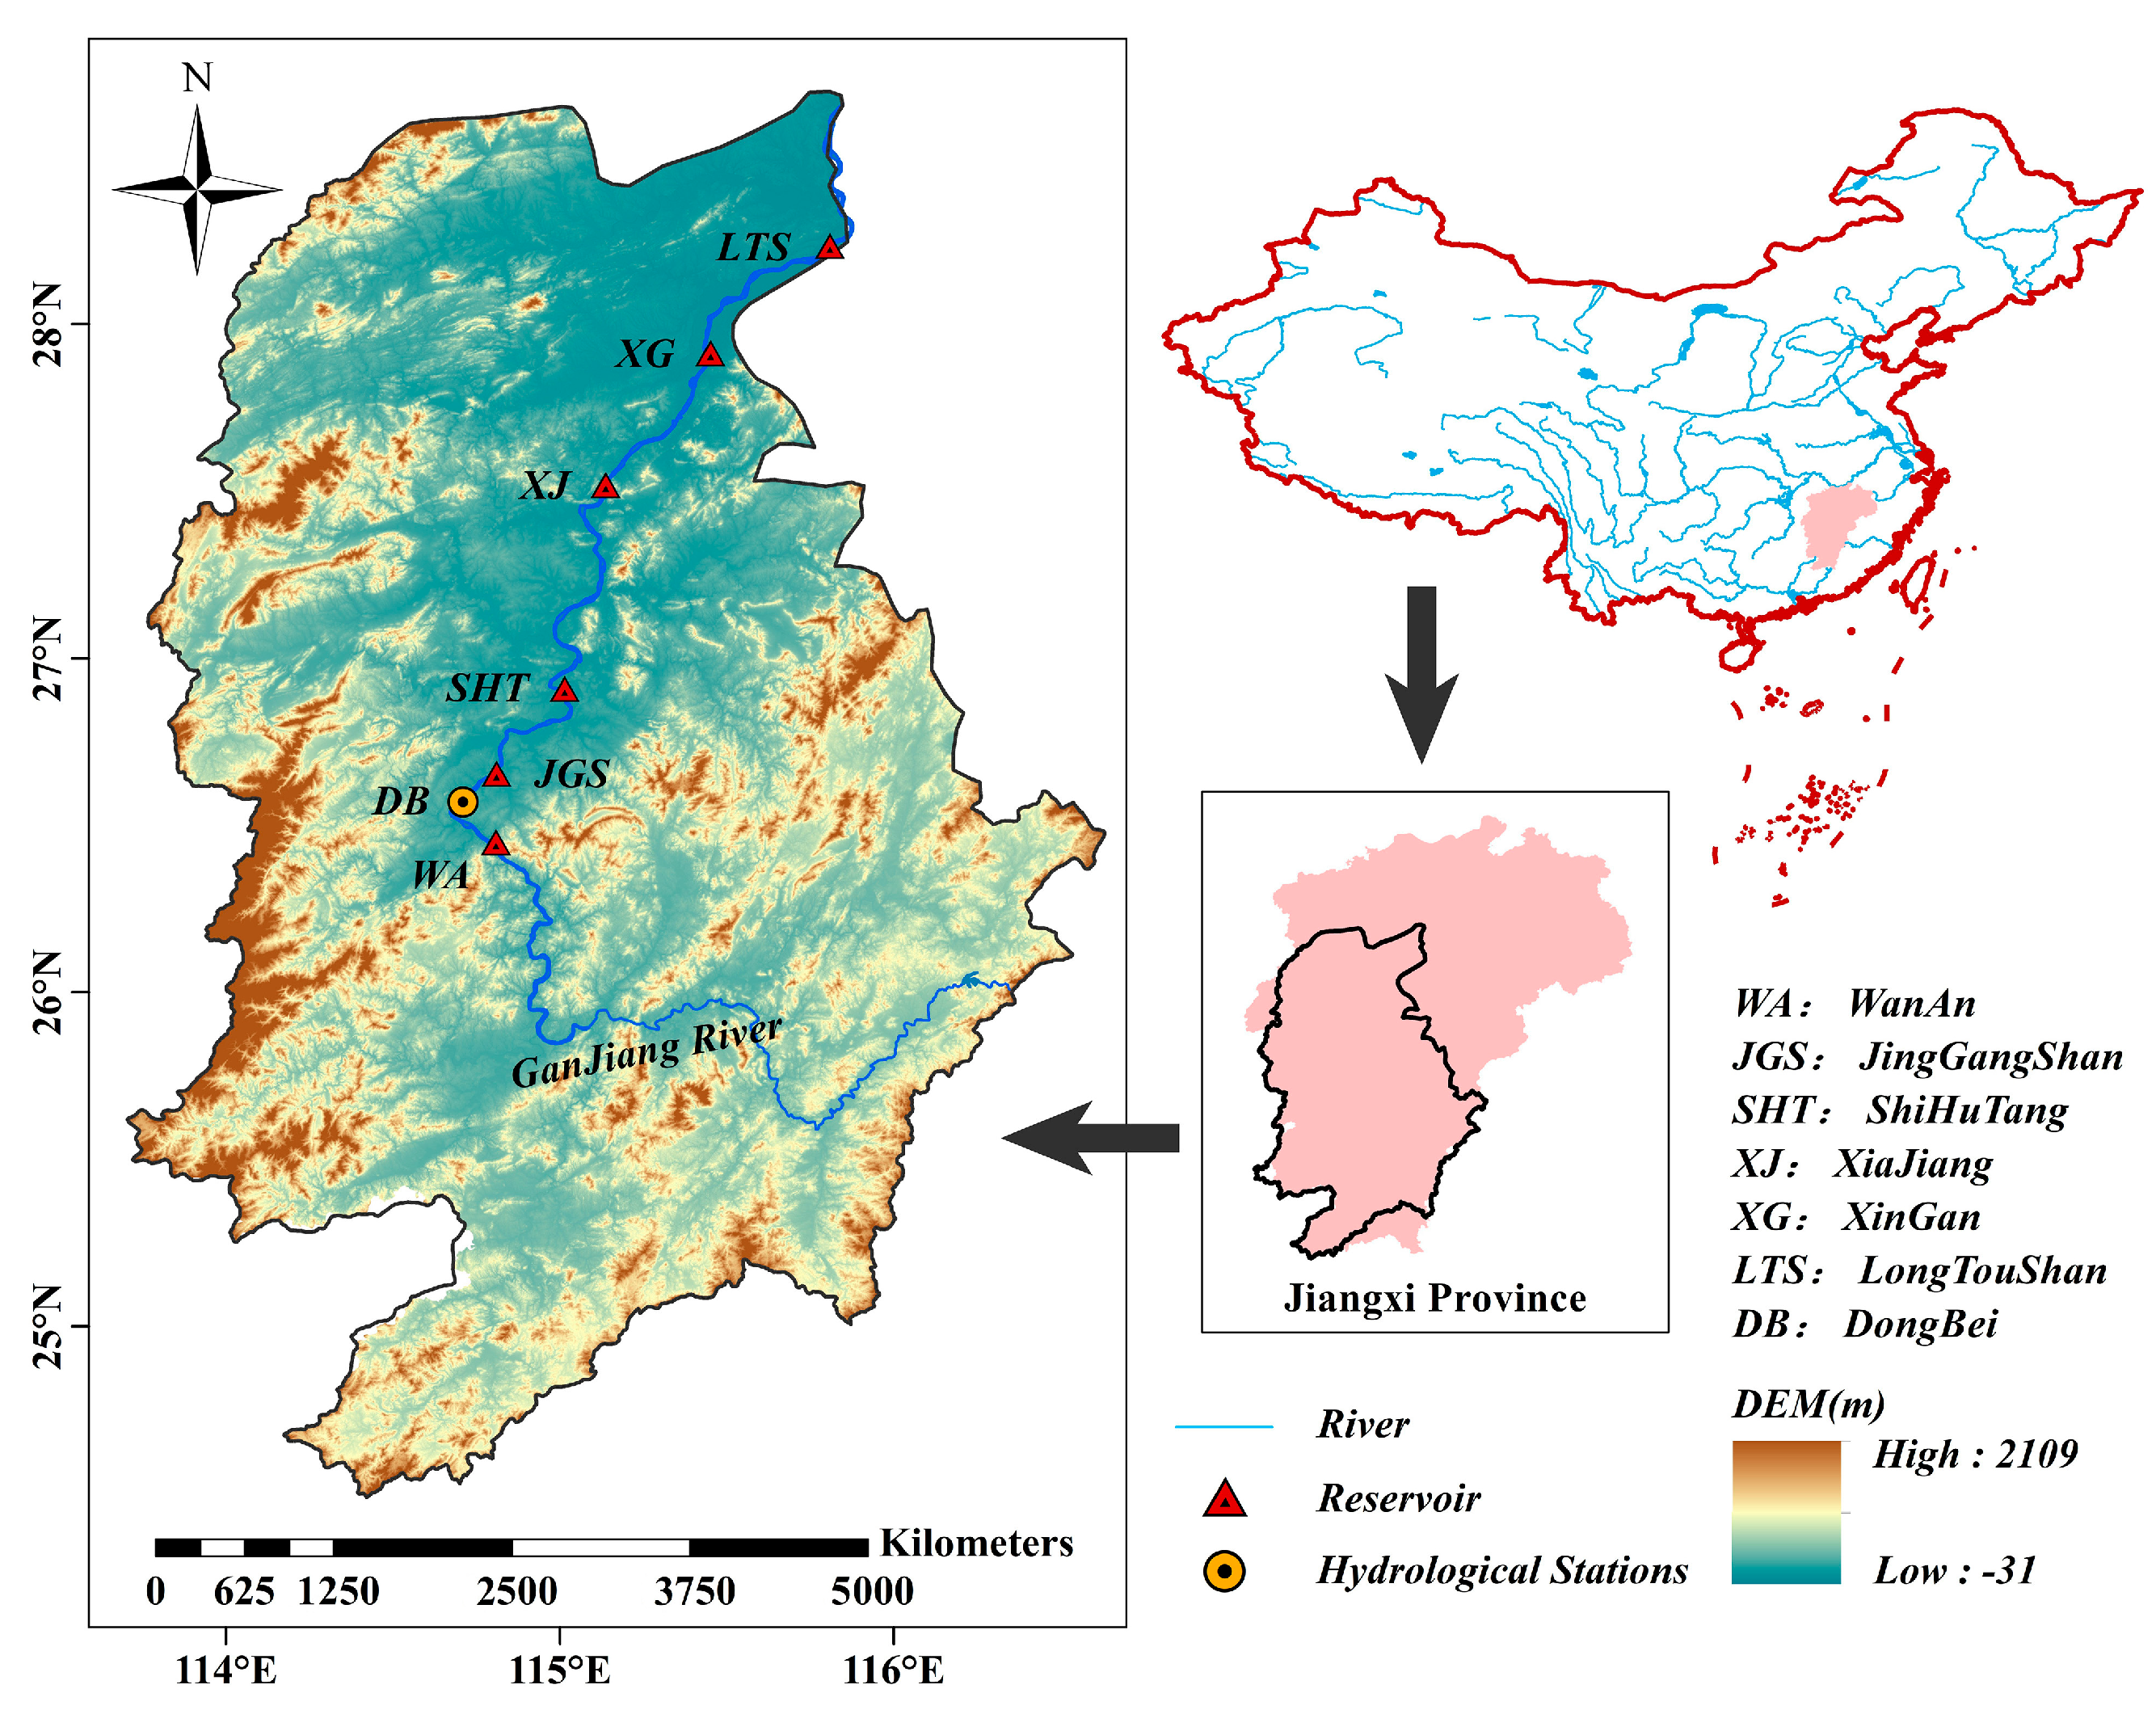
2. Research Area and Data

Study Object

The area of the Ganjiang River Basin is 82,809 km2. It is the head of five rivers in the Poyang Lake Basin and the largest river in Jiangxi Province. The Wan’an Reservoir, located in the middle and lower reaches of the Ganjiang River, is the site of the second hydroelectric power station built in Jiangxi Province. This power station’s mission is mainly energy generation and flood control while also assisting with comprehensive utilization tasks such as shipping, irrigation, water supply, and other aspects.
The scale of hydropower development in the Ganjiang River Basin has continuously expanded with the successive construction and operation of a group of reservoirs, and their regulation and utilization effect on hydropower resources has continuously improved. The construction of cascade reservoirs in the Ganjiang River Basin has achieved significant economic benefits. However, it has also brought serious ecological problems, mainly reflected in the following aspects: (1) The regulation and storage of the reservoir has reduced the inhomogeneity of runoff in seasonal distribution [40]. However, it has also changed the size and occurrence time of peak flood flow, causing damage to the ecological flow of some river sections [41]. (2) Changes in river morphology have directly affected biodiversity within river channels [42]. For example, there are obvious changes in the flow pulse count and duration at Dongbei Station [43], which are not conducive to the migration, spawning, and survival of aquatic organisms in the region [44]. (3) Because of the influence of reservoir construction, the high water level and low flow in the lower reaches of the river are not conducive to the diffusion of pollutants, resulting in local NH3-N and other indicators exceeding the protection threshold and causing serious ecological problems [45]. In the past, the reservoir operation mode in the Ganjiang River Basin was mainly based on the comprehensive utilization benefits of energy generation, flood control, and shipping, with less consideration of ecological benefits [46]. We should fully consider the changes in hydrological indicators and formulate a realistic operational scheme that can balance the energy generation-ecological benefits in the Ganjiang River Basin.
Since it was the first large-scale water conservancy hub built on the main stream of the Ganjiang River, Wan’an Reservoir has a positive effect on the restoration of its runoff law, improvement of the water environment in the reservoir area, improvement of ecological benefits downstream of the river, and growth of fish spawning areas and resources through the application of ecological operation schemes. This study selects Wan’an Reservoir as the research object, and the location overview is shown in Figure 1.
Wan’an Reservoir’s normal storage level was 96.0 m during the initial operation, with a dynamic control range of 85.0–88.0 m for the flood limit water level during the main flood season, a dead water level of 85.0 m, and a total storage capacity of 2.214 billion m3. Wan’an Hydropower Station is equipped with 5 water turbine generator units, with a guaranteed output of 47 MW and an installed capacity of 533 MW. It is a riverbed-type reservoir power station with incomplete annual regulation performance. Based on the historical runoff data of Wan’an Reservoir from 1957 to 2015 (hydrological year), three typical years of wet, normal, and dry are calculated as input data for the reservoir optimization model. The typical monthly average natural runoff of Wan’an Reservoir is shown in Figure 2.

3. Models and Methods

The essence of reservoir ecological operations lies in formulating reasonable and appropriate flow plans that meet the ecological needs of the rivers. This has practical significance for improving the ecological environment of rivers, alleviating ecological pressure on rivers, and maintaining the relative balance of river ecosystems. Reservoir multi-objective ecological operation focuses on the balance between energy generation benefits and ecological benefits. Its central idea is to meet the ecological water requirements of rivers and pursue the optimization of profit goals. This study establishes a multi-objective operation model for Wan’an Reservoir based on production practice, using energy generation capacity and ecological guarantee degree as measurement criteria for energy generation benefits and ecological benefits.

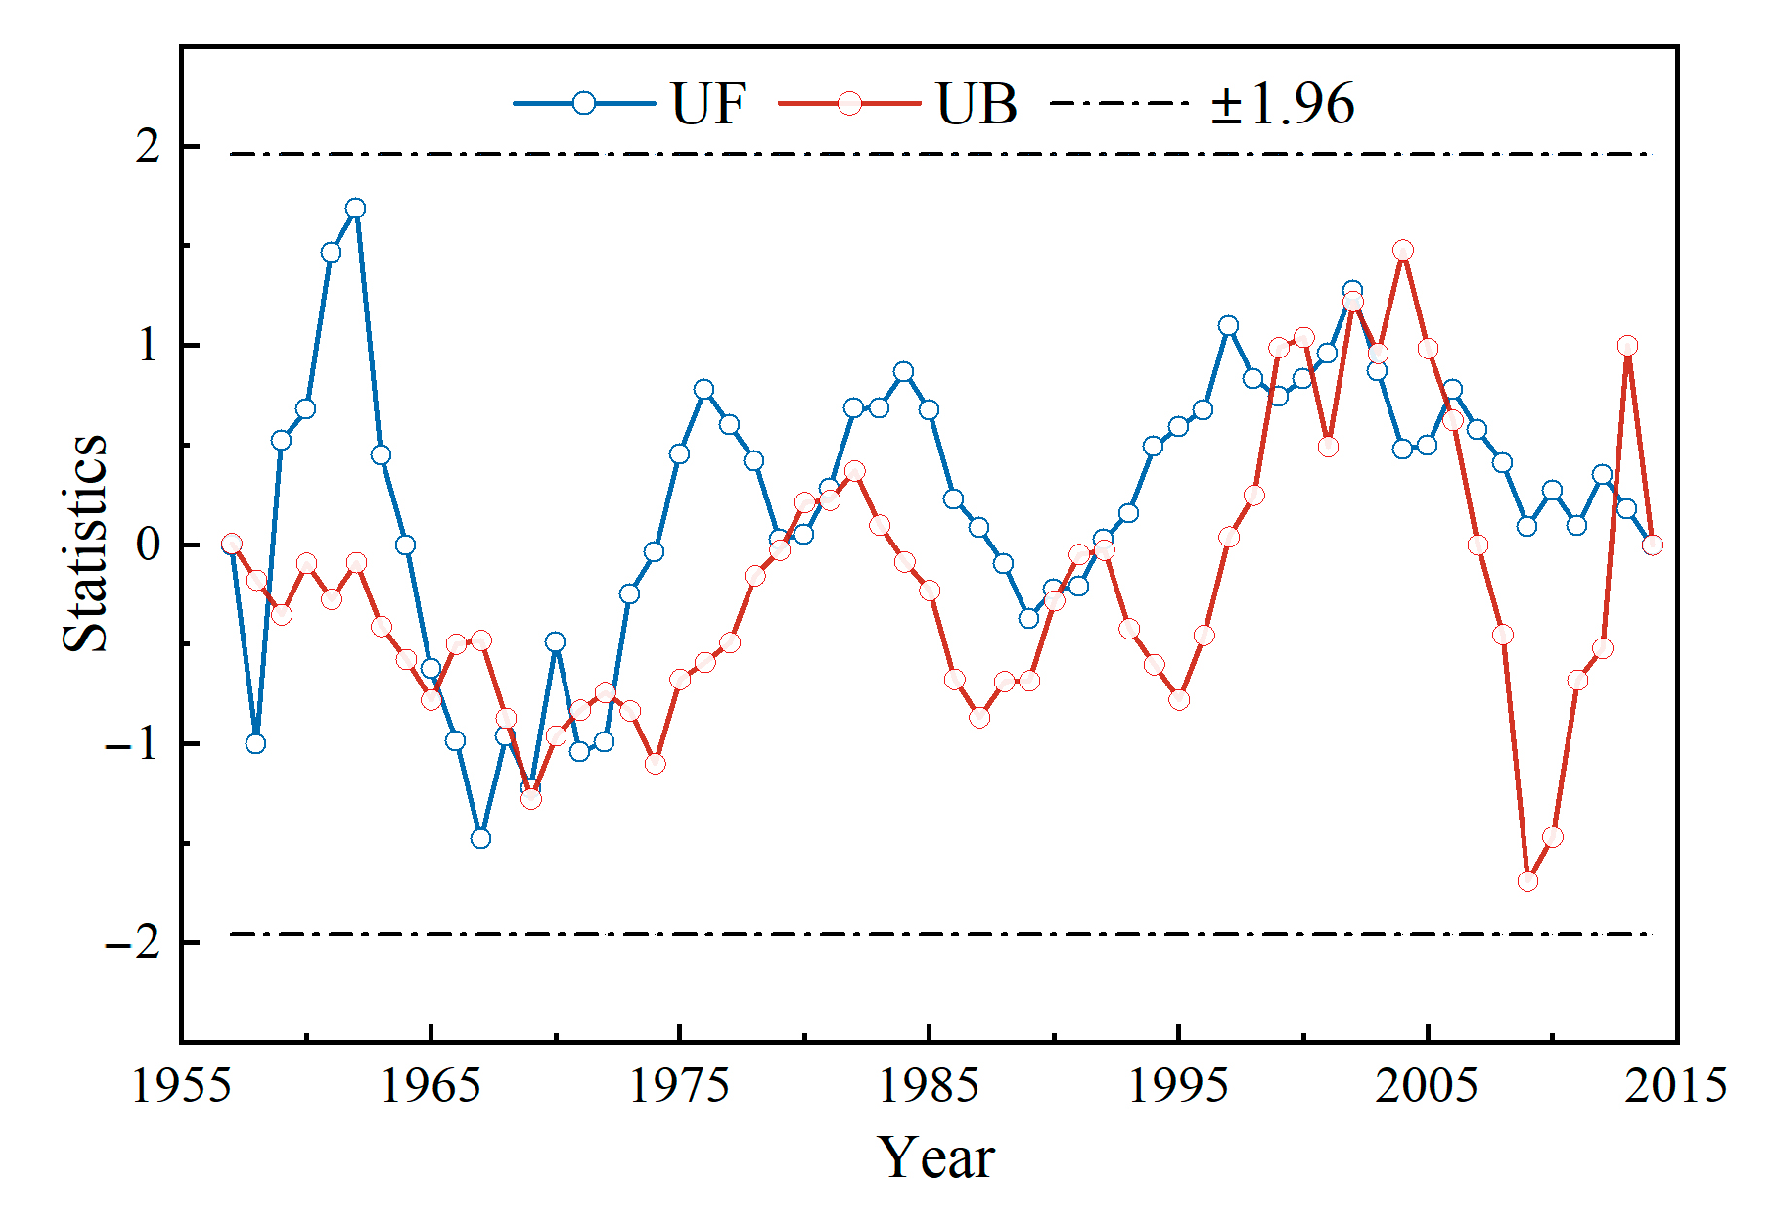
3.1. Hydrological Variation Diagnosis and Mutation Point Testing

When natural climate conditions undergo drastic changes or human activities have significant impacts, the consistency of hydrological sequences is disrupted, resulting in hydrological variability. The estimation of hydrological regimes using inconsistent hydrological sequences results in a degree of bias and low credibility. Therefore, a hydrological variability diagnosis of the runoff data in the study area was required before calculating the ecological flow in the river. In this study, the Mann–Kendall method [47] and ordered cluster method [48] were used to test historical runoff sequences. The results of the two methods were combined to diagnose possible mutation points in the sequence. To further increase the reliability of mutation point diagnosis, this study used the run test method [49] to conduct a significance test on mutation points at the significance level α = 0.05.

3.1.1. Mann–Kendall Method

Assuming there is a time series X containing N samples, construct a rank sequence s k :
s k = i = 1 k r i r i = 1 x i > x j 0   else   ,   j = 1 , 2 , ,   i
From the above equation, it is evident that the rank sequence s k represents the statistical value of a value exceeding the j-th value at time i.
Assuming the time series X is randomly independent, define a statistic U F k :
U F k = s k E s k Var s k , k   = 1 , 2 , ,   N
In the above equation, U F 1 = 0 , E s k and Var s k are the mean and variance of the statistics, respectively. When the time series X is randomly independent, their calculation is as follows:
E s k = n ( n + 1 ) 4
Var s k = n ( n 1 ) ( 2 n + 5 ) 72
U F k follows a standard normal distribution. By referencing the normal distribution table according to the significance level α , if U F k > U α , it indicates a significant change in the sequence X.
Arrange the time series X in reverse order and repeat the above process while setting U B k = U F k , k = n , n 1 , , 1 . After performing the above operation, we can determine the start time of the mutation.

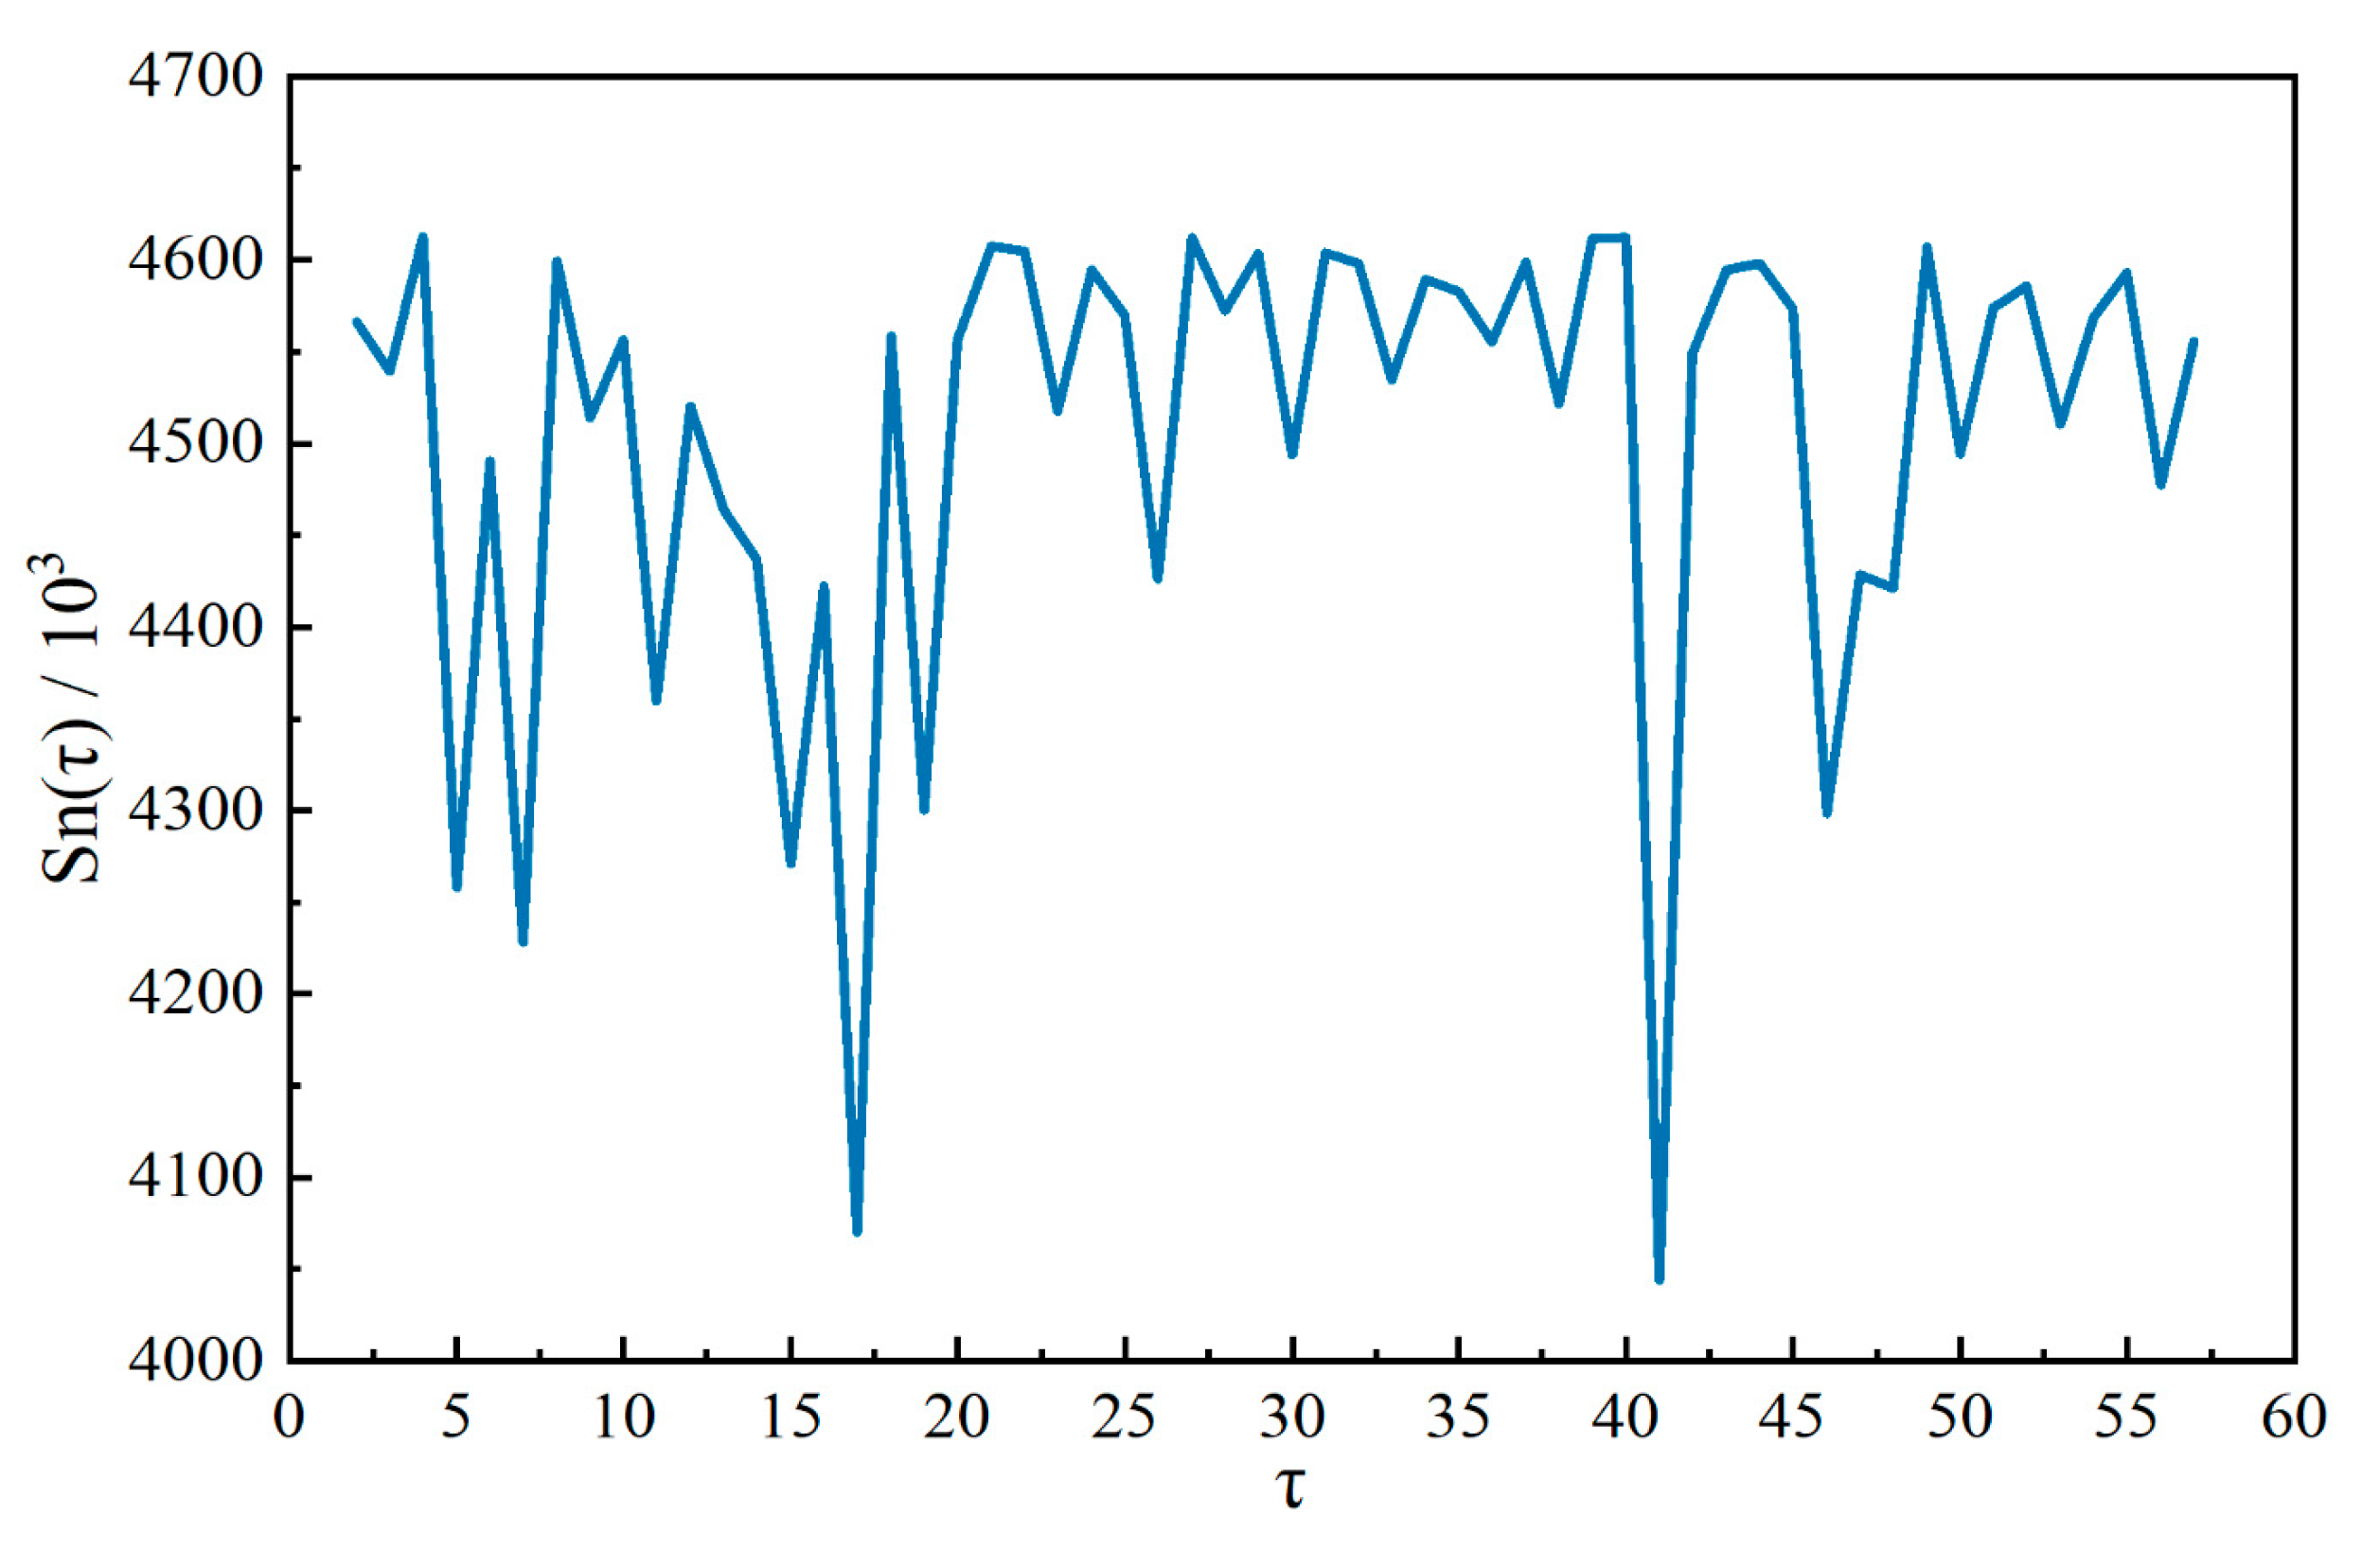
3.1.2. Ordered Clustering Method

The ordered clustering method is an optimal segmentation technique for samples, designed to partition samples with notable disparities into multiple categories. This process aims to minimize the sum of squared deviations within the same category while maximizing the sum of squared deviations between different categories. When applied to hydrological analysis, it facilitates the identification of potential mutation points in time series by locating both local and global minima of the sum of squared deviations within the same class of time series.
Assuming that the potential mutation point in the time series X is τ , the sum of squared deviations for the two segments divided by the mutation point is as follows:
V τ = i = 1 τ x i x ¯ τ 2
V n τ = i = τ + 1 n x i x ¯ n τ 2
where x ¯ τ and x ¯ n τ represent the mean values of the samples before and after the mutation point, respectively.
The total sum of squared deviations of the entire time series sample is:
S n ( τ ) = V τ + V n τ
When S = m i n | S n ( τ ) | ( 2 τ n 1 ) | in the time series, point t may be the mutation point of the hydrological series.

3.1.3. Run Test

The run test is a non-parametric statistical hypothesis testing method used to assess whether a sequence of random variables is uniformly distributed. Based on these two methods, significance testing is required for the above segmentation points for further diagnosis. This study used a run test method for testing.
For large samples, when n 1 , n 2 > 20 , the run number r is close to the normal distribution. Its statistic Z, following a standard normal distribution, is shown as follows:
Z = r ( 2 n 1 n 2 n + 1 ) 2 n 1 n 2 ( 2 n 1 n 2 n ) n 2 ( n 1 ) , Z N ( 0 , 1 )
where n is the total number of sample sequences and n1 and n2 represent the capacity of the sample sequence before and after the mutation point, respectively.

3.2. Ecological Guarantee Degree

The reservoir must discharge a certain amount of water to meet the basic ecological demands of the downstream river channel, and the relationship between the discharge flow and different levels of ecological flow is defined as ecological guarantee degree. In ecological operations that consider the ecological flow, the ecological guarantee degree in the process is easier to satisfy than the total ecological water demand of the entire process. Therefore, this study selected the average annual ecological guarantee degree as one of the goals [50]. The ecological guarantee degree (De,t) is defined thus: if the discharge flow is lower than the minimum ecological flow, De,t = 0; if the discharge flow is between the minimum ecological flow and the lower limit of the suitable ecological flow, De ,t ∈ (0, 0.5); if the discharge flow is between the upper and lower limits of the suitable ecological flow, De,t ∈ (0.5, 1); if the discharge flow exceeds the suitable ecological flow limit, De,t = 1. The mathematical expression is as follows:
D e , t = 0 ,                         Q t < Q min , t 1 2 × Q t Q min , t Q d , t Q min , t , Q min , t                 < Q t < Q d , t 1 2 + 1 2 × Q t Q d , t Q u , t Q d , t , Q d , t                 < Q t < Q u , t 1 ,                         Q t > Q u , t
where De,t and Qt are the ecological guarantee degree and energy generation flow of the hydropower station at time t, respectively; Qmin,t is the minimum ecological flow; and Qu,t and Qd,t are the upper and lower limits of the suitable ecological flow, respectively.

3.3. Objective Function

This study intends to establish two operation scenarios, namely, a single-objective operation and a multi-objective operation, including three operation models.
Model 1: Single-objective optimal operation with maximum energy generation, with the objective function as follows:
E = max ( t = 1 T K Q t H t Δ t )
where E is the total energy generation of the hydropower station during the operation period, and t and T are the time serial numbers and total number of periods, respectively. K is the comprehensive output coefficient of the hydropower station. Qt and Ht are the energy generation flow and water head, respectively, in the t-th period of the power station.
Model 2: Single-objective optimal operation with maximum ecological guarantee degree. The objective function is as follows:
P = max 1 T t = 1 T D e , t
where P is the average annual ecological guarantee degree of the downstream river channel during the operation period.
Model 3: Multi-objective optimal operation considering both ecology and energy generation with the objective function as follows:
Objective   1 :   E = max ( t = 1 T K Q t H t Δ t )
Objective   2 :   P = max 1 T t = 1 T D e , t
The meaning of the parameters is the same as before.

3.4. Constraints

The constraints for models one to three are as follows:
(1)
Water balance constraints:
V t + 1 = V t + [ I t ( Q c k , t ) ] Δ t
where Vt+ 1 and Vt are the initial storages at times t + 1 and t, respectively. It and Q c k , t represent the inflow and outflow at time t, respectively. t is the time interval.
(2)
Water level constraints:
Z t min Z t Z t max   o r   V t min V t V t max
where Z t min and Z t max represent the minimum and maximum water levels at time t, respectively.
(3)
Outflow constraints:
Q t min Q t Q t max
where Q t min and Q t max denote the minimum and maximum allowable outflows at time t, respectively. Q t min is determined by comprehensive downstream water use, shipping, and ecological requirements. Q t max is determined based on the downstream flood control requirements.
(4)
Hydropower outputs constraints:
N t min N t N t max
where N t min and N t max represent the minimum and maximum hydropower outputs at time t, respectively. In general, N t min is the guaranteed output and N t max is the installed capacity.
(5)
Other constraints:
Non-negative constraints on the variables, constraints on the water-level storage capacity relationship curve, and constraints on the tail water-level discharge relationship curve.

3.5. Optimization Algorithm

(1)
As an optimization algorithm based on the swarm intelligence theory, DE is widely used to solve single-objective operation models. This study used the standard DE algorithm to solve Models 1 and 2.
(2)
The solution of multi-objective problems can be approximated from two perspectives: target transformation and obtaining a Pareto non-inferior solution set. However, the method of target transformation can only obtain the best solution from the results. It cannot analyze the transformation laws between multiple objectives from the perspective of the process, which is unfavorable for benefit analysis between multiple objectives. The NSGA-II algorithm is an efficient multi-objective problem-solving algorithm that was improved by Deb et al. in 2002 [51] and has the advantages of good convergence and high robustness. A constraint transformation is used to increase the proportion of feasible regions in the search space to improve the algorithm’s convergence speed and accuracy. Before solving the problem, convert constraints such as flow and ecological water demand into unified decision constraints (water level constraints). The non-convertible constraints are controlled by a fitness function. When the constraint is broken, a penalty function reduces the fitness value and ensures optimization efficiency. Therefore, this study uses the improved NSGA-II to solve Model 3. This improved algorithm can effectively prevent the problem of data falling into local optima during solution processing, thereby improving the efficiency and accuracy of the solution.
The operation steps of the algorithm are as follows:
Step 1: Set algorithm parameters and initialize the search space based on water level constraints.
Step 2: The constraints of water level, flow, and ecological water demand are unified, and the search space is reduced. Accordingly, the initial parent population P0 was randomly generated, and fitness was calculated.
Step 3: Selection, crossover, and mutation operations are performed on the parent population P0 to generate the offspring population Q0.
Step 4: The parent and offspring populations are merged to form a population Rt. The non-dominated level and crowding degree of individuals in Rt are determined, and an N (population size) suitable non-dominating set is selected to form a new parent population Pt.
Step 5: Repeat Steps 3 and 4. If the maximum number of iterations T is reached, the algorithm stops; otherwise, t = t + 1.
Step 6: Monitor the convergence of algorithm iterations and compute the variation of the iteration results from T − 5 to T, denoted as Δ. Determine whether the desired accuracy ε has been attained; if Δ < ε, the calculation is deemed valid and the results are retained; otherwise, the calculation is considered invalid, and the result is discarded.

3.6. Method for Determining Inflection Points

In differential calculus and differential geometry, an inflection point is a point on a smooth plane curve at which the curvature changes sign. Typically, the inflection point is determined by calculating the second derivative of the function. If the second derivatives on the left and right sides of a point on a function have different signs, the point is considered an inflection point. In practical applications, the form of a function and its second derivative are often complex, and the data obtained are usually in the form of discrete points. When using this method to determine the inflection point, curve fitting must be performed according to the discrete points in advance, which inevitably has the disadvantages of numerous calculations, high complexity, and low accuracy. This study used a non-fitting curve method [52] to determine the approximate inflection point of the discrete function.
Based on the characteristics of the inflection point, the downward trend of the curve before and after the inflection point exhibited inconsistency, or the curvature of the curve transitioned from convex to concave (or vice versa)., as shown in Figure 3. If point C is considered the inflection point of the curve, points A and B are any two points before point C, and points D and E are any two points after point C, then there is a discriminant:
( k A B k B C ) × ( k C D k D E ) < 0
where kAB, kBC, kCD, and kDE are the slopes of AB, BC, CD and DE, respectively.
For discrete functions, let the dividing points be x0, x1, …, xk, , xn−1, and the corresponding ordinates be f(x0), f(x1),, f(xk),, f(xn−1). If the inflection point is k, the discriminant is given by (12).
F ( k ) = ( f ( x k 1 ) f ( x k 2 ) x k 1 x k 2 f ( x k ) f ( x k 1 ) x k x k 1 ) × ( f ( x k + 2 ) f ( x k + 1 ) x k + 2 x k + 1 f ( x k + 1 ) f ( x k ) x k + 1 x k )
where k = 3, 4, 5, …, n−3.

3.7. CV-ITOPSIS

Step 1: The original decision evaluation matrix X is constructed, which includes m schemes and n indicators. For the research question in this study, each scheme consists of two indicators: energy generation and ecological guarantee degree. The original matrix can be represented as:
X = x 11 x 1 n x m 1 x m n
Step 2: The original matrix data xij has a unified indicator type (forward transformation), which means that the cost, intermediate, and interval indicators are uniformly converted into benefit indicators. For the research questions in this study, all indicator types were benefit indicators.
Step 3: Standardize the forward matrix data, eliminate the influence of different units between indicators, and calculate all data using the same method. The standardized matrix is Rij.
R i j = x i j i = 1 n x i j 2
Step 4: Calculate the mean Aj and standard deviation Sj of each indicator separately, and calculate the coefficient of variation Vj based on this.
A j = 1 n i = 1 n r i j
S j = 1 n i = 1 n ( r i j A j ) 2
V j = S j A j
Step 5: Calculate the weight wj of each indicator.
w j = V j i = 1 n V j , i = 1 n w j = 1
Step 6: Determine the positive and negative ideal solution schemes. Based on the forward and standardized matrices Rij mentioned above, determine the positive and negative ideal solutions Z+ and Z For a set of solutions to be evaluated,
Z + = z 1 + , z 2 + , , z m + , z j + = max 1 j n ( R i j ) Z = z 1 , z 2 , , z m , z j = min 1 j n ( R i j )
Step 7: The Mahalanobis distance is used to calculate the distance Dj for each scheme relative to the ideal solution scheme in the evaluation scheme set.
D j + = ( R i j Z + ) T w T Σ 1 w ( R i j Z ) D j = ( R i j Z ) T w T Σ 1 w ( R i j Z )
where w is the indicator weight obtained by the CV method, and w = d i a g ( w 1 , w 2 , , w m ) , Σ 1 is the inverse matrix of the covariance matrix.
Step 8: Calculate the relative closeness of each evaluation scheme to the positive and negative ideal solutions, Cj.
C j = D j D j + + D j
Step 9: Each scheme is sorted based on the relative closeness degree Cj, where the magnitude of the Cj value indicates the relative strengths and weaknesses of the different schemes. The larger the value, the better the relative evaluation of the schemes, and vice versa. We considered the solution with the highest Cj value as the optimal solution.

4. Results and Discussion

4.1. Result of Hydrological Variation Diagnosis

In Figure 4, the mutagenicity analysis results of the Mann–Kendall test method are presented. The graph has two sequence curves, UF and UB, with values greater than 0 or less than 0, indicating an upward or downward trend in the sequence. When its value exceeds the critical value (±1.96) of the normal distribution at a significance level of 0.05, the changing trend of the sequence is considered significant. If an intersection point exists between the UF and UB curves, the corresponding time of the intersection point is a possible mutation point. In Figure 4, multiple intersections exist between the two curves within the critical line. However, these intersections are all small fluctuations with small mean differences, indicating that the mutation is insignificant.
As shown in Figure 5, the mutagenicity analysis results of the ordered clustering method are presented. The essence of this method is to determine the optimal segmentation point, which implies that the sum of the squares of the deviations between the two categories segmented by this point is at a smaller level. Applying this method to a historical runoff series aims to select a base year as the segmentation year for the entire series. The sum of the squared deviations of the runoff series before and after the base year is calculated. If the sum of the squared deviations is the smallest, then the selected base year is considered the optimal segmentation point; that is, the base year is a possible mutation point. Figure 5 shows the relationship between the annual average flow sequences, S n ( τ ) and τ . There are multiple points with a smaller sum of the squares of deviations, among which 1963, 1973, and 1997 may be the optimal segmentation points.
Select the significance level α and check the table to get the corresponding quantile Z α / 2 . When | Z | > Z α / 2 , it indicates that the calculated mutation point is significant. The test results are shown in Table 1.
In summary, there was no significant trend or mutation point in the historical runoff series from Dongbei Station from 1957 to 2015.

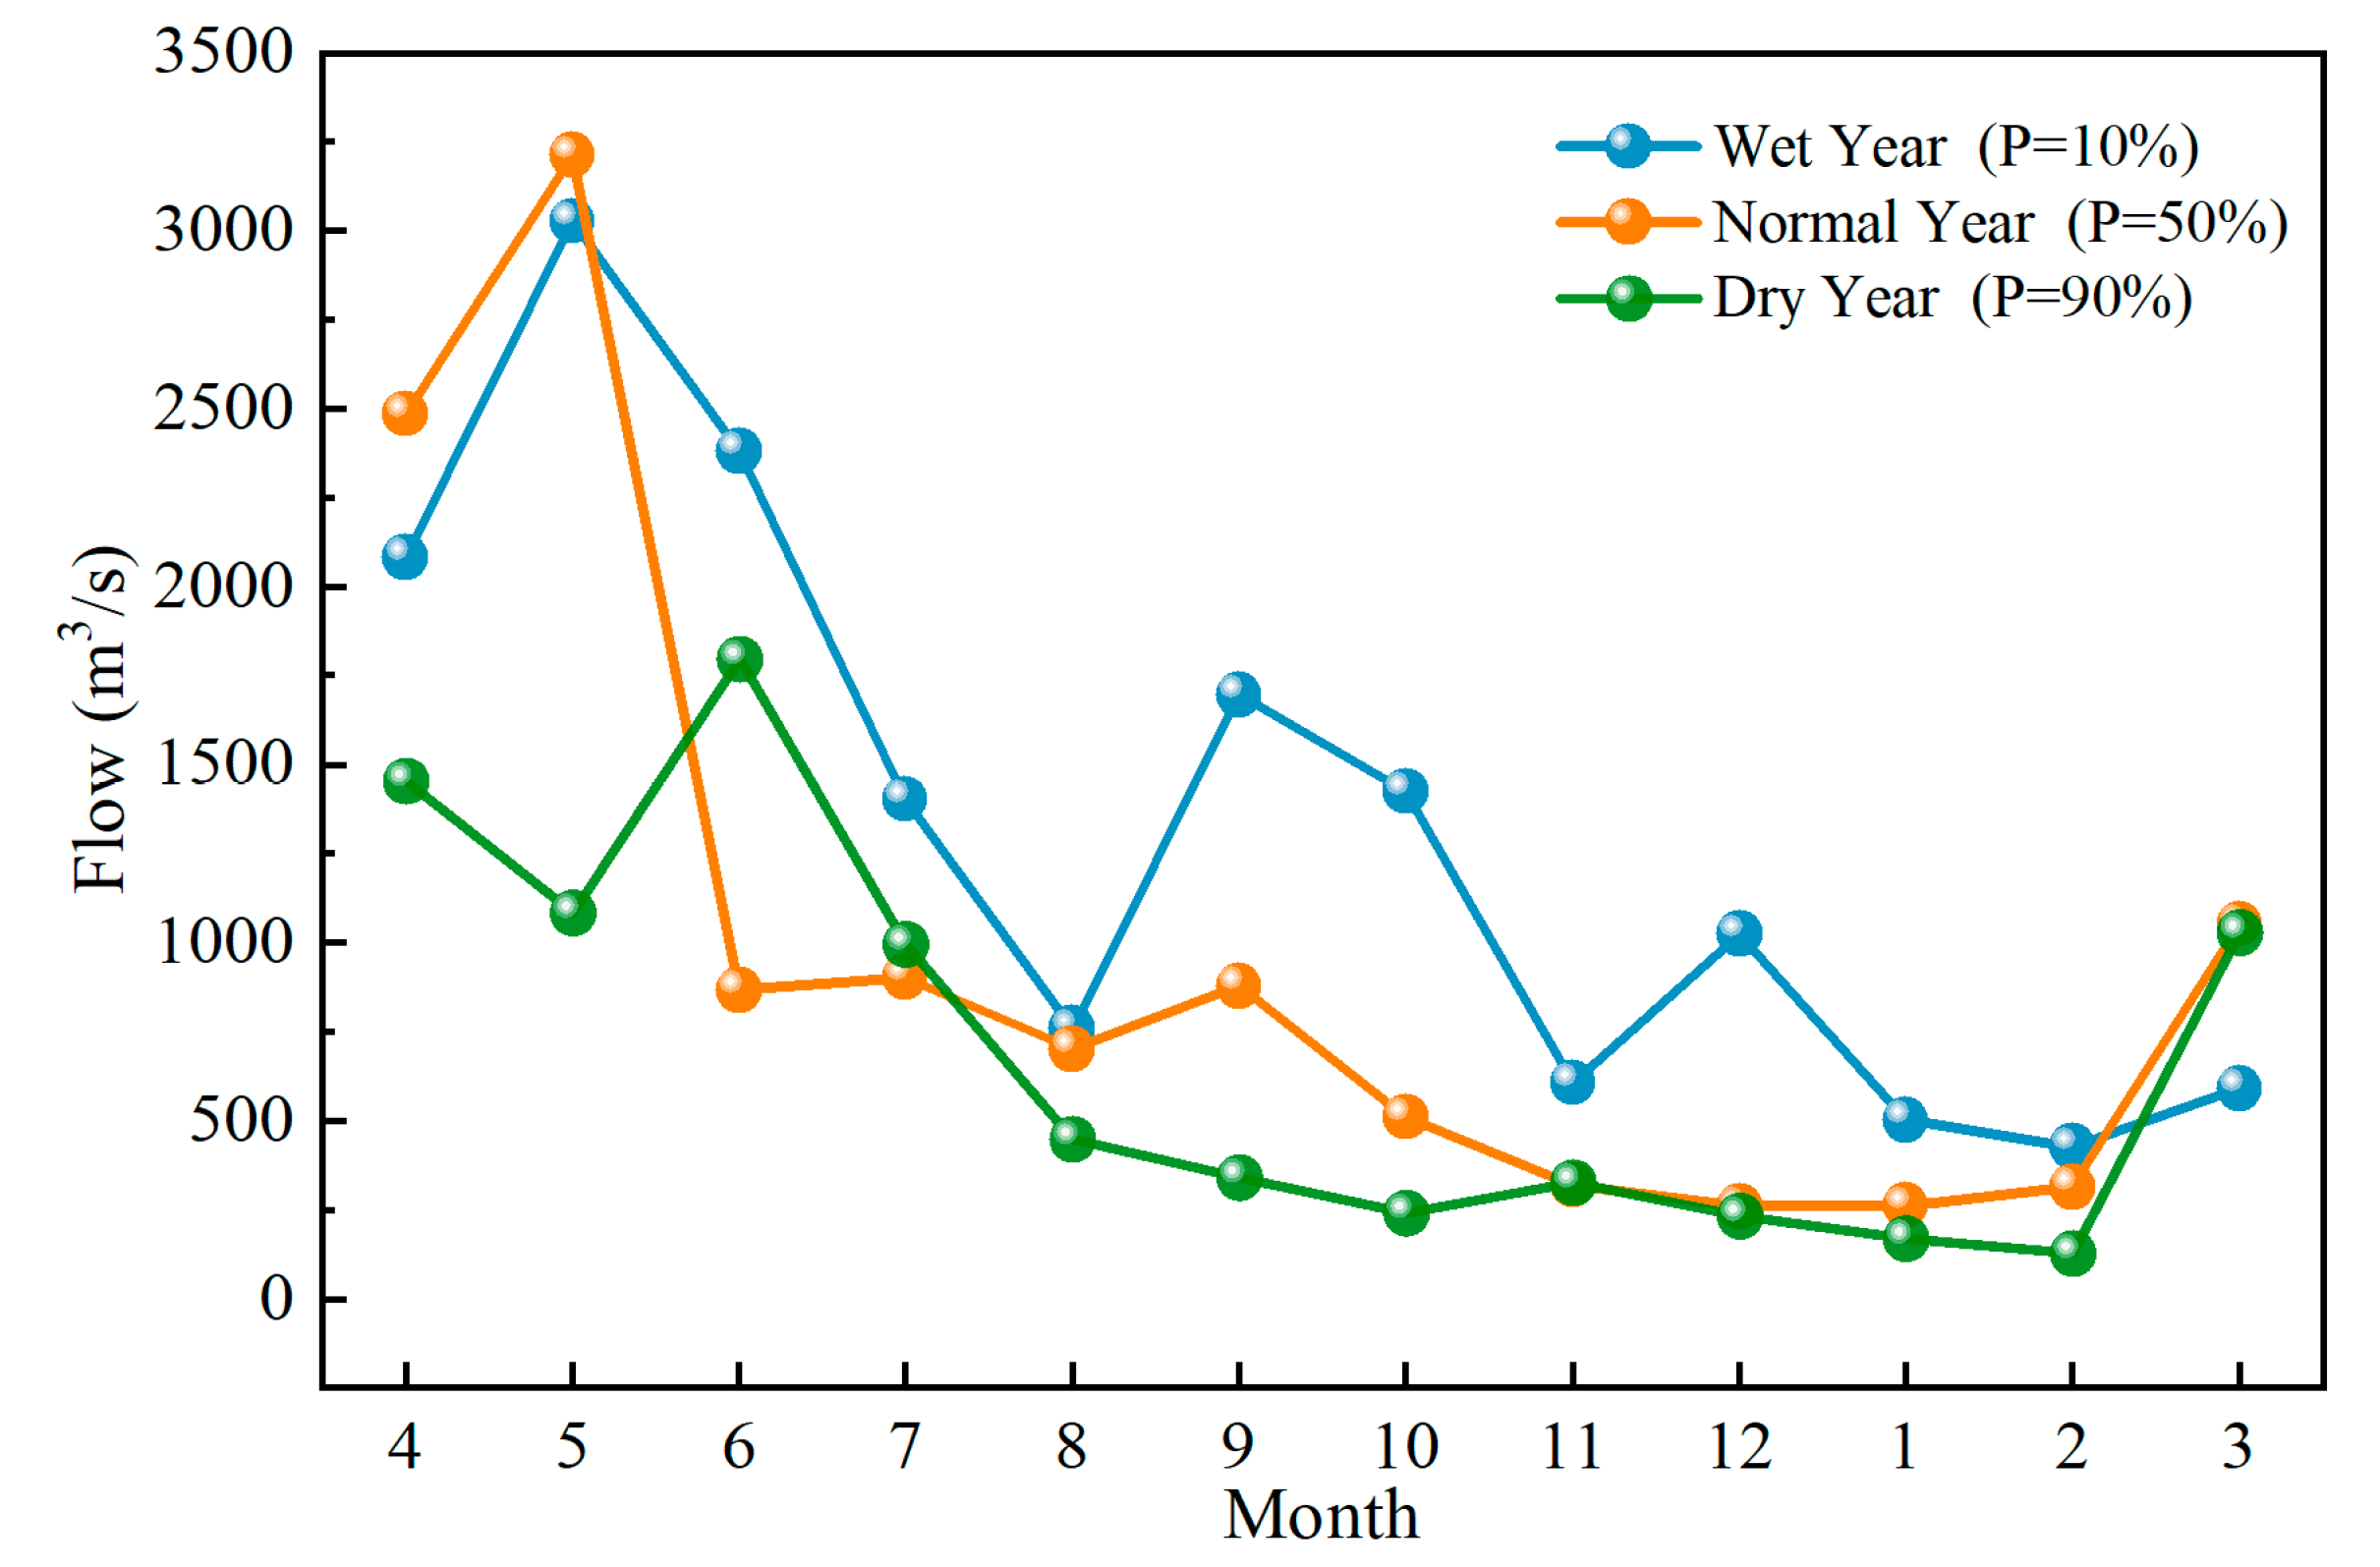
4.2. Ecological Flow

Ecosystems have strong adaptability to natural hydrological features. Considering the 59-year historical runoff series of Dongbei Station without variation, this study used complete runoff data for the calculation of ecological flow, that is, from 1957–2015. Ecological flow can be considered at two levels: minimum and suitable. Minimum ecological flow refers to the flow process that ensures the basic ecological functions of the downstream river channel and maintains the non-degradation of the river ecosystem. Suitable ecological flow refers to the flow process that provides normal survival and reproductive conditions for aquatic organisms in the downstream river channel and ensures the biological integrity of the downstream river [53]. This study used different guarantee rates to calculate ecological flow at different periods to avoid the limitation of using a single guarantee rate, which leads to ecological flow being unable to adapt to seasonal changes within the year.
Based on previous research [11,54] and the current situation in the middle and lower reaches of the Ganjiang River [55], the ecological flow of the river channel was calculated hierarchically and phased, as shown in Figure 6. The minimum ecological flow is determined using the “monthly minimum ecological runoff calculation method”. The suitable ecological flow is determined using the “monthly frequency method” and “Tennant method”. The lower limit of suitable ecological flow considers changes in the flood season, and the Tennant method was used for the calculation. During the flood season (April to September), 60% of the annual flow was taken, while 40% of the annual flow was taken during the non-flood season (October to March). The upper limit of the suitable ecological flow considered seasonal changes during the year, and the monthly frequency method was used for the calculation. The guaranteed rate was 50% during the high-water period (May–September), 70% during the normal-water period (March, April, October, and November), and 90% during the low-water period (December–February).

4.3. Analysis of the Impact of Ecological Objective on Operation Results

The DE algorithm was used to solve Models 1 and 2 based on long-term monthly runoff data from 1957 to 2015. The algorithm parameters were set as follows: population size Pop = 100, iteration number Gen = 3000, and desired accuracy ε = 0.01, and crossover and mutation probabilities were taken as 0.4 and 0.6, respectively. Among them, single-objective model 1 was transformed into model 2 with the objective of maximizing ecological guarantee degree after fully considering ecological flow constraints. The impact of ecological objectives on operational results could be investigated by comparing and analyzing the operational schemes of Models 1 and 2. This study selected 1970–1971, 1980–1981, and 1986–1987 as the wet, normal, and dry years, respectively. Among them, April to June was the main flood season, July to September was the post-flood season, and the remaining months were dry seasons.
The annual energy generation and annual average ecological guarantee degree under different models for each typical year are listed in Table 2. In the operation results of Model 1, the annual energy generation in the three typical years of wet, normal, and dry was 219,700 kWh, 150,300 kWh, and 115,300 kWh, respectively. Similarly, the annual average ecological guarantee degree was 94.23%, 76.53%, and 59.94%, respectively. Compared to Model 1, the operation results of Model 2 showed a decrease of 5.54%, 5.46%, and 5.03% in annual energy generation in wet, normal, and dry years, respectively, and the annual average ecological guarantee degree increased by 3.12%, 10.09%, and 13.47%, respectively. The scheduling results indicated that fully meeting the ecological flow significantly improved the ecological benefits of the river, but at the cost of sacrificing a certain amount of energy generation benefits. Comparisons of the water level and flow between Models 1 and 2 are shown in Figure 7 and Figure 8.
(1)
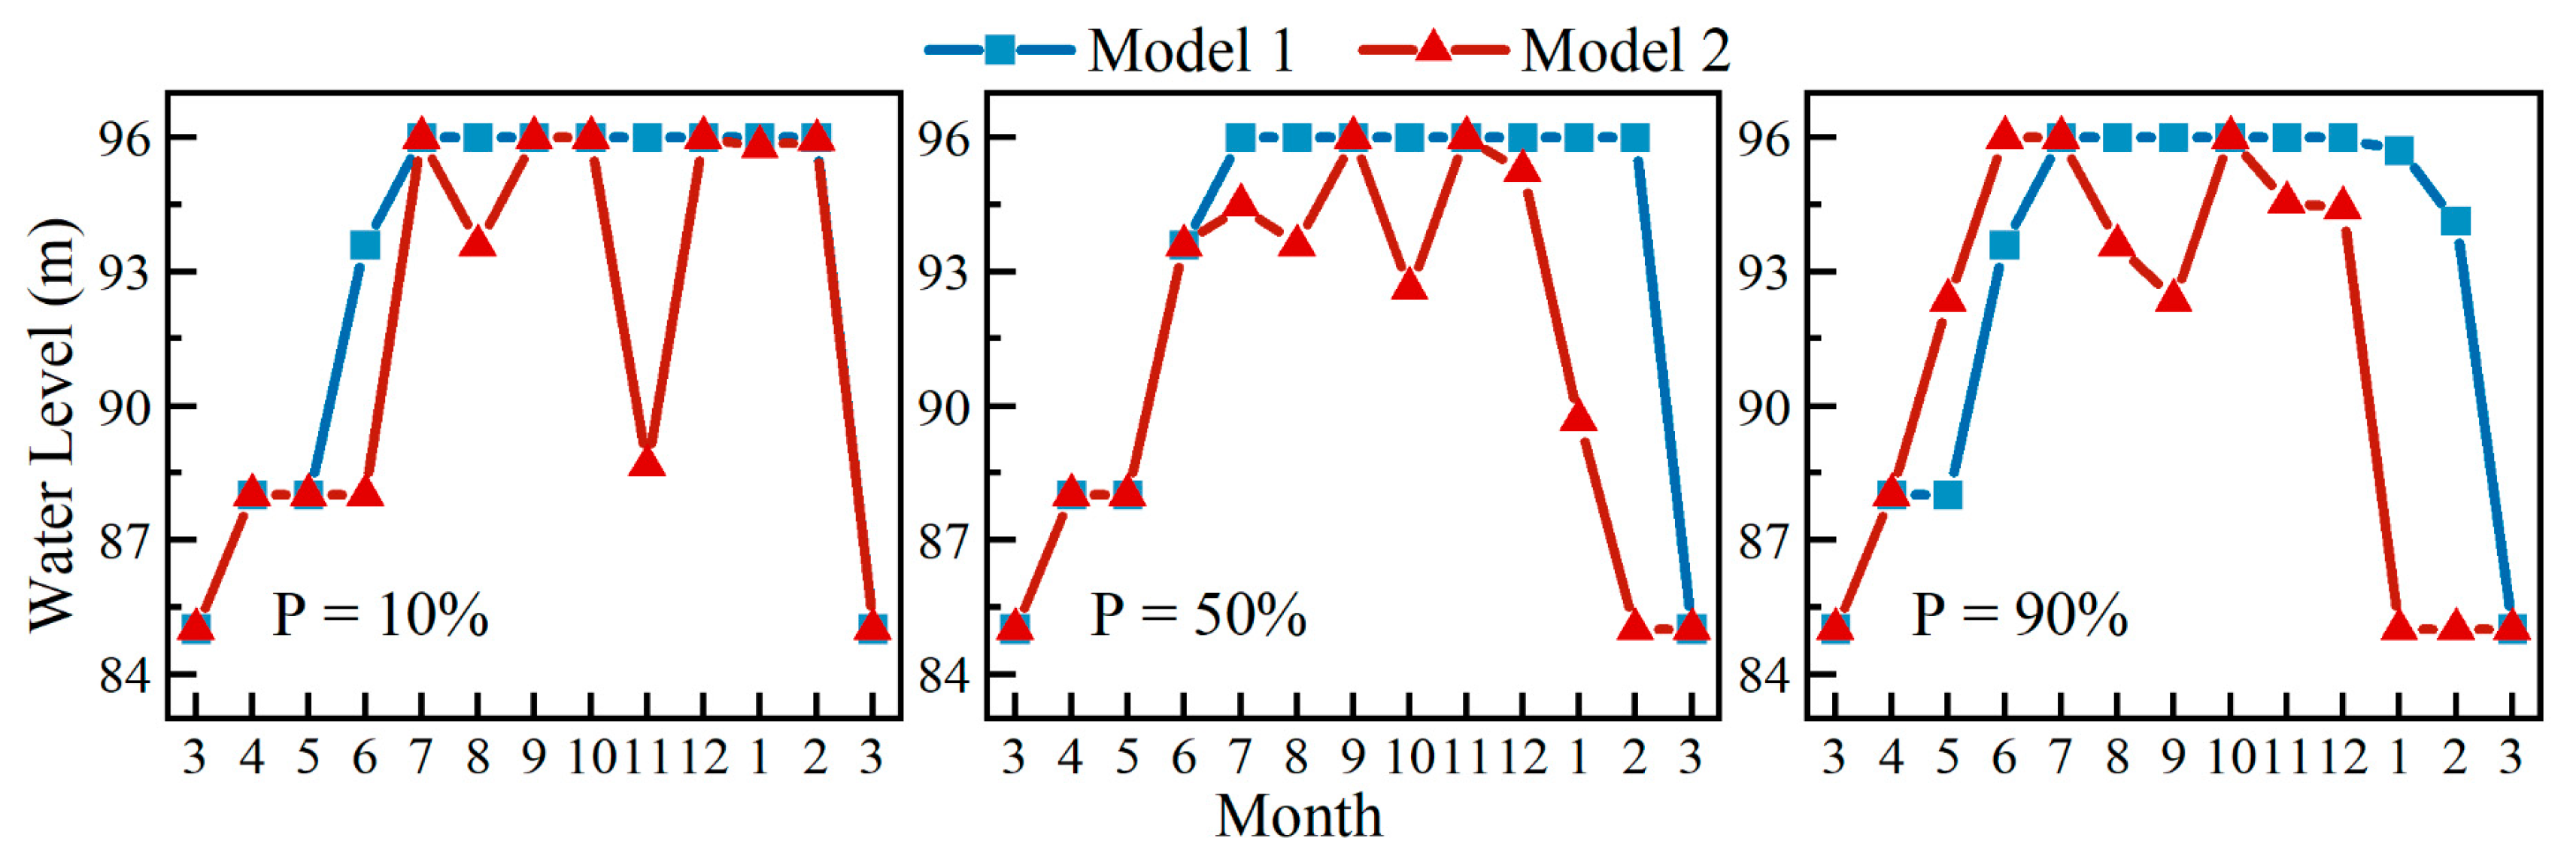
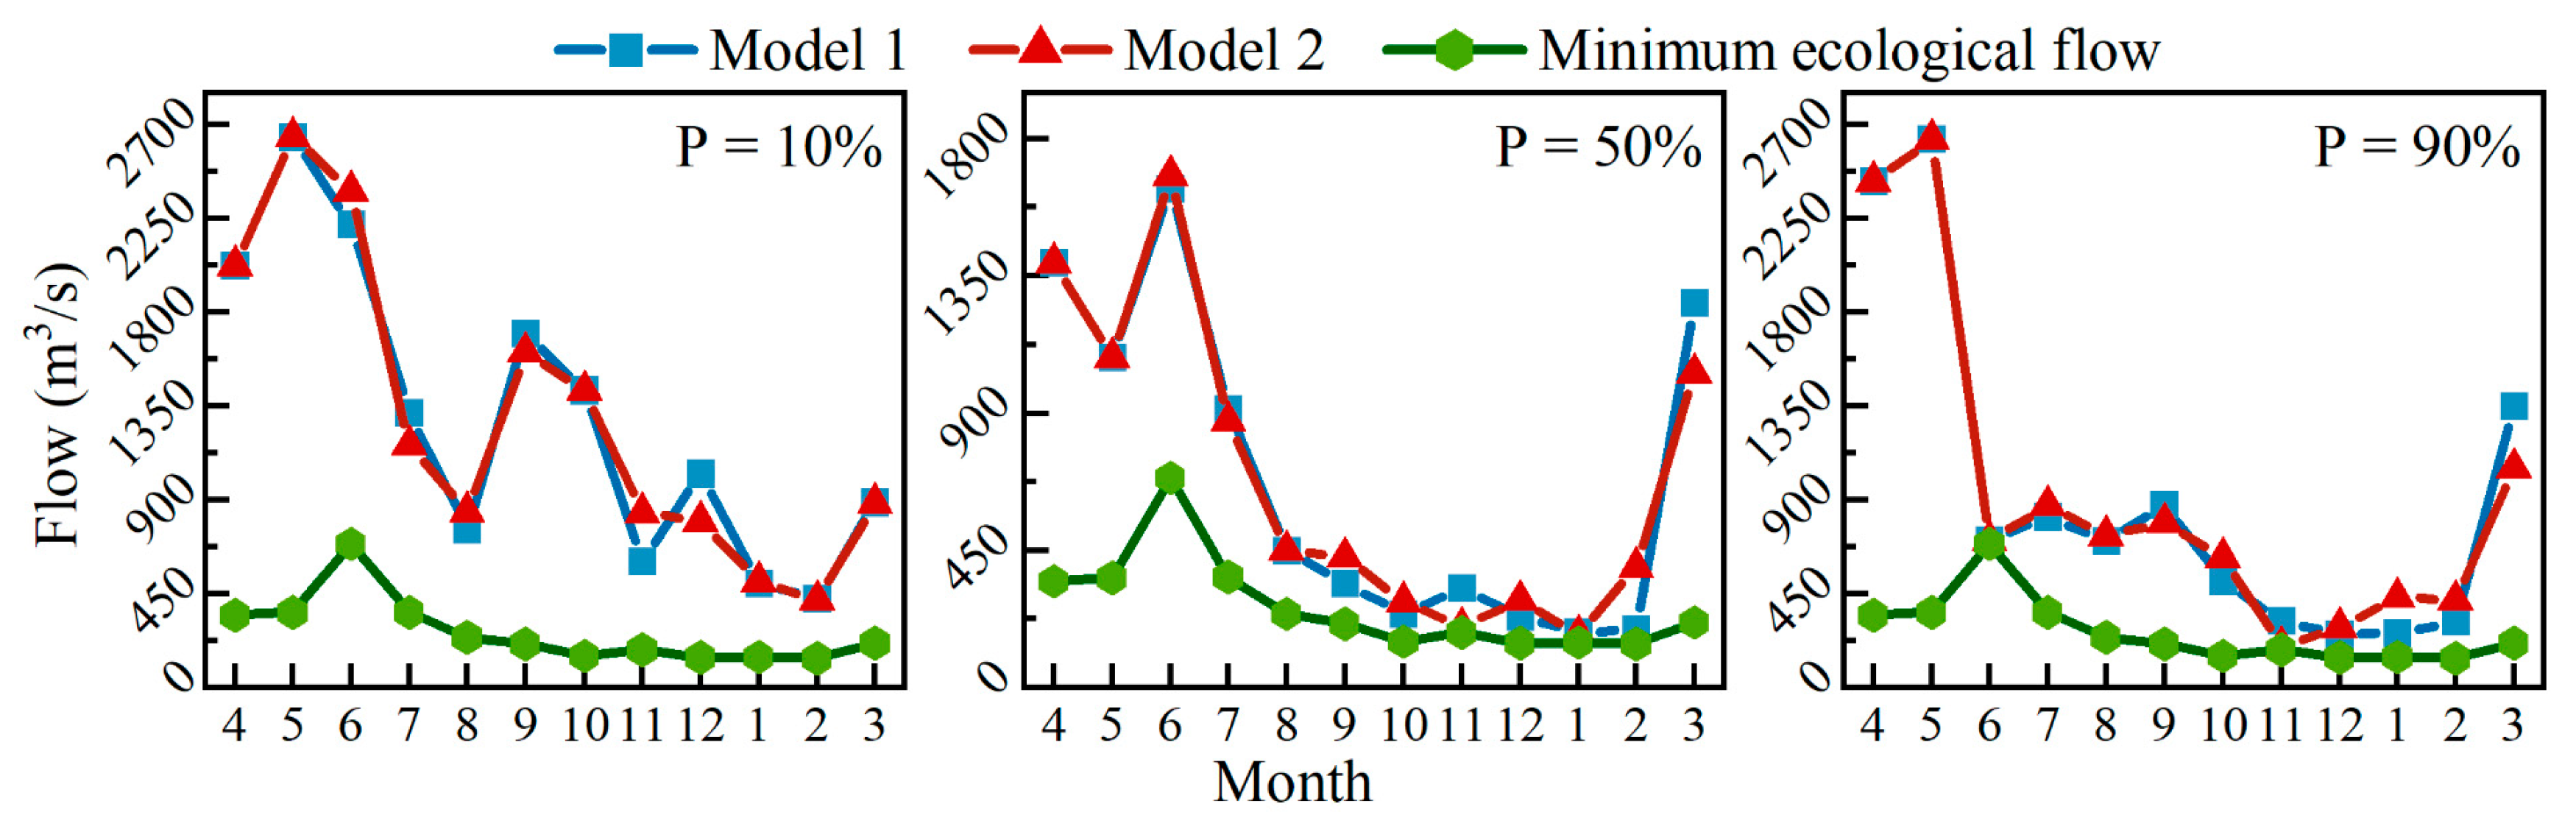
Because of the constraints of ecological flow, reservoirs must increase their discharge flow to maximize the ecological benefits of downstream rivers as much as possible. Therefore, Model 2 had lower water levels and higher discharge flow than Model 1, particularly during the post-flood season. The water regime in the Wan’an Basin was relatively simple, and the annual distribution of runoff was relatively concentrated. The water level dropped to the flood limit level before the flood season to meet the flood control needs. Model 1 increased the water level during the post-flood season and maintained it at the normal water storage level, minimizing the water discharge as much as possible to maximize energy generation while meeting the water usage requirements during the dry season. Model 2 sacrifices a high head to increase the discharge flow during the post-flood season and satisfy the ecological water demand of the river as much as possible.
(2)
Considering the need to provide normal survival and reproductive conditions for aquatic organisms in downstream river channels, this study used 80% as the standard for ecological assurance, which is the average level that meets the upper and lower limits of a suitable ecological flow. As shown in Table 2, in Model 2, the number of ecological guarantee months for each typical year increased by 2, 3, and 2 months, respectively. Assuming that the reduction in energy generation levels is roughly the same in each typical year, the annual average ecological guarantee degree in wet years increased by 3.12% compared to Model 1. In contrast, the annual average ecological guarantee degree increased by 10.09% and 13.47% in normal and dry years, respectively, which is 3–4 times higher than in wet years. The main reason for this is that, in Model 2, due to significantly lower inflow runoff during the dry season in both normal and dry years compared to the wet year, the reservoir must adopt a method of lowering the water level while increasing discharge flow during the dry season to improve ecological benefits. In Model 1, to maximize energy generation, high water levels were maintained for most of the typical years, resulting in a low level of ecological guarantee degree during the dry season in both normal and dry years. The operational results of the two models corresponded with each other, reflecting a significant increase in ecological guarantee degree during the normal and dry years of Model 2.

4.4. Result Analysis of Multi-Objective Operation
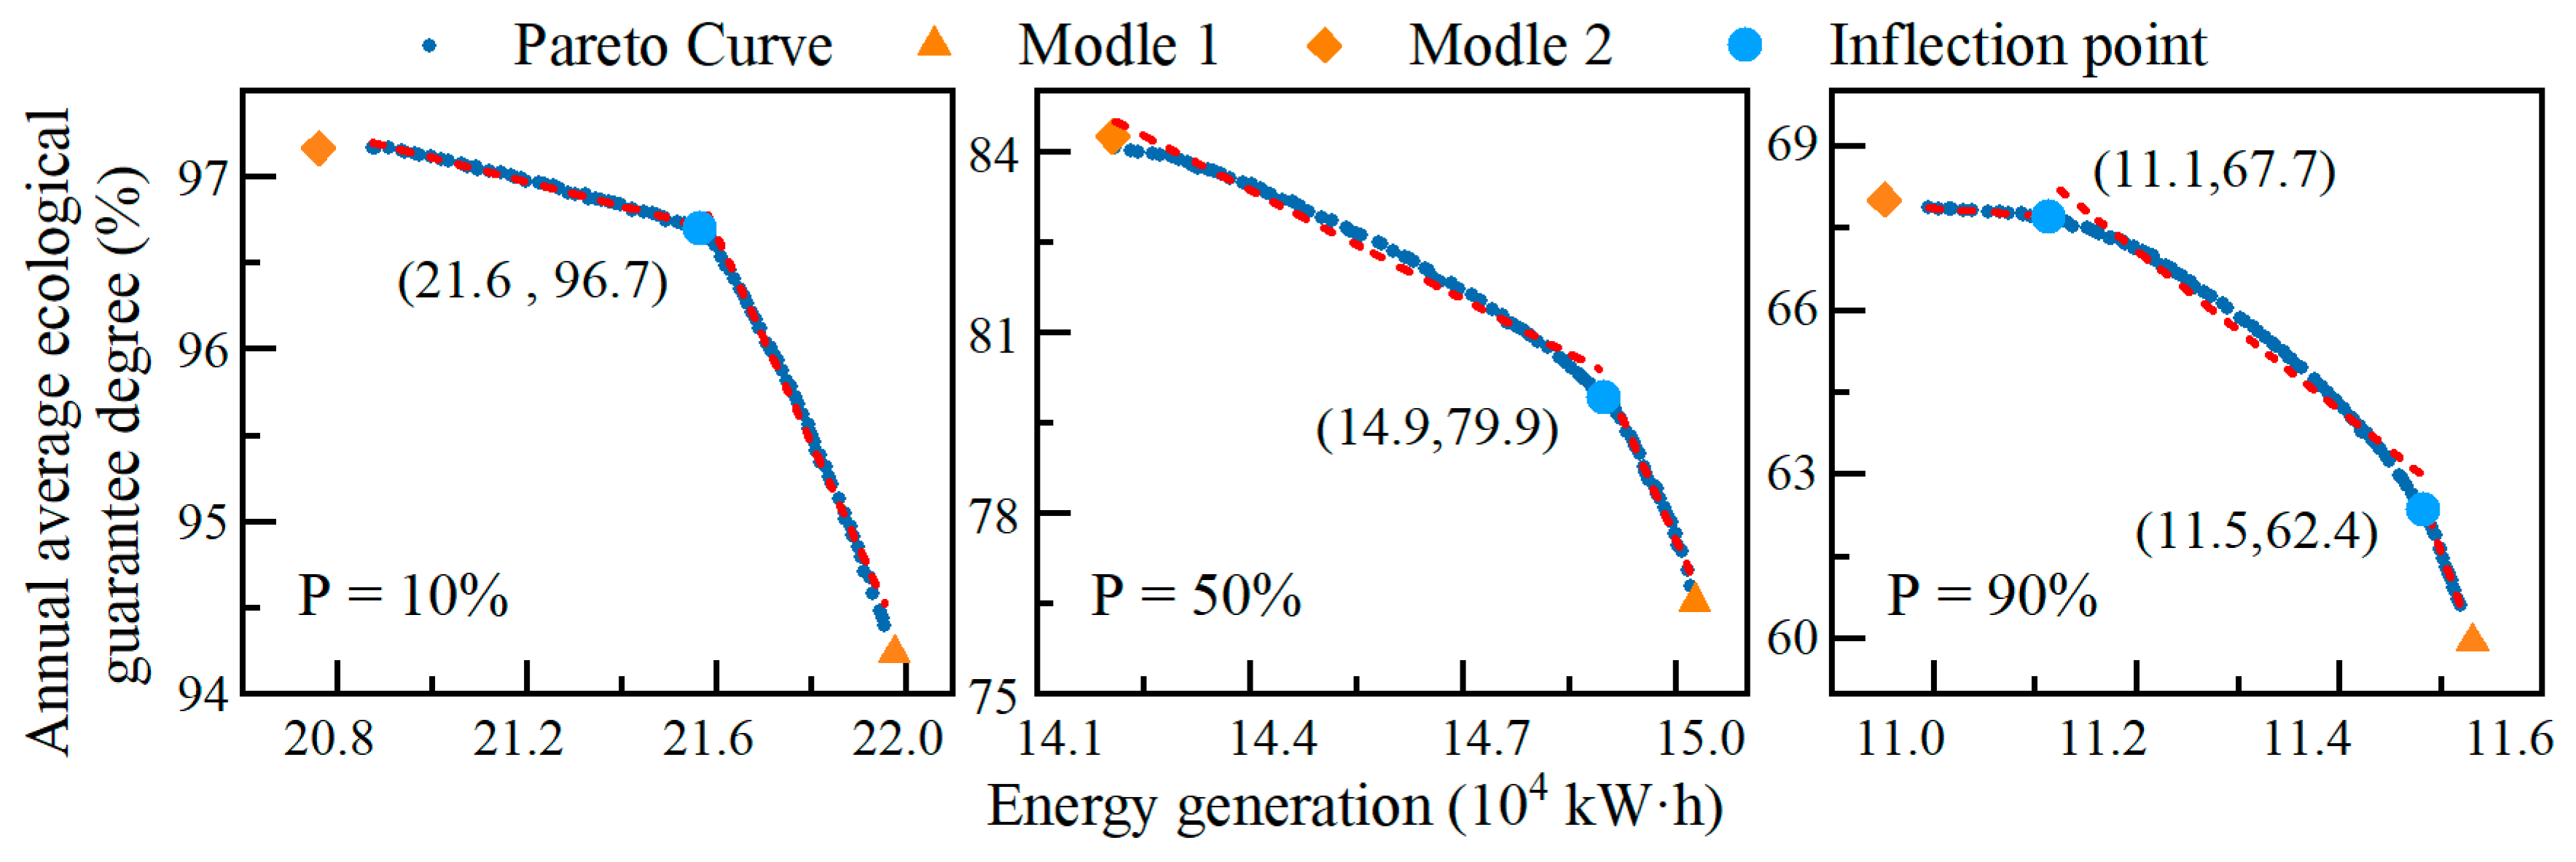
The calculation results of Models 1 and 2 analyzed the contradictory relationship between energy generation and ecological objectives in terms of time. However, the conversion law between the two objectives still needs further exploration. Based on three typical monthly runoff datasets, this study used the improved NSGA-II algorithm to solve Model 3. The algorithm parameters were set as follows: population Pop = 100, iteration number Gen = 3000, desired accuracy ε = 0.01, and crossover and mutation probabilities were taken as 0.75 and 0.25, respectively. The operation results obtained are plotted as Pareto frontier curves, as shown in Figure 9.
(1)
The calculation results of Models 1 and 2 under single-objective scheduling fall near the extreme right and left points of the Pareto front curve, respectively. This confirms that the solution set of the multi-objective operation has a good degree of approximation of the real Pareto front. In multi-objective operation, the interannual variation interval widths of energy generation in the three typical wet, normal, and dry years were 11,000 kWh, 8200 kWh, and 5200 kWh, respectively. The interannual variation interval widths of ecological guarantee degree were 2.94%, 7.55%, and 7.26%, respectively. From a numerical standpoint, as the inflow decreases, both the interannual energy generation and the ecological guarantee degree decrease. However, the conversion rate between energy generation and ecology has greatly improved, exacerbating the contradiction between the two objectives.
(2)
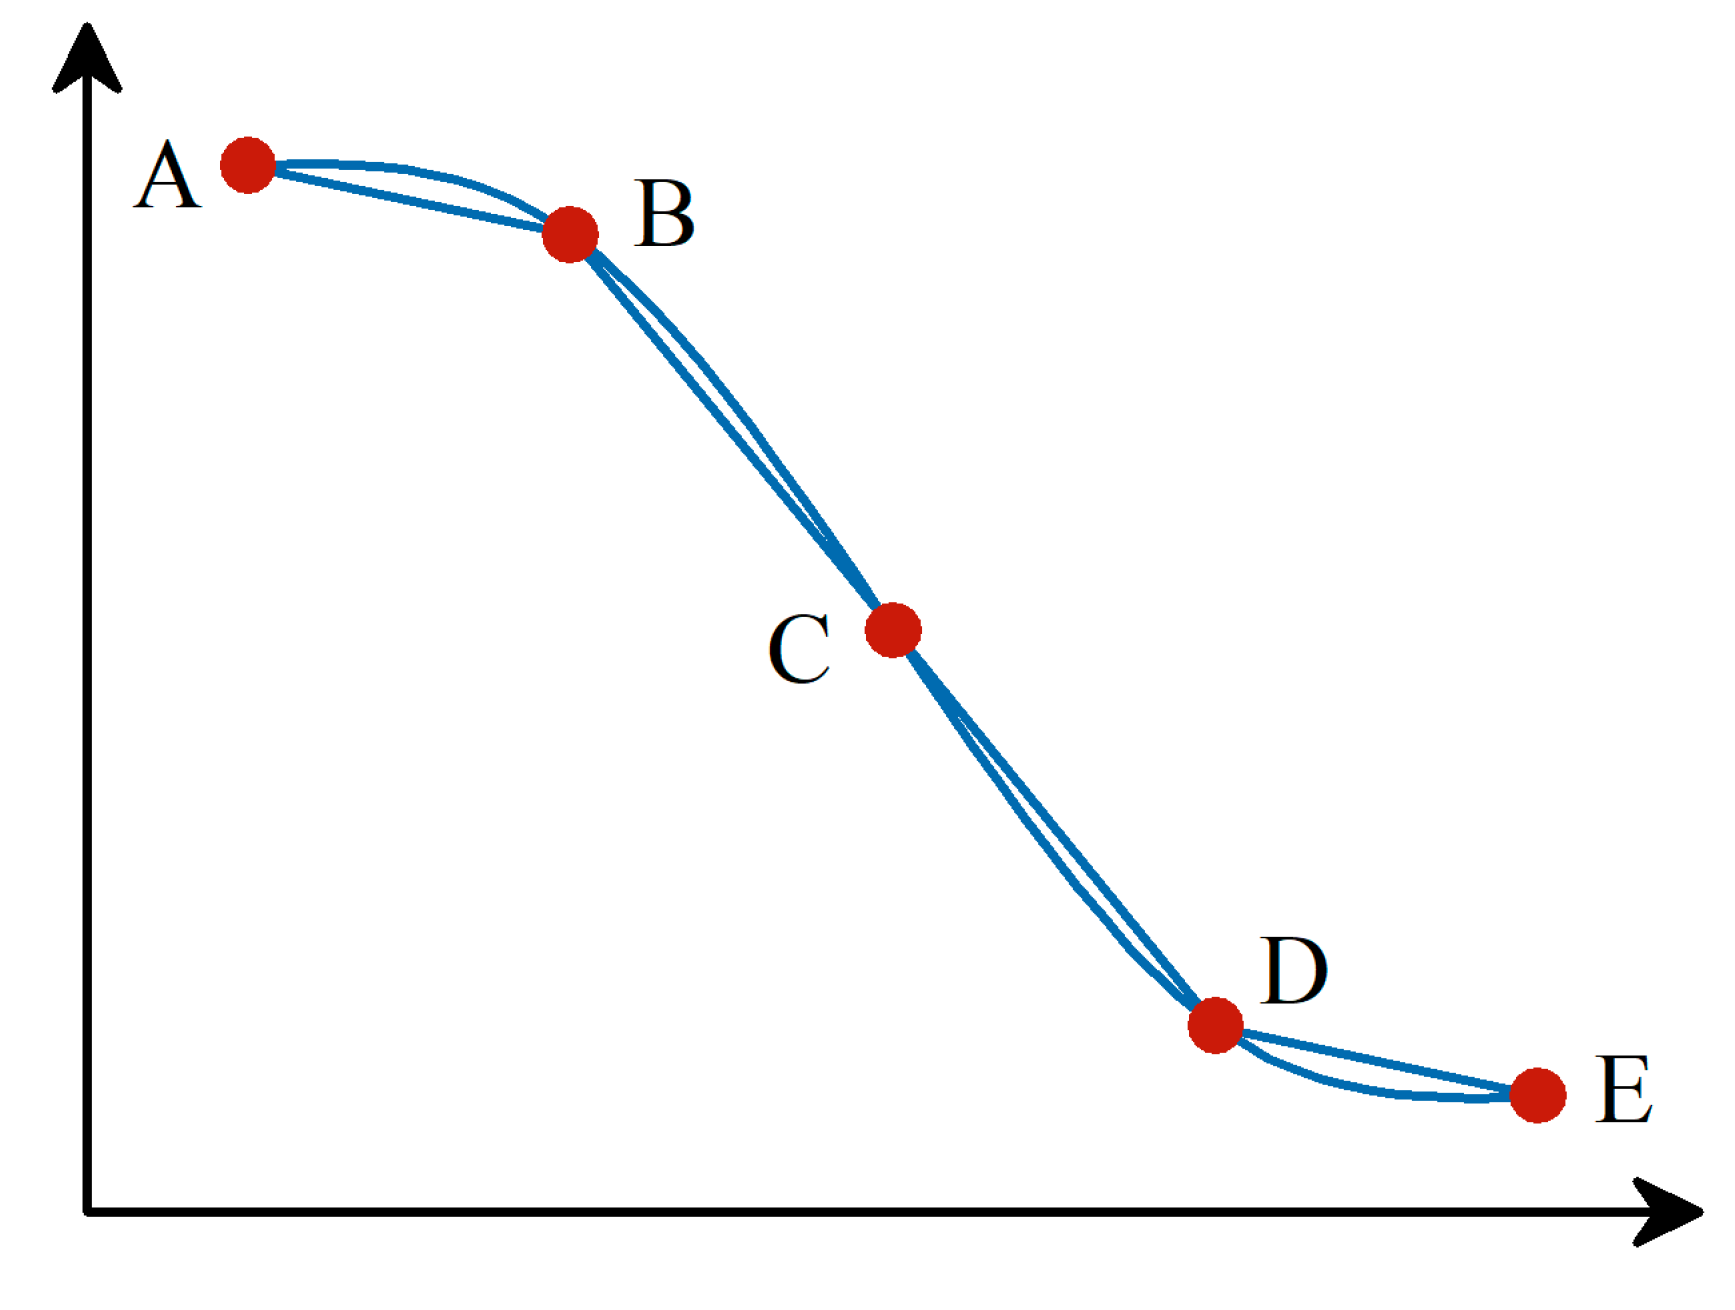
The two objectives of energy generation and ecology exhibit a piecewise linear contradictory relationship in an image. This study used a non-fitting curve method to determine the approximate inflection point of the Pareto front curve. The Pareto front curve was fitted linearly after the approximate inflection point was obtained to obtain the conversion formula between the two objectives, as depicted in Table 3. The larger the slope of the piecewise straight line, the lower the efficiency of converting energy generation benefits into ecological benefits, and vice versa. Discharge flow is an important factor affecting the energy generation and ecological assurance degree, and there is a negative correlation between the discharge flow and water head. Analysis of the conversion law between the two objectives began with the discharge flow and water head. Considering a wet year as an example, the water head significantly impacted the conversion rate from energy generation to ecology before the inflection point. Increasing the water head reduced the discharge flow. A high water head positively affected the increase in energy generation. However, a low flow was unfavorable for the ecological guarantee degree of downstream river channel. Therefore, the conversion rate from energy generation to ecology was relatively low. The discharge flow significantly impacted the conversion rate from energy generation to ecology after the inflection point. The increase in discharge flow plays a crucial role in alleviating the ecological pressure on the downstream river channel, while appropriately increasing energy generation. Therefore, the conversion rate between energy generation and ecology corresponding to this piecewise straight line was relatively high.
(3)
The ecological objective of this study was to define the ecological flow calculated using a multiyear runoff series. As the inflow increased, the inflection point gradually shifted to the left and up, and the global conversion rate from energy generation to ecology gradually increased. In dry years with less water inflow, bearing a higher ecological water demand was necessary, resulting in an unstable relationship between energy generation and ecological objectives. Therefore, there were two inflection points. Decision-makers could use the Pareto front curves and inflection points between the piecewise straight lines to make decisions based on different inflow conditions, achieving maximum benefits. In addition, the expression of piecewise straight lines and their inflection points helped decision-makers to quantitatively describe the conversion law between two objectives, providing them with rich decision-making plans and important application value.

4.5. Multi-Attribute Decision-Making Based on CV-ITOPSIS
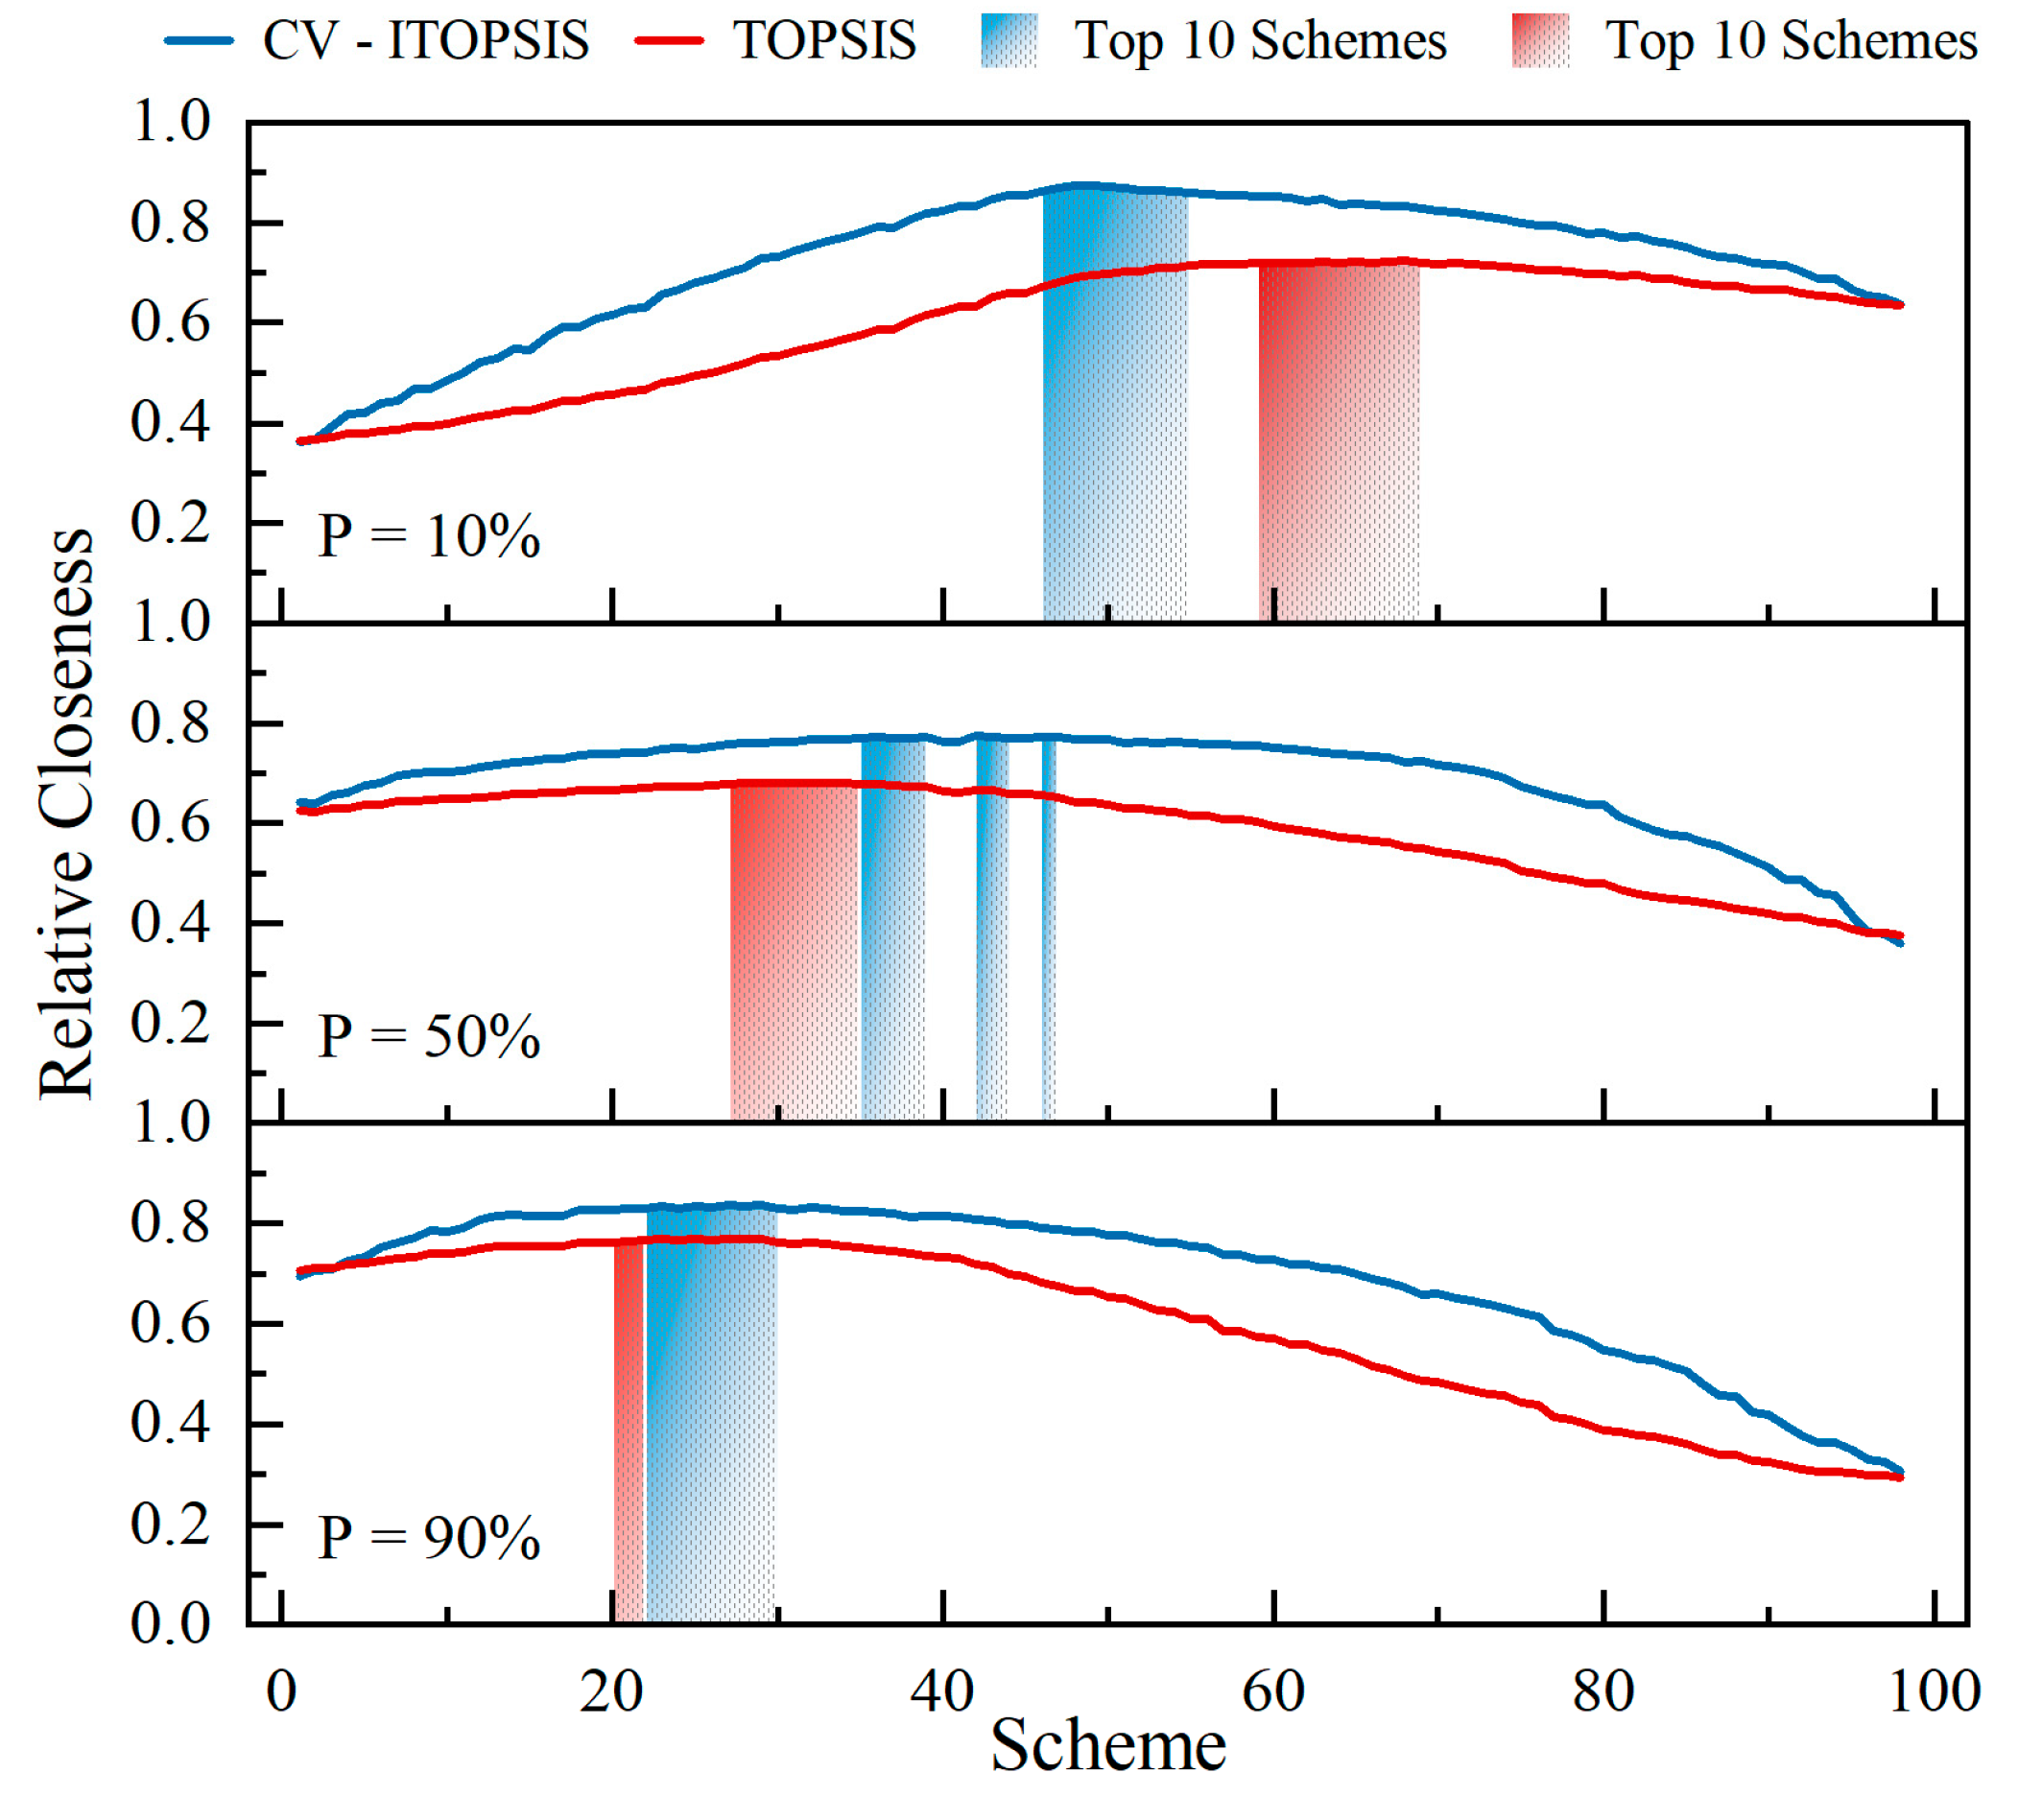
Usually, measures to raise the water level are taken to improve the economic benefits of energy generation in reservoirs. However, this has also led to a decrease in the ecological flow of the downstream river channel, which is detrimental to ecological benefits. Theoretically, each solution in the non-inferior solution set of the Pareto front curve could be used as an alternative operational scheme. However, from a practical perspective, determining the most balanced operational scheme between energy generation and ecological benefits was difficult. From the perspective of specific indicators, the energy generation and ecological objectives of Wan’an Reservoir were contradictory and had a certain negative correlation. The correlation coefficients between the objectives for the three typical years under wet, normal, and dry conditions are listed in Table 4. If the traditional TOPSIS method using the Euclidean distance were used to calculate the closeness between schemes, the correlation between indicators could be fully considered, and the overlapping information between indicators would impact decision-making. Therefore, to comprehensively evaluate the advantages and disadvantages of multi-objective ecological operation schemes for Wan’an Reservoir, this study used a CV-ITOPSIS method to prefer the schemes based on the correlation between decision indicators. The CV method objectively assigned weights to each evaluation indicator based on the degree of differentiation between the current values and unit mean. CV is a measure of relative volatility that can solve the problem of dimensionality. In addition, it can effectively test whether there were significant differences in the data between different indicators, and the greater the degree of difference, the heavier the weighting. The weight calculation results of the CV method are listed in Table 4.
As the inflow runoff decreased, the proportion of the weight between the two indicators showed that the weight of the annual energy generation gradually declined, and the weight of the annual average ecological guarantee degree gradually increased. The scheduling results from Model 1 and Model 2 with single objectives also suggest that, in situations of sufficient inflow, there is a great guarantee for ecological benefits, while the reservoir tends to prioritize maximizing energy generation benefits. Conversely, when inflow is insufficient, reservoir management’s decisions should focus on enhancing ecological benefits. The reservoir needs to take measures to improve ecological benefits when there is insufficient inflow. Therefore, the weights assigned to each typical year in the decision-making process, as listed in Table 4, correspond to the actual operational situation, reflecting the superiority of the CV method. Based on the weight of each indicator determined above, the relative closeness of each evaluation scheme to the positive and negative ideal solutions was computed using the CV-ITOPSIS method. The evaluation results obtained using the TOPSIS method under the traditional Euclidean distance were compared, as shown in Figure 10.
(1)
The top ten schemes in the CV-ITOPSIS method for the three typical wet, normal, and dry years were stable around Scheme 50 and Scheme 40, and 25, respectively. In the case of sufficient incoming water, a series of schemes simultaneously consider both energy generation and ecological benefits. A series of schemes prioritized ecological benefits for normal and dry years with less incoming water. This decision aligns with the practical production requirements and reflects the applicability of the CV-ITOPSIS method. Furthermore, the optimal schemes for the three typical years correspond to or are close to the inflection point schemes of the Pareto front curve, indicating that the obtained decision schemes have reached a multi-objective equilibrium state and comply with the multi-objective conversion law.
(2)
In the decision results of the CV-ITOPSIS method, the decision results of the schemes before the optimal schemes were influenced by many factors, and the ranking of each scheme was closely related to the weight and degree of correlation between the evaluation system indicators. Following the optimal scheme, the relative closeness gradually decreased with an increase in energy generation, and the virtues or defect degrees of the schemes were mainly determined by the degree of ecological guarantee.
(3)
The optimal schemes and ranking results obtained using CV-ITOPSIS and traditional TOPSIS methods were not completely consistent. However, as can be seen from the top ten series of schemes, neither of the two decision-making methods recommends the schemes with the highest energy generation as the optimal schemes. This results from weighing the comprehensive benefits between the indicators, which reflects the rationality of applying multi-attribute decision-making methods to scheme evaluation. A correlation analysis of relative closeness under two decision-making methods was performed. Combining Table 4 and Figure 9, it can be observed that the evaluation results of the two methods show consistency in the overall trend. This indicates that the Mahalanobis distance calculation evaluation results retain TOPSIS’s good comprehensive evaluation performance while effectively weighting indicators and removing overlapping information between indicators.

5. Conclusions

In this study, three reservoir operation models that consider both energy generation and ecological water demand are constructed for Wan’an Reservoir in the middle and lower reaches of the Ganjiang River, and the models are solved using DE and the improved NSGA-II. Additionally, based on the multi-objective Pareto front curve, a CV-ITOPSIS method was constructed to recommend an optimal operation scheme. The entire study is based on the framework of the “objectives-modeling-constraints-optimization-schemes decision”. The main research results are as follows:
(1)
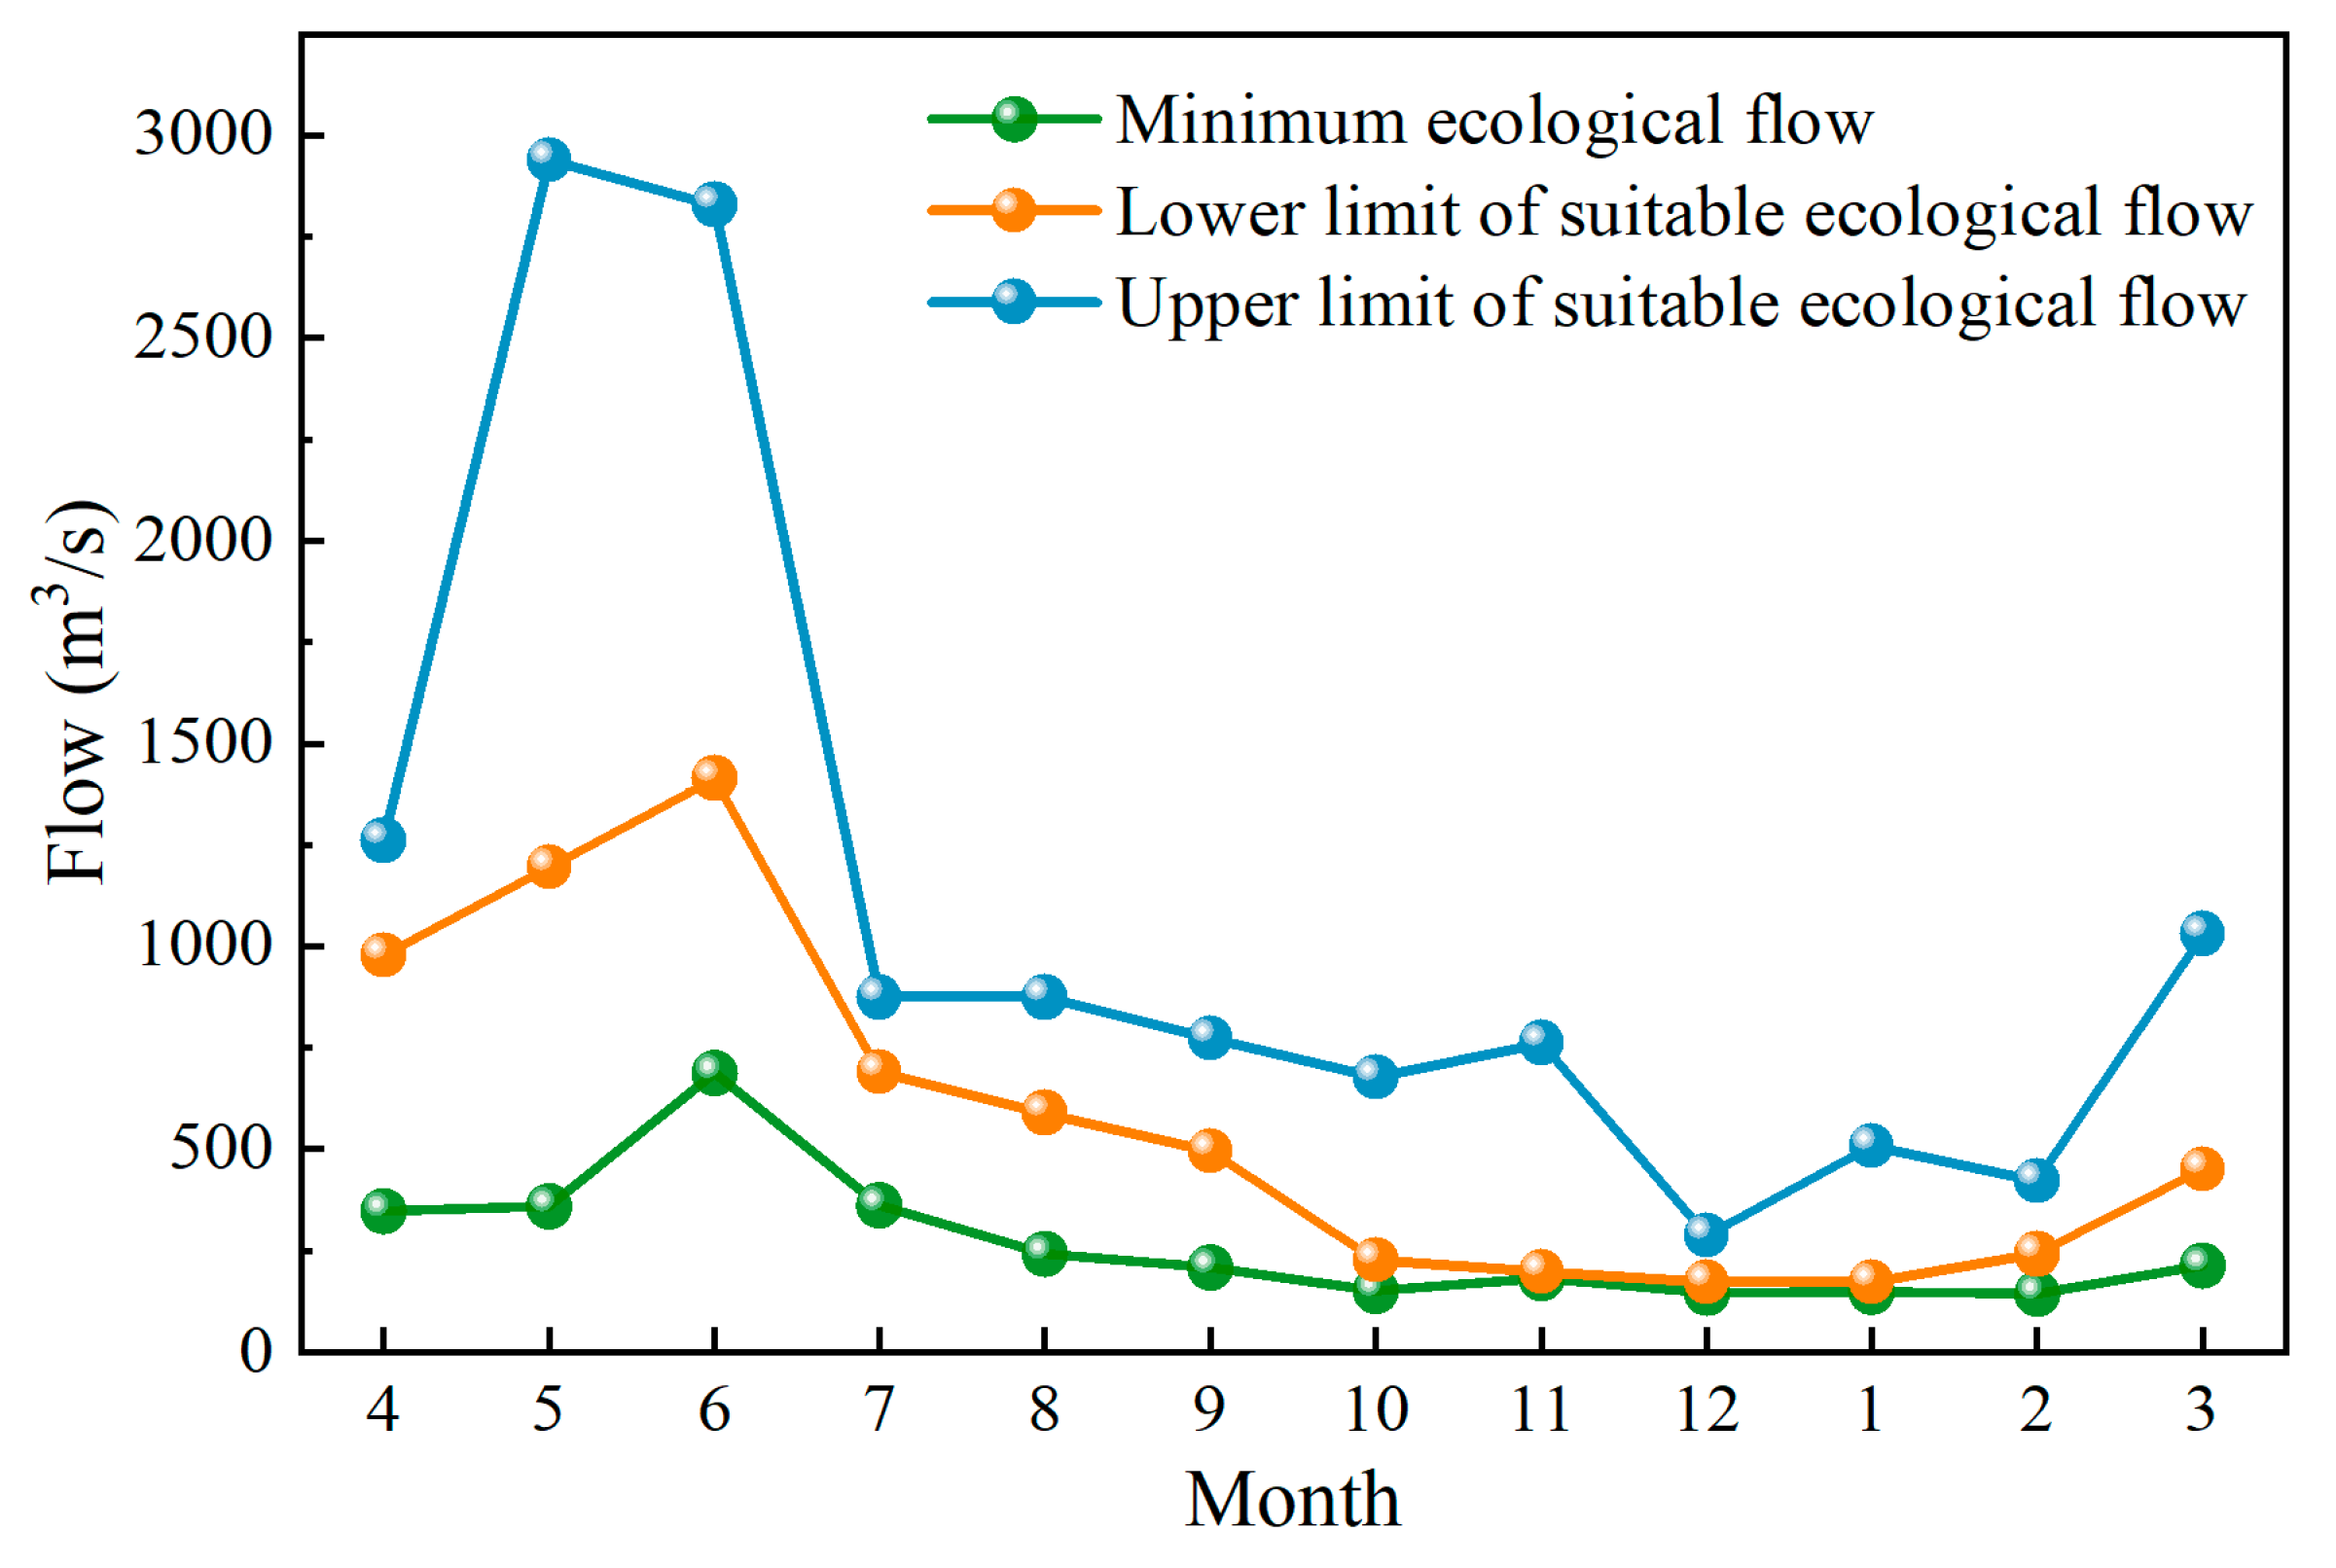
Two methods were used to diagnose the hydrological variations in the middle and lower reaches of the Ganjiang River. The results showed no mutation points in the 59-year historical runoff sequence of Dongbei Station. Based on this, the complete runoff sequence was used to calculate the minimum ecological flow and suitable ecological flow, and the hierarchical and phased ecological flow processes were obtained. Moreover, the degree of ecological guarantee was defined to construct the single- and multi-objective scheduling models.
(2)
Two single-objective optimal operation models were built with one maximizing energy generation and the other maximizing ecological guarantee degree, respectively. The comparison results revealed the competitive relationship between energy generation objective and ecological objective. A non-fitting curve method was used to determine the approximate inflection point of the Pareto front curve, and the curve was fitted linearly based on the approximate inflection point to obtain a conversion formula between the objectives. The results clarify the piecewise linear contradiction between the objectives of energy generation and ecology; that is, improving energy generation benefits will inevitably reduce ecological benefits. Moreover, as the frequency of the incoming water increases, the contradiction between the two objectives intensifies. Before the approximate inflection point, the head significantly influenced the conversion rate from the energy generation to ecology, while the discharge flows is the major influencing factor after the point. The non-inferior solution set and conversion formula for energy generation and ecology were obtained from the calculation results of single- and multi-objective operation models, which provide a suitable coordination scheme for the actual operation of reservoirs and watershed management.
(3)
A novel multi-attribute decision-making method, CV-TOPSIS, is constructed. Compared with the traditional decision-making method, this method fully considers the correlation between indicators while considering the degree of differentiation of indicator data. Moreover, it can recommend the optimal schemes from the multi-objective non-inferior solution set. The schemes chosen by this method comprehensively coordinate the competitive and synergistic relationship between energy generation and ecological objectives for the Ganjiang River Basin’s ecological optimization operation and decision-making. The decision-making results met the actual task requirements, which improved the reliability of the reservoir operation decisions.

Author Contributions

Z.L.: Investigation, Methodology, Writing—original draft, Visualization. L.M.: Writing—original draft, Writing—review & editing, Supervision. S.L.: Investigation, Writing—review & editing, Supervision. Y.Z.: Data processing, Data analysis, Visualization. T.L.: Data curation, Formal analysis. All authors have read and agreed to the published version of the manuscript.

Funding

This research was supported by the National Natural Science Foundation of China (No. 52379011, No. 51979114), the Key Project of the Natural Science Foundation of China (No. 52039004), the Fundamental Research Funds for the Central Universities (YCJJ20230570).

Data Availability Statement

Applicable on request.

Conflicts of Interest

The authors declare that they have no known competing financial interests or personal relationships that could have appeared to influence the work reported in this paper.

References

  1. Dorber, M.; Arvesen, A.; Gernaat, D.; Verones, F. Controlling biodiversity impacts of future global hydropower reservoirs by strategic site selection. Sci. Rep. 2020, 10, 21777. [Google Scholar] [CrossRef]
  2. Yujun, Y.; Yanning, G.; Shanghong, Z. The impact of dams on the river connectivity of the two largest river basins in China. River Res. Appl. 2021, 38, 185–193. [Google Scholar] [CrossRef]
  3. Su, W.; Wang, S.; Liu, C.; Liu, X.; Chen, K.; Fan, H.; Wang, L.; Jiang, Z.; Li, B.; Hu, B. Construction and Application of a Water Quality Risk Sensitive Area Identification System in the Wudongde Reservoir. Water 2022, 14, 962. [Google Scholar] [CrossRef]
  4. Ma, T.; Shi, L.; Li, Z.; Wu, C.; Huang, Y.; Lu, X. Eutrophication trend analysis and forewarning model construction of water source reservoirs: Gaozhou Reservoir, China. Ecohydrology 2021, 15, e2371. [Google Scholar] [CrossRef]
  5. Jiang, Z.; Duan, J.; Xiao, Y.; He, S. Elite collaborative search algorithm and its application in power generation scheduling optimization of cascade reservoirs. J. Hydrol. 2022, 615, 128684. [Google Scholar] [CrossRef]
  6. Bradford, A. An Ecological Flow Assessment Framework: Building a Bridge to Implementation in Canada. Can. Water Resour. J. 2008, 33, 215–232. [Google Scholar] [CrossRef]
  7. Yu, Z.; Zhang, J.; Zhao, J.; Peng, W.; Fu, Y.; Wang, Q.; Zhang, Y. A new method for calculating the downstream ecological flow of diversion-type small hydropower stations. Ecol. Indic. 2021, 125, 107530. [Google Scholar] [CrossRef]
  8. Zhang, C.; Wan, Z.; Jing, Z.; Zhang, S.; Zhao, Y. Calculation of ecological water requirements of urban rivers using a hydrological model: A case study of Beiyun River. J. Clean. Prod. 2020, 262, 121368. [Google Scholar] [CrossRef]
  9. Ouyang, Y. A potential approach for low flow selection in water resource supply and management. J. Hydrol. 2012, 454, 56–63. [Google Scholar] [CrossRef]
  10. Mao, Y.; Huang, J.; Li, R.; Huang, W.; Wang, Q.; Feng, J. Optimal reservoir operation based on hydrological and hydraulic methods incorporating the multiple water replenishment process. J. Clean. Prod. 2020, 276, 124154. [Google Scholar] [CrossRef]
  11. Gao, C.; Hao, M.; Song, L.; Rong, W.; Shao, S.; Huang, Y.; Guo, Y.; Liu, X. Comparative study on the calculation methods of ecological base flow in a mountainous river. Front. Environ. Sci. 2022, 10, 1241. [Google Scholar] [CrossRef]
  12. Wang, L.; Mo, K.; Chen, Q.; Zhang, J.; Xia, J.; Lin, Y. Estimating ecological flows for fish overwintering in plain rivers using a method based on water temperature and critical water depth. Ecohydrology 2019, 12, e2098. [Google Scholar] [CrossRef]
  13. Wang, L.; Chen, Q.; Zhang, J.; Xia, J.; Mo, K.; Wang, J. Incorporating fish habitat requirements of the complete life cycle into ecological flow regime estimation of rivers. Ecohydrology 2020, 13, e2204. [Google Scholar] [CrossRef]
  14. Yin, Z.J.; Yang, C.H.; Xu, J.J. Ecological regulation of cascade dams in the lower Jinsha river under different ecological flow constraints. J. Hydroelectr. Eng. 2013, 32, 66–70+81. [Google Scholar]
  15. Li, Z.; Cai, S.; Lei, X.; Wang, L. Diagnosis of Basin Eco-Hydrological Variation Based on Index Sensitivity of Similar Years: A Case Study in the Hanjiang River Basin. Water 2022, 14, 1931. [Google Scholar] [CrossRef]
  16. He, Z.; Wang, C.; Wang, Y.; Zhang, H.; Yin, H. An Efficient Optimization Method for Long-term Power Generation Scheduling of Hydropower Station: Improved Dynamic Programming with a Relaxation Strategy. Water Resour. Manag. 2022, 36, 1481–1497. [Google Scholar] [CrossRef]
  17. Zhu, D.; Mei, Y.; Xu, X.; Liu, Z.; Wu, Z.; Cai, H. Optimal operation of a parallel multireservoir system for flood control using a stagewise compensation method. Water Resour. Manag. 2021, 35, 1689–1710. [Google Scholar] [CrossRef]
  18. Wabela, K.; Hammani, A.; Abdelilah, T.; Tekleab, S.; El-Ayachi, M. Optimization of Irrigation Scheduling for Improved Irrigation Water Management in Bilate Watershed, Rift Valley, Ethiopia. Water 2022, 14, 3960. [Google Scholar] [CrossRef]
  19. Kumar, D.N.; Reddy, M.J. Ant colony optimization for multi-purpose reservoir operation. Water Resour. Manag. 2006, 20, 879–898. [Google Scholar] [CrossRef]
  20. Dong, Z.; Ni, X.; Chen, M.; Yao, H.; Jia, W.; Zhong, J.; Ren, L. Time-varying decision-making method for multi-objective regulation of water resources. Water Resour. Manag. 2021, 35, 3411–3430. [Google Scholar] [CrossRef]
  21. Dong, W.S.; Wang, H. Study for modeling and solving method of water resources optimizing allocation under considering uncertainties. Appl. Mech. Mater. 2012, 212–213, 554–559. [Google Scholar] [CrossRef]
  22. Zhang, X.; Luo, J.; Sun, X.; Xie, J. Optimal reservoir flood operation using a decomposition-based multi-objective evolutionary algorithm. Eng. Optim. 2018, 51, 42–62. [Google Scholar] [CrossRef]
  23. Bai, T.; Ji, H.-W.; Yang, W.-W.; Huang, Q.; Liu, X. Study on multi-objective optimal operation of Xiaolangdi Reservoir based on NNIA algorithm. Phys. Chem. Earth Parts A/B/C 2022, 126, 103142. [Google Scholar] [CrossRef]
  24. Ni, X.; Dong, Z.; Xie, W.; Jia, W.; Duan, C.; Yao, H. Research on the Multi-Objective Cooperative Competition Mechanism of Jinsha River Downstream Cascade Reservoirs during the Flood Season Based on Optimized NSGA-III. Water 2019, 11, 849. [Google Scholar] [CrossRef]
  25. Yang, Z.; Yang, K.; Hu, H.; Su, L. The Cascade Reservoirs Multi-Objective Ecological Operation Optimization Considering Different Ecological Flow Demand. Water Resour. Manag. 2018, 33, 207–228. [Google Scholar] [CrossRef]
  26. Bai, T.; Li, L.; Yang, W.-W.; Chang, F.-J.; Huang, Q. Optimal dispatching scheme of multi-objective cascade reservoirs by parallel mechanism-optimization algorithms. J. Hydrol. 2022, 612, 128050. [Google Scholar] [CrossRef]
  27. Afshar, M.H.; Hajiabadi, R. A novel parallel cellular automata algorithm for multi-objective reservoir operation optimization. Water Resour. Manag. 2017, 32, 785–803. [Google Scholar] [CrossRef]
  28. Ai, X.; Ding, J.; Yang, B.; Guo, J.; Chen, S.; Mu, Z. Research on Multi-Objective Decision Making of Hydropower Station Group Based on CRITIC-TOPSIS Method. In Proceedings of the Applications of Decision Science in Management: Proceedings of International Conference on Decision Science and Management (ICDSM 2022), Changsha, China, 7–9 January 2022; Springer: Berlin/Heidelberg, Germany, 2022. [Google Scholar]
  29. Wang, Q.; Zhou, J.; Huang, K.; Dai, L.; Zha, G.; Chen, L.; Qin, H. Risk assessment and decision-making based on mean-CVaR-entropy for flood control operation of large scale reservoirs. Water 2019, 11, 649. [Google Scholar] [CrossRef]
  30. Jia, B.; Simonovic, S.P.; Zhong, P.; Yu, Z. A multi-objective best compromise decision model for real-time flood mitigation operations of multi-reservoir system. Water Resour. Manag. 2016, 30, 3363–3387. [Google Scholar] [CrossRef]
  31. Dhillon, J.; Parti, S.; Kothari, D. Fuzzy decision making in multiobjective long-term scheduling of hydrothermal system. Int. J. Electr. Power Energy Syst. 2001, 23, 19–29. [Google Scholar] [CrossRef]
  32. Xu, H.; Ma, C.; Lian, J.; Xu, K.; Chaima, E. Urban flooding risk assessment based on an integrated k-means cluster algorithm and improved entropy weight method in the region of Haikou, China. J. Hydrol. 2018, 563, 975–986. [Google Scholar] [CrossRef]
  33. Chen, N.; Chen, L.; Ma, Y.; Chen, A. Regional disaster risk assessment of China based on self-organizing map: Clustering, visualization and ranking. Int. J. Disaster Risk Reduct. 2018, 33, 196–206. [Google Scholar] [CrossRef]
  34. Wu, Y.; Wang, L.; Zhang, Y.; Wu, J.; Ma, Q.; Yue, L. Application of Marginal Rate of Transformation in Decision Making of Multi-Objective Reservoir Optimal Operation Scheme. Sustainability 2021, 13, 1488. [Google Scholar] [CrossRef]
  35. Wei, N.; Yang, F.; Lu, K.; Xie, J.; Zhang, S. A Method of Multi-Objective Optimization and Multi-Attribute Decision-Making for Huangjinxia Reservoir. Appl. Sci. 2022, 12, 6300. [Google Scholar] [CrossRef]
  36. Wang, Z.-X.; Wang, Y.-Y. Evaluation of the provincial competitiveness of the Chinese high-tech industry using an improved TOPSIS method. Expert Syst. Appl. 2014, 41, 2824–2831. [Google Scholar] [CrossRef]
  37. Storn, R.; Price, K. Differential evolution—A simple and efficient heuristic for global optimization over continuous spaces. J. Glob. Optim. 1997, 11, 341–359. [Google Scholar] [CrossRef]
  38. He, Z.; Zhou, J.; Qin, H.; Jia, B.; Lu, C. Long-term joint scheduling of hydropower station group in the upper reaches of the Yangtze River using partition parameter adaptation differential evolution. Eng. Appl. Artif. Intell. 2019, 81, 1–13. [Google Scholar] [CrossRef]
  39. Bai, T.; Liu, X.; Ha, Y.-P.; Chang, J.-X.; Wu, L.-Z.; Wei, J.; Liu, J. Study on the Single-Multi-Objective Optimal Dispatch in the Middle and Lower Reaches of Yellow River for River Ecological Health. Water 2020, 12, 915. [Google Scholar] [CrossRef]
  40. Liu, X.; Yang, M.; Meng, X.; Wen, F.; Sun, G. Assessing the Impact of Reservoir Parameters on Runoff in the Yalong River Basin using the SWAT Model. Water 2019, 11, 643. [Google Scholar] [CrossRef]
  41. Du, J.; Zheng, D.; Xu, Y.; Hu, S.; Xu, C. Evaluating Functions of Reservoirs′ Storage Capacities and Locations on Daily Peak Attenuation for Ganjiang River Basin Using Xinanjiang Model. Chin. Geogr. Sci. 2016, 26, 789–802. [Google Scholar] [CrossRef]
  42. Richter, B.D.; Warner, A.T.; Meyer, J.L.; Lutz, K. A collaborative and adaptive process for developing environmental flow recommendations. River Res. Appl. 2006, 22, 297–318. [Google Scholar] [CrossRef]
  43. Huang, Y.; Huang, B.; Qin, T.; Nie, H.; Wang, J.; Li, X.; Shen, Z. Assessment of Hydrological Changes and Their Influence on the Aquatic Ecology over the last 58 Years in Ganjiang Basin, China. Sustainability 2019, 11, 4882. [Google Scholar] [CrossRef]
  44. Sinnathamby, S.; Douglas-Mankin, K.R.; Muche, M.E.; Hutchinson, S.L.; Anandhi, A. Ecohydrological Index, Native Fish, and Climate Trends and Relationships in the Kansas River Basin. Ecohydrology 2017, 11, 1909. [Google Scholar] [CrossRef] [PubMed]
  45. Feng, B.; Zhang, M.; Chen, J.; Xu, J.; Xiao, B.; Zhou, M.; Zhang, M. Reduction in the phytoplankton index of biotic integrity in riverine ecosystems driven by industrial activities, dam construction and mining: A case study in the Ganjiang River, China. Ecol. Indic. 2020, 120, 106907. [Google Scholar] [CrossRef]
  46. Zhu, D.; Chen, H.; Zhou, Y.; Xu, X.; Guo, S.; Chang, F.-J.; Xu, C.-Y. Exploring a multi-objective cluster-decomposition framework for optimizing flood control operation rules of cascade reservoirs in a river basin. J. Hydrol. 2022, 614, 128602. [Google Scholar] [CrossRef]
  47. Ali, R.; Kuriqi, A.; Abubaker, S.; Kisi, O. Long-Term Trends and Seasonality Detection of the Observed Flow in Yangtze River Using Mann-Kendall and Sen’s Innovative Trend Method. Water 2019, 11, 1855. [Google Scholar] [CrossRef]
  48. Li, F.-F.; Wang, Z.-Y.; Zhao, X.; Xie, E.; Qiu, J. Decomposition-ANN Methods for Long-Term Discharge Prediction Based on Fisher’s Ordered Clustering with MESA. Water Resour. Manag. 2019, 33, 3095–3110. [Google Scholar] [CrossRef]
  49. Chen, E.; Kelton, W. Determining simulation run length with the runs test. Simul. Model. Pract. Theory 2003, 11, 237–250. [Google Scholar] [CrossRef]
  50. Bai, T.; Xu, Y.; Sun, X.G.; Wei, J.; Pan, X.Y. Study on Multi—Objective Ecological Scheduling of Guanting Reservoir. Water Resour. Prot. 2023, 39, 101–108+124. [Google Scholar] [CrossRef]
  51. Deb, K.; Pratap, A.; Agarwal, S.; Meyarivan, T. A fast and elitist multiobjective genetic algorithm: NSGA-II. IEEE Trans. Evol. Comput. 2002, 6, 182–197. [Google Scholar] [CrossRef]
  52. Li, T.; Tian, X. The Algorithm and application of discrete inflection point. Microcomput. Inf. 2007, 193, 248–249+254. [Google Scholar] [CrossRef]
  53. Liu, S.; Zhang, Q.; Xie, Y.; Xu, P.; Du, H. Evaluation of Minimum and Suitable Ecological Flows of an Inland Basin in China Considering Hydrological Variation. Water 2023, 15, 649. [Google Scholar] [CrossRef]
  54. Guan, X.; Zhang, Y.; Meng, Y.; Liu, Y.; Yan, D. Study on the theories and methods of ecological flow guarantee rate index under different time scales. Sci. Total. Environ. 2021, 771, 145378. [Google Scholar] [CrossRef] [PubMed]
  55. Xiao, Y.; Zhang, X.; Wan, H.; Wang, Y.; Liu, C.; Xia, J. Spatial and temporal characteristics of rainfall across Ganjiang River Basin in China. Meteorol. Atmos. Phys. 2015, 128, 167–179. [Google Scholar] [CrossRef]
Figure 1. General situation of the middle and lower reaches of the Ganjiang River.
Water 16 00970 g001
Figure 2. Typical monthly average natural runoff of Wan’an Reservoir.
Water 16 00970 g002
Figure 3. Schematic diagram of inflection point.
Water 16 00970 g003
Figure 4. Statistics curve based on Mann–Kendall method for the historical runoff sequences.
Water 16 00970 g004
Figure 5. S n ( τ ) change process based on ordered cluster method for the historical runoff sequences.
Water 16 00970 g005
Figure 6. Ecological discharge process of Wan’an Reservoir.
Water 16 00970 g006
Figure 7. Variation of water level in Wan’an Reservoir in typical years.
Water 16 00970 g007
Figure 8. Variation of the discharge of Wan’an Reservoir in typical years.
Water 16 00970 g008
Figure 9. Multi-objective Pareto curve in a typical year.
Water 16 00970 g009
Figure 10. Scheme set relative closeness ranking result.
Water 16 00970 g010
Table 1. Results of run test method.
Hydrologic StationMutation PointRun
Number r
Statistics
Z
p Value α Z α / 2 Significance Level
Dongbei
Station
196330.1890.8500.051.96Not significant
197350.3130.7540.051.96Not significant
199730.1890.8500.051.96Not significant
Table 2. Analysis of energy generation and ecological guarantee in typical years.
Wet YearNormal YearDry Year
Model 1Model 2Model 1Model 2Model 1Model 2
Annual energy generation/104 kW·h21.9720.7615.0314.2111.5310.95
Annual average ecological guarantee degree/%94.2397.1776.5384.2559.9468.01
Number of months of ecological guarantee101271035
Table 3. The conversion formula between the targets of each typical year.
FrequencyFormula 1Inflection Point 1Formula 2Inflection Point 2Formula 3
p = 10%y = 111.81 − 0.7×x(21.6, 96.7)y = 227.1 − 6.04×x------
p = 50%y = 170.35 − 6.04×x(14.9, 79.9)y = 478.73 − 26.75×x------
p = 90%y = 81.8 − 1.27×x(11.1, 67.7)y = −230.38 − 14.58×x(11.5, 62.4)y = 653.62 − 51.49×x
Table 4. Index weighting and correlation coefficient.
p = 10%p = 50%p = 90%
Weight of annual energy generation/ω10.6330.3920.280
Weight of annual average ecological guarantee degree/ω20.3670.6080.720
Correlation coefficient between objectives/ρ−0.890−0.955−0.955
Correlation coefficient of Cj sequence between methods/ρ0.9760.8850.949
Disclaimer/Publisher’s Note: The statements, opinions and data contained in all publications are solely those of the individual author(s) and contributor(s) and not of MDPI and/or the editor(s). MDPI and/or the editor(s) disclaim responsibility for any injury to people or property resulting from any ideas, methods, instructions or products referred to in the content.

