Abstract
Efficient means for measuring the abundance and species composition of phytoplankton in situ continue to pose a big challenge to scientists. Hitherto, analyses and interpretations have been based mainly on small numbers of data acquired from microscopic examinations of water samples. Hence, information on devices facilitating such measurements is highly desirable. This paper examines the opportunities offered by the LISST-100X instrument for measuring in situ the concentrations and spatially variable biovolumes of a species dominant in the southern Baltic during the autumnal bloom. Microscopic analysis of phytoplankton in water sampled from different locations in the southern Baltic confirmed earlier results, indicating that this bloom was due to the overriding prevalence of one microplankton diatom species—Coscinodiscus granii. Combining the microscopic measurements of C. granii cell sizes with the size distribution ranges employed by the LISST-100X yielded equivalent spherical diameters (EDSs) ranging from 47.4 to 188.0 µm, with maxima in the 78.4–92.6 and 92.6–109 ranges. Comparative analysis of the particle size distribution (PSD) spectra was used to separate the abundance of C. granii from the total suspended particulate matter (SPM). Spatial in situ measurements in 2012 and 2014 of C. granii concentrations in surface waters showed that both its abundance and its percentage contribution to the total SPM were highly variable. Over a distance of several km, these concentrations varied from values close to zero to 0.2 µL L−1 in 2012 and from 0.3 to 0.9 µL L−1 in 2014, whereas the percentage in the total SPM was found to vary locally from a few to c. 50%. The proposed method and results demonstrate the success of the LISST-100X instrument in detecting size and volume concentrations of phytoplankton in size classes ranging from 1.25 to 250 μm. However, the correct interpretation of LISST data requires that the dominant phytoplankton species concentration in the suspensions be large enough for the signal (peak) to be readily visible against the background PSD of other SPM.
1. Introduction
Phytoplankton is a key component of the marine food web and plays an important role in shaping the ecosystem of the Baltic Sea. The function of the pelagic habitat is not only dependent on productivity but also on the species composition and size structure of the system. The major groups of phytoplankton in the Baltic Sea are diatoms, dinoflagellates and cyanobacteria, together with the common ciliate species Mesodinium rubrum, all with different functions in the system. The seasonal succession mechanisms of phytoplankton have been quite well identified in both fresh and sea waters [1,2,3,4,5,6]. Every year, regular cyclic changes in the biomass and taxonomic composition of phytoplankton assemblages are recorded in Baltic Sea waters. However, the spatial and temporal variability of individual phytoplankton groups is not the same in different regions of the Baltic Sea. Depending on the season and the availability of nutrients, blooms of cyanobacteria, dinoflagellates, chlorophytes and diatoms (Bacillariophyceae) can occur [7,8,9,10,11,12,13,14,15,16].
Advances in quantitative studies of phytoplankton have revealed ecological patterns in its distribution in the marine environment. In this context, several methods are currently in use. The usual and most precise technique is to count, under a microscope, all the individuals present in a given volume of water and then to estimate the biomass of each taxon. However, phytoplankton concentrations are highly variable in time and space, and so are the dynamics of their changes. Therefore, routine microscopic analyses to evaluate their dimensions, abundance and species composition by examining water samples taken from specific locations by no means guarantee results adequately reflecting the real distributions of these particles in the water. This method, moreover, is extremely labour-intensive, time-consuming and costly, so usually only a small number of samples is collected for analysis. A possible solution to this problem is to use state-of-the-art optical instruments permitting in situ measurements to be made with a high frequency. One such instrument for measuring the concentration and particle size distribution (PSD) of suspended particulate matter (SPM) is the LISST-100X PSD analyser. However, its application requires a certain expertise if the results are to be correctly interpreted. The main difficulty as regards interpretation emerges from the impossibility of separating phytoplankton from other SPM, such as terrestrial detritus and mineral particles, very large quantities of which are carried into the Baltic by rivers and other watercourses, e.g., [17,18,19]. Another limitation of this device relates to the highly irregular shapes of phytoplankton suspensions: these can be extremely variable, so one cannot talk about their diameters in the literal sense of the word. In an attempt to address this problem, the equivalent spherical diameter (ESD) has been introduced. However, different instruments can variously interpret ESDs, particularly when the particles are not spherical [20,21,22]. These limitations notwithstanding, this instrument is perfectly suitable for determining the PSDs of phytoplankton [22,23], bacteria [24,25] and other SPM [26,27,28]. To date, no in situ measurements of the PSDs and concentrations of phytoplankton using the LISSTA-100X have been carried out in the Baltic Sea. However, since the succession of species in the Baltic is both predictable and repeatable, the LISSTA-100X is eminently suitable for monitoring this marine ecosystem.
The main aim of this research was to investigate the possibilities of using the LISST-100X for detecting the autumnal concentrations of phytoplankton in Baltic waters due to the evident preponderance during this season of one particular species, namely, Coscinodiscus granii. Further aims were to compare the PSDs obtained with the LISSTA-100X with those acquired from microscopic measurements and to make an assessment of the spatial and temporal variability of the dominant autumn species, C. granii.
2. Materials and Methods
2.1. Study Area
The experimental material was collected during an autumn cruise of the research vessel s/y Oceania in different regions of the southern Baltic Sea in 2012 and during research cruises on the fishing vessel Sea Angel in southern Baltic coastal waters in 2014. The study area covered the open waters of the southern Baltic as well as the coastal regions of the Gulf of Gdańsk. The exact positions of the sampling stations are shown in Figure 1.
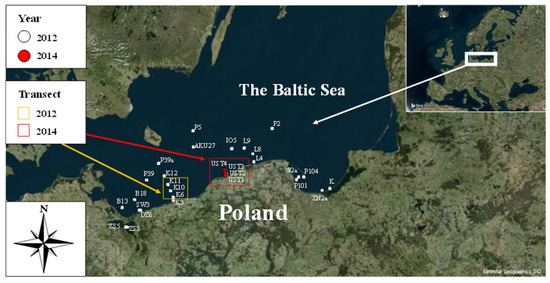
Figure 1.
Location of stations and transects where concentration of Coscinodiscus granii in situ measurements were conducted within the periods 2012 and 2014 in the waters of the southern Baltic Sea.
In 2012 and 2014, the water for continuous measurements (along transects) was sampled from a surface layer and then pumped through a hose to the LISST instrument installed on the deck. At the same time, surface water was sampled at selected stations and immediately preserved in Lugol’s solution for microscopic analysis.
In addition, data gathered during a cruise in 2011 were used to verify the species composition and the ESDs of Coscinodiscus granii (Table 1). Material for the quantitative and qualitative analysis of phytoplankton was obtained from a total of 49 sampling stations.

Table 1.
Specification of empirical material collected in autumn in the southern Baltic in 2011, 2012 and 2014 for species identification.
At each station, we measured: water temperature and salinity. These have been performed with the Multiparameter Water Quality Sonde (YSI 6600 V2, YSI Incorporated, Yellow Springs, OH, USA).
2.2. Methods
During the cruises, the volume concentration of marine SPM was measured continuously using a LISST-100X type B laser instrument (Sequoia Scientific, Inc., Bellevue, WA, USA). This device measures volume concentrations in 32 size classes, divided logarithmically from 1.25 to 250 µm, using small-angle forward-scattering laser diffraction. The scattered light is measured in 32 size bins using a red laser diode at 670 nm and a 32-ring silicon detector. At these small angles, laser diffraction is unaffected by the composition of particles, because light scattering is determined almost entirely by light diffracted by the particle. With the software provided by the manufacturers, the scattering intensities measured by the detector are mathematically inverted to obtain the particle volume concentration, assuming that the particles are spheres. Detailed information on the operation and specifications of the LISST-100X is given in Agrawal and Pottsmith [29].
Sea water at all the sampling stations was also taken for the microscopic analysis of phytoplankton. The samples were fixed with Lugol’s solution immediately after collection [29] and stored in the dark at a temperature of 4 °C until analysis. The cells were measured and the qualitative and quantitative analyses of the phytoplankton were carried out in accordance with Utermöhl’s method [30] using an OLYMPUS CKX41 (Olympus Soft Imaging Solutions GmbH, Münster, Germany) inverted microscope. The cells were counted on the basis of the procedure given in the Manual for Marine Monitoring in the COMBINE Programme of HELCOM [31]. During the microscopic analysis, individual phytoplankton organisms were identified to the species or a higher systematic level [32]. The volume of each cell was calculated by comparing cells, chains and colonies to stereometric figures [33]. In addition, the length and width of each phytoplankton cell were measured under a microscope, and these dimensions were then used to calculate its surface area and ESD [22]. Jonasz [20], Jennings and Parslow [21] and Karp-Boss et al. [22] showed that the LISST-100X measurements were better correlated with ESDs. Different physical measurements are sensitive to different attributes of the particle (for example, whereas near-forward light scattering is sensitive to the particle’s cross-sectional area, electrical impedance is sensitive to the particle’s volume). In line with the results of those authors, we used ESDs for the LISST-100X. In this case, we calculate ESDs, the surface-equivalent spherical diameter of a sphere [22] from the formula:
The calculated ESDs were used for interpreting the empirical data obtained with the LISST-100X.
3. Results and Discussion
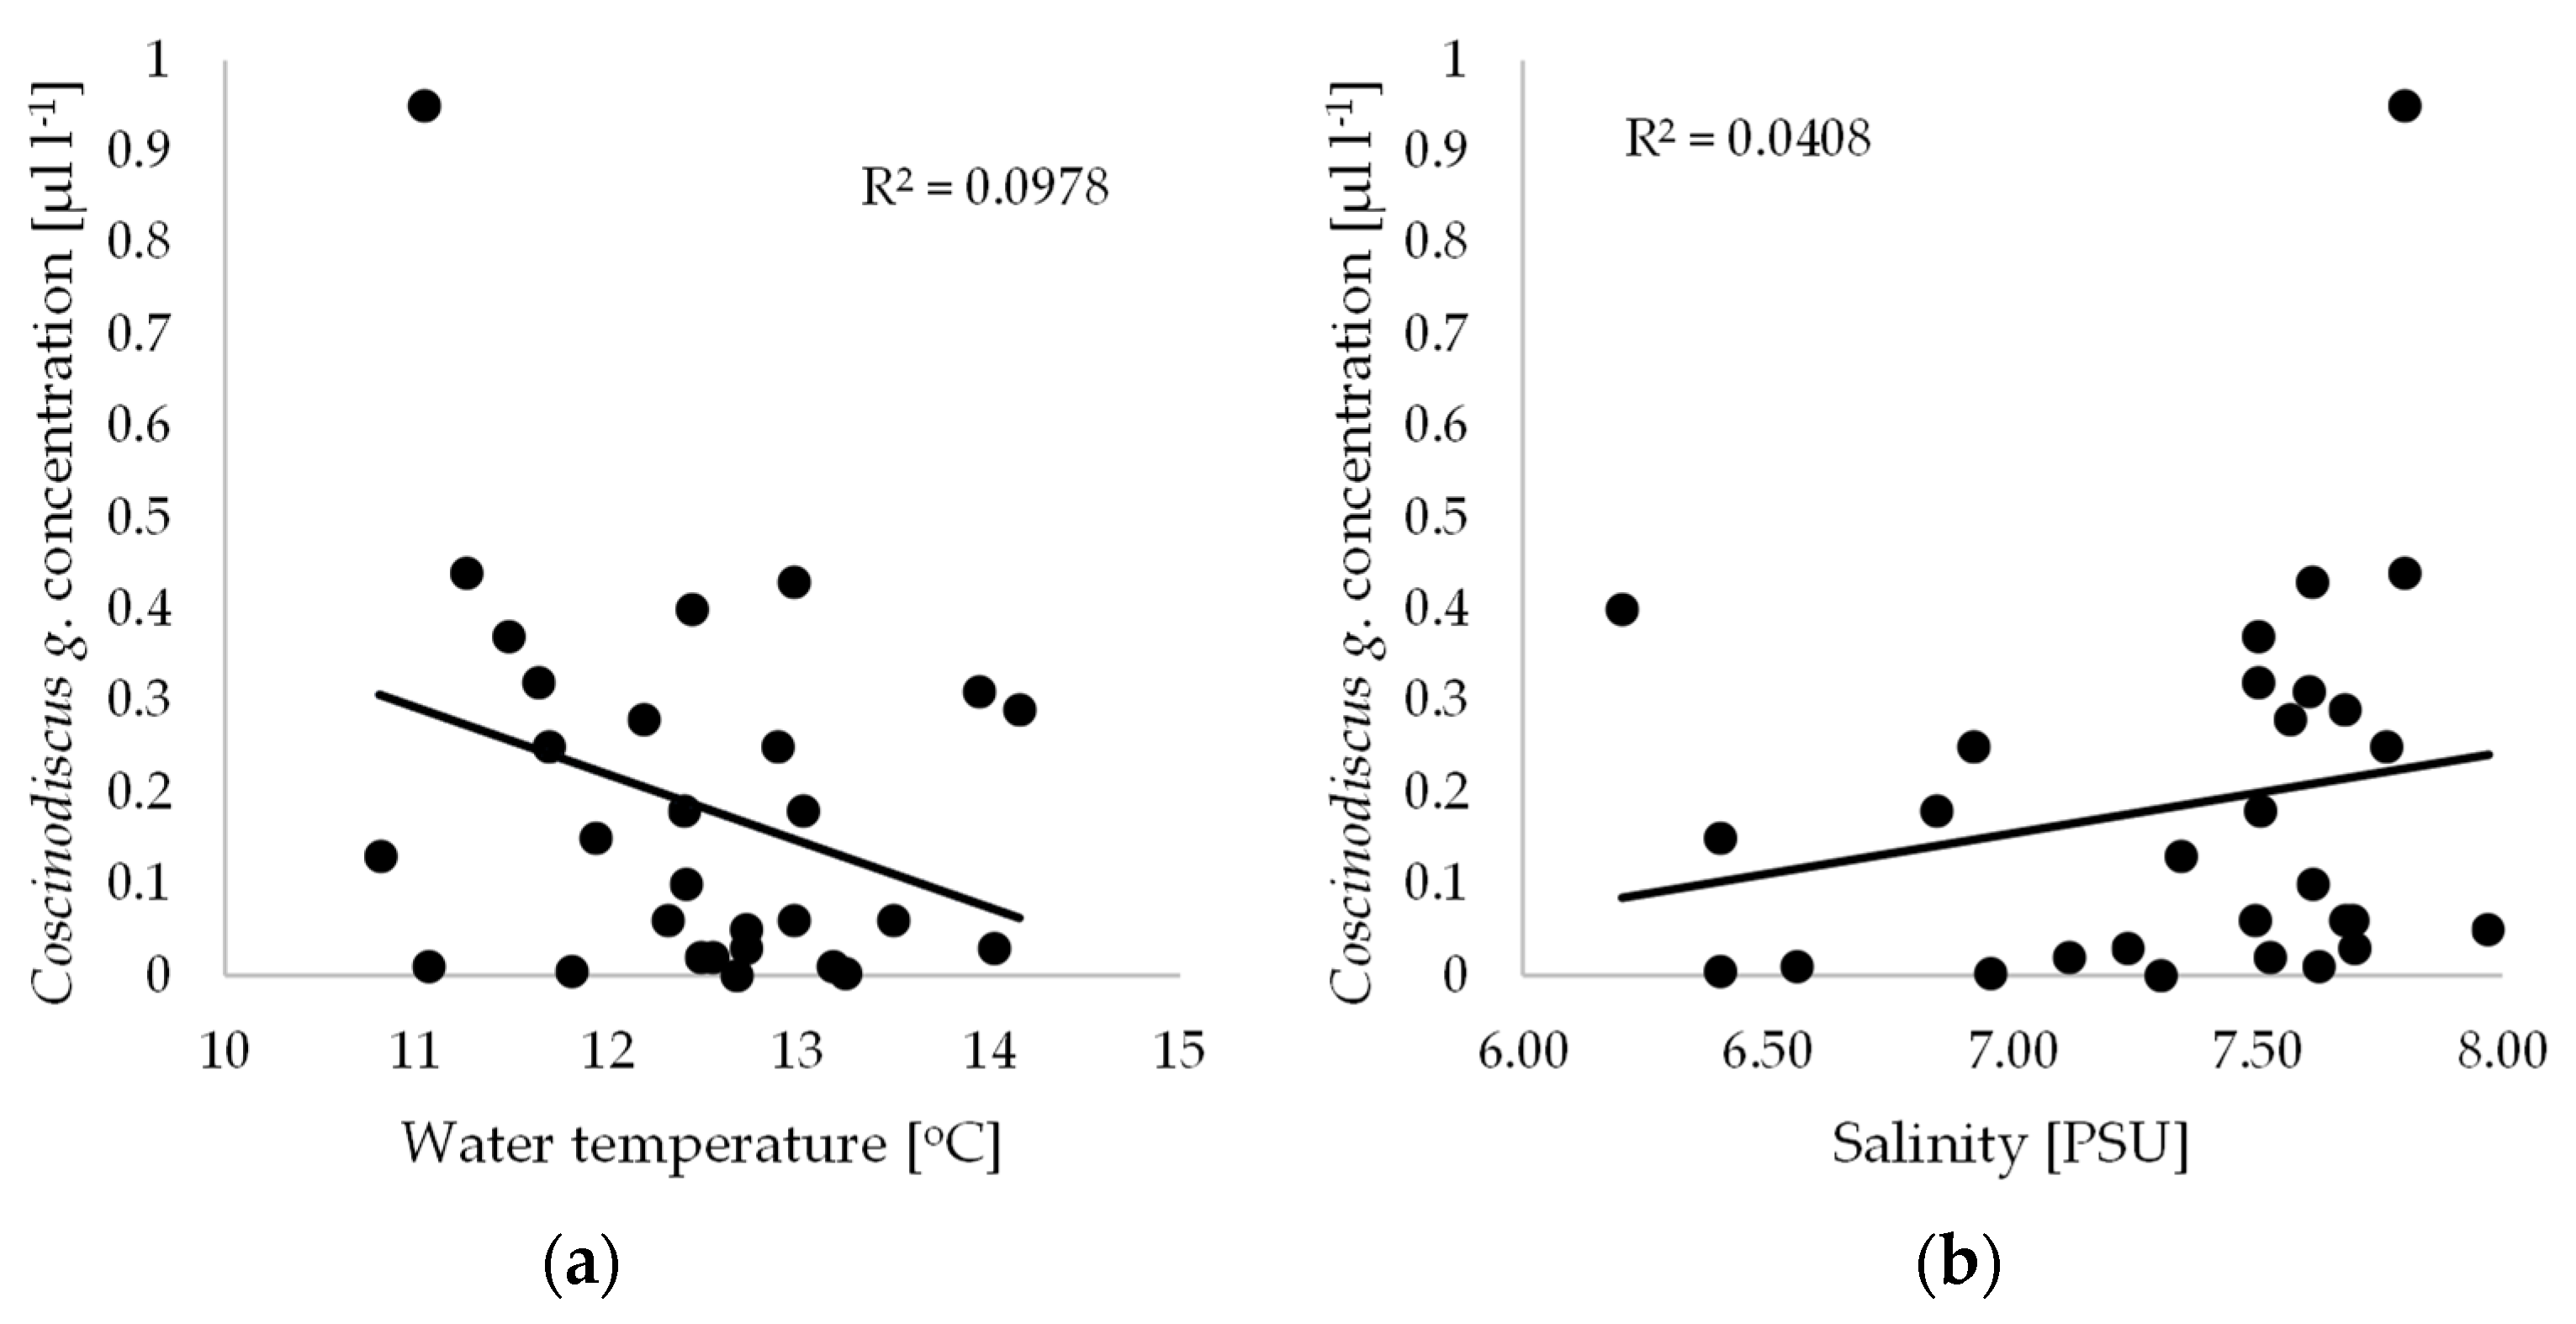
While the biomass of phytoplankton varies distinctly during the annual cycle, the year-on-year variation is not very great. Characteristically, these cycles exhibit two peaks when the biomass is higher: in spring, when blooms are very intense, and again in autumn [7,12]. This cyclic increase in phytoplankton in temperate climate zones is mediated by the seasonal variability in the physicochemical parameters of the water, e.g., nutrient content and light availability. Moreover, there is a distinct succession of species in the annual phytoplankton growth cycle. The dominance of any one species is usually restricted to a short, strictly defined period in the annual cycle, while the maximum biomass of a species can occur earlier or later, as dictated by differences in the weather conditions in particular years. Furthermore, the dominant species succession model outlined above may also be subject to modification due to increasing fertility, pollution of the sea and, finally, climate change. Warming is reflected in an increase in surface water temperature in summer and a decrease in the extent of ice cover in winter. Thus, the temperature of Baltic waters, which fluctuates both seasonally and over many years, is an important factor in determining the dominance of particular species. In addition, it is a fundamental ecological factor, conditioning the development of a given species through its specific thermal optimum. The second important factor for Baltic phytoplankton growth is salinity. In 2012, the average water temperature during the present study was 12.7 °C, while in 2014 it was 11.4 °C, while the average salinity value in 2012 was 7.4 PSU, and in 2014 it was 7.7 PSU. No statistically significant relationships were found between the Coscinodiscus granii concentration and water temperature or salinity. Low coefficients of determination (R2 = 0.0978 and 0.0408) indicate a lack of correlation between these quantities (Figure 2).
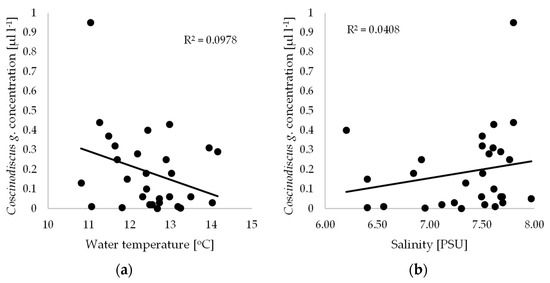
Figure 2.
Relationships between Coscinodiscus granii concentration measured by LISST-100X and (a) water temperature; (b) salinity.
Long-term studies have shown that the autumn peaks of phytoplankton biomass in Baltic waters are regularly dominated by centric Coscinodiscus species (Table 2).
Table 2.
Percentage of C. granii in total phytoplankton biomass in the different sea areas.
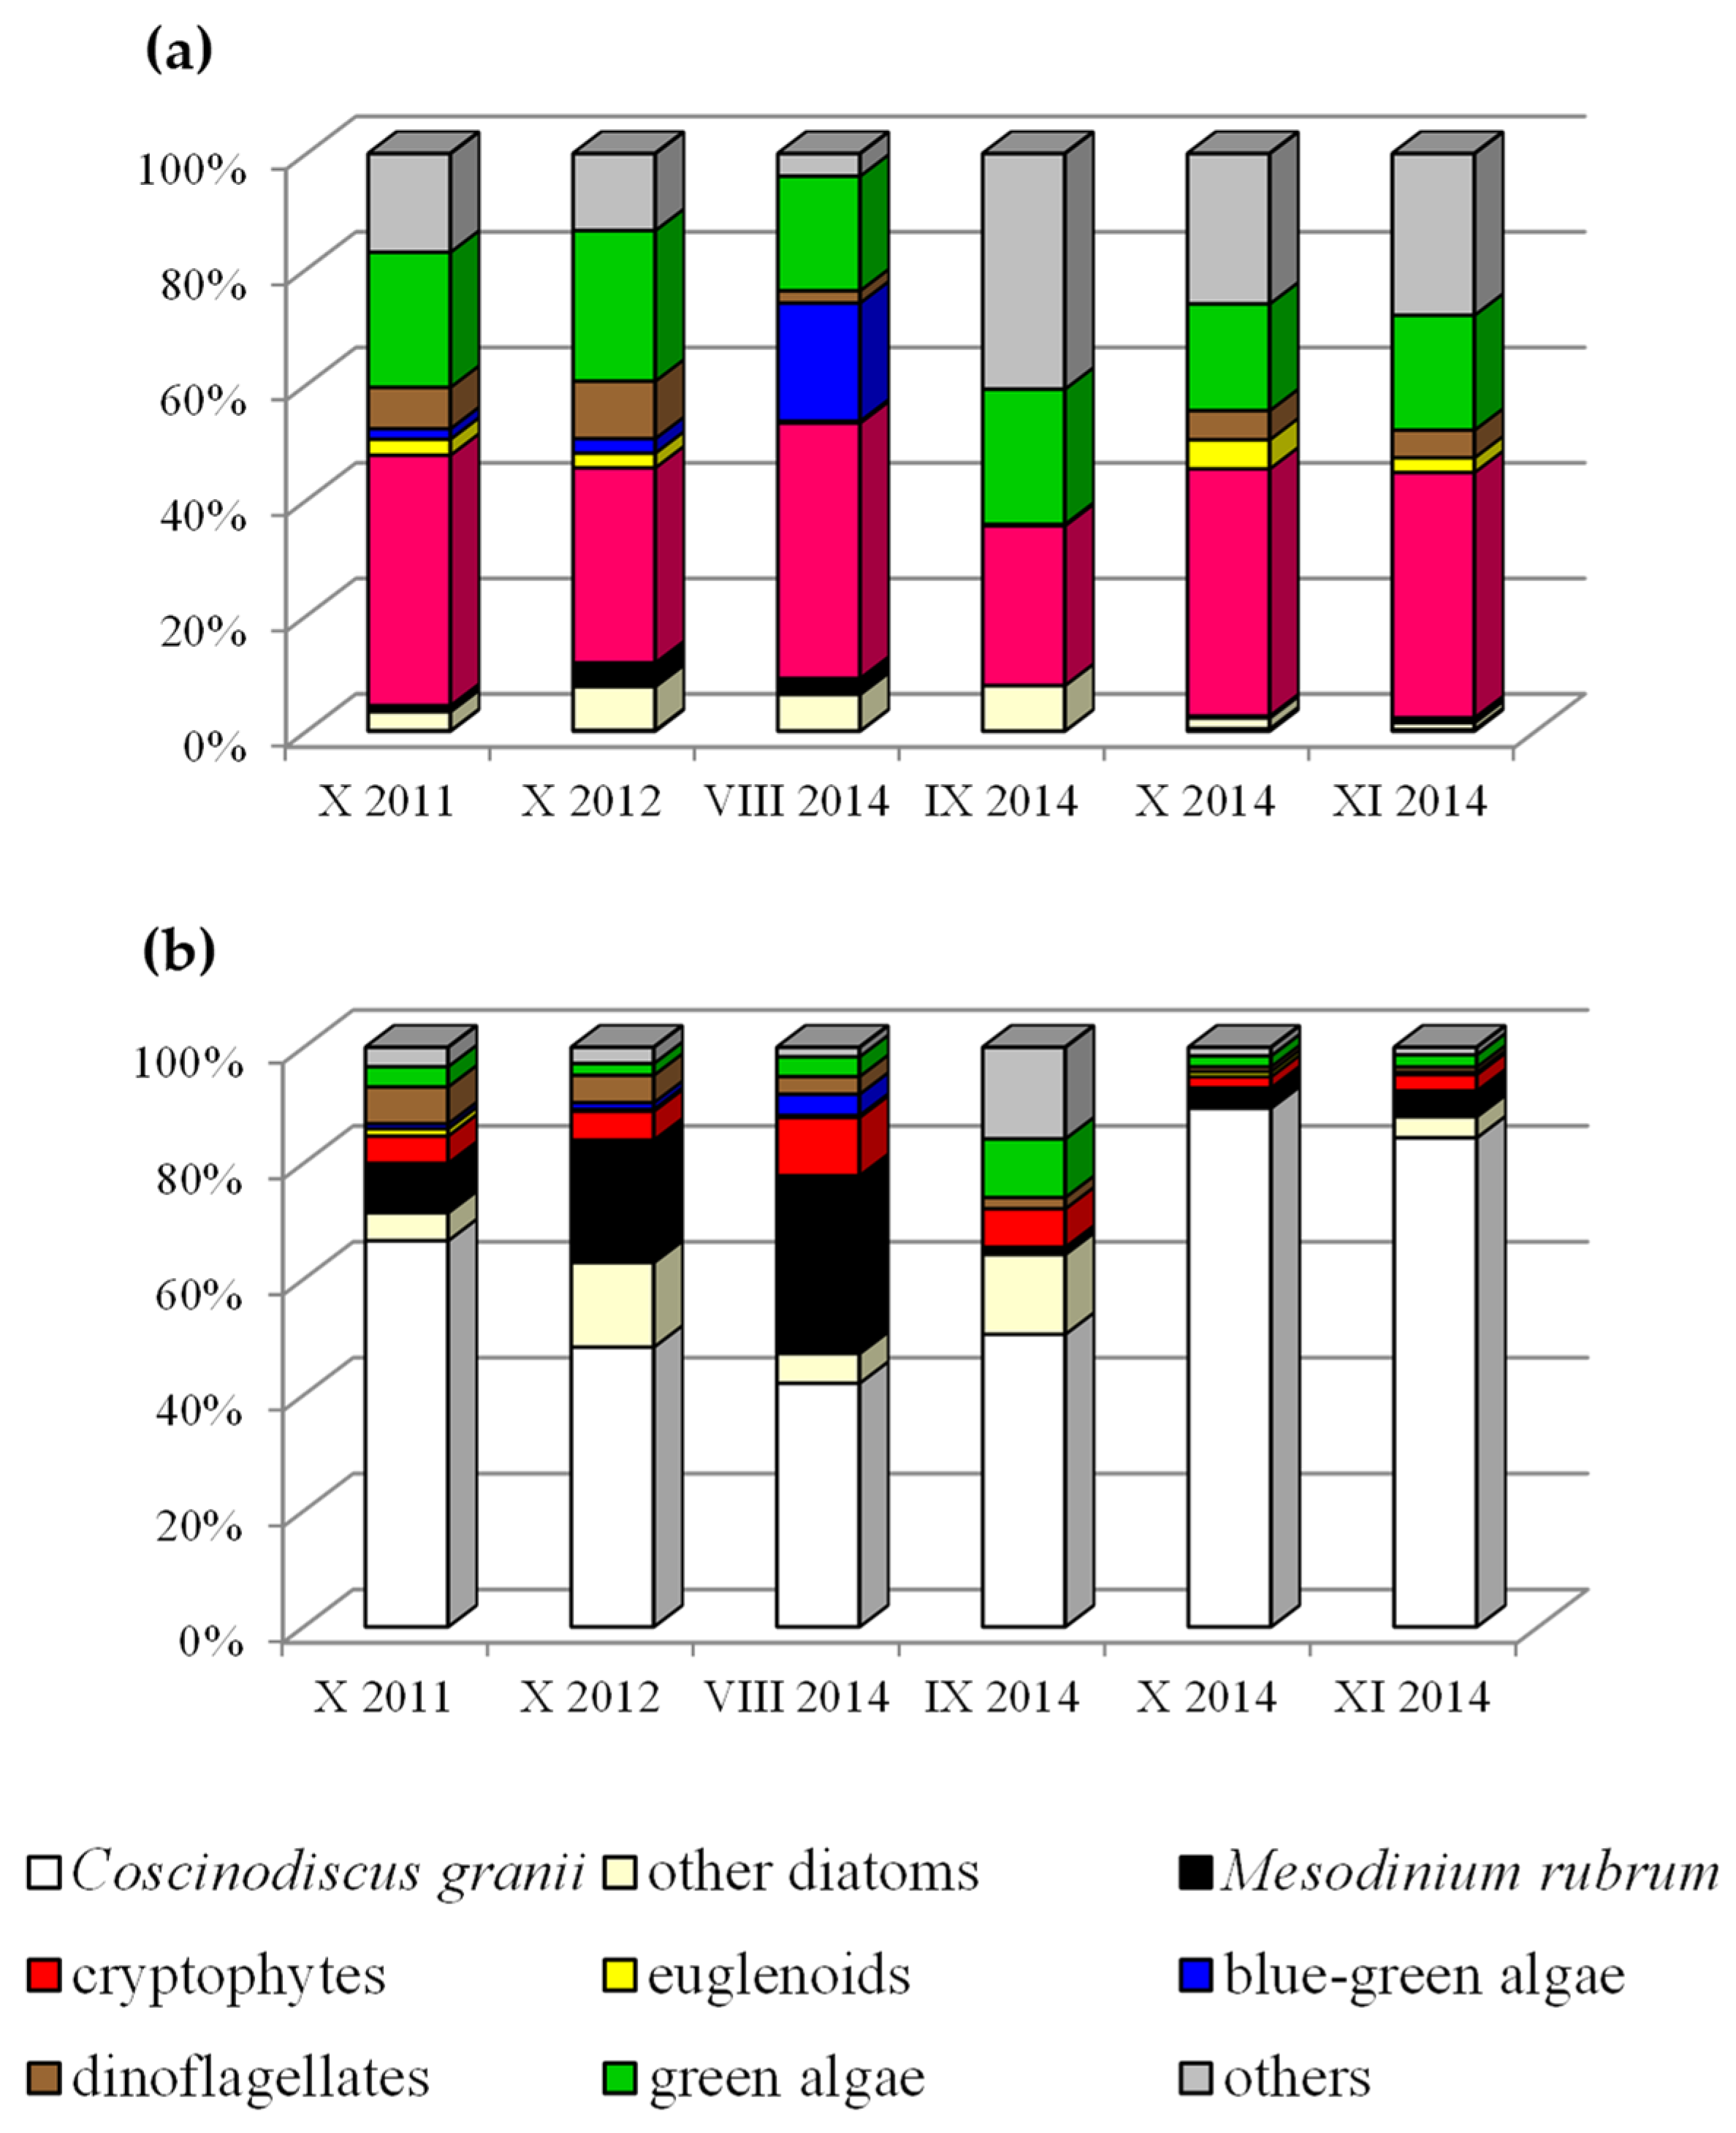
Our microscopic examinations of phytoplankton in different regions of the southern Baltic in 2011, 2012 and 2014 showed that in autumn (Figure 3b and Table 2), the highest percentage of biomass was due to the large microplankton diatom Coscinodiscus granii, in association with Mesodinium rubrum.
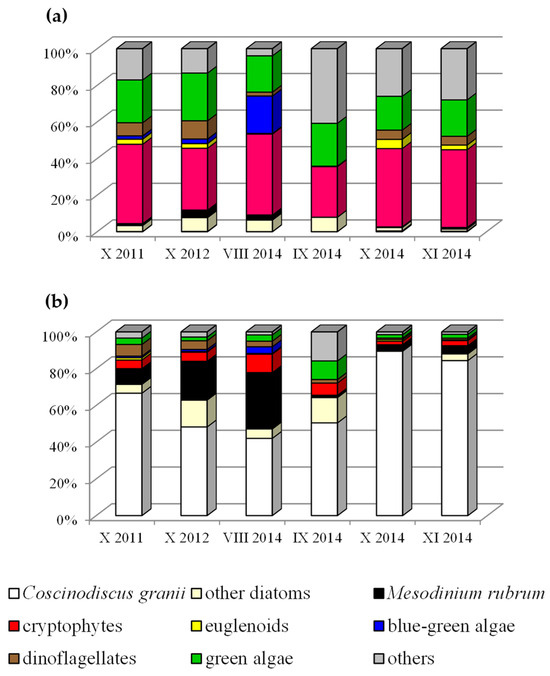
Figure 3.
(a,b) The phytoplankton community structure identified in autumn 2011, 2012 and 2014 at the Baltic Sea with highlighted Coscinodiscus granii.
In contrast, nanoplankton organisms growing in vast numbers (Figure 3a), such as cryptophytes (Plagioselmis prolonga, Teleaulax spp.) and chlorophytes (Pyramimonas spp.), exhibited the highest percentage abundance. However, their biomass was too small for them to be dominant in this respect.
Biovolume is of prime importance in studies of phytoplankton ecology [36,37,38]. The measurement of this parameter begins with cell size, which plays a crucial role in the dynamics of phytoplankton communities. In accordance with the size classification of Sieburth et al. [39], phytoplankton can be divided into micro-, nano- and picoplankton fractions, although they are also less abundant in the meso- and macroplankton.
Microscopic measurements of the diameters (D) of C. granii cells were used to calculate their ESDs. Table 3 lists the maximum and minimum values of D and ESDs for Coscinodiscul granii calles, along with their mean values, medians and standard deviations. D ranged from 48.0 to 188.0 µm with a mean of 97.3 µm and ESDs from 47.4 to 188.0 µm with a mean of 89.7 µm.
Table 3.
Basic statistical size characteristics of Coscinodiscus granii (n = 962).
The dimensions of 962 C. granii cells, grouped into the size classes specified by the LISST-100X instrument, are given in Figure 4. This shows that the cell diameters (D) ranged from 47.7 to 212 µm, the most numerous group being cells with D ≈ 101 µm. The corresponding ESDs ranged from 40.5 to 212 µm, with the most numerous group containing cells with ESDs ≈ 85.2 µm.
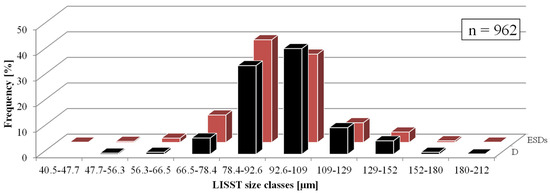
Figure 4.
Diameter (D, microscopic measurements) and equivalent spherical (ESD) diameter of C. granii sampled from different Baltic Sea areas in particular size classes of LISST-100X. Black bars represent D diameters and red bars ESD diameters.
As mentioned earlier, the labour-intensive, time-consuming and costly qualitative and quantitative analyses of phytoplankton using a microscope are rather ineffective. Because they are based on a small number of data, they do not guarantee results reflecting the actual distributions of these particles in natural waters. For this reason, other instruments are used nowadays, which measure the particles indirectly. The LISST-100X that we used is one such device measuring the concentrations and size distributions of SPM. This information was used to interpret the PSD spectra obtained from the LISST-100X meter. However, phytoplankton concentrations in Baltic waters have never yet been measured in situ with this instrument. To make a valid interpretation of the LISST data, the phytoplankton (bloom) signal must be clearly distinct from background noise. Such a signal was recorded in autumn, specifically in early October 2011, and also towards the end of October 2012 and 2014 along the transects and at particular measurement stations (Figure 1).
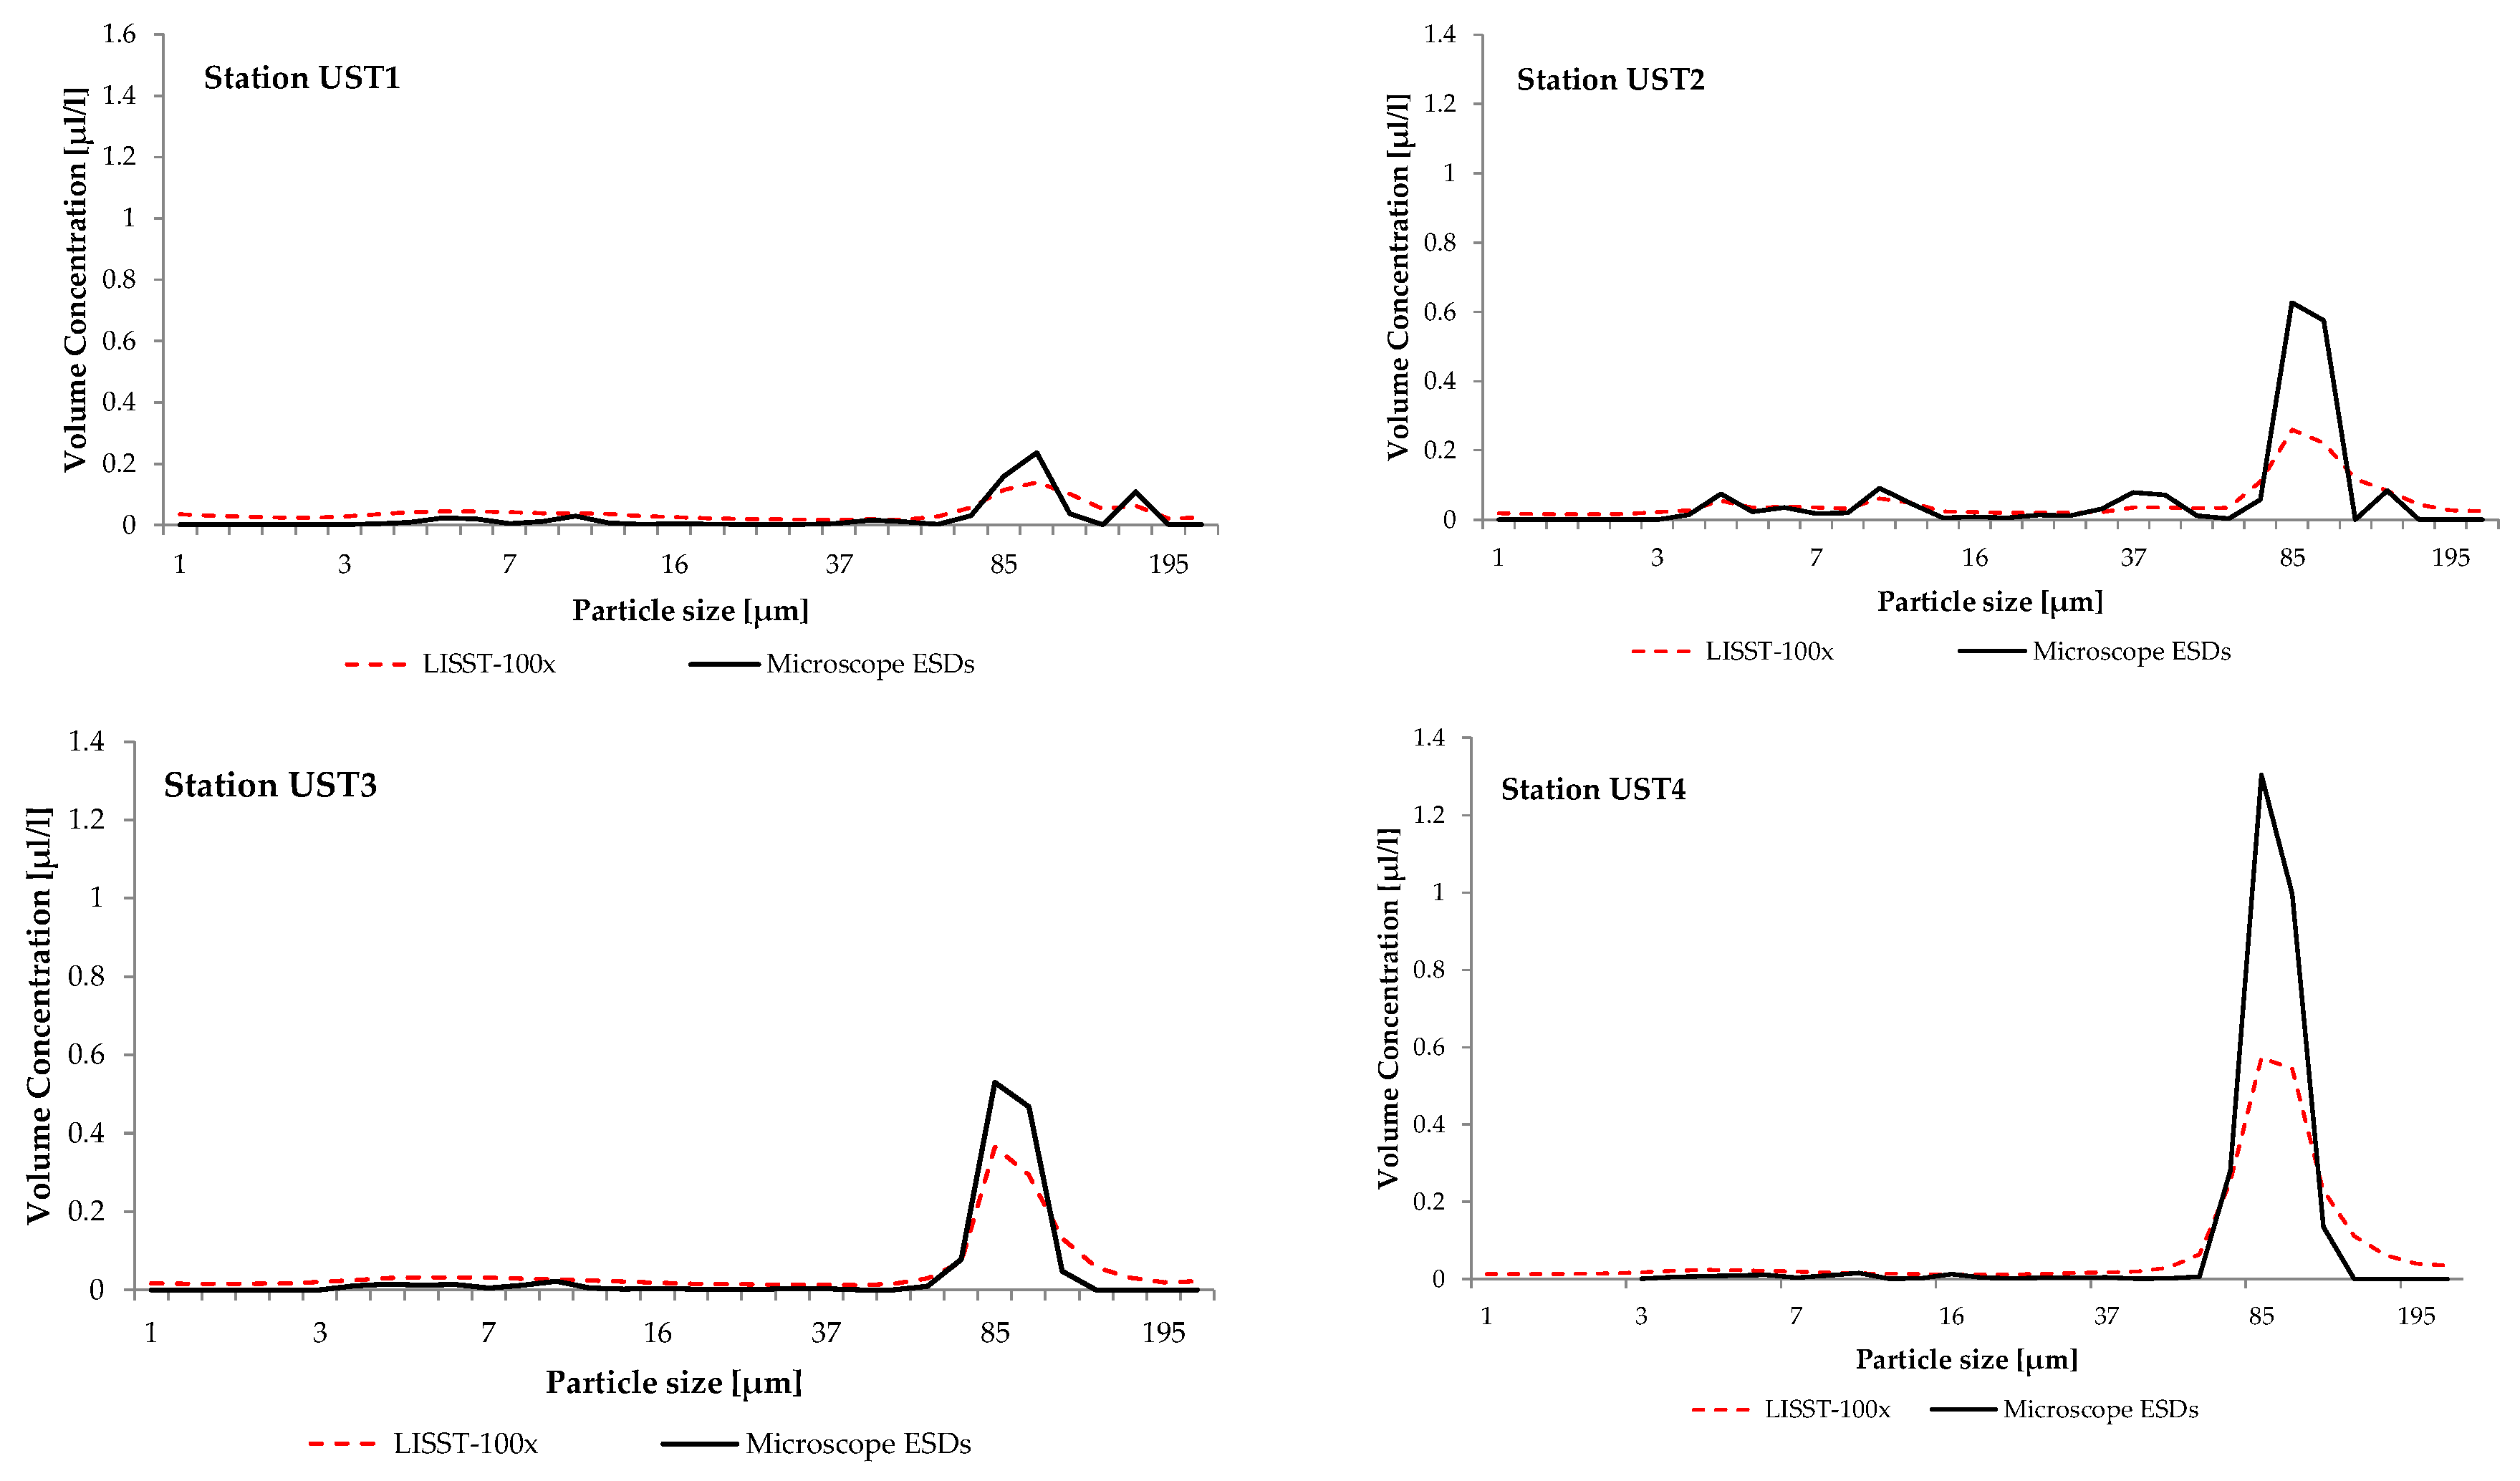
In those years, the water at the stations was dominated by large aggregations of SPM with ESDs ranging from 47.4 to 188.0 µm with a distinct peak from 92.6 to 109 µm in 2011, and from 78.4 to 92.6 µm in 2012 and 2014. Figure 5 gives examples of the particle size distributions; these were measured in 2014 at stations UST1, UST2, UST3 and UST4 in the southern Baltic coastal zone (see Figure 1).
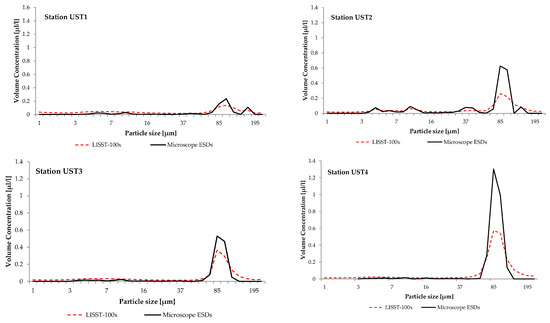
Figure 5.
Volume concentration of suspended particulate matter measured in surface water at stations UST 1, UST2, UST3 and UST4. LISST-100 data are represented by the dashed red solid line. Microscopy data are represented by the black line (ESDs, equivalent spherical diameter of a sphere of an equal cross-sectional area).
It is clear from the figures that a feature common to these distributions is the appearance of irregularities in the form of distinct maxima from 92.6 to 109 µm at station UST1 and from 78.4 to 92.6 µm at UST2, UST3 and UST4. These maxima provide evidence for the presence in the water of distinctive groups of SPM constituents, the ESDs of which lie between 47.4 and 188.0 µm.
Microscopic analysis of the water samples showed that within the range of diameters of the dominant maxima, the principal and only constituent of the SPM were microplankton diatoms Coscinodiscus granii. The concentrations of C. granii were the largest at UST4 (the station farthest from the river mouth), but the lowest at UST1, near the mouth of the River Słupia. During this period, pico- and nanoplankton cyanobacteria were no longer dominant with respect to both abundance and biomass. Microscopic measurements also showed that besides C. granii, the samples did not contain any other concentrations of zooplankton SPM with dimensions within the range of the dominant maxima.
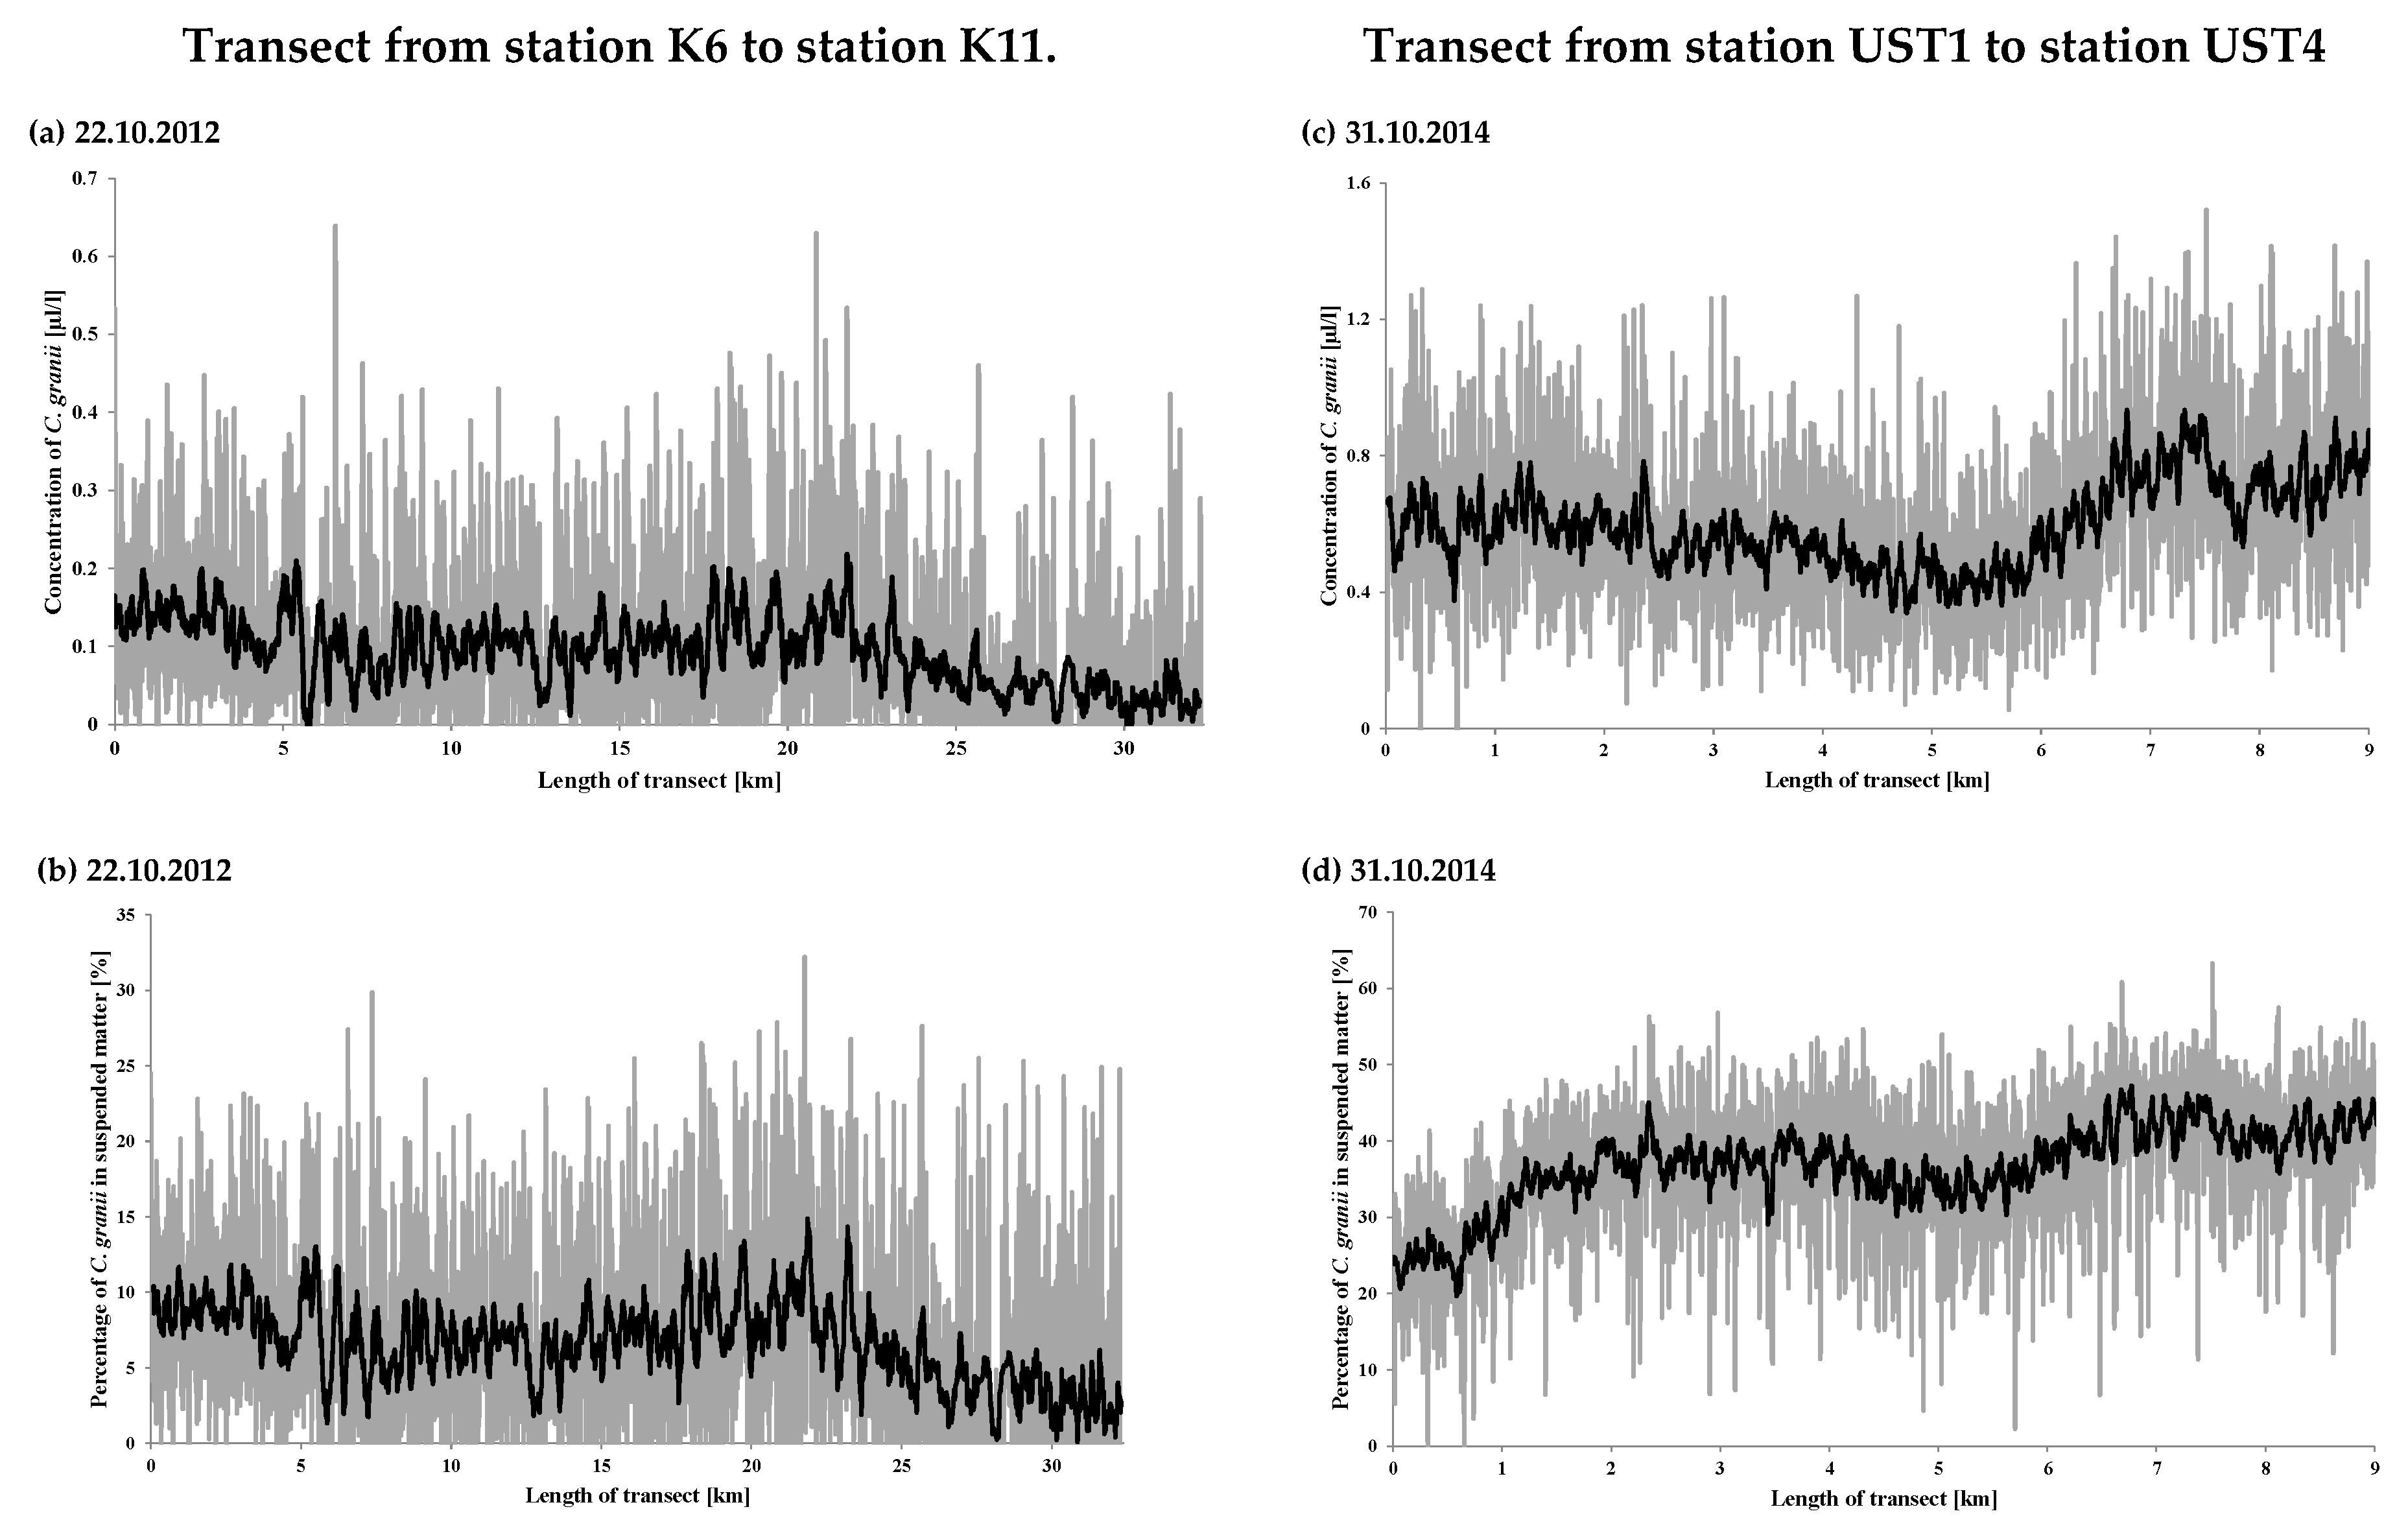
Based on the obtained results, the concentration of centric Coscinodiscus diatom species was estimated for each of the measurement stations and along the transect surveyed on 22 October 2012 and 31 October 2014 (Figure 1).
The results for the stations are listed in Table 4 and on the spatial map (Figure 6a); those for the transects are shown in Figure 7a,c. They show that the volume concentrations of C. granii are spatially highly variable. In 2012, the highest volume concentrations were recorded at stations P39a (0.43 µL L−1), SW3 (0.40 µL L−1) and K10 (0.31 µL L−1), the lowest ones at P104 (0.0002 µL L−1) and 92a (0.002 µL L−1). In 2014, the highest volume concentration was at UST4 (0.95 µL L−1). In 2012, the highest concentration (>0.20 µL L−1) on the transects was recorded around 22 km from station K6, whereas in 2014, it was 0.9 µL L−1 between UST3 and UST4. At stations UST3 and UST4 themselves, the respective concentrations were 0.37 and 0.32 µL L−1. Along both transects, there were also a series of larger and smaller local maxima due to the non-homogeneous distribution of Coscinodiscus granii concentrations.
Table 4.
The geographical characteristics of measuring stations and absolute and relative concentrations of Coscinodiscus spp. during two cruises in the Southern Baltic.
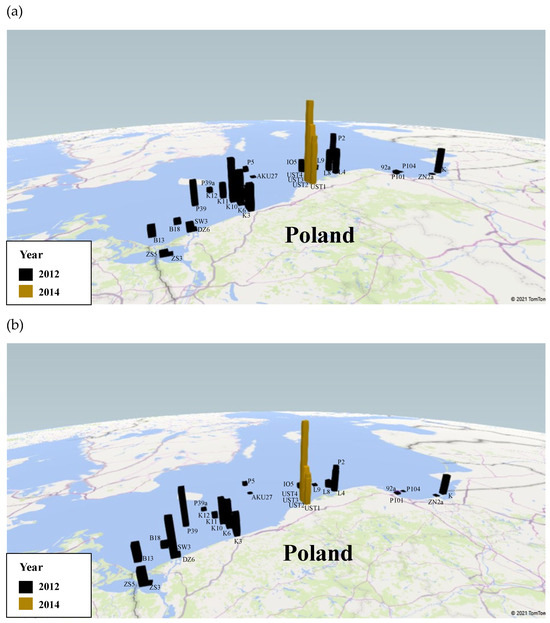
Figure 6.
The spatial distribution of concentration of Coscinodiscus granii in surface water in 2012 and 2014: (a) absolute concentration [µL L−1], (b) relative concentration [%], i.e., the ratio of the number of Coscinodiscus granii to the total number of suspended particles ranged from 1.25 to 250.0 μm.

Figure 7.
Concentrations of Coscinodiscus granii measured on 22 October 2012 and 31 October 2014 along the transects shown in Figure 1: (a,c) absolute concentration, (b,d) relative concentration: volume ratio of C. granii to the total SPM volume. The mean values on the figures are shown in black.
The relative percentage concentration of C. granii in relation to the total SPM concentration in the 1.25–250 µm range is shown on the spatial map (Figure 6b and Figure 7b,d, and in Table 4).
We see that the relative percentage of C. granii in the SPM in 2012 was at a low level, in contrast to 2014. In 2012 at a distance of some 25 km from station K6, the concentration of C. granii fell gradually to near-zero values. But in 2014, the lowest C. granii concentrations were recorded up to 1 km from the mouth of the River Słupia, when C. granii diatoms made up > 20% of all SPM. As a result of a drop in the total SPM concentration between stations UST3 and UST 4, the relative percentage of C. granii was greater even than that recorded at UST4, locally exceeding 47%.
4. Conclusions
Our measurements have shown that in autumn, Baltic Sea waters are dominated by large phytoplankton suspensions with ESDs from 47.4 to 188.0 µm. Microscopic examinations confirmed that the maxima were due to the presence of microplankton diatoms of one species, namely, Coscinodiscus granii, the biovolume of which increases intensively in autumn.
Moreover, the measurements made in 2014 showed that the local relative concentration of C. granii in surface waters can exceed 47% of the total SPM.
If supported by microscopic analysis, the LISST-100X device is reliable, because size distributions and volume concentrations of marine SPM can be measured in situ fairly quickly and easily. These results highlight the potential of the LISST-100X to track phytoplankton fluctuations and changes in phytoplankton structure when target species are known and their LISST-100 size distribution signatures have been characterized. What is more, our results highlight the potential applicability of the LISST-100X in Baltic Sea monitoring programmes. This is particularly relevant in the case of the Baltic, given that the greatest threat to this sea is considered to be its eutrophication. Phytoplankton blooms are a natural phenomenon in the Baltic Sea ecosystem. However, due to eutrophication, the phytoplankton blooms are becoming more frequent and extensive [40]. In addition, the effects of global warming, among them, changing water temperatures, may alter the species structure of the Baltic’s phytoplankton populations. Such changes have already been documented elsewhere in the world [41,42,43,44].
Author Contributions
Conceptualization, M.M.P. and D.F.; methodology, M.M.P.; software, M.M.P.; validation, M.M.P.; formal analysis, M.M.P. and D.F.; investigation, M.M.P.; resources, M.M.P.; writing—original draft preparation, M.M.P.; writing—review and editing, M.M.P. and D.F.; visualization, M.M.P.; supervision, D.F.; project administration, D.F.; funding acquisition, D.F. All authors have read and agreed to the published version of the manuscript.
Funding
This research was funded by the project “Satellite Monitoring of the Baltic Sea Environment–SatBałtyk”, and by the European Union through the European Regional Development Fund contract no. POIG.01.01.02-22-011/09 and by Statutory Research Programme No. 24.7.15 of the Institute of Geography, Pomeranian University in Słupsk.
Data Availability Statement
The data presented in this study are available on request from the corresponding author.
Acknowledgments
We thank the Institute of Oceanology Polish Academy of Science for the opportunity to take part in the research cruise and for their support during the cruises.
Conflicts of Interest
The authors declare no conflicts of interest.
References
- Levassseur, M.; Therriault, J.C.; Legendre, L. Hierarchical control of phytoplankton succession by physical factors. Mar. Ecol. Prog. Ser. 1984, 19, 211–222. [Google Scholar] [CrossRef]
- Sommer, U. Nutrient status and nutrient competition of phytoplankton in a shallow, hypertrophic lake. Limnol. Oceanogr. 1989, 34, 1162–1173. [Google Scholar] [CrossRef]
- Gilabert, J. Seasonal plankton dynamics in a Mediterianian hypersaline coastal lagoon: The Mar Menor. J. Plankton Res. 2001, 23, 207–217. [Google Scholar] [CrossRef]
- Lau, S.S.S.; Lane, S.N. Biological and chemical factors influencing shallow lake eutrophication: A long term study. Sci. Total Environ. 2002, 288, 167–181. [Google Scholar] [CrossRef] [PubMed]
- Kownacka, J.; Całkiewicz, J.; Kornijów, R. A turning point in the development of phytoplankton in the Vistula Lagoon (southern Baltic Sea) at the beginning of the 21st century. Oceanologia 2020, 62, 538–555. [Google Scholar] [CrossRef]
- Wielgat-Rychert, M.; Jarosiewicz, A.; Ficek, D.; Pawlik, M.; Rychert, K. Nutrient Fluxes and Their Impact on the Phytoplankton in a Shallow Coastal Lake. Pol. J. Environ. Stud. 2015, 24, 751–759. [Google Scholar] [CrossRef]
- Witek, B. Short-Term Fluctuations of Phytoplankton in the Coastal Zone of the Gulf of Gdansk; University of Gdańsk Publishing House: Gdańsk, Poland, 2010. (In Polish) [Google Scholar]
- Wasmund, N.; Pollehne, F.; Postel, L.; Siegel, H.; Zettler, M.L. Biologische Zustandseinschätzung der Ostsee im Jahre 2010; Meereswissenschaftliche Berichte No. 85; Institut für Ostseeforschung: Roctock, Germany, 2011; pp. 3–87. [Google Scholar]
- Konik, M.; Bradtke, K.; Stoń-Egiert, J.; Soja-Woźniak, M.; Sliwińska-Wilczewska, S.; Darecki, M. Cyanobacteria Index as a Tool for the Satellite Detection of Cyanobacteria Blooms in the Baltic Sea. Remote Sens. 2023, 15, 1601. [Google Scholar] [CrossRef]
- Witek, B.; Pliński, M. The first recorded bloom of Prorocentrum minimum (Pavillard) Schiller in the coastal zone of the Gulf of Gdańsk. Oceanologia 2000, 42, 433–446. [Google Scholar]
- Lund-Hansen, L.C. Development and dynamics of a coastal sub-surface phytoplankton bloom in the southwest Kattegat, Baltic Sea. Oceanologia 2006, 48, 29–36. [Google Scholar]
- Pliński, M.; Simm, A. Seasonal fluctuations in the composition, distribution and quantity of phytoplankton in the Vistula Lagoon in 1974 and 1975. Stud. Mater. Oceanol. Biol. 1978, 4, 53–80. (In Polish) [Google Scholar]
- Wasmund, N.; Dutz, J.; Pollehne, F.; Siegel, H.; Zettler, M.L. Biological Assessment of the Baltic Sea 2015; Meereswissenschaftliche Berichte No. 102; Leibniz-Institut für Ostseeforschung Warnemünde: Roctock, Germany, 2016. [Google Scholar] [CrossRef]
- Wasmund, N.; Dutz, J.; Pollehne, F.; Siegel, H.; Zettler, M.L. Biological Assessment of the Baltic Sea 2016; Meereswissenschaftliche Berichte No. 105; Leibniz-Institut für Ostseeforschung Warnemünde: Roctock, Germany, 2017. [Google Scholar] [CrossRef]
- Wasmund, N.; Dutz, J.; Pollehne, F.; Siegel, H.; Zettler, M.L. Biological Assessment of the Baltic Sea 2017; Meereswissenschaftliche Berichte No. 108; Leibniz-Institut für Ostseeforschung Warnemünde: Roctock, Germany, 2018. [Google Scholar] [CrossRef]
- Wasmund, N.; Dutz, J.; Kremp, A.; Zettler, M.L. Biological Assessment of the Baltic Sea 2018; Meereswissenschaftliche Berichte No. 112; Leibniz-Institut für Ostseeforschung Warnemünde: Roctock, Germany, 2019. [Google Scholar] [CrossRef]
- Kaczmarek, S.; Woźniak, B. The application of the optical classification of waters in the Baltic Sea (Case 2 Waters). Oceanologia 1995, 37, 285–297. [Google Scholar]
- Kowalczuk, P. Seasonal variability of yellow substance absorption in the surface layer of the Baltic Sea. J. Geophys. Res. 1999, 104, 30047–30058. [Google Scholar] [CrossRef]
- Woźniak, S.B.; Meler, J.; Lednicka, B.; Zdun, A.; Stoń-Egiert, J. Inherent optical properties of suspended particulate matter in the southern Baltic Sea. Oceanologia 2011, 53, 691–729. [Google Scholar]
- Jonasz, M. Nonsphericity of suspended marine particles and its influence on light scattering. Limnol. Oceanogr. 1987, 32, 1059–1065. [Google Scholar] [CrossRef]
- Jennings, B.R.; Parslow, K. Particle size measurement: The equivalent spherical diameter. Proc. R. Soc. Lond. 1988, 419, 137–149. [Google Scholar]
- Lee Karp-Boss, L.; Azevedo, L.; Boss, E. LISST-100 measurements of phytoplankton size distribution: Evaluation of the effects of cell shape. Limnol. Oceanogr. Methods 2007, 5, 396–406. [Google Scholar] [CrossRef]
- Anglès, A.; Jordi, A.; Garcés, E.; Masó, M.; Basterretxea, G. High-resolution spatio-temporal distribution of a coastal phytoplankton bloom using laser in situ scattering and transmissometry (LISST). Harmful Algae 2008, 7, 808–816. [Google Scholar] [CrossRef]
- Serra, T.; Colomer, J.; Cristina, X.P.; Vila, X.; Arellano, J.B.; Casamitjana, X. Evaluation of laser in-situ scattering instrument for measuring the concentration of phytoplankton, purpule sulfur bacteria, and suspended inorganic sediments in lakes. J. Environ. Eng. 2001, 127, 1023–1030. [Google Scholar] [CrossRef]
- Serra, T.; Casamitjana, X.; Colomer, J.; Granata, T.C. Observations of the particle size distribution and concentration in a coastal system using an in situ laser analyzer. Mar. Technol. Soc. J. 2002, 36, 59–69. [Google Scholar] [CrossRef]
- Pawlik, M.; Ficek, D. Pine pollen grains in coastal waters of the Baltic Sea. Int. J. Oceanol. Hydrobiol. Stud. 2016, 45, 35–41. [Google Scholar] [CrossRef]
- Pawlik, M.M.; Ficek, D. Spatial Distribution of Pine Pollen Grains Concentrations as a Source of Biologically Active Substances in Surface Waters of the Southern Baltic Sea. Water 2023, 15, 978. [Google Scholar] [CrossRef]
- Agrawal, Y.C.; Pottsmith, H.C. Instruments for particle size and settling velocity observations in sediment transport. Mar. Geol. 2000, 168, 89–114. [Google Scholar] [CrossRef]
- Edler, L. Phytoplankton and Chlorophyll: Recommendations on Methods for Marine Biological Studies in the Baltic Sea. Balt. Mar. Biol. Publ. 1979, 5, 38. [Google Scholar]
- Utermöhl, H. Zur Vervollkommnung der quantitativen Phytoplankton-Methodik. Mitt Int. Verein. Theor. Angew. Limnol. 1958, 9, 1–38. [Google Scholar] [CrossRef]
- HELCOM. Manual for Marine Monitoring in the COMBINE Programme of HELCOM, Part C. Programme for Monitoring of Eutrophication and Its Effects, Annex C-6: Phytoplankton Species Composition, Abundance and Biomass; Baltic Marine Environment Protection Commission: Helsinki, Finland, 2001. [Google Scholar]
- Hällfors, G. Checklist of Baltic Sea Phytoplankton Species (Including Some Heterotrophic Protistan Groups)—Balt; Baltic Sea Environment Proceedings No. 95; Baltic Marine Environment Protection Commission: Helsinki, Finland, 2004; p. 208. [Google Scholar]
- Olenina, I.; Hajdu, S.; Edler, L.; Andersson, A.; Wasmund, N.; Busch, S.; Göbel, J.; Gromisz, S.; Huseby, S.; Huttunen, M.; et al. Biovolumes and size-classes of phytoplankton in the Baltic Sea. In HELCOM Baltic Sea Environment Proceedings; Baltic Marine Environment Protection Commission: Helsinki, Finland, 2006; No. 106; p. 144. [Google Scholar]
- Dutz, J.; Kremp, A.; Zettler, M.L. Biological assessment of the Baltic Sea 2020. In Meereswissenschaftliche Berichte; Leibniz-Institut für Ostseeforschung Warnemünde: Roctock, Germany, 2022; Volume 120. [Google Scholar] [CrossRef]
- Gromisz, S.; Witek, Z. Main phytoplankton assemblages in the Gulf of Gdańsk and the Pomeranian Bay from 1994 to 1997. Bull. Sea Fish. Inst. 2011, 2, 31–51. [Google Scholar]
- Sournia, A. Phytoplankton Manual. Monographs on Oceanographic Methodology 6; UNESCO: Paris, France, 1978. [Google Scholar]
- Chisholm, S.W. Phytoplankton size. In Primary Productivity and Biogeochemical Cycles in the Sea; Falkowski, P.G., Woodhead, A.D., Vivirito, K., Eds.; Springer Science & Business Media: Boston, MA, USA, 1992; pp. 213–237. [Google Scholar]
- Menden-Deuer, S.; Lessard, E.J. Carbon to volume relationships for dinoflagellates, diatoms, and other protist plankton. Limnol. Oceanogr. 2000, 45, 569–579. [Google Scholar] [CrossRef]
- Sieburth, J.M.; Smetacek, V.; Lenz, J. Pelagic ecosystem structure: Heterotrophic copartments of the plankton and their relationship to plankton size fractions. Limnol. Oceanogr. 1978, 23, 1256–1263. [Google Scholar] [CrossRef]
- Löptien, U.; Dietze, H. Retracing cyanobacteria blooms in the Baltic Sea. Sci. Rep. 2022, 12, 10873. [Google Scholar] [CrossRef] [PubMed]
- Richardson, A.J.; Schoeman, D.S. Climate impact on plankton ecosystems in the northeast Atlantic. Science 2004, 305, 1609–1612. [Google Scholar] [CrossRef]
- Rousseaux, C.S.; Gregg, W.W. Recent decadal trends in global phytoplankton composition. Glob. Biogeochem. Cycles 2015, 29, 1674–1688. [Google Scholar] [CrossRef]
- Martin-Garcia, G.M. Oceanic impact on European climate changes during the quaternary. Geosciences 2019, 9, 119. [Google Scholar] [CrossRef]
- Kahru, M.; Elmgren, R.; Savchuk, O.P. Changing seasonality of the Baltic Sea. Biogeosciences 2016, 13, 1009–1018. [Google Scholar] [CrossRef]


Disclaimer/Publisher’s Note: The statements, opinions and data contained in all publications are solely those of the individual author(s) and contributor(s) and not of MDPI and/or the editor(s). MDPI and/or the editor(s) disclaim responsibility for any injury to people or property resulting from any ideas, methods, instructions or products referred to in the content. |
© 2024 by the authors. Licensee MDPI, Basel, Switzerland. This article is an open access article distributed under the terms and conditions of the Creative Commons Attribution (CC BY) license (https://creativecommons.org/licenses/by/4.0/).