Article

Prediction of the Permeability Tensor of Marine Clayey Sediment during Cyclic Loading and Unloading of Confinement Pressure Using Physical Tests and Machine Learning Techniques

1
Department of Engineering Management, School of Civil Engineering, Nanjing Forestry University, Nanjing 210037, China
2
College of Ocean Science and Engineering, Shanghai Maritime University, Shanghai 200135, China
3
School of Management Engineering, Jiangsu Urban and Rural Construction Vocational College, Changzhou 213147, China
4
CCCC Third Harbor Consultants Co., Ltd., Shanghai 210011, China
5
Panjin Water Supply Engineering Co., Ltd., Panjin 124000, China
6
Goertek College of Engineering, Qufu Normal University, Qufu 273165, China
7
College of Physical Education and Health Management, Chongqing Second Normal University, Chongqing 400065, China
8
School of Civil and Resources Engineering, University of Science and Technology Beijing, Beijing 100083, China
*
Author to whom correspondence should be addressed.
These authors contributed equally to this work.
Water 2024, 16(8), 1102; https://doi.org/10.3390/w16081102
Submission received: 6 March 2024 / Revised: 1 April 2024 / Accepted: 9 April 2024 / Published: 12 April 2024

Abstract

:
In this study, a method was introduced to validate the presence of a Representative Elementary Volume (REV) within marine clayey sediment containing cracks during cyclic loading and unloading of confinement pressure. Physical testing provided the basis for this verification. Once the existence of the REV for such sediment was confirmed, we established a machine-learning predictive model. This model utilizes a hybrid algorithm combining Particle Swarm Optimization (PSO) with a Support Vector Machine (SVM). The model was trained using a database generated from the aforementioned physical tests. The machine-learning model demonstrates favorable predictive performance based on several statistical metrics, including the coefficient of determination (R2), mean residual error (MSE), mean relative residual error (MRSE), and the correlation coefficient R during the verification process. Utilizing the established machine-learning predictive model, one can effortlessly obtain the permeability tensor of marine clayey sediment containing cracks during cyclic loading and unloading of confinement pressure by inputting the relevant stress condition parameters. The original research cannot estimate the permeability tensor under similar loading and unloading conditions through REV. In this study, the physical model test was used to determine the REV of marine cohesive sediments with cracks by cyclic-constrained pressure loading and unloading. Referring to the results of physical tests, we developed a machine-learning prediction model that can easily estimate the permeability tensor of marine cohesive sediments with cracks under cyclic loading and constrained pressure unloading conditions. This method greatly saves time and computation and provides a direct method for engineering and technical personnel to predict the permeability tensor in this case.

1. Introduction

Marine clayey sediment is extensively distributed worldwide [1,2,3,4]. The unfavorable behavior of marine clay deposits has been exposed over the past few years during the building of marine engineering indicates which has a detrimental impact on the dependability of engineering projects by causing issues such as sliding and splitting [5,6,7,8,9]. Consequently, it is critical to fully understand the marine clay deposits’ geological characteristics. This investigation’s findings serve as critical guidelines for formulating construction strategies and implementing safeguard measures, mitigating the risk of the engineering catastrophes associated with marine clay sediments.
Currently, the predominant focus of research endeavors concerning the geotechnical attributes of marine clay sediments has centered on their mechanical behavior [10,11,12,13,14,15]. It is rare to investigate their permeability properties. In particular, there is no report on the permeability behavior of marine clay sediments throughout the cyclical loading and unloading of confining pressure. Because marine clay sediments contain cracks, these fissures act as the main pathways for aqueous seepage, and unbroken marine clay sediments have substantially less permeability than these fissures [16]. Under extreme circumstances, fluid easily infiltrates marine clay sediments, significantly reducing their strength. Particularly in ocean engineering, the permeability characteristics of marine clay sediments substantially impact their equilibrium [17]. Additionally, in practical engineering, marine clay sediments must withstand cyclic loading and unloading of confining pressure due to repeated sea waves [18]. Cyclical loading and unloading of confinement pressure result in the repeated opening and closing of cracks in marine clay sediments, which significantly affect the permeability properties of these sediments. Consequently, investigating the permeability characteristics of marine clay sediments has become a critical research direction for understanding their geotechnical behavior, particularly throughout the cyclical confinement pressure loading and unloading.
At present, there are two main types of research methodologies used to determine the porousness characteristics of marine clay sediments with cracks: discrete approaches and analogous continuous methods. The comparison of the two methods is shown in Table 1 [19]. When employing the discrete approach for seepage analysis, it is essential to account for each crack’s precise location, orientation, and geometric configuration. Conversely, the equivalent continuum approach treats marine clay sediments containing cracks as homogeneous continuum media, disregarding the details of individual cracks [20]. Generally speaking, the discrete method often yields superior outcomes in the seepage analysis of marine clay sediments containing cracks. However, for marine clay sediments with cracks, the number of cracks is significant, and the geometric form of these cracks is sophisticated [21]. Due to challenges such as complex pre-processing, extensive calculations, intricate modeling, and convergence difficulties, the discrete method is impractical for analyzing the permeability properties of marine clay sediments containing cracks. Conversely, the equivalent continuum approach is straightforward, well-established, and practical, making it the most commonly used method for analyzing the permeability properties of marine clay sediments containing cracks [22]. Especially for marine clayey sediment with large quantities of complex cracks, the application of the equivalent continuum approach in analyzing their permeability characteristics is time- and calculation-saving [23,24]; thus, for marine clay sediments containing cracks, it is essential to employ the equivalent continuum method for conducting seepage analysis. The fundamental challenge in using this approach lies in verifying the existence of REV and determining the permeability tensor [25]. REV represents the Representative Elementary Volume. It is a mathematical model used to describe the physical properties of porous media. In the fields of earth science, material science, and engineering, the REV model can divide complex porous materials (such as rock, soil, and porous materials) into a series of small units, and each unit is regarded as an equivalent continuous medium. In this way, we can use the mathematical model of continuous medium to describe the behavior of the whole porous material. REV is the smallest sampling region volume beyond which the hydraulic features of a sample remain constant. Additionally, the permeability tensor is an advantageous tool for representing the anisotropic permeability properties of the studied object [26]. Adopting the equivalent continuum technique requires the presence of an REV [27]. Generally, there is no assurance that the REV will always be present for a given marine clay sediment containing cracks. If an REV is absent, the permeability tensor of such marine clay sediment becomes meaningless [28]. For marine clay sediments containing cracks, the presence of REVs primarily hinges on the characteristics of these cracks, including their geometric morphology. This is because cracks are the primary conduits controlling the hydraulic behavior of marine clay sediments [29]. The geometric morphology of cracks can change significantly due to loading effects, thereby impacting the existence of an REV for marine clay sediments containing cracks as well as their permeability tensors [30]. Therefore, the existence of an REV for marine clay sediments and their permeability tensors is dependent on stress. As mentioned earlier, in practical engineering, marine clay sediments containing cracks experience cyclic loading and unloading due to the confining pressure from sea waves. The existence of an REV for marine clay sediments with cracks and their permeability tensors would fluctuate throughout the cyclic loading and unloading of confinement pressure due to the extensively broken nature of these sediments [31]. Nevertheless, more information is needed about the permeability tensors of maritime clay sediments with fractures and the presence of REVs for these materials. Therefore, it is essential to look into the existence of REVs for such sediments and to determine their permeability tensors during cyclic loading and unloading of confinement pressure to apply the equivalent continuum approach in the seepage analysis of marine clay sediments containing cracks in practical engineering.
Traditional methods for investigating the existence of REVs for marine clay sediments containing cracks and for determining their permeability tensors are inadequate for studying the properties of marine clay sediments. This inadequacy is primarily due to the unique geo-structural characteristics of marine clay sediments. Moreover, a significant limitation of most existing approaches is their failure to account for the effects of cyclic loading and unloading of confinement pressure [32,33,34,35]. Field tests pose challenges for quantifying the permeability anisotropy of marine clay sediments containing cracks, let alone determining their stress-dependent permeability tensors. Alternatively, analytical solutions offer alternative methods for assessing the permeability tensor [36,37,38]. According to the analytical solution, the permeability tensor of marine clay sediments with cracks may be obtained by superimposing each crack’s permeability onto the sediment as a whole [39]. While traditional approaches need to pay more attention to the interconnectivity of cracks and the fluid flow exchange between cracks and the sediment, this oversimplification falls short when dealing with marine clay sediments containing cracks. The complex geometric morphology of these cracks, coupled with the significant fluid exchange occurring between them, profoundly influences the permeability tensors of marine clay sediments, rendering it unignorable. Furthermore, it is challenging to use in situ investigations and analytical techniques alone to confirm the presence of REVs in such sediments and to calculate their permeability tensors. Therefore, to handle this complexity and evaluate the REV and the permeability tensor, researchers have recently adopted numerical modeling approaches, such as the Finite Element Method (FEM) and the Discrete Element Method (DEM) [40,41,42,43]. However, marine clay sediments with fractures show significant breakage, which makes using the FEM difficult because mesh creation has intrinsic limits [44]. Many mechanical factors unique to coastal clay sediments with cracks are needed to apply the DEM to analyze the permeability qualities of these sediments. However, current research on the mechanical properties of marine clay sediments containing cracks is scarce. Obtaining the necessary mechanical parameters for DEM modeling marine clay sediments is challenging. Furthermore, both the FEM and DEM encounter computational difficulties when conducting numerical simulations to analyze the permeability characteristics of marine clay sediments containing cracks due to the interconnectivity between the cracks and the geological complexities associated with discontinuities in these sediments [45,46]. For marine clay sediments with fractures under cyclic loading and unloading of confinement pressure, it is essential to provide a successful approach for measuring the permeability tensors and verifying the presence of REVs.
In order to close such an opening, our work suggests using laboratory model experiments to establish the presence of REVs for marine clay sediments that have fractures throughout cyclic loading and unloading of confinement pressure. We employed machine-learning techniques to quantitatively relate the permeability tensors of marine clay sediments containing cracks to the corresponding stress state, based on the outcomes of physical tests and empirical equations. As a powerful tool, machine learning is frequently employed as a practical methodology for predicting the properties of geotechnical materials, taking into consideration the intricate interactions among numerous influencing factors [47,48,49,50]. For the permeability tensors of marine clay sediments with fractures during cyclic loading and unloading of confinement pressure, we suggest a machine-learning prediction model in this context. We used a database generated by mathematical models by implementing a hybrid PSO-SVM technique. The permeability of marine clay sediments with different crack dip angles was first tested physically before the confinement pressure was cycled, loaded, and unloaded. Subsequently, we confirmed the existence of a Representative Elementary Volume (REV) for marine clay sediments, including cracks under cyclic loading and unloading of confinement pressure, using the permeability tensor’s principles and the outcomes of the physical tests. Consequently, we provide a hybrid PSO-SVM algorithm-based machine-learning prediction model based on the results of empirical equations and physical model testing. When the parameters corresponding to the specified stress conditions are included in this machine-learning prediction model, it becomes easy to compute the permeability tensor of marine clay sediments throughout the cyclic loading and unloading of confinement pressure. This approach offers a time-saving and efficient method for engineering personnel to predict the permeability tensor of marine clay sediments under varying cyclic loading and unloading conditions.

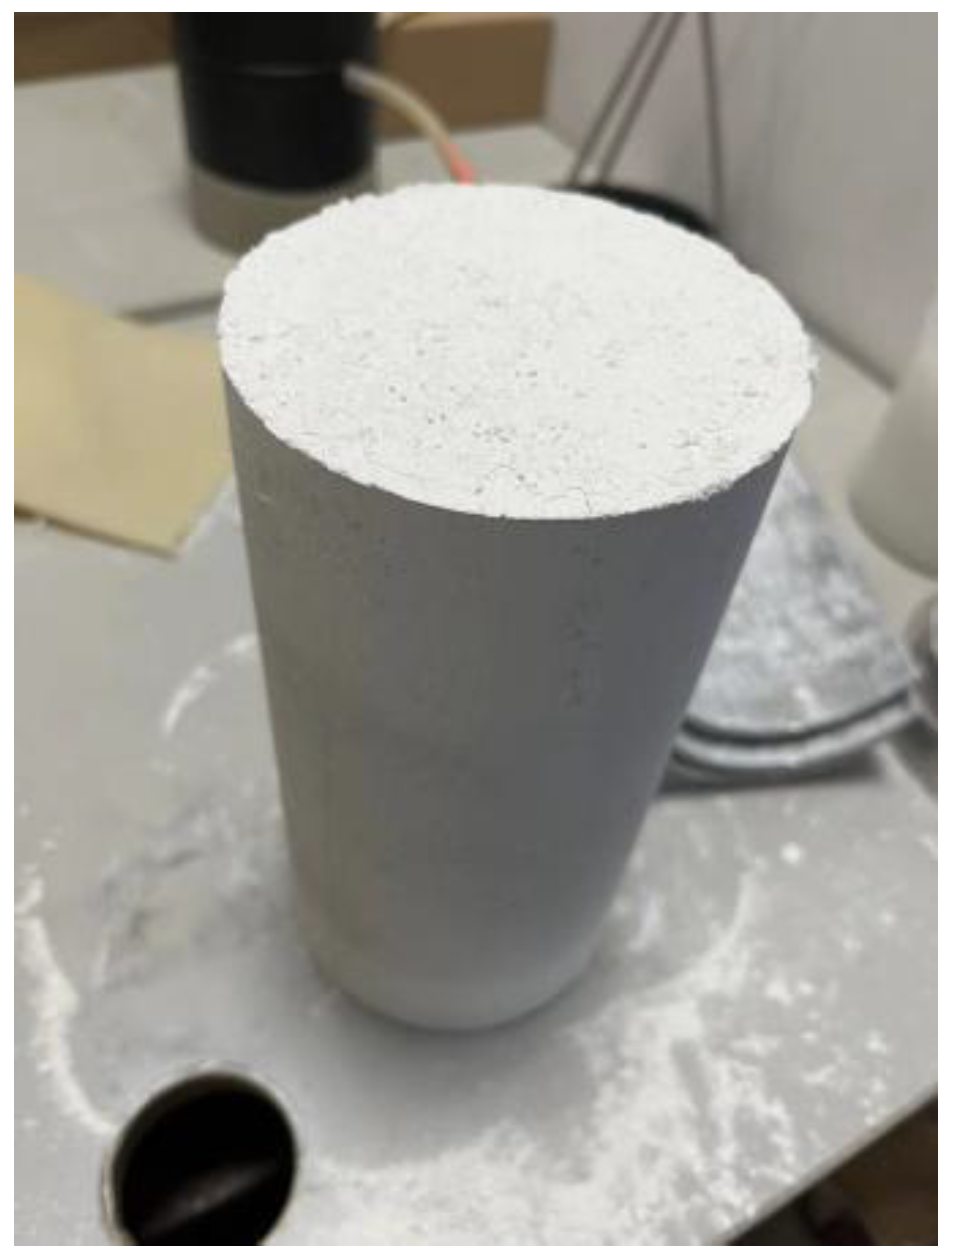
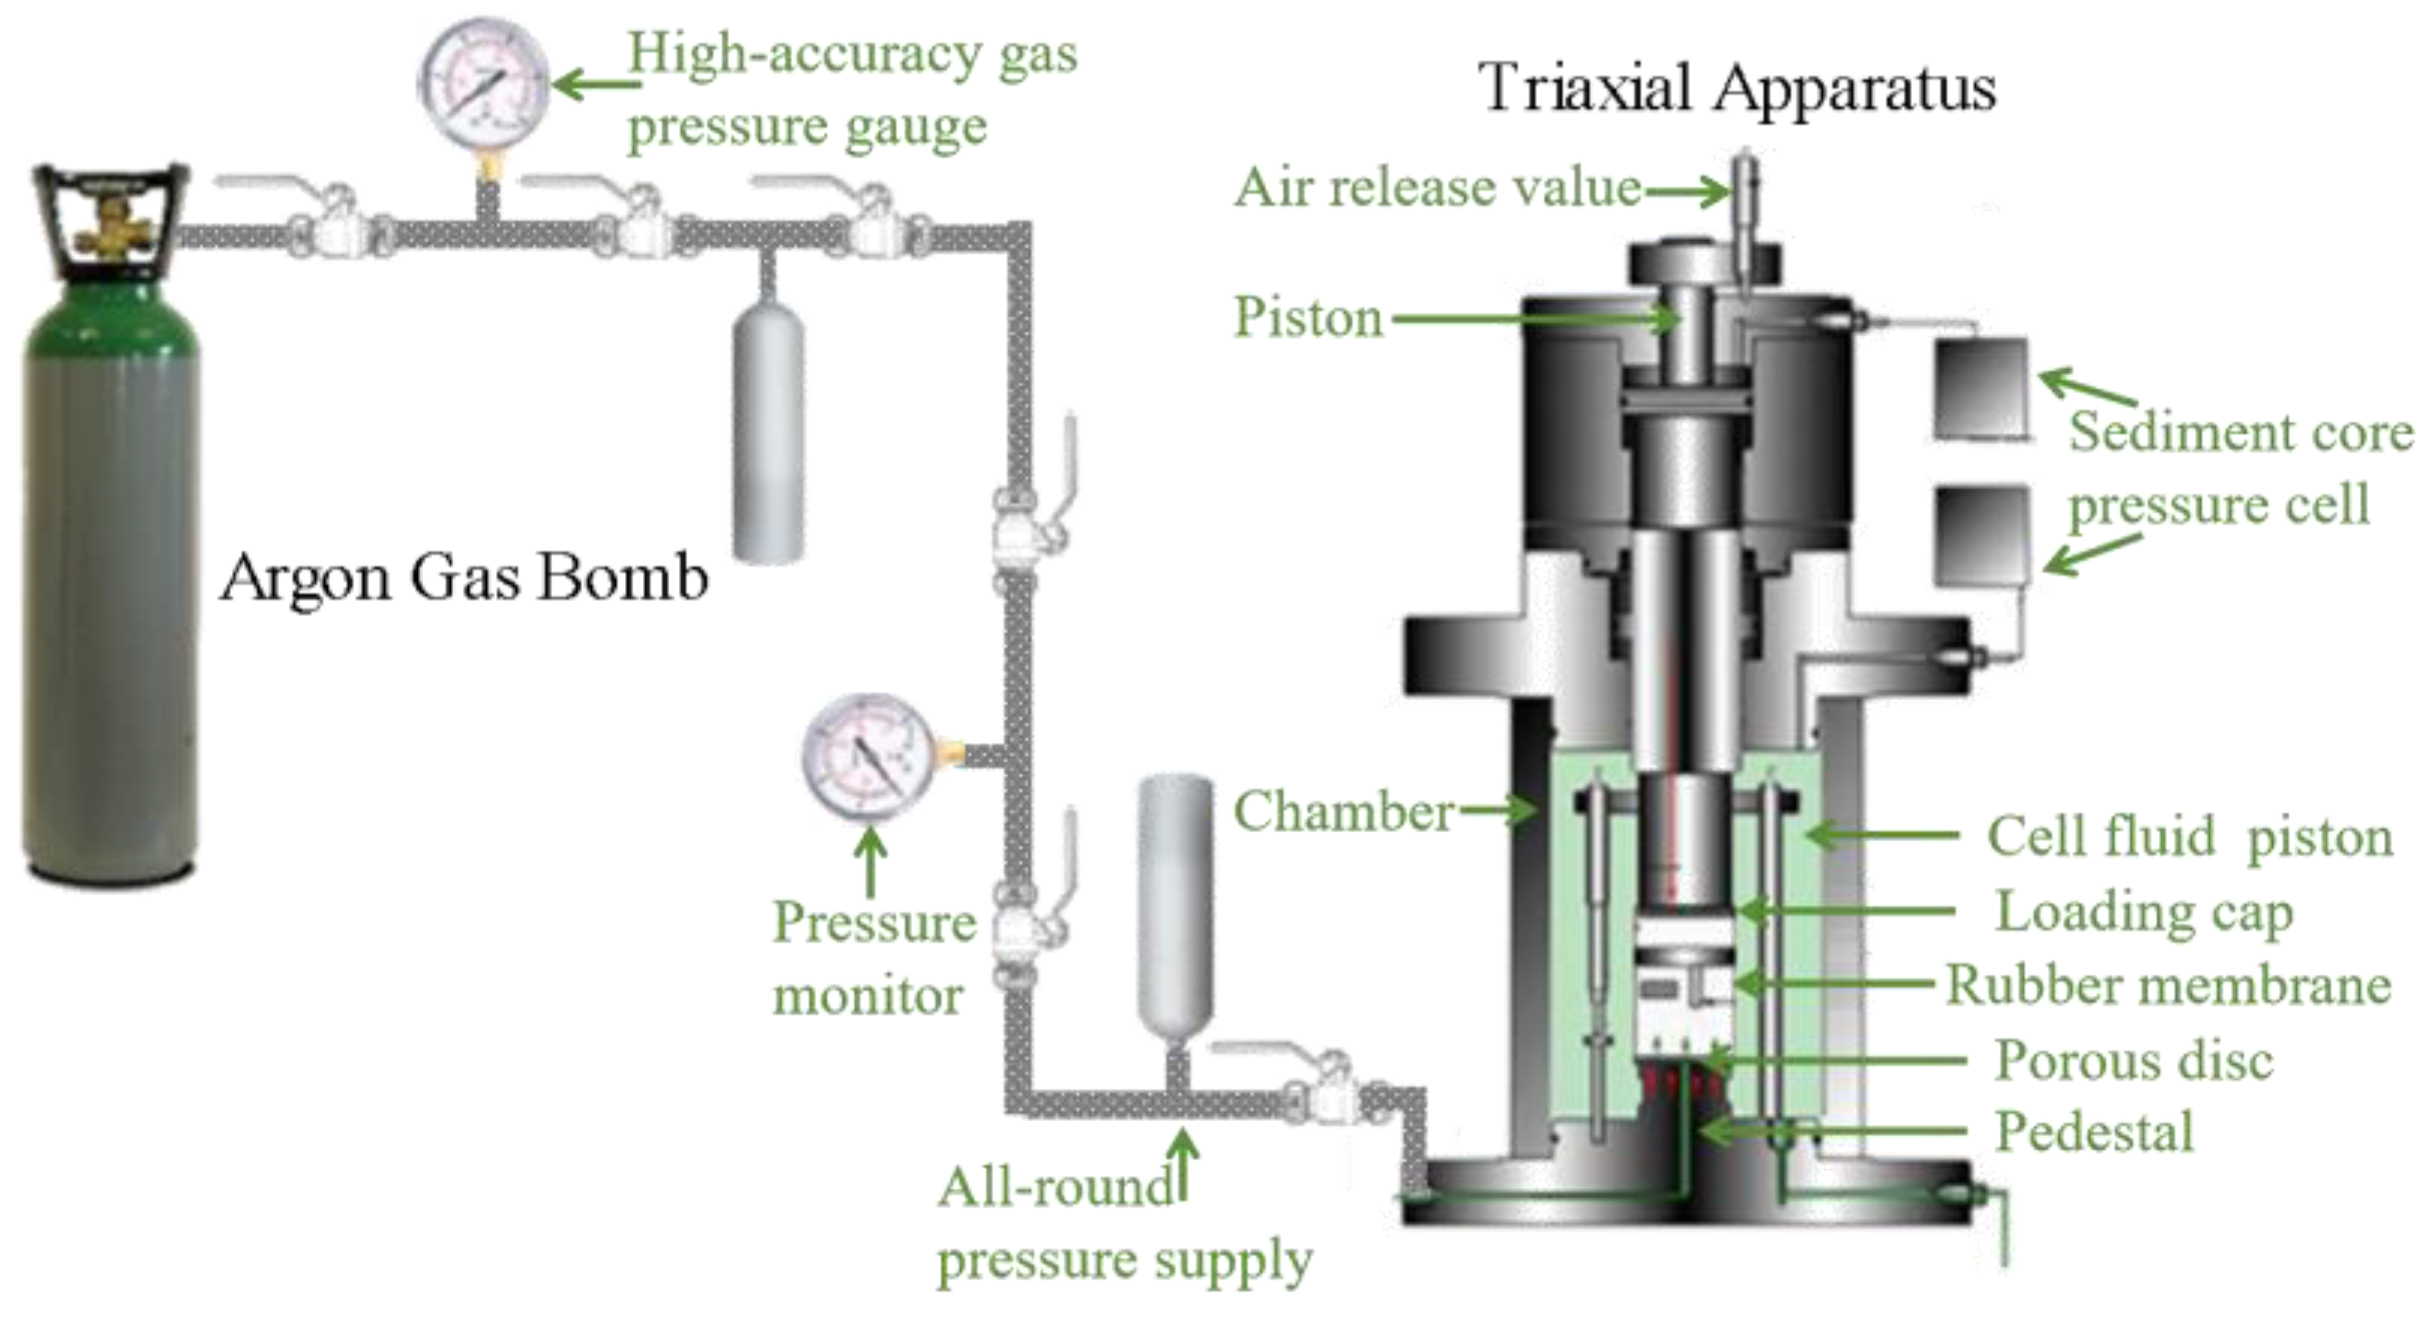
2. Description of Physical Tests

The soil samples were taken from a sea area in the western part of the South China Sea based on the shared voyage of the South China Sea Scientific Expedition, 2020, Jiaqing. The natural density of the sediments in the area is ρ = 1.39 g·cm−3, the water content is w = 110.21%, the relative mass density is Gs = 2.65, the void ratio is e = 3.01, the liquid limit is wL = 67.29, the plastic limit is wp = 67.29, the plastic index is Ip = 21.13, the permeability coefficient is k = 5.36 × 10⁻⁸, and the organic matter content is 8.21%. The permeability coefficient was measured by the variable head method on the Jiaqing sampling ship. After the undisturbed marine sediments were transported back to the laboratory, the remolded samples were obtained by applying the overlying load consolidation to the mud according to the method of Burland to ensure that the samples had a strength [50,51], as shown in Figure 1.
In the experiments, the marine clayey sediment contained seven different crack angles: 0°, 15°, 30°, 45°, 60°, 75°, and 90°. Three cycles of loading and unloading confinement pressure were used to determine the permeability of the marine clayey sediment materials with different crack dip angles, using the argon-based permeability test apparatus shown in Figure 2. In the gas permeability test, the inert gas argon was used. Adopting gas as media for measuring sample permeability has the advantages of avoiding a chemical reaction between the measurement media and concrete, a weaker interaction between gas and concrete, and a shorter measurement duration compared with adopting liquid as seepage media [52,53]. The experimental setup comprised an upstream and downstream gas pressure control panel, a sediment core pressure cell, a confining pressure regulation gadget, a seepage pressure regulation apparatus, a pressure monitor, and a high-accuracy gas pressure gauge. Computing the permeability of the sample involved utilizing computer-generated data. The gas flow approach was used to determine the permeability of marine clayey sediment materials to ensure accurate testing. Each confinement pressure cycle comprised 11 different pressures: 0.3 MPa, 0.8 Mpa, 1.5 Mpa, 2.5 Mpa, 3 Mpa, 3.5 Mpa, 3 Mpa, 2.5 Mpa, 1.5 Mpa, 0.8 Mpa, and 0.3 Mpa, respectively. A seepage pressure of 0.1 Mpa was established. There were 231 experimental sets in all. These pressure values can simulate the pressure changes faced by marine clay sediments in the actual environment and the periodic pressure changes caused by water flow velocity, which helps us to better understand the behavior of marine clay sediments under cyclic loading and more accurately study their mechanical responses.

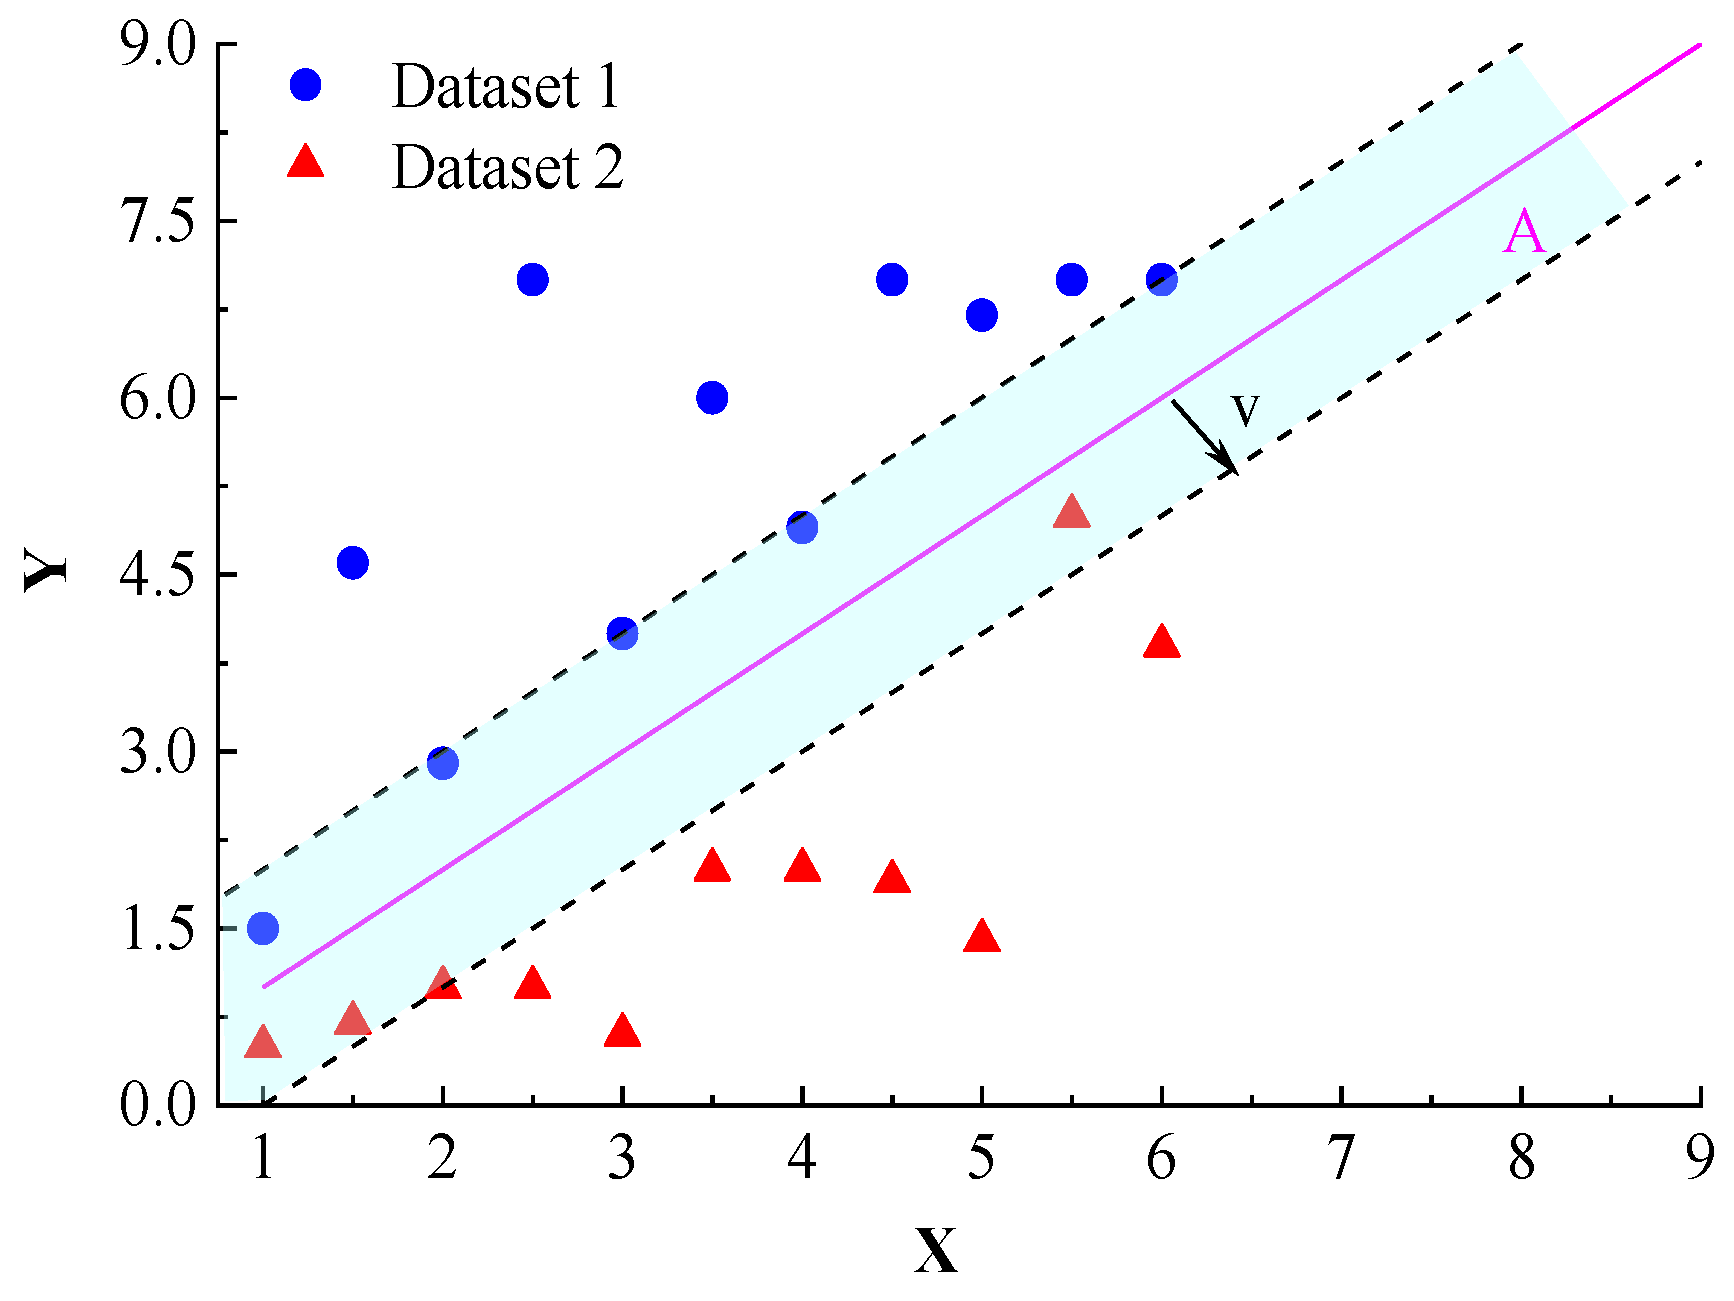
3. Verifying the Existence of REV

The process for confirming the presence of an REV in marine clayey silt that has cracks throughout the cyclic loading and unloading of confinement pressure is described in this subsection. The verification is predicated on theoretical derivations and examination findings. The seepage concept and tensor principles state that the analogous continuum technique may be used for seepage analysis of marine clayey silt in a polar coordinate system because the trajectory given by Equation (1) closely approaches an ellipse, thereby verifying the presence of an REV [51]. In this scenario, leveraging data from physical tests, we determined the permeability of marine clayey sediment materials with varying crack dip angles: 0°, 15°, 30°, 45°, 60°, 75°, and 90°. These measurements were made when the confinement pressure was being loaded and unloaded cyclically. Equation (1) is used in the fitting procedure, and Table 2 provides a summary of the fitting degrees that are produced.
r = 1 k ,
where r represents the radius vector and k denotes the permeability coefficients in various directions of hydraulic gradient.
Considering the information shown in Table 2, except for a few tests, the fitting degrees for each test exceed 90%, indicating a high level of fit. Consequently, the REV of marine clayey sediment containing cracks is confirmed to exist under cyclic loading and unloading of confinement pressure. When the confinement pressure is 3 Mpa and 3.5 Mpa, the fitting degree does not exceed 90%. This is because the seabed sediment is a porous medium as a test material, and the discrete type is large, so the fitting degree is low. Furthermore, the permeability properties of coastal clayey silt with fissures may be examined using the equivalent continuum technique. This observation also underscores the significance of the permeability tensor for marine clayey sediment containing cracks throughout cyclic loading and unloading of confinement pressure.

4. Mathematical Models for Permeability Tensor Calculation in Marine Clayey Sediment under Cyclic Loading and Unloading of Confinement Pressure

Based on the research above, the permeability characteristics of coastal clayey silt with fractures may be examined using the equivalent continuum technique. Furthermore, the marine clayey sediment’s permeability tensor is essential throughout the periodic loading and unloading of confinement pressure. The permeability anisotropy of the marine clayey sediment is specially investigated in the direction of the crack dip angle. Therefore, we regard the material as transversely isotropic. This suggests that only the permeability anisotropic over the dip direction for fractures should be considered, and that the permeability anisotropy along the sediment plane should be ignored. When fissures are present in marine clayey silt, transverse isotropy indicates that the material has an axial line across it where the permeability characteristics of locations within a plane vertical to the axial column are constant. As such, the marine clayey sediment permeability tensor with fissures is essentially transformed into a two-dimensional permeability tensor [ K ] = [ k 1 k 2 k 3 k 4 ] . In accordance with the permeability tensor law, where K x x , K x y , and K y y , this relationship can be exemplified by the permeability of marine clayey sediment materials at 0°, 45°, and 90° crack dip angles, respectively [52]. The independent variables x are 0.3, 0.5, 0.8, 1, 1.25, 1.5, 2, 2.25, 2.5, 3, 3.25, 3.5, 3.25, 3, 2.5, 2.25, 2, 1.5, 1.25, 1, 0.8, 0.5, and 0.3 Mpa, respectively. Due to the symmetry of the permeability tensor, namely K x y = K y x , and the tensor invariance principle, the two dimensional permeability tensor can be expressed as: K = ( K x x K x y K x y K y y ) [54].
Based on existing research, the relationship between the permeability of marine clayey sediment materials with varying crack dip angles and the confinement pressure during different loading and unloading phases of the confinement pressure cycle follows an exponential function. Consequently, a quantitative relationship between K x x , K x y , and K y y , as well as their dependence on confinement pressure during the loading and unloading phases of three consecutive confinement pressure cycles, is derived and presented in Table 3.
Utilizing the equations from Table 3, we have established a comprehensive database comprising K x x , K x y , and K y y values for marine clayey sediment containing cracks under cyclic loading and unloading of confinement pressure. The cyclic loading and unloading process occurs three times, with each cycle encompassing 23 distinct confinement pressures: 0.3, 0.5, 0.8, 1, 1.25, 1.5, 2, 2.25, 2.5, 3, 3.25, 3.5, 3.25, 3, 2.5, 2.25, 2, 1.5, 1.25, 1, 0.8, 0.5, and 0.3 Mpa, respectively. By adhering to the tensor principle and the coordinate transformation rule, we calculated the Principal Permeability Angle (PPA), the major Principal Permeability Component (PPC), and the Minor PPC for marine clayey sediment containing cracks under specified stress conditions, based on the K x x , K x y , and K y y values stored in the database. Building upon the computed results, we have augmented the database, encompassing the confinement pressure, the cyclic loading and unloading time, and the loading or unloading phase, as well as the corresponding Major PPC, Minor PPC, and PPA for marine clayey sediment containing cracks. The loading or unloading phase is numerically represented (0 for unloading and 1 for loading). The database comprises a total of 69 datasets, as illustrated in Table 4.

5. Machine-Learning Algorithms

In order to forecast the permeability of coastal clayey sediments with fractures under cyclic confinement pressure loading and unloading, we developed a machine-learning model using the dataset given in Section 4. In this machine-learning framework, input parameters include confinement pressure, cyclic duration of pressure loading and unloading, and the loading or unloading period. The corresponding major PPC, minor PPC, and PPA of marine clayey sediments containing cracks serve as the output parameters. To train the machine learning model, the dataset was randomly divided into 49 training samples (70%) and 20 validation samples (30%). The purpose of the validation samples was to evaluate the model’s performance. The hybrid PSO-SVM approach was used to build the machine-learning prediction model using Matlab software (Version 9.2, R2017a) and the following SVM and PSO concepts.

5.1. The Principles of SVM

The SVM is a model used for binary classification and regression. It can divide and predict sample data while achieving structural risk minimization based on the principles of maximum margin [55]. The SVM effectively addresses regression problems. The goal of SVM regression is to create a regression model that characterizes the connections among a specified sample of data [56], as depicted in Equation (2).
L = { ( x 1 , y 1 ) , ( x 2 , y 2 ) , } ,
where L represents the regression model, xi (i = 1, 2 …n) denotes the x value of the sample data, and yi (i = 1, 2 …n) corresponds to the y value of the sample data.
Under the tenet of structural risk reduction, the SVM efficiently uses a small sample size to build a model using regression [57]. The SVM regression model aims to minimize the difference between the predicted function f(x) and the actual observed values y. Expressly, the SVM assumes that deviations between f(x) and y that are smaller than a constant threshold (denoted as ‘s’) can be safely disregarded when calculating the overall discrepancy between the predicted and observed values [58]. As shown in Figure 3, only the deflections arising from points outside the zone are taken into consideration; the deviations occurring from locations within the region are excluded.
Hence, regression problems can be reformulated as minimizing a convex quadratic programming issue, as demonstrated in Equation (3) and referred to as the s-insensitive loss function [57].
min v , b 1 / 2 v 2 + s i = 1 n ( f ( x i ) y i ) ,
where s is constant.
To simplify the computing process in linear regression, the primal issue is converted into the twofold counterpart using the Lagrange Multiplier Method [59]; the resulting dual problem is illustrated in Equation (4).
max α , α i = 1 n y i ( α i α i ) ε ( α i + α i ) 1 / 2 i = 1 n j = 1 n ( α i α i ) ( α j α j ) x i T x j s . t . i = 1 n ( α i α i ) = 0 , 0 α i , α i b ,
Upon solving Equation (4), we obtain the optical regression model as illustrated in Equation (5).
f ( x ) = V M ( b c b c ) ( x * x i ) b ,
The SVM includes a kernel function for handling nonlinearity in nonlinear regression situations. By efficiently mapping samples between a space with low dimensions and a higher-dimensional space, the kernel function converts nonlinear problems into linear problems [60]. Subsequently, the same procedure for solving linear problems is applied to identify the optimal regression model.

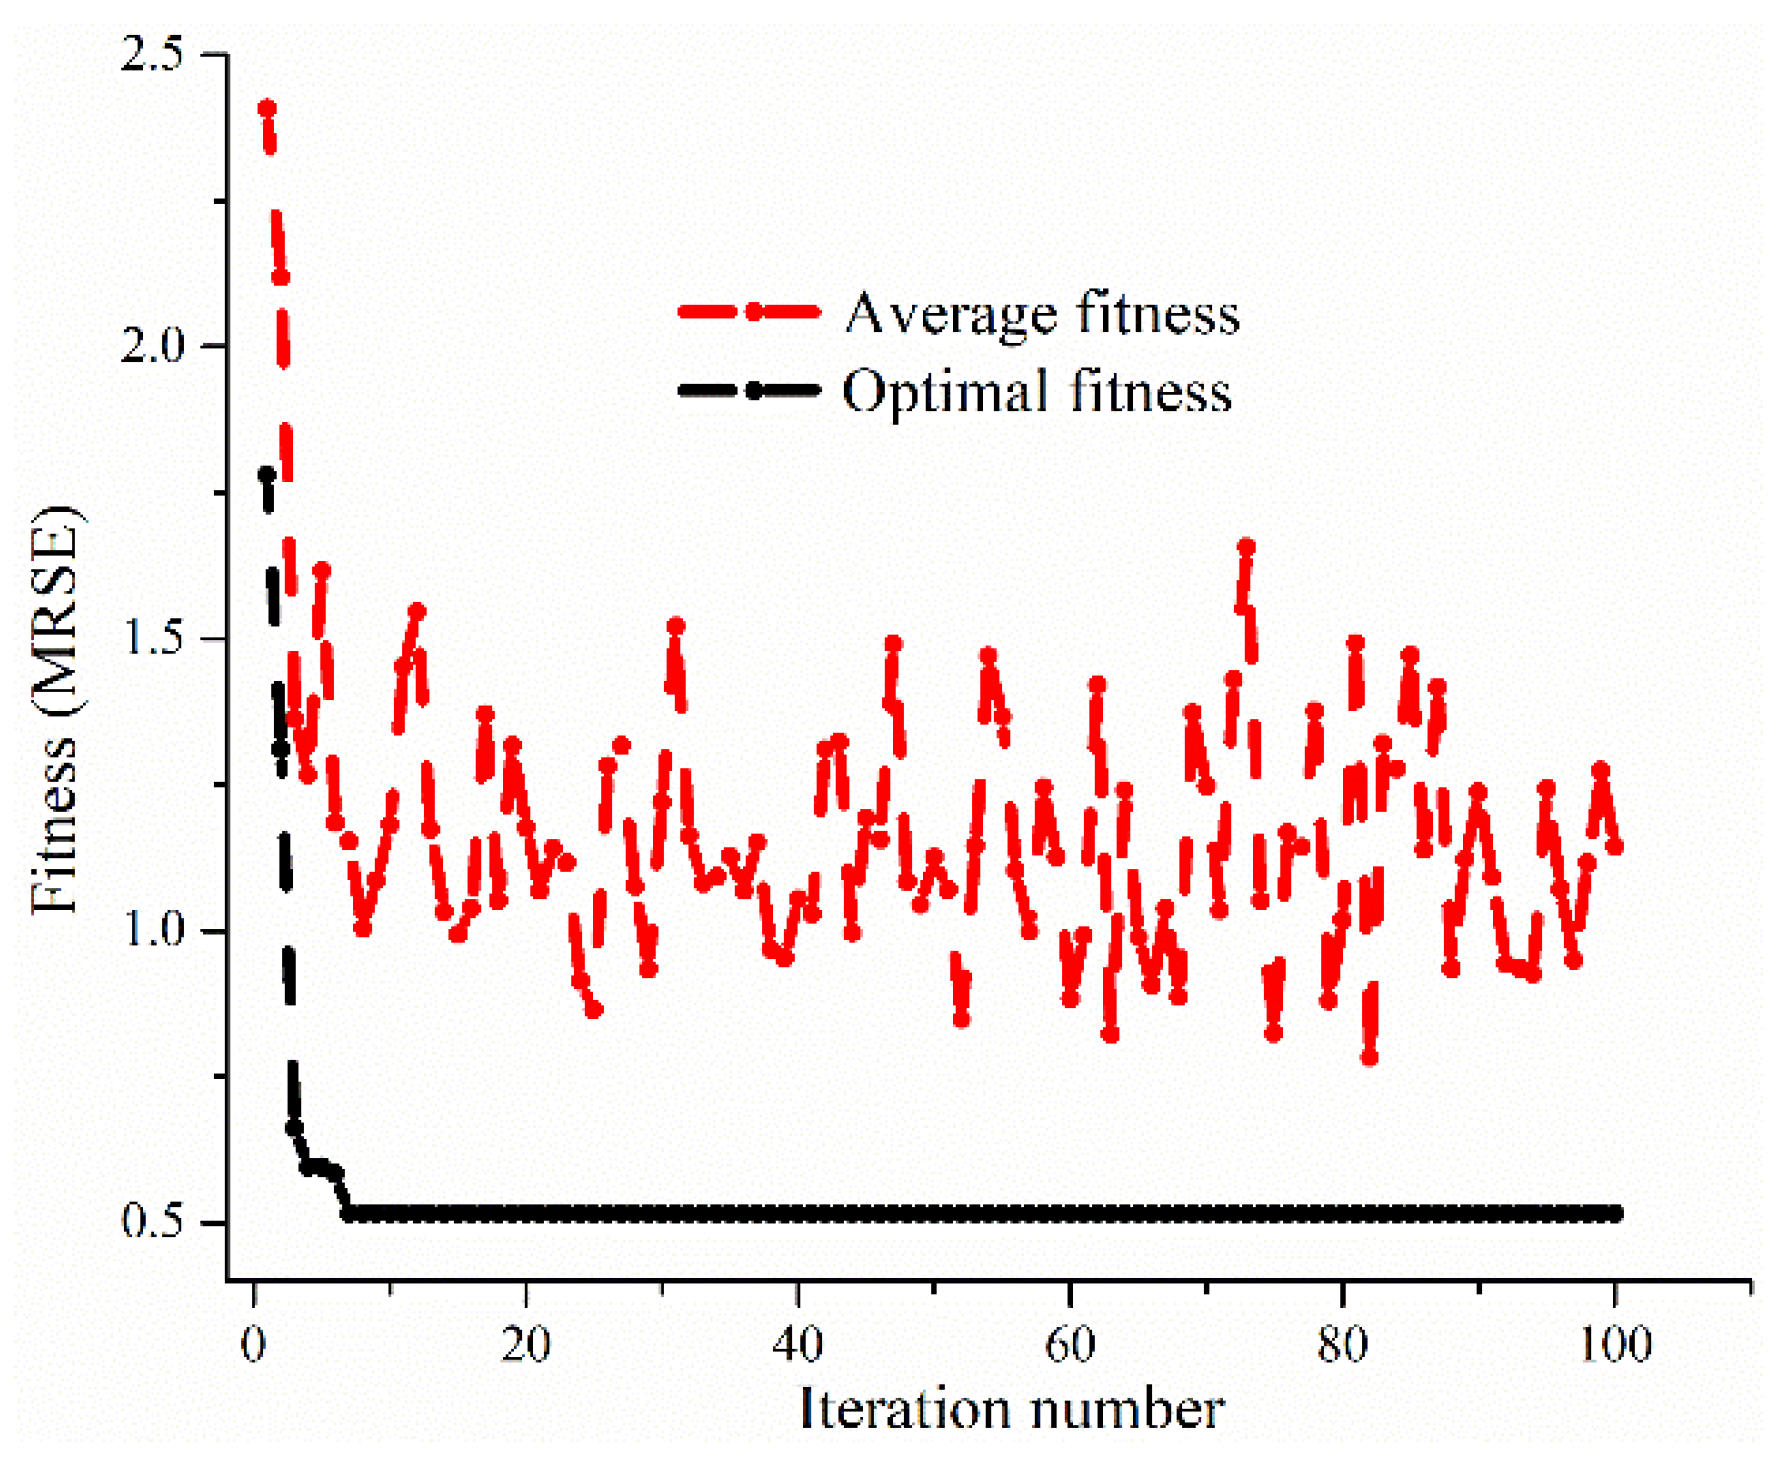
5.2. The Principle of PSO

Kennedy and Eberhart first presented the PSO algorithm, which was inspired by the way birds hunt [61]. When tackling optimization issues, PSO is often used. It is made up of a population of particles, each of which stands for a possible fix for the issue. The corresponding fitness function establishes each particle’s fitness value. Each particle’s velocity governs its direction and movement distance within the solution space. This velocity is dynamically adjusted based on the particle’s historical movement experiences and interactions with other particles, ultimately facilitating the optimization of individual solutions [62].
The following is the PSO’s operational procedure: To begin, a collection of particles is started in the solution space, each denoting a possible best solution. The three primary markers of a particle’s properties are its location, velocity, and fitness value. As a measure of a particle’s quality, the fitness value is calculated using the fitness function [63]. The particles then move over the solution space, and each particle’s location is constantly updated by keeping an eye on the global optimal location (extremum) for the entire population and the ideal position for each individual particle. The place with the highest fitness value that a particle has encountered throughout its travel corresponds to the extremum of that particular particle.
Conversely, the population extremum represents the particle with the highest fitness value throughout the population. Every time a position is updated, all particles’ fitness values are recalculated. Consequently, an individual particle’s extremum and the population extremum are continually refined based on the fitness values of the newly evaluated particles. This iterative procedure continues until the predefined termination condition is met [64].
X = (X1, X2, …, Xn) represents the number of n particles in a D-dimensional data domain. Every particle is encoded by a D-dimensional vector Xi = [xi1, xi2, …, xiD], indexed by i-th. This vector reflects a possible solution to the current issue and indicates the location of the i-th particle in the D-dimensional region. The i-th particle’s velocity is represented by the letter V = [ Vi1, V i2, …, ViD]T. Furthermore, each particle has an individual extremum represented by P = [Pi1, Pi2, …, PiD]T, whereas Pg = [Pg1, Pg2, …, PgD]T represents the global extremum for the entire population. The fitness value of each particle, evaluated at position Xi, is computed using the fitness function. Particle position and speed are revised according to the global extremum and each particular extremum during every iteration. Equation (6) displays the revised equations.
V i d k + 1 = ω V i d k + c 1 r 1 ( P i d k X i d k ) + c 2 r 2 ( P g d k X i d k ) , X i d k + 1 = X i d k + V i d k + 1 ,
where ω represents the inertia weight; d = 1, 2, …, D; i = 1, 2, …, n; k denotes the current iteration number; Vid denotes the velocity of the particle; C1 and C2 are non-negative constants referred to as acceleration factors; and random numbers r1 and r2 are drawn from a uniform distribution within the interval [0, l]. To prevent blind search behavior, it is advisable to constrain a particle’s position and velocity within the specified intervals [−Xmax, Xmax], [−Vmax, Vmax], respectively.

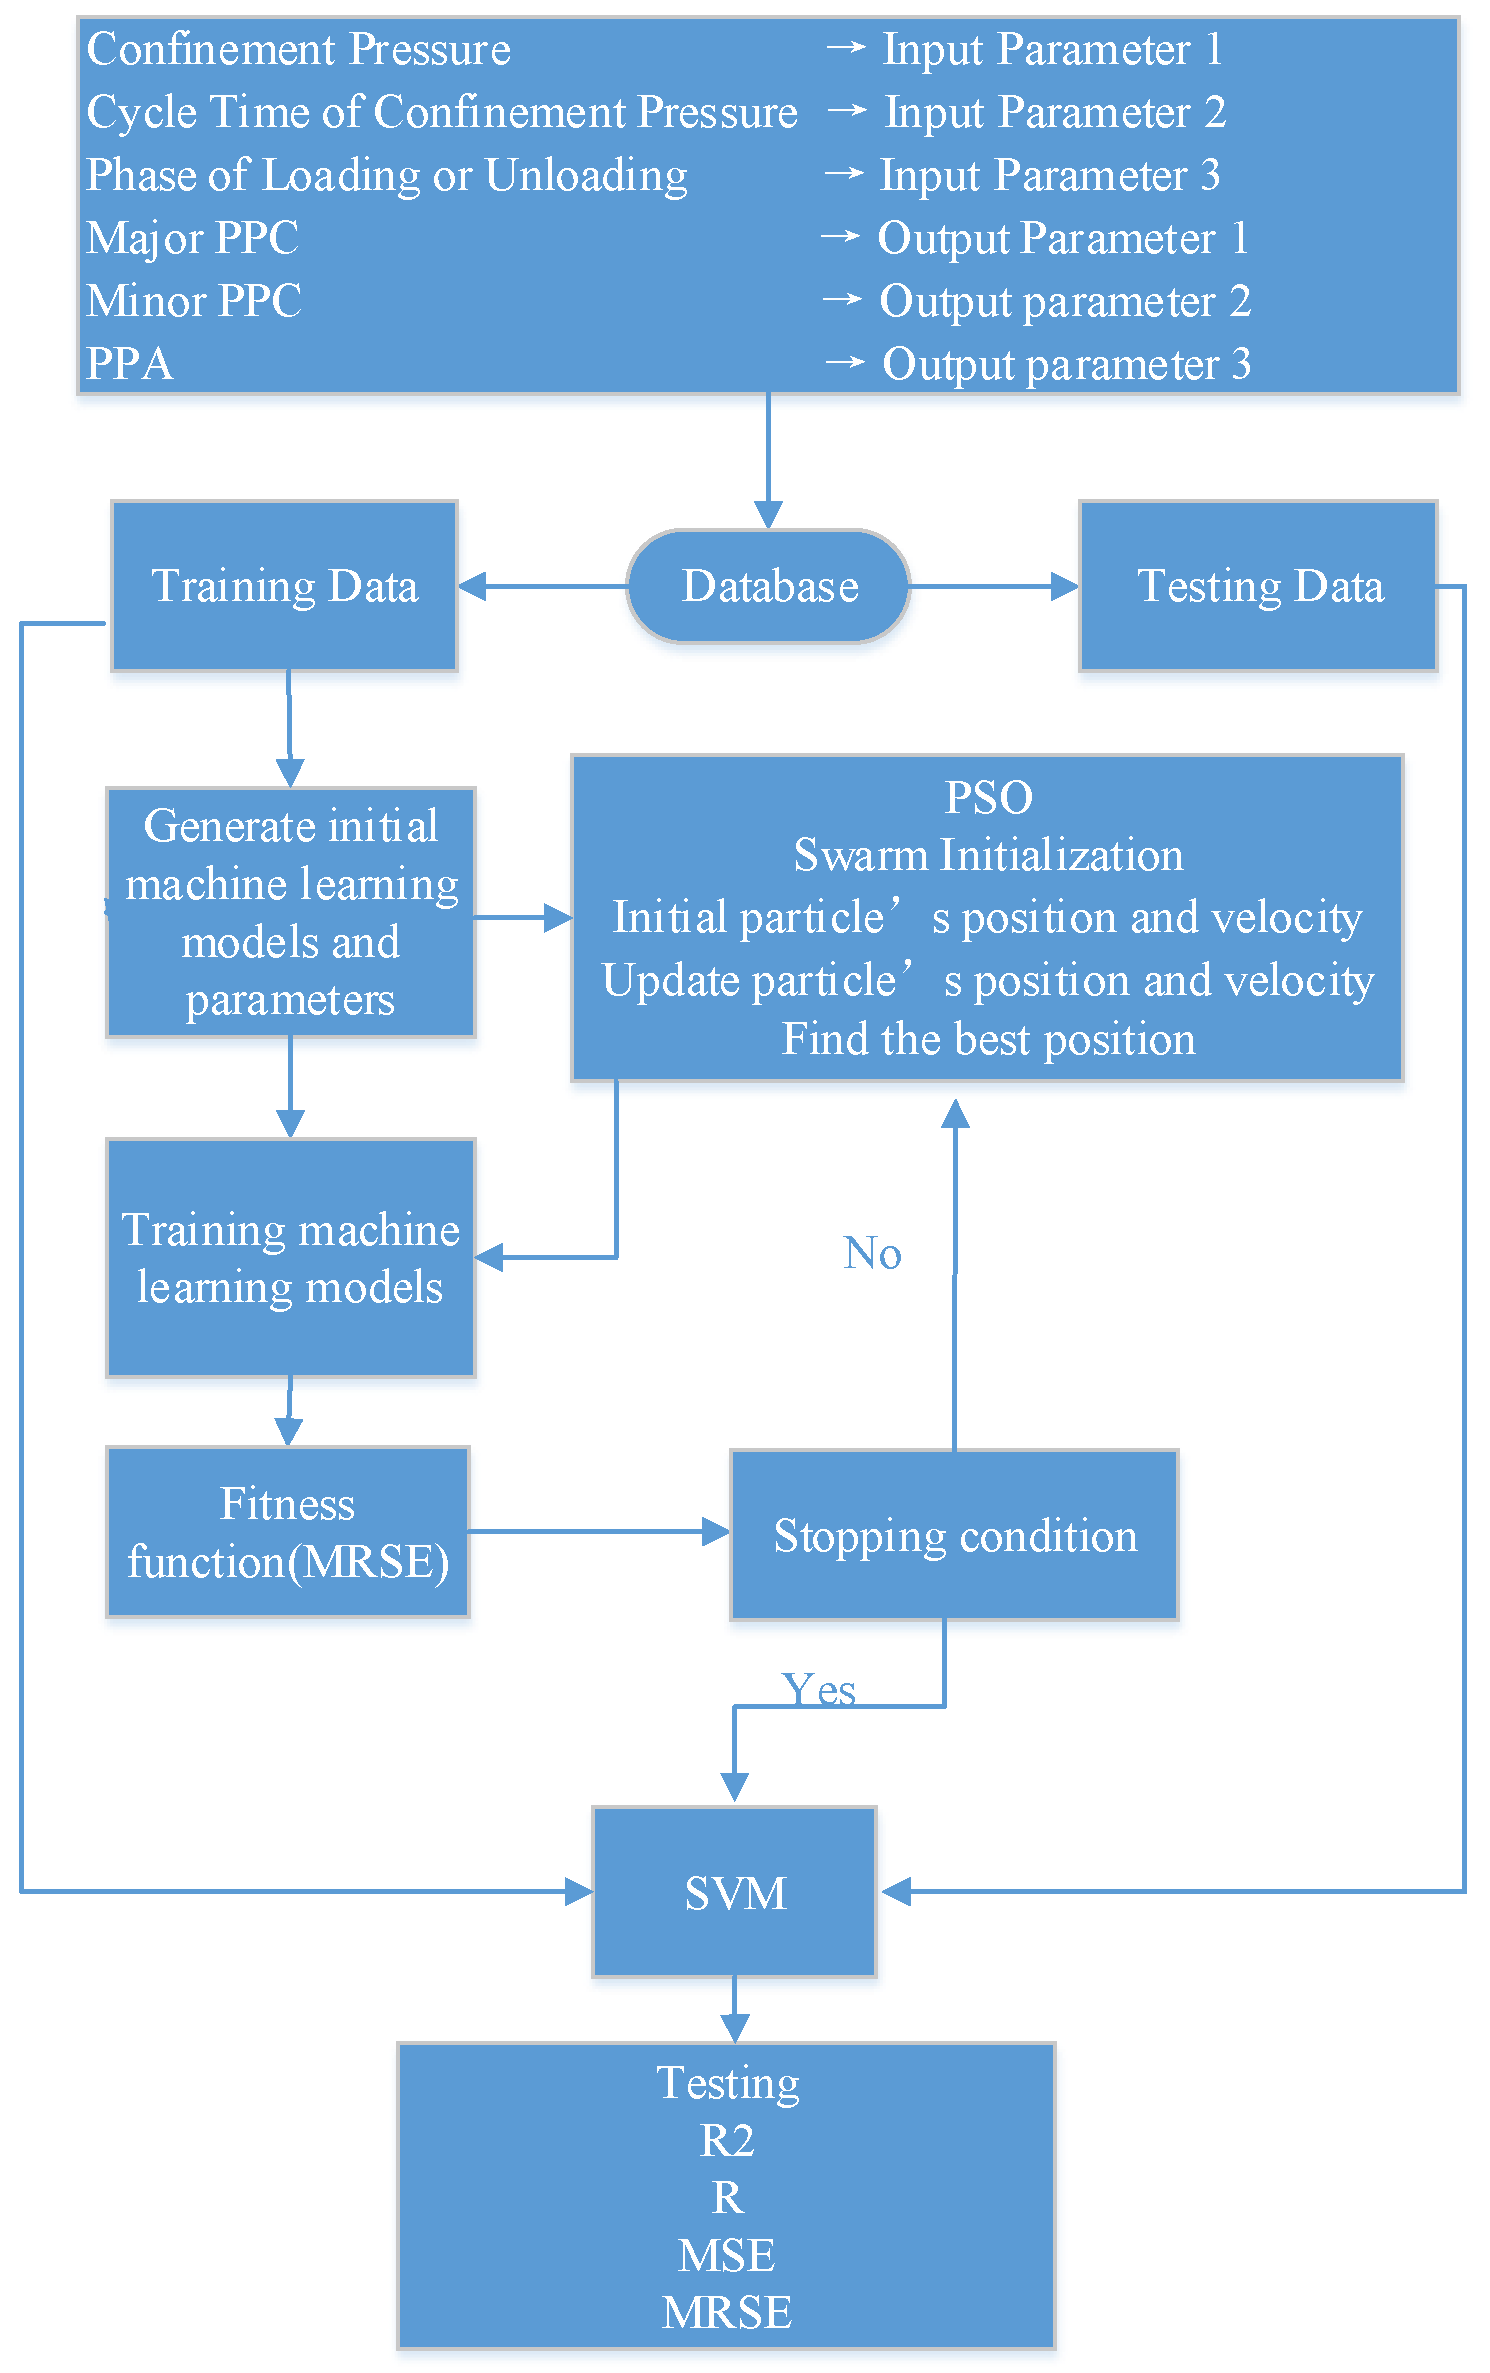
5.3. The Parameters of the Hybrid PSO-SVM Model

This study uses the PSO to improve the developed SVM model’s predictive accuracy. The PSO fitness function aggregates the MRSE to estimate the principal permeability angle, the major PPC, and the minor PPC. The hybrid PSO-SVM model uses PSO based on the K-fold Cross-Validation (K-CV) approach to estimate the penalty parameter (c) and the kernel function parameter (g) in the SVM model. In K-CV, the initial dataset is partitioned into K subsets (typically equal in size). Each subgroup is independently validated, while the additional K − 1 subsets serve as the training set. The average predictive accuracy across the K models serves as the performance metric for this K-CV predictor [65]. In this study, we consider K = 10. The SVM model employs the Radial Basis Function as its kernel function. The flowchart illustrating the optimized process, utilizing both GA and PSO, is depicted in Figure 4.

5.4. Quality Assessment

Four primary metrics were used to assess the machine-learning model’s predictive accuracy: the correlation coefficient R, the MSE, the MRSE, and the coefficient of determination R2. Equations (7)–(10) provide the mathematical equations for these four indications [66].
R 2 = 1 i ( y i f i ) 2 i ( y i y _ ) 2 ,
where y i represents the measured value, y _ denotes the average measured value, and f i corresponds to the predictive value.
M S E = | y i f i | n ,
where n represents the number of sample data.
M R S E = | 1 f i y i | n ,
R ( f i , y i ) = cov ( f i , y i ) var [ f i ] var [ y i ] ,

5.5. Normalization

Because the machine-learning model’s parameters for entry have different dimensions, it is impossible to ignore how they affect training time and prediction accuracy [67]. To address the impact of these dimension discrepancies and improve the machine-learning model’s ultimate precision and effectiveness, we used Equation (11) to normalize the input parameters to a range of zero to one.
x N o r m a l i s e d = x x min x max x min ,
where x N o r m a l i s e d represents normalized value, x denotes original value, x min corresponds to the minimum value, and x max corresponds to the maximum value.

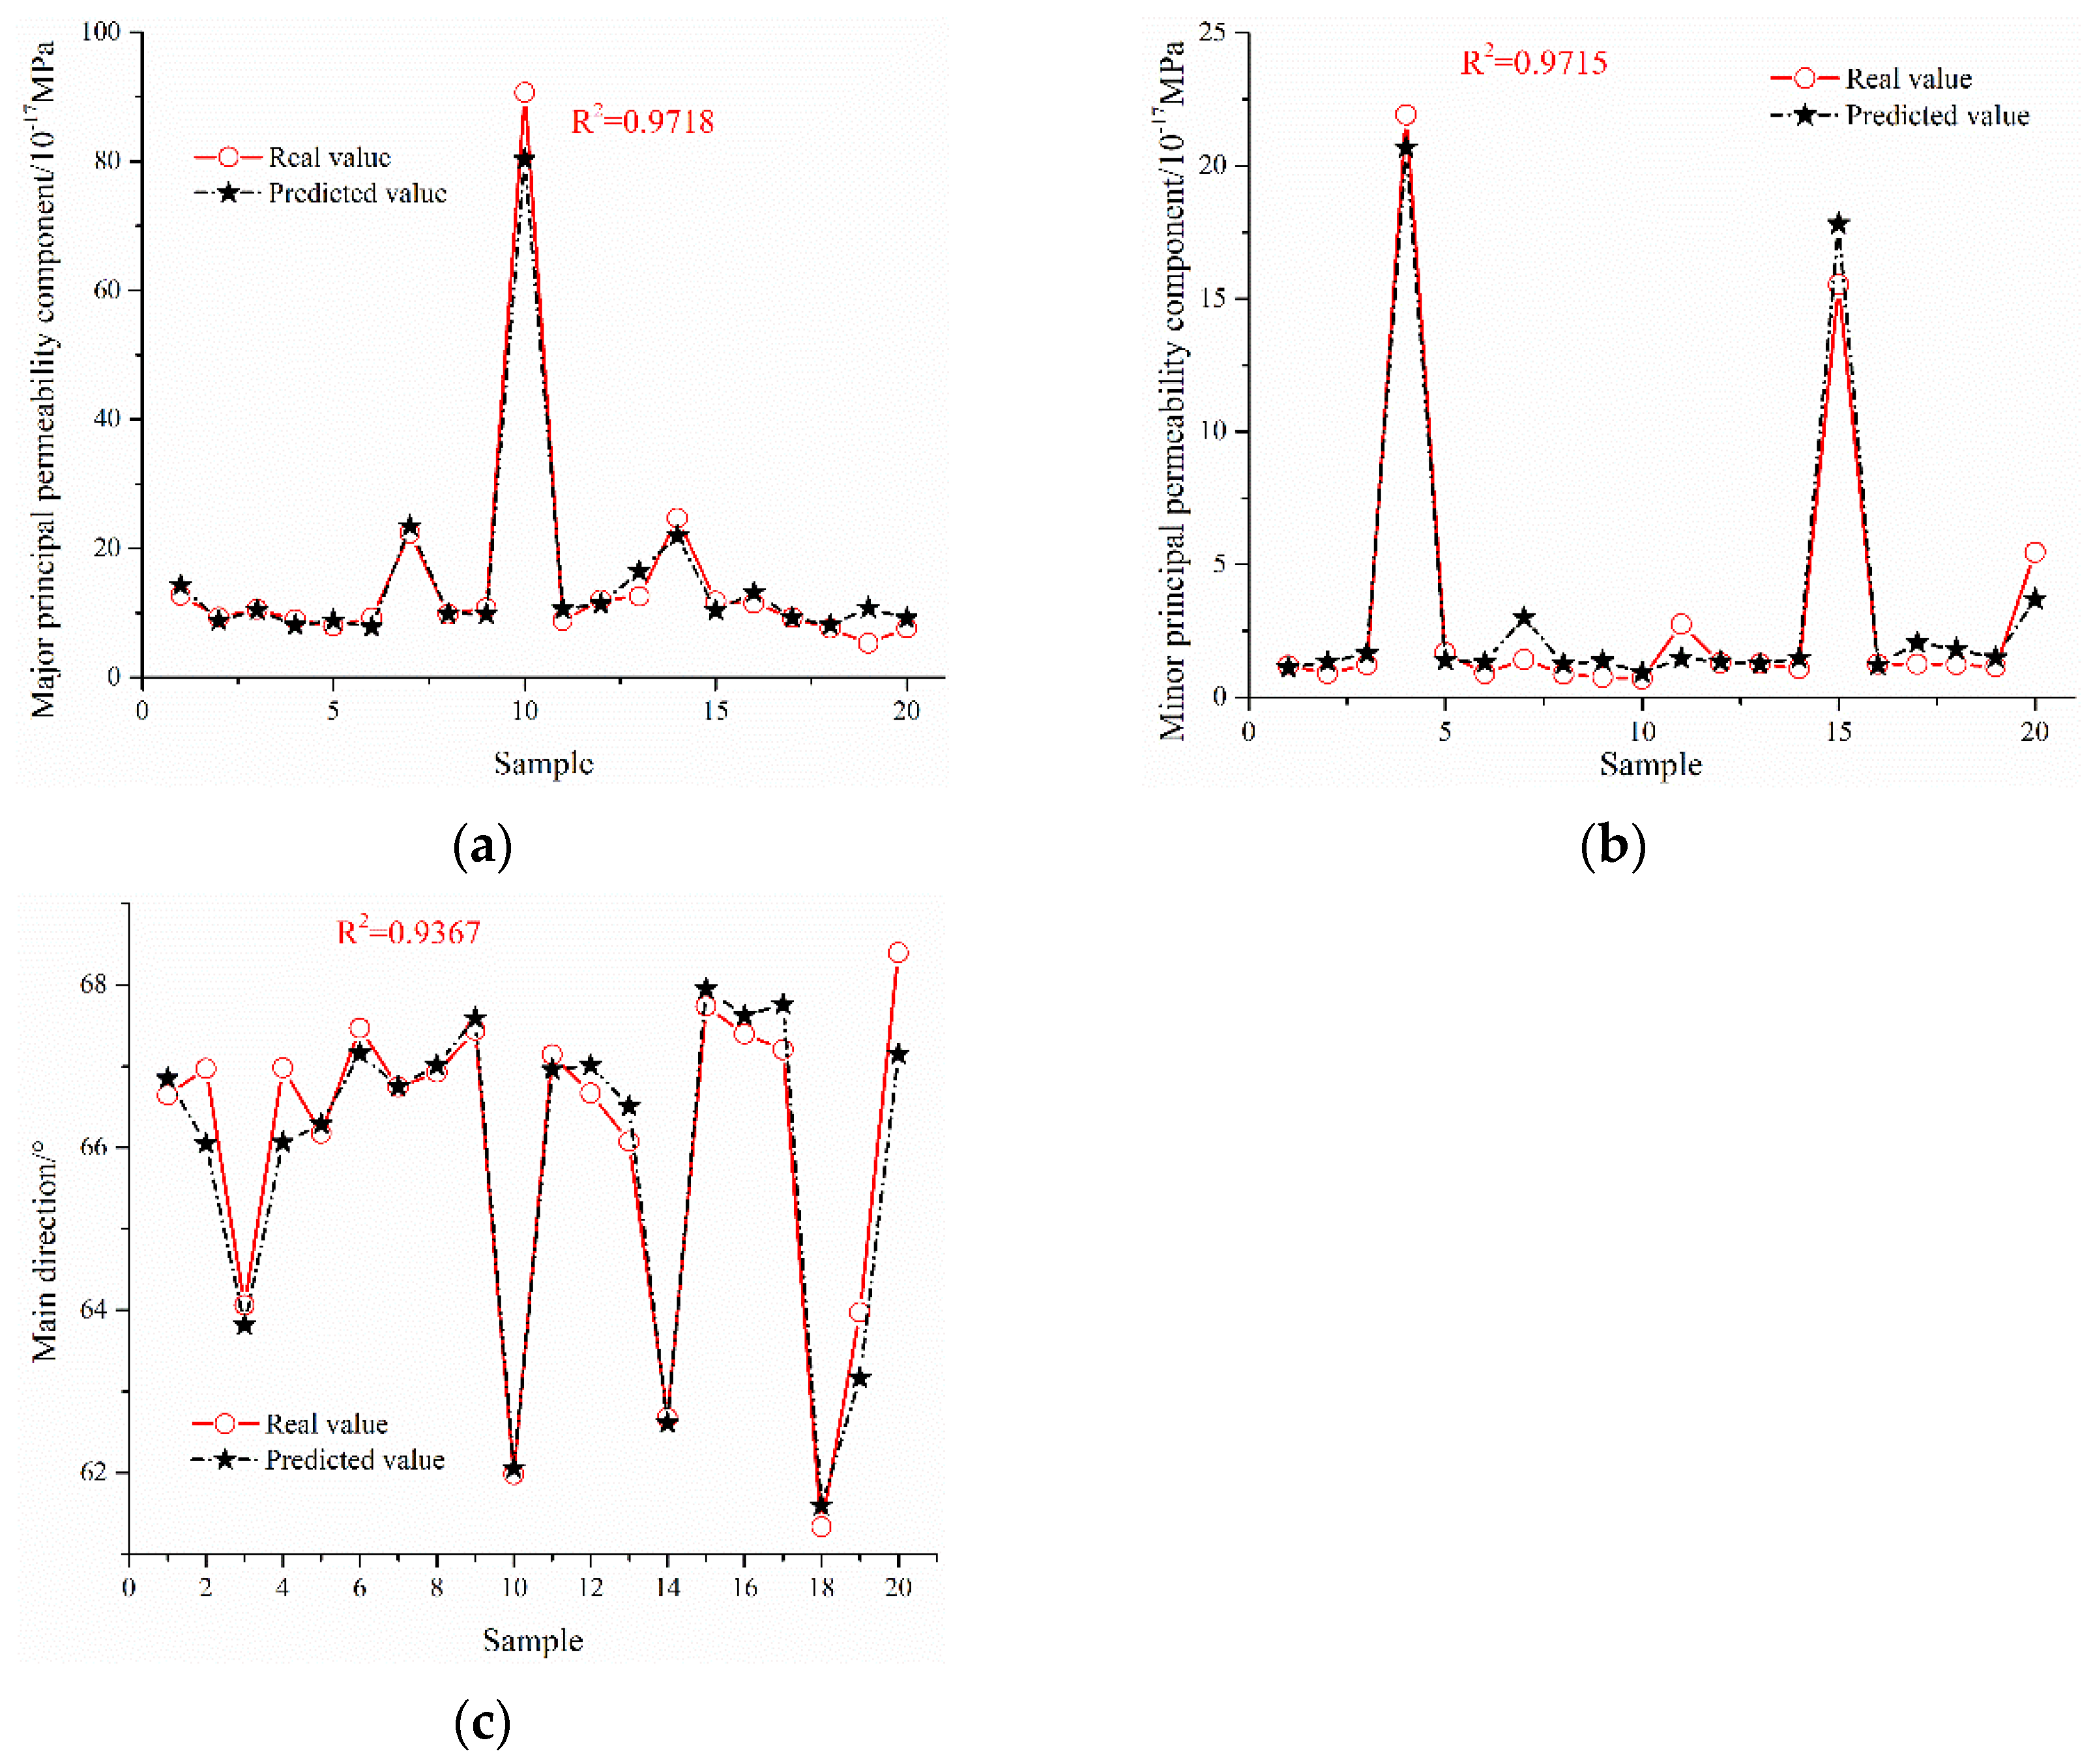
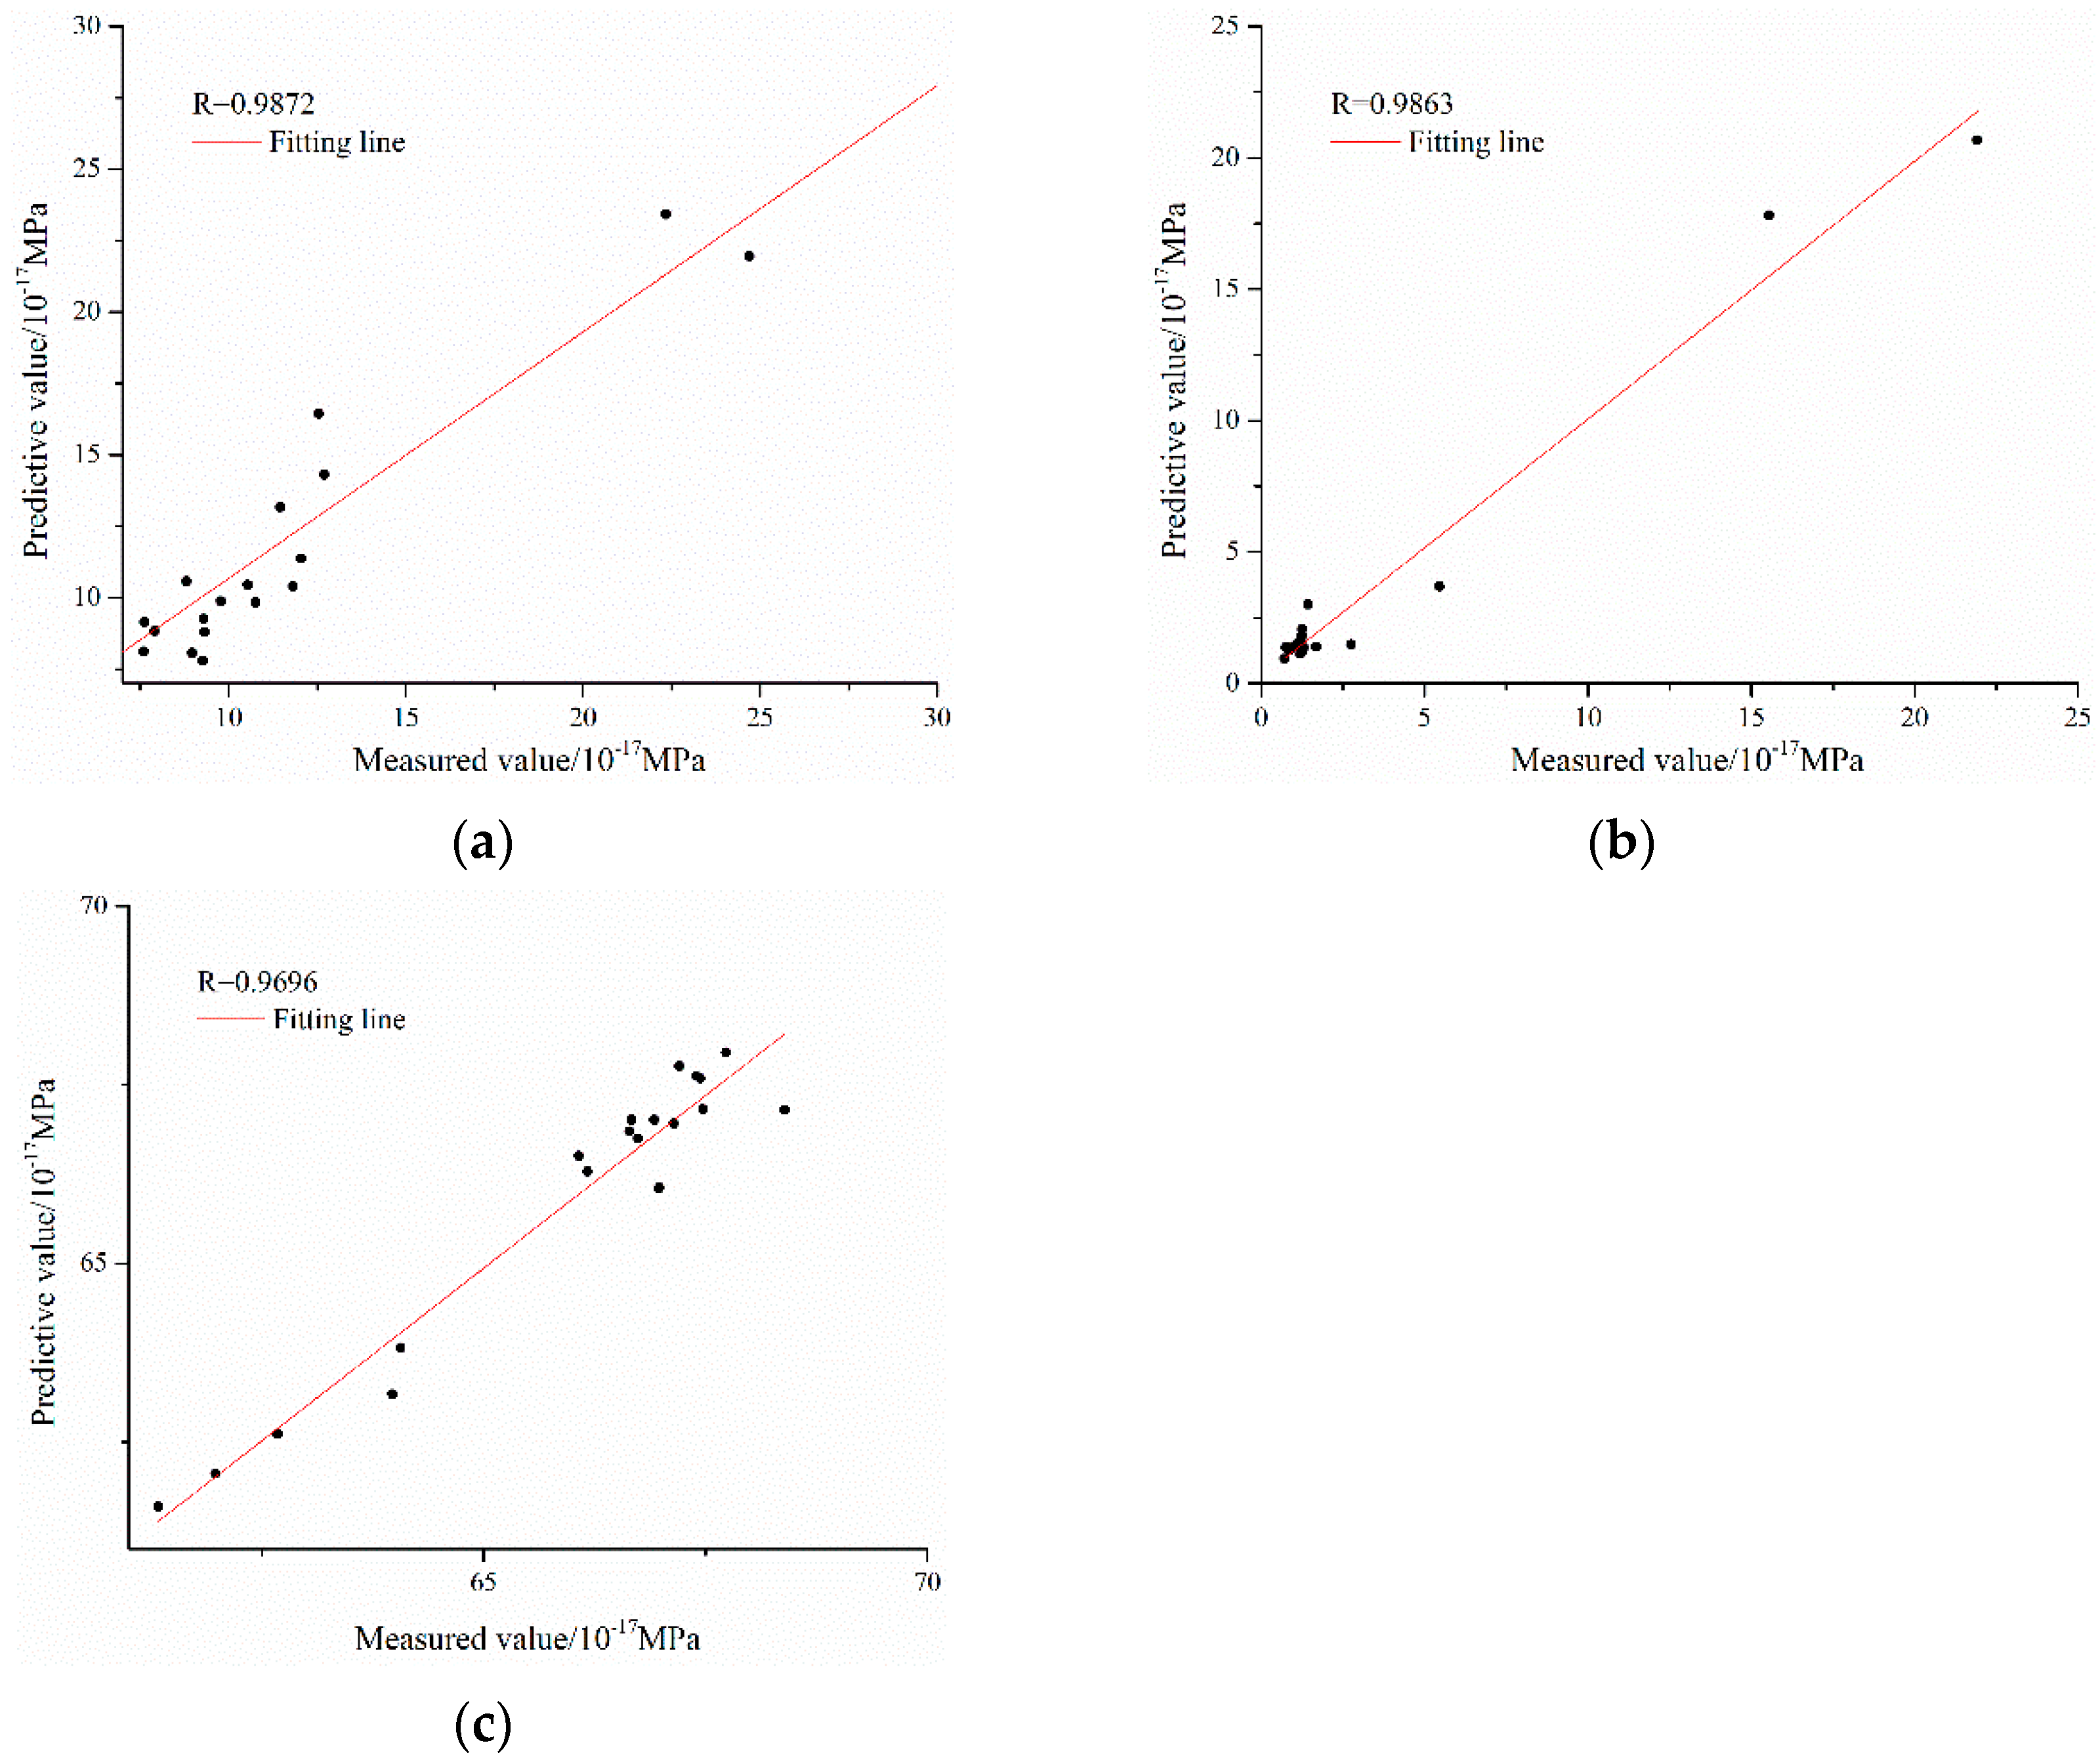
5.6. The Predictive Outcomes of the Machine-Learning Model

This section assesses the efficacy of the machine-learning architecture utilizing the hybrid PSO-SVM algorithm. As depicted in Figure 5, the R2 coefficients of the model were computed to predict the major PPC, the minor PPC, and the PPA.
Based on the R2 coefficient analysis presented in Figure 5, the machine-learning model demonstrates superior predictive performance for the major PPC of marine clayey sediment (R2 = 0.9718), which is close to 0.9715 for the minor PPC [68]. It is followed by the principal permeability angle, which is 0.9367.
Figure 6 illustrates that, based on the R coefficient analysis, the highest R-value (0.9872) is achieved for predicting the major PPC. This value is approximately 0.0009 greater than that obtained for the minor PPC. The R-value for predicting the principal permeability angle also stands at 0.9696.
Based on Figure 7, both the optimal and average fitness gradually decrease in the iteration process. For optimal wellness, it declines from about 1.8 to 0.515 after 20 times iteration, and it remains stable in the following iteration. The utilization of PSO significantly mitigates the forecasting error in the machine-learning predictive model, thereby enhancing the predictive accuracy [69,70,71]. Table 5 summarizes the R2, R, MSE, and MRSE metrics for the machine-learning prediction models that were created.
According to the statistical performance criteria presented in Table 5, the machine-learning model yields satisfactory predictions for the major PPC, the minor PPC, and the PPA of marine clayey sediment containing cracks under cyclic loading and unloading of confinement pressure. Consequently, the machine-learning model is deemed feasible for anticipating the permeability tensor of such sediment under similar conditions [53,72,73,74,75,76,77,78,79,80,81,82,83,84]. Specifically, the R2 values of the hybrid PSO-SVM model for predicting the major PPC, the minor PPC, and the PPA are all higher than 0.93. All of the R values of the model are above 0.969. Regarding the MSE, its value for predicting the minor PPC of marine clayey sediment containing cracks is the lowest at 0.1882. The following is the significant permeability component of marine clayey sediment (0.3693), which is 0.2922 lower than that of the major PPC. Regarding MRSE, its value for the major permeability component is the minimum (0.0056). The MRSE value for predicting the minor PPC is 0.1583, which is about 0.1933 lower than the principal permeability angle.

6. Conclusions

This study proposes a methodology for ascertaining the REV of marine clayey sediment containing cracks through cyclic confinement pressure loading and unloading that utilizes physical model tests. Following successfully verification of the REV’s existence in such sediment, we developed a machine-learning predictive model to estimate the permeability tensor under similar loading and unloading conditions. This model is informed by the results obtained from the physical tests. Effortlessly obtaining the permeability tensor of marine clayey sediment containing cracks under cyclic loading and confinement pressure unloading is achievable through our machine learning predictive model. By inputting the relevant stress condition parameters, this model offers an efficient and straightforward approach for engineering professionals to predict the permeability tensor. Due to the obvious permeability anisotropy of marine clayey sediment, its permeability has a significant impact on engineering safety. Therefore, it is of great theoretical value and engineering significance to predict the permeability tensor of marine clayey sediment in the process of confinement pressure cyclic loading and unloading by using physical tests and machine-learning technology. The principal research conclusions are summed up as follows:
  • The effects of confinement pressure on the permeability of marine clayey sediment with different crack dip angles are most noticeable during the first loading phase, which includes the first application and the subsequent unloading of confinement pressure. However, in the subsequent cyclic loading and unloading stages, the influence of confinement pressure on permeability diminishes.
  • The outcomes from the physical tests reveal an exponential relationship between the permeability of marine clayey sediment, varying crack dip angles, and confinement pressure during different loading and unloading phases of the confinement pressure cycle.
  • Based on the proposed method, the existence of REV for marine clayey sediment containing cracks during cyclic loading and unloading of confinement pressure is verified.
  • The hybrid PSO-SVM model, developed using a mathematical model database, accurately predicts the permeability tensor of marine clayey sediment containing cracks under cyclic loading and unloading of confinement pressure. This prediction aligns with statistical performance criteria, including R2, R, MSE, and MRSE.
  • The utilization of PSO significantly enhances the predictive accuracy of the SVM model for estimating the permeability tensor of marine clayey sediment containing cracks throughout the cyclical confinement pressure loading and unloading.

Author Contributions

Conceptualization, P.C. and J.Z.; methodology, P.C. and J.Z.; software, P.C. and B.C.; validation, R.G. and K.T., formal analysis, P.C.; investigation, Z.F. and P.T.; writing—original draft preparation, B.C. and X.F.; writing—review and editing J.Z.; visualization, X.F.; supervision, H.L. and Y.Z.; project administration, Y.J.; funding acquisition, Y.J. All authors have read and agreed to the published version of the manuscript.

Funding

This research was funded by the National Key R&D Program of China (2017YFC1501100), the National Natural Science Foundation of China (11772116, 11572110), the Fundamental Research Funds for the Central Universities (2016B05314), the National Natural Science Foundation of China (72204113), the National Natural Science Foundation of China (NSFC, Project Nos. 42006157), and the Belt and Road Special Foundation of the National Key Laboratory of Water Disaster Prevention (2020492111).

Data Availability Statement

Data available upon request.

Conflicts of Interest

Author Yipei Zhang was employed by the company CCCC Third Harbor Consultants Co., Ltd., Author Bo Cao was employed by the company Panjin Water Supply Engineering Co., Ltd. The remaining authors declare that the research was conducted in the absence of any commercial or financial relationships that could be construed as a potential conflict of interest.

References

  1. Chao, Z.; Shi, D.; Zheng, J. Experimental research on temperature—Dependent dynamic interface interaction between marine coral sand and polymer layer. Ocean Eng. 2024, 297, 117100. [Google Scholar] [CrossRef]
  2. Dong, Y. Reseeding of particles in the material point method for soil–structure interactions. Comput. Geotech. 2020, 127, 103716. [Google Scholar] [CrossRef]
  3. Fan, N.; Jiang, J.; Nian, T.-K.; Dong, Y.; Guo, L.; Fu, C.; Tian, Z.; Guo, X. Impact action of submarine slides on pipelines: A review of the state-of-the-art since 2008. Ocean Eng. 2023, 286, 115532. [Google Scholar] [CrossRef]
  4. Hou, Z.; Liu, Y.; Han, Z.; Tang, M.; Gong, X.; Su, D.; Wang, L. Experimental Study of the Bearing Characteristics of a Novel Energy-Saving and Environmentally Friendly Pile: Drilling with Prestressed Concrete Pipe Cased Piles. Int. J. Geomech. 2024, 24, 04024035. [Google Scholar] [CrossRef]
  5. Chao, Z.; Wang, H.; Hu, S.; Wang, M.; Xu, S.; Zhang, W. Permeability and porosity of light-weight concrete with plastic waste aggregate: Experimental study and machine learning modelling. Constr. Build. Mater. 2024, 411, 134465. [Google Scholar] [CrossRef]
  6. Dong, Y.; Wang, D.; Randolph, M.F. Investigation of impact forces on pipeline by submarine landslide using material point method. Ocean Eng. 2017, 146, 21–28. [Google Scholar] [CrossRef]
  7. Liu, Y.; Wang, L.; Liu, Z.; Kang, Y.; Chen, T.; Xu, C.; Zhu, T. Durable Immunomodulatory Nanofiber Niche for the Functional Remodeling of Cardiovascular Tissue. ACS Nano 2023, 18, 951–971. [Google Scholar] [CrossRef] [PubMed]
  8. Ma, W.; Liu, Z.; Zhu, T.; Wang, L.; Du, J.; Wang, K.; Xu, C. Fabric-enhanced Vascular Graft with Hierarchical Structure for Promoting The Regeneration of Vascular Tissue. Adv. Healthc. Mater. 2024, 2302676. [Google Scholar] [CrossRef] [PubMed]
  9. Ren, P.; Chen, Z.; Li, L.; Gong, W.; Li, J. Dynamic shakedown behaviors of flexible pavement overlying saturated ground under moving traffic load considering effect of pavement roughness. Comput. Geotech. 2024, 168, 106134. [Google Scholar] [CrossRef]
  10. Shao, W.; He, X.; Shi, D.; Zhu, W. Prediction of Crack Width in RC Piles Exposed to Local Corrosion in Chloride Environment. Materials 2023, 16, 6403. [Google Scholar] [CrossRef]
  11. Shao, W.; Li, Q.; Zhang, W.; Shi, D.; Li, H. Numerical modeling of chloride diffusion in cement-based materials considering calcium leaching and external sulfate attack. Constr. Build. Mater. 2023, 401, 132913. [Google Scholar] [CrossRef]
  12. Shao, W.; Qin, F.; Shi, D.; Ali Soomro, M. Horizontal bearing characteristic and seismic fragility analysis of CFRP composite pipe piles subject to chloride corrosion. Comput. Geotech. 2024, 166, 105977. [Google Scholar] [CrossRef]
  13. Shi, D.; Chen, X.; Shao, W. Modeling of bidirectional chloride convection-diffusion for corrosion initiation life prediction of RC square piles under drying-wetting cycle. Appl. Ocean Res. 2023, 141, 103789. [Google Scholar] [CrossRef]
  14. Zhang, W.; Shi, D.; Shen, Z.-Y.; Zhang, J.; Zhao, S.; Gan, L.; Li, Q.; Chen, Y.; Tang, P.-F. Influence of chopped basalt fibers on the fracture performance of concrete subjected to calcium leaching. Theor. Appl. Fract. Mech. 2023, 125, 103934. [Google Scholar] [CrossRef]
  15. Zhang, Y.; Zang, W.; Zheng, J.; Cappietti, L.; Zhang, J.; Zheng, Y.; Fernández-Rodríguez, E. The influence of waves propagating with the current on the wake of a tidal stream turbine. Appl. Energy 2021, 290, 116729. [Google Scholar] [CrossRef]
  16. Zhang, Y.; Zhang, Z.; Zheng, J.; Zheng, Y.; Zhang, J.; Liu, Z.; Fernández-Rodríguez, E. Research of the array spacing effect on wake interaction of tidal stream turbines. Ocean Eng. 2023, 276, 114227. [Google Scholar] [CrossRef]
  17. Zhao, G.; Wu, T.; Ren, G.; Zhu, Z.H.; Gao, Y.; Shi, M.; Ding, S.; Fan, H. Reusing waste coal gangue to improve the dispersivity and mechanical properties of dispersive soil. J. Clean. Prod. 2023, 404, 136993. [Google Scholar] [CrossRef]
  18. Zhao, G.; Zhu, Z.; Ren, G.; Wu, T.; Ju, P.; Ding, S.; Shi, M.; Fan, H. Utilization of recycled concrete powder in modification of the dispersive soil: A potential way to improve the engineering properties. Constr. Build. Mater. 2023, 389, 131626. [Google Scholar] [CrossRef]
  19. Zhao, S.; Zhang, J.; Feng, S. The era of low-permeability sites remediation and corresponding technologies: A review. Chemosphere 2022, 313, 137264. [Google Scholar] [CrossRef]
  20. Zheng, H.; Zhang, H.; Liang, F.; Li, L. Numerical investigation on lateral monotonic and cyclic responses of scoured rigid monopile based on an integrated bounding surface model. Comput. Geotech. 2024, 166, 105997. [Google Scholar] [CrossRef]
  21. Shan, Z.-G.; Di, S.-J. Loading-unloading test analysis of anisotropic columnar jointed basalts. J. Zhejiang Univ. Sci. A 2013, 14, 603–614. [Google Scholar] [CrossRef]
  22. Zheng, Z.; Deng, B.; Li, S.; Zheng, H. Disturbance mechanical behaviors and anisotropic fracturing mechanisms of rock under novel three-stage true triaxial static-dynamic coupling loading. Rock. Mech. Rock. Eng. 2023, 57, 2445–2468. [Google Scholar] [CrossRef]
  23. Zheng, Z.; Xu, H.; Zhang, K.; Feng, G.; Zhang, Q.; Zhao, Y. Intermittent disturbance mechanical behavior and fractional deterioration mechanical model of rock under complex true triaxial stress paths. Int. J. Min. Sci. Technol. 2024, 34, 117–136. [Google Scholar] [CrossRef]
  24. Zhou, B.-Y.; Ku, Q.; Li, C.H.; Wang, H.; Dong, Y.; Cheng, Z. Single-particle crushing behaviour of carbonate sands studied by X-ray microtomography and a combined finite–discrete element method. Acta Geotech. 2022, 17, 3195–3209. [Google Scholar] [CrossRef]
  25. Esmaieli, K.; Hadjigeorgiou, J.; Grenon, M. Estimating geometrical and mechanical REV based on synthetic rock mass models at Brunswick Mine. Int. J. Rock. Mech. Min. 2010, 47, 915–926. [Google Scholar] [CrossRef]
  26. Ni, P.; Wang, S.; Wang, C.; Zhang, S. Estimation of REV size for fractured rock mass based on damage coefficient. Rock. Mech. Rock. Eng. 2017, 50, 555–570. [Google Scholar] [CrossRef]
  27. Xia, L.; Zheng, Y.; Yu, Q. Estimation of the REV size for blockiness of fractured rock masses. Comput. Geotech. 2016, 76, 83–92. [Google Scholar] [CrossRef]
  28. Wang, Z.; Li, W.; Bi, L.; Qiao, L.; Liu, R.; Liu, J. Estimation of the REV size and equivalent permeability coefficient of fractured rock masses with an emphasis on comparing the radial and unidirectional flow configurations. Rock. Mech. Rock. Eng. 2018, 51, 1457–1471. [Google Scholar] [CrossRef]
  29. Figueiredo, B.; Cornet, F.; Lamas, L.; Muralha, J. Determination of the stress field in a mountainous granite rock mass. Int. J. Rock. Mech. Min. 2014, 72, 37–48. [Google Scholar] [CrossRef]
  30. Yin, L.; Gong, Q.; Zhao, J. Study on rock mass boreability by TBM penetration test under different in situ stress conditions. Tunn. Undergr. Space Technol. 2014, 43, 413–425. [Google Scholar] [CrossRef]
  31. Wei, Y.; Xu, M.; Wang, W.; Shi, A.; Tang, M.; Ye, Z. Feasibility of columnar jointed basalt used for high-arch dam foundation. J. Rock. Mech. Geotech. 2011, 3, 461–468. [Google Scholar]
  32. Demirel, S.; Irving, J.; Roubinet, D. Comparison of REV size and tensor characteristics for the electrical and hydraulic conductivities in fractured rock. Geophys. J. Int. 2018, 216, 1953–1973. [Google Scholar] [CrossRef]
  33. Zhang, W.; Li, H.; Shi, D.; Shen, Z.-Y.; Zhao, S.; Guo, C. Determination of Safety Monitoring Indices for Roller-Compacted Concrete Dams Considering Seepage–Stress Coupling Effects. Mathematics 2023, 11, 3224. [Google Scholar] [CrossRef]
  34. Shi, D.; Niu, J.; Zhang, J.; Chao, Z.; Fowmes, G.J. Effects of particle breakage on the mechanical characteristics of geogrid-reinforced granular soils under triaxial shear: A DEM investigation. Geomech. Energy Environ. 2023, 34, 100446. [Google Scholar] [CrossRef]
  35. Lan, F.; Haisen, W.; Yan, Y. Spatial–Temporal Variations of Water Quality in Urban Rivers after Small Sluices Construction: A Case in Typical Regions of the Taihu Lake Basin. Int. J. Environ. Res. Public Health 2022, 19, 12453. [Google Scholar] [CrossRef] [PubMed]
  36. Lang, P.; Paluszny, A.; Zimmerman, R. Permeability tensor of three-dimensional fractured porous rock and a comparison to trace map predictions. J. Geophys. Res. 2014, 119, 6288–6307. [Google Scholar] [CrossRef]
  37. Liu, R.; Li, B.; Jiang, Y.; Huang, N. Mathematical expressions for estimating equivalent permeability of rock fracture networks. Hydrogeol. J. 2016, 24, 1623–1649. [Google Scholar] [CrossRef]
  38. Vu, M.N.; Pouya, A.; Seyedi, D.M. Modelling of steady-state fluid flow in 3D fractured isotropic porous media: Application to effective permeability calculation. Int. J. Numer. Anal. Met. 2013, 37, 2257–2277. [Google Scholar] [CrossRef]
  39. Vu, M.; Nguyen, S.; To, Q.; Dao, N. Theoretical predicting of permeability evolution in damaged rock under compressive stress. Geophys. J. Int. 2017, 209, 1352–1361. [Google Scholar] [CrossRef]
  40. Dong, Z.; Qin, R.; Zou, P.; Yao, X.; Cui, P.; Zhang, F.; Yang, Y. Occupational health risk assessment of PC production-caused pollution based on damage assessment and cyclic mitigation model. Eng. Constr. Archit. Manag. 2024. [Google Scholar] [CrossRef]
  41. Wang, P.T.; Yang, T.H.; Xu, T.; Yu, Q.L.; Liu, H.L. A model of anisotropic property of seepage and stress for jointed rock mass. J. Appl. Math. 2013, 2013, 420536. [Google Scholar] [CrossRef]
  42. Zhang, L.L.; Xia, L.; Yu, Q.C. Determining the REV for Fracture Rock Mass Based on Seepage Theory. Geofluids 2017, 2017, 4129240. [Google Scholar] [CrossRef]
  43. Ji, H.; Chen, S.H.; Shahrour, I. A revised solution of equivalent permeability tensor for discontinuous fractures. J. Hydrodyn. Ser. B 2012, 24, 711–717. [Google Scholar]
  44. Hao, X.J.; Feng, X.T.; Yang, C.X.; Jiang, Q.; Li, S.J. Analysis of EDZ development of columnar jointed rock mass in the Baihetan diversion tunnel. Rock. Mech. Rock. Eng. 2016, 49, 1289–1312. [Google Scholar] [CrossRef]
  45. Meng, G.; Detournay, C.; Cundall, P. Continuum/discrete numerical simulation of columnar basalt in large-scale underground excavations. In Proceedings of the ARMA US Rock Mechanics/Geomechanics Symposium, Houston, TX, USA, 26–29 June 2016; p. ARMA-2016-211. [Google Scholar]
  46. Wang, L.; Zhong, X.; Yang, J.; Tao, S.; Zhang, W.; Wang, Y.; Sun, X. Finite element simulation of surface micro-indentation behavior of yttria stabilized zirconia thermal barrier coatings with microstructural characteristic of columnar grains and sub-grains based on a nonlinear contact model. Comput. Mater. Sci. 2014, 82, 244–256. [Google Scholar] [CrossRef]
  47. Gholami, R.; Rasouli, V.; Alimoradi, A. Improved RMR rock mass classification using artificial intelligence algorithms. Rock. Mech. Rock. Eng. 2013, 46, 1199–1209. [Google Scholar] [CrossRef]
  48. Ceryan, N.; Okkan, U.; Samui, P.; Ceryan, S. Modeling of tensile strength of rocks materials based on support vector machines approaches. Int. J. Numer. Anal. Met. 2013, 37, 2655–2670. [Google Scholar] [CrossRef]
  49. Ceryan, N.; Okkan, U.; Kesimal, A. Application of generalized regression neural networks in predicting the unconfined compressive strength of carbonate rocks. Rock. Mech. Rock. Eng. 2012, 45, 1055–1072. [Google Scholar] [CrossRef]
  50. Saeidi, O.; Torabi, S.R.; Ataei, M. Prediction of the rock mass diggability index by using fuzzy clustering-based, ANN and multiple regression methods. Rock. Mech. Rock. Eng. 2014, 47, 717–732. [Google Scholar] [CrossRef]
  51. Cui, C.-y.; Zhang, S.; Chapman, D.; Meng, K. Dynamic impedance of a floating pile embedded in poro-visco-elastic soils subjected to vertical harmonic loads. Geomech. Eng. 2018, 15, 793–803. [Google Scholar]
  52. Rong, G.; Peng, J.; Wang, X.; Liu, G.; Hou, D. Permeability tensor and representative elementary volume of fractured rock masses. Hydrogeol. J. 2013, 21, 1655–1671. [Google Scholar] [CrossRef]
  53. Cui, C.; Zhang, S.; Yang, G.; Li, X.-F. Vertical vibration of a floating pile in a saturated viscoelastic soil layer overlaying bedrock. J. Cent. South Univ. 2016, 23, 220–232. [Google Scholar] [CrossRef]
  54. Pan, J.B.; Lee, C.C.; Lee, C.H.; Yeh, H.F.; Lin, H.I. Application of fracture network model with crack permeability tensor on flow and transport in fractured rock. Eng. Geol. 2010, 116, 166–177. [Google Scholar] [CrossRef]
  55. Chang, C.C.; Lin, C.J. LIBSVM: A library for support vector machines. ACM Trans. Intell. Syst. Technol. 2011, 2, 27. [Google Scholar] [CrossRef]
  56. Peng, X. TSVR: An efficient twin support vector machine for regression. Neural Netw. 2010, 23, 365–372. [Google Scholar] [CrossRef]
  57. Balabin, R.M.; Lomakina, E.I. Support vector machine regression (LS-SVM)—An alternative to artificial neural networks (ANNs) for the analysis of quantum chemistry data? Phys. Chem. Chem. Phys. 2011, 13, 11710–11718. [Google Scholar] [CrossRef]
  58. Brereton, R.G.; Lloyd, G.R. Support vector machines for classification and regression. Analyst 2010, 135, 230–267. [Google Scholar] [CrossRef] [PubMed]
  59. Meyer, D.; Wien, F.T. Support vector machines. R News 2001, 1, 23–26. [Google Scholar]
  60. Gu, B.; Sheng, V.S.; Tay, K.Y.; Romano, W.; Li, S. Incremental support vector learning for ordinal regression. IEEE Trans. Neural Netw. Learn. Syst. 2015, 26, 1403–1416. [Google Scholar] [CrossRef]
  61. Kennedy, J.; Eberhart, R.C. A discrete binary version of the particle swarm algorithm. In Proceedings of the 1997 IEEE International Conference on Systems, Man, and Cybernetics. Computational Cybernetics and Simulation, Orlando, FL, USA, 12–15 October 1997; Volume 5, pp. 4104–4108. [Google Scholar]
  62. Kennedy, J.; Eberhart, R.C. Particle swarm optimization. In Proceedings of the ICNN’95-international Conference on Neural Networks, Perth, WA, Australia, 27 November–1 December 1995; Volume 4, pp. 1942–1948. [Google Scholar]
  63. Clerc, M. Particle Swarm Optimization; John Wiley & Sons: Hoboken, NJ, USA, 2010; pp. 1–17. [Google Scholar]
  64. Chao, Z.; Shi, D.; Fowmes, G.J. Mechanical behaviour of soil under drying-wetting cycles and vertical confining pressure. Environ. Geotech. 2023, 40, 1–11. [Google Scholar] [CrossRef]
  65. Jiang, P.; Chen, J. Displacement prediction of landslide based on generalized regression neural networks with K-fold cross-validation. Neurocomputing 2016, 198, 40–47. [Google Scholar] [CrossRef]
  66. Peck, R.; Devore, J.L. Statistics: The exploration & analysis of data. Cengage Learn. 2011, 464465. [Google Scholar]
  67. Witten, I.H.; Frank, E.; Hall, M.A.; Pal, C.J. Practical machine learning tools and techniques. Data Min. 2005, 2, 403–413. [Google Scholar]
  68. Li, D.; Jiang, Z.; Tian, K.; Ji, R. Prediction of hydraulic conductivity of sodium bentonite GCLs by machine learning approaches. Environ. Geotech. 2023, 40, 1–20. [Google Scholar] [CrossRef]
  69. Zainab, B.; Wireko, C.; Li, D.; Tian, K.; Abichou, T. Hydraulic conductivity of bentonite-polymer geosynthetic clay liners to coal combustion product leachates. Geotext. Geomembr. 2021, 49, 1129–1138. [Google Scholar] [CrossRef]
  70. Hu, P.; Feng, L. The Risk of Water Quality Deterioration with Urban Flood Control—A Case in Wuxi. Sustainability 2023, 16, 185. [Google Scholar] [CrossRef]
  71. Feng, L.; Zeng, X.; Hu, P.; Xu, X. Exploring the Optimal Scale of Coastal Reclamation Activities Based on an Environmental Capacity Assessment System: A Case Study in Haizhou Bay, China. Buildings 2022, 12, 1673. [Google Scholar] [CrossRef]
  72. Cui, C.-y.; Meng, K.; Wu, Y.J.; Chapman, D.; Liang, Z. Dynamic response of pipe pile embedded in layered visco elastic media with radial inhomogeneity under vertical excitation. Geomech. Eng. 2018, 16, 609–618. [Google Scholar]
  73. Cui, C.; Meng, K.; Xu, C.; Wang, B.; Xin, Y. Vertical vibration of a floating pile considering the incomplete bonding effect of the pile-soil interface. Comput. Geotech. 2022, 150, 104894. [Google Scholar] [CrossRef]
  74. Meng, K.; Cui, C.; Liang, Z.; Li, H.; Pei, H.-F. A new approach for longitudinal vibration of a large-diameter floating pipe pile in visco-elastic soil considering the three-dimensional wave effects. Comput. Geotech. 2020, 128, 103840. [Google Scholar] [CrossRef]
  75. Cui, C.; Meng, K.; Xu, C.-S.; Zhimeng, L.; Li, H.; Pei, H.-F. Analytical solution for longitudinal vibration of a floating pile in saturated porous media based on a fictitious saturated soil pile model. Comput. Geotech. 2021, 131, 103942. [Google Scholar] [CrossRef]
  76. Liang, Z.; Cui, C.; Xu, C.Y.; Zhang, P.; Wang, K. A close-formed solution for the horizontal vibration of a pipe pile in saturated soils considering the radial heterogeneity effect. Comput. Geotech. 2023, 158, 105379. [Google Scholar] [CrossRef]
  77. Cui, C.; Liang, Z.; Xu, C.Y.; Xin, Y.; Wang, B. Analytical solution for horizontal vibration of end-bearing single pile in radially heterogeneous saturated soil. Appl. Math. Model. 2023, 116, 65–83. [Google Scholar] [CrossRef]
  78. Cui, C.; Xu, M.; Xu, C.Y.; Zhang, P.; Zhao, J. An ontology-based probabilistic framework for comprehensive seismic risk evaluation of subway stations by combining Monte Carlo simulation. Tunn. Undergr. Space Technol. 2023, 135, 105055. [Google Scholar] [CrossRef]
  79. Xu, M.; Cui, C.; Xu, C.Y.; Zhang, P.; Zhao, J. Seismic Risk Analysis of Subway Station Structures Combining the Epistemic Uncertainties from Both Seismic Hazard and Numerical Simulation. J. Earthq. Eng. 2023, 28, 1474–1494. [Google Scholar] [CrossRef]
  80. Xu, M.; Cui, C.; Zhao, J.; Xu, C.; Zhang, P.; Su, J. Fuzzy seismic fragility analysis of underground structures considering multiple failure criteria. Tunn. Undergr. Space Technol. 2024, 145, 105614. [Google Scholar] [CrossRef]
  81. Huang, C.L.; Dun, J.F. A distributed PSO-SVM hybrid system with feature selection and parameter optimization. Appl. Soft Comput. 2008, 8, 1381–1391. [Google Scholar] [CrossRef]
  82. Burland, J.B. On the compressibility and shear strength of natural clays. Géotechnique 1990, 40, 329–378. [Google Scholar] [CrossRef]
  83. Zhu, J.; Zhang, R.; Zhang, Y.; He, F. The fractal characteristics of pore size distribution in cement-based materials and its effect on gas permeability. Sci. Rep. 2019, 9, 17191. [Google Scholar] [CrossRef] [PubMed]
  84. Feng, L.; Hu, P.; Wang, H.; Chen, M.; Han, J. Improving City Water Quality through Pollution Reduction with Urban Floodgate Infrastructure and Design Solutions: A Case Study in Wuxi, China. Int. J. Environ. Res. Public Health 2022, 19, 10976. [Google Scholar] [CrossRef]
Figure 1. Samples of marine clayey sediment.
Water 16 01102 g001
Figure 2. An illustration of the permeability test system schematic.
Water 16 01102 g002
Figure 3. The schematic of SVM regression.
Water 16 01102 g003
Figure 4. Optimization process flowchart utilizing PSO (Amended according to References [64,65]).
Water 16 01102 g004
Figure 5. The R2 values of the predictive results: (a) the major PPC, (b) the minor PPC, and (c) the PPA.
Water 16 01102 g005
Figure 6. The R values of the predictive results: (a) the major PPC, (b) the minor PPC, and (c) the PPA.
Water 16 01102 g006
Figure 7. Correlation curves between the fitness and iteration count.
Water 16 01102 g007
Table 1. Comparison between discrete approaches and analogous continuous methods.
ComparisonDiscrete ApproachesAnalogous Continuous Methods
PrincipleBy analyzing the contact between the blocks of the discrete element, the constitutive relationship of the contact is found to establish the physical and mechanical model of the contact, and the discontinuous and discrete elements are simulated according to Newton’s second law.The complex geometric region of the medium is discretized into elements with simple geometric shapes. The equations are obtained by element integration, external load, and constraint conditions, and then the approximate expression of the behavior of the medium can be obtained by solving the equations.
Solution processIt is divided into explicit solution and implicit solution. The discrete element method regards the rock mass cut by the weak plane as a collection of complex blocks, allowing each block to move, rotate or even separate from each other.It is expressed in matrix form. First, the solution region is divided into grids. Then, the difference equation is used to approximate the differential equation on the grid nodes, and the approximate solution on the grid nodes is solved. If there are more grid nodes, the accuracy of the approximate solution can be improved.
MethodDiscrete element method, rigid body spring element method, discontinuous deformation analysis method, lattice model (LM), lattice discrete particle model (LDPM), etc.Finite difference method, finite element method, boundary element method, and meshless method.
DominanceThe nonlinear large deformation characteristics in a jointed rock mass can be simulated more realistically. It is convenient for dealing with the problem of rock mass failure in which all nonlinear deformation and failure are concentrated on the joint surface.It has high programmability and can be used to solve the problem of irregular shape or complex distribution of regional physical properties with limited and interrelated elements.
InferiorityDue to the limitation of conditional convergence, the calculation step size cannot be too large, which increases the calculation time.The lack of internal length size leads to the basic mathematical problems becoming ill-posed; localization occurs in a zero-thickness region and causes the physical mesh-sensitivity problem. Element interpolation easily causes grid distortion in large deformation problems, and the accuracy is relatively large.
Engineering applicationIt is widely used to simulate mechanical processes such as slope, landslide, and groundwater seepage in jointed rock masses. This method is widely used because it is not only suitable for simulating the cracking, sliding, and crushing process of blocks but is also suitable for calculating the deformation and internal force of blocks.For any complex structure, it is always theoretically possible to obtain a sufficiently approximate simulation by subdividing the element. A large number of long-term engineering applications have accumulated rich experience, especially regarding the fluid flow problem, which is still dominant in the field of fluid mechanics.
Table 2. The approximation degree of the curves to ellipse R2/%.
Confinement Pressure (Mpa)0.30.81.52.533.5
The initial loading and unloading process’ loading phase97.9999.4998.0093.3095.3999.01
The initial loading and unloading process’s unloading phase98.9596.9798.3090.5175.29
The second loading and unloading step of the process94.0894.3495.0590.9352.2949.07
The second loading and unloading cycle’s unloading phase94.8595.2094.8990.8858.69
The third loading and unloading cycle’s loading phase96.6291.7590.0995.1155.2749.32
The third loading and unloading cycle’s unloading phase98.3298.1293.0490.5877.45
Table 3. The relationship functions between Kxx, Kxy, and Kyy confinement pressure under the loading and unloading phase of three times confinement pressure cycle (the variables represented by x represent the x-axis).
The Initial Loading and Unloading Process’s Loading Phase The Initial Loading and Unloading Process’s Unloading PhaseThe Second Loading and Unloading Step of the ProcessThe Second Loading and Unloading Cycle’s Unloading PhaseThe Third Loading and Unloading Cycle’s Loading PhaseThe Third Loading and Unloading Cycle’s Unloading Phase
K x x = 11.18 x 0.68 K x x = 0.99 x 0.13 K x x = 0.99 x 0.13 K x x = 0.95 x 0.63 K x x = 0.9 x 0.12 K x x = 0.99 x 0.18
K x y = 131.16 x 0.81 K x y = 12.1 x 0.38 K x y = 11.76 x 0.34 K x y = 13.55 x 0.85 K x y = 13 x 0.4 K x y = 11.85 x 0.41
K y y = 129.56 x 0.7 K y y = 34.92 x 0.5 K y y = 33.65 x 33.29 K y y = 33.29 x 0.5 K y y = 32.17 x 0.46 K y y = 30.28 x 0.48
Table 4. The database for machine-learning modelling.
Confinement Pressure/MpaCycle TimeLoading/UnloadingMajor PPC/10−17 m2Minor PPC/10−17 m2PPA/°
0.31190.6801 26.8828 58.5568
0.51173.2943 43.1398 59.1183
0.81163.7161 35.2674 61.0994
11159.5646 25.8290 61.0306
1.251141.7710 21.9192 61.3317
1.51136.8615 18.0365 61.8812
21122.3417 15.5369 61.9772
2.251120.4579 14.2578 62.1413
2.51115.5537 2.8657 62.6754
31112.5467 1.9142 64.0616
3.251115.5455 1.9122 64.6592
3.51110.6677 1.4282 65.1471
3.25107.6129 1.6827 65.2248
3109.5998 0.8977 67.1136
2.5109.8196 1.0264 66.9785
2.25109.0076 0.8002 66.0570
2109.5084 1.2054 66.3184
1.5109.9103 1.1429 66.0731
1.251011.8117 1.0909 66.3382
11013.1001 1.1592 66.8097
0.81012.0609 1.3210 66.7569
0.51018.1068 3.3796 64.2258
0.31027.3945 5.4554 63.9720
0.32124.6956 2.7565 66.9720
0.52117.1700 2.3669 66.3112
0.82114.2693 1.4150 66.3491
1215.7048 1.9709 66.0474
1.25215.3009 1.5880 66.9540
1.52110.9919 1.2282 66.6112
22110.5425 0.8719 66.7426
2.252110.3703 0.7099 66.6863
2.52110.0652 1.0491 66.7788
3219.6246 0.9339 66.4138
3.25219.8742 1.2446 66.5015
3.5219.0795 0.9104 66.1721
3.25205.9243 0.7594 67.1125
3209.0889 0.8946 67.8325
2.5209.2750 0.8976 67.7377
2.25207.1497 0.8963 67.2031
2207.5952 1.3046 67.8896
1.5209.5498 0.9945 67.0514
1.25209.6801 1.1802 67.5247
12010.8712 1.2263 67.8104
0.82011.3316 1.2422 67.3963
0.52015.6647 1.2608 67.3091
0.32022.5904 2.6112 68.3951
0.33122.5904 2.6112 68.3951
0.53118.0395 1.1017 68.4562
0.83112.6946 1.4289 67.2153
13113.2806 1.2564 66.6665
1.253112.0366 1.2599 66.4009
1.53110.0730 1.1511 66.7560
2319.7886 1.4705 66.8207
2.25319.2952 1.0801 66.6704
2.5319.2457 0.9351 66.7557
3318.9632 0.8322 66.9193
3.25317.9115 0.9901 67.1875
3.5318.8115 0.8774 67.4699
3.25306.9530 1.2606 67.1244
3308.4932 0.8984 67.1408
2.5308.6194 0.8786 66.7460
2.25308.2214 1.2636 66.6439
2308.6755 1.6246 66.8068
1.5309.3268 0.8930 67.3927
1.253010.7559 1.2894 67.4414
13011.9142 1.2230 67.7345
0.83011.4516 1.1431 68.1857
0.53016.3833 1.8616 68.6148
0.33021.5004 2.1232 69.2395
Table 5. The R2, R, MSE, and MRSE values of the developed machine-learning predictive model.
Major PPCMinor PPCPPA
R20.97180.97150.9367
R0.98720.98630.9696
MSE0.36930.18820.6615
MRSE0.00560.15830.3516
Disclaimer/Publisher’s Note: The statements, opinions and data contained in all publications are solely those of the individual author(s) and contributor(s) and not of MDPI and/or the editor(s). MDPI and/or the editor(s) disclaim responsibility for any injury to people or property resulting from any ideas, methods, instructions or products referred to in the content.

