Article

Influence of Structural Symmetry of Fault Zones on Fluid-Induced Fault Slips and Earthquakes

1
School of Resources and Civil Engineering, Suzhou University, Suzhou 234000, China
2
Hubei Key Laboratory of Environmental Geotechnology, Institute of Rock and Soil Mechanics, Chinese Academy of Sciences, Wuhan 430071, China
*
Author to whom correspondence should be addressed.
Water 2024, 16(8), 1118; https://doi.org/10.3390/w16081118
Submission received: 9 March 2024 / Revised: 9 April 2024 / Accepted: 10 April 2024 / Published: 15 April 2024
(This article belongs to the Topic Human Impact on Groundwater Environment)

Abstract

:
Subsurface fluid injection and extraction can reactivate faults and induce earthquakes. In current research, faults are typically described as symmetrical structures and the presence of asymmetric structures is often overlooked. The reality is that numerous asymmetric faults exist within the Earth’s crust. The architectural and permeability characteristics of fault zones differ significantly between symmetrical and asymmetrical faults. These differences may have a great influence on fault stability during fluid injection or extraction. In this study, the impact of fault zone structures on fluid-induced slips and seismic activity were investigated through numerical analysis. The findings indicated that symmetrical faults were more likely to induce larger slips and earthquakes during various subsurface fluid operations. For asymmetric faults, larger induced slips occurred when fluid was operated in a hanging wall reservoir than in a footwall reservoir. In symmetrical faults, the opposite was true. When evaluating the stability of a fault in subsurface fluid engineering, the fault structure and fluid pattern and their combined effects must be considered comprehensively.

1. Introduction

Numerous subsurface fluid injection and extraction activities have been conducted by humans for a variety of purposes, including resource extraction, energy generation, and environmental management, among others. Fluid extraction engineering is employed in the production of oil [1], natural gas [2], shale gas [3], coalbed methane [4], tight sandstone gas [5], geothermal energy [6], and so on. Fluid injection engineering is applied in wastewater injection into deep wells [7], CO2 geological storage [8], hydraulic fracturing for resource extraction [9], and so on. Many engineering projects involve both subsurface fluid injection and extraction, for example, enhanced oil recovery by water or gas (N2, CO2, etc.) [10,11,12]; enhanced geothermal systems (EGSs), in which cold fluid is injected into geothermal reservoirs to capture heat [13,14,15]; enhanced water system recovery (EWR), where gas is injected into deep saline formations to obtain water and liquid minerals [16,17]; and the extraction of shale gas (or coalbed methane) via hydraulic fracking [18,19,20]. Fluid injection or extraction will directly lead to changes in the effective stress within the target area, disrupting the original stress balance. The stress perturbation may cause faults to slip and even induce earthquakes.
Fault activation and earthquakes induced by subsurface fluid injection or extraction have become significant factors influencing the efficacy and safety of the aforementioned engineering activities and have attracted considerable attention. Research has indicated that numerous large earthquakes in Oklahoma were induced by oil production activities [21]. Gas extraction in the Netherlands led to a series of earthquakes, causing substantial damage to numerous buildings [22]. In 2011, the extraction of groundwater in Lorca, Spain, induced a 5.1-magnitude earthquake, leading to heavy casualties and extensive property damage [23]. In 2012, a 4.8-magnitude earthquake was induced by wastewater injection in Timpson, East Texas, which was followed by a sequence of smaller earthquakes [24]. During the period from 2 December to 8 December 2006, fluid injection in Basel, Switzerland, triggered over 10,000 seismic events. Among these, four earthquakes with magnitudes exceeding 3.0 caused extensive damage and widespread public panic [25]. In 2017, South Korea experienced a 5.5 magnitude earthquake triggered by an EGS development. The event led to significant damage and prompted the government to halt the project [26]. Hydraulic fracturing in western Canada has been associated with fault activation and earthquakes, sparking broad public concern [27]. Overall, it can be seen that both subsurface fluid injection and extraction can induce fault activation and earthquakes (see Figure 1). This issue significantly hinders the advancement of subsurface engineering projects involving fluid injection or extraction. Consequently, assessing the risks of induced seismic events and managing fault stability have emerged as critical concerns in recent years [28,29,30,31,32,33]. The key issue is to reveal the induced slip behavior of faults in the complex fluid–solid coupling process. Numerical simulation has become an indispensable method, offering several key advantages: (1) the capability to model complex geological structures [34,35]; (2) the flexibility to simulate varied fluid flow conditions [36,37]; and (3) the ability to solve multi-field coupling [38]. In this work, our investigation focused on analyzing the behavior of induced fault slips and earthquakes using numerical modeling techniques.
Faults are geological structures that are the result of tectonic movements. Rock layers fracture under crustal stress and glide along a plane, resulting in a fault. Faults typically develop over a long period, creating a complex zone that consists of a primary fault plane and surrounding fractured rock masses. This zone also includes an array of secondary faults and fracture planes called a fault zone. Faults are complex geological entities, and it is difficult to solve fluid–solid coupling problems through theoretical calculations. Therefore, numerical simulation has become an indispensable research method. In numerical simulations, the geometry of faults, material properties, and boundary conditions must be appropriately simplified to make the calculations feasible and ensure the reliability of the simulation results. At present, the widely accepted fault structure model is the symmetrical dual structure shown in Figure 2a. In this model, the fault zone consists of a high-permeability fault core and a low-permeability damage zone [39,40,41]. There is also a model that further subdivides fault zones based on this symmetrical dual structure [42]. Another frequently employed model in numerical simulations simplifies the fault as a zone of homogeneous rock layers [43,44,45]. In summary, the representation of faults in numerical simulations is predominantly characterized by symmetrical structures.
However, the final forms of fault zones are not always symmetrical structures. Numerous asymmetric faults exist in the Earth’s crust. A large number of studies have confirmed that inclined faults often present an asymmetric structure [46,47,48,49,50]. The asymmetric fault zone is primarily evident through the structural and permeability differences between the hanging wall and the footwall, as illustrated in Figure 2b. During the growth of a fault, it usually forms an active wall and a passive wall [51]. The active wall—commonly referred to as the hanging wall—typically undergoes more severe slippage, forming an induced fracture zone. On the other hand, the footwall remains relatively motionless, forming a sliding crush zone. As a consequence, the active wall experiences a higher level of fragmentation than the passive wall [51]. Furthermore, during the violent sliding of the hanging wall, fault gouges and loose sediment are more likely to be forced into the fractures and pores of the footwall—a phenomenon known as clay smear. Clay smear is recognized as a critical mechanism in fault sealing [52,53,54]. Consequently, the porosity and permeability of the sliding crush zone are generally found to be significantly lower than those of the induced fracture zone.
To fully reveal the behavior of induced fault slips under the complex fluid–solid coupling process, considering the impact of the fault zone’s structural symmetry is crucial. In this paper, we studied it by numerical simulation. We considered two categories of fault zones: one with a symmetrical structure and another with an asymmetric structure. To make the study more comprehensive and convincing, we considered six different fluid patterns which can represent all the operations involved in the various subsurface fluid injection and production engineering techniques. The slip characteristics of the faults under the different fluid patterns were then studied.

2. Theoretical Background

2.1. Sliding Model

The software ABAQUS 6.14 was used to accomplish the numerical simulation. Due to the potential for significant fault slips under conditions of excess pore pressure, the sliding formulation employed in this study was chosen to be of the finite-sliding type. It allows for arbitrary separation, sliding, and rotation of contact surfaces. As shown in Figure 3, slave node S1 may come into contact anywhere along the master surface. While in contact, it is constrained to slide along the master surface. Figure 3 also shows the possible evolution of the contact between node S1 and its master surface. Node S1 is in contact with the element face with end nodes M2 and M3 at time t1. The load transfer at this time occurs between node S1 and nodes M2 and M3 only. Later on, at time t2, node S1 may find itself in contact with the element face with end nodes M5 and M6. Then, the load transfer will occur between node S1 and nodes M5 and M6.
We used the master–slave contact method to calculate the slip under the finite-sliding interaction. The surface of the surrounding rock was chosen as the master surface, and the surface of the fault was chosen as the slave surface, due to the greater stiffness of the rock mass compared to the fault. Figure 4 shows the slave surface (node n1) and the master surface (node n2, node n3, and node n4). n and t are, respectively, the normal and the tangent. The variable h is the overclosure of the surfaces, where n h = x x 1 . The slip between the surfaces can be solved as follows:
d δ h = δ x i · ( n d N i d s N j t + t N i d N j d s n + t N i ρ n N j t ) d x j
d δ s = δ x i ( t d N i d s N j t n N i d N j d s n n N i ρ n N j t ) · d x j
where s is the slip; N i is the interpolation function; and ρ n is the segment curvature, defined as ρ n n · d 2 x d g 2 / | d x d g | 2 .
The ABAQUS theory manual [55] can be referred to for a detailed derivation.

2.2. Material Model

The reservoir and fault were set as porous elastic material. The seepage behavior was controlled by Darcy’s law:
f = κ μ p
where f  is the volumetric flux vector, μ is the viscosity, κ is the intrinsic permeability of the medium, and p is the pressure gradient vector.
The governing equation of fluid mass ( K ) conservation is as follows [56]:
d K d t + ( ρ 0 · f ) = 0
The mechanical behavior of the reservoir was controlled by a porous elastic material model [57,58]:
2 G ε i j = σ i j v ( 1 + v ) σ k k δ i j + 3 ( v u v ) B ( 1 + v ) ( 1 + v u ) p δ i j
Δ m = 3 ρ 0 ( v u v ) 2 G B ( 1 + v ) ( 1 + v u ) ( σ k k + 3 p / B )
where   G is the shear modulus, ε i j is the strain,   σ i j is the stress,   σ k k is the mean stress deviation,   p is the pore pressure, v u is the undrained Poisson’s ratio, v is the drained Poisson’s ratio, δ i j is the Kronecker delta, Δ m is the change in fluid mass per unit volume, and ρ 0 is the density of the pore fluid in the reference state. B is Skempton’s coefficient:
B = 1 / K 1 / K s 1 / K 1 / K S + ( 1 / K f 1 / K n )
where K is the drained bulk modulus, K S is the solid grain’s bulk modulus, K f is the pore fluid bulk modulus, and 1 / K n is the unjacketed pore compressibility.

2.3. Seismic Computational Model

The seismic moment model (Aki, 1967) was used to estimate the induced earthquake [59]:
M 0 = μ D S
where   M 0 is the seismic moment, μ is the rigidity of the fault (Pa), D is the rupture area of the fault (m2), and S is the average slip displacement of the fault (m).
Then, the moment magnitude scale (Mw) of the induced earthquake can be obtained by the following formulation [60]:
M w = 2 3 ( log M 0 9.1 )

3. Numerical Modelling
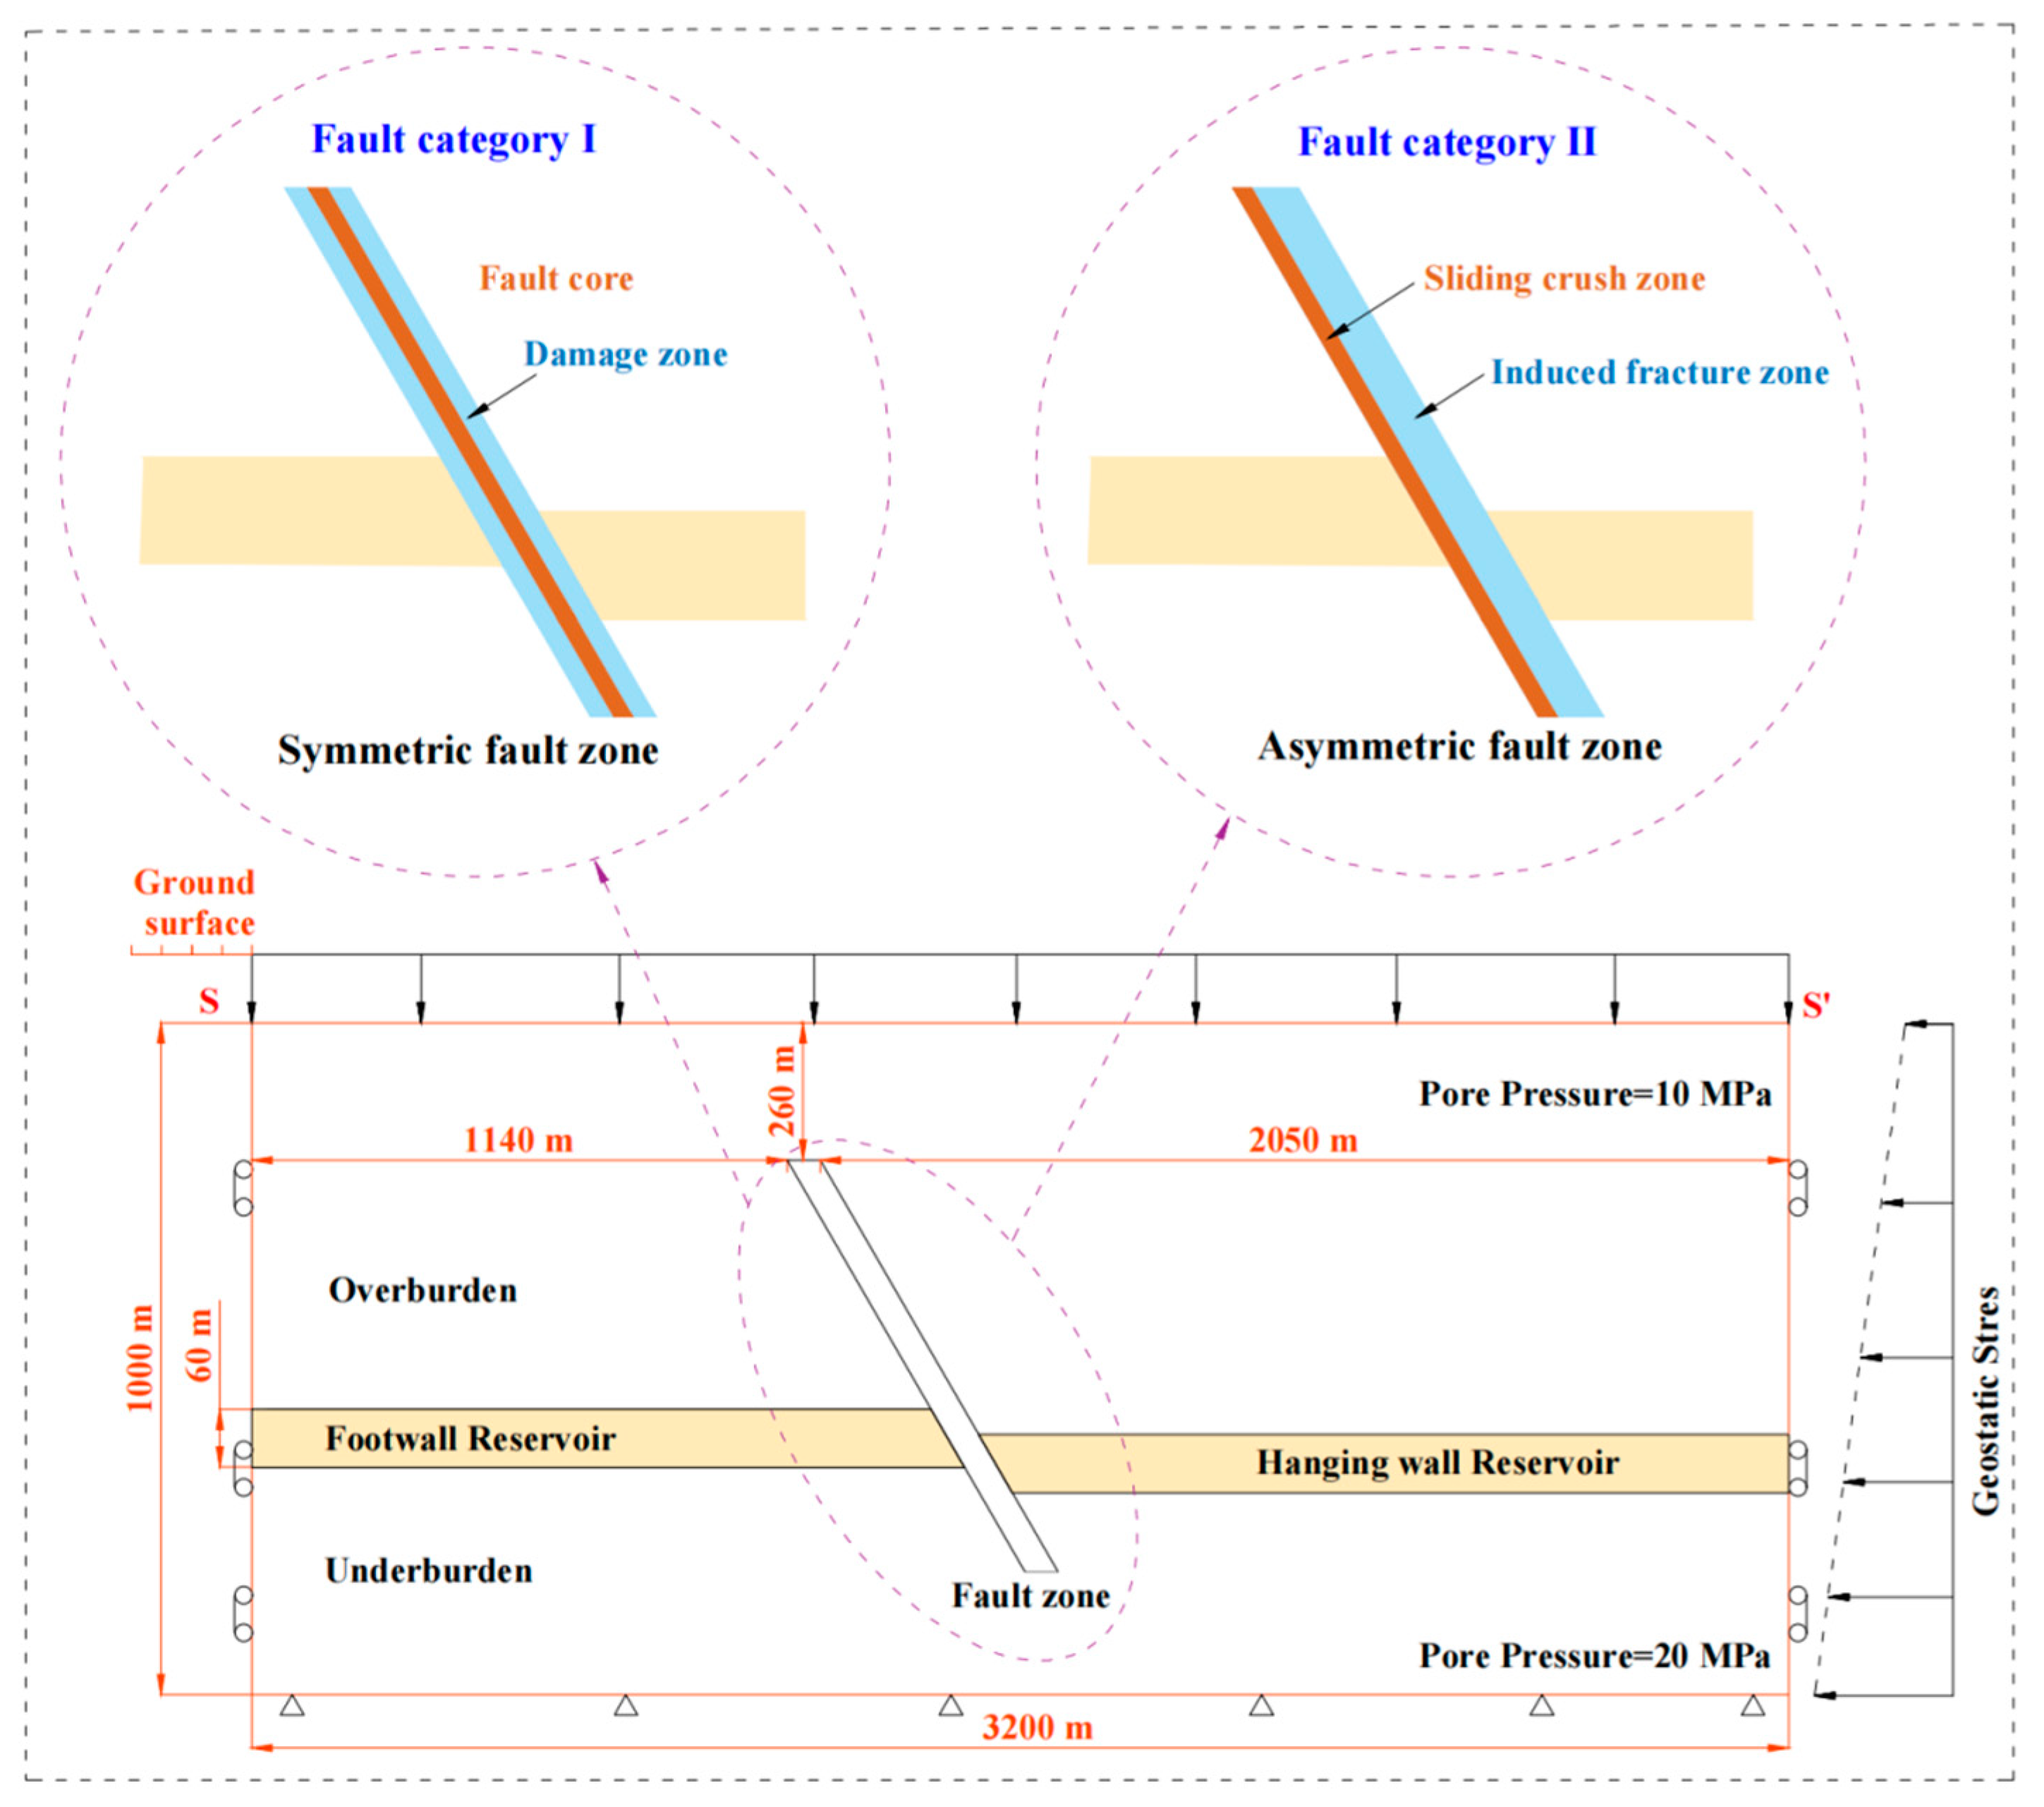
3.1. Model Setup

The finite-element software ABAQUS has significant advantages in nonlinear analysis, which encompasses material, geometric, and boundary nonlinearities. Contact analysis belongs to a typical nonlinear problem of boundary nonlinearity. The boundary conditions cannot be fully given at the beginning of the calculation. During the calculation process, the contact area and the pressure between contact bodies will vary with load and deformation. Computing the value of a fault slip along the surrounding rock is a typical boundary nonlinear contact issue. So, ABAQUS was selected to accomplish the simulation of the fault.
A basic model (Figure 5) was designed to simulate the subsurface fluid injection and extraction engineering at the fault. As shown, the length and height of the model were, respectively, 3200 m and 1000 m. The thickness of the reservoir was 60 m. The fault was normal, with a length, thickness, and inclined angle of 700 m, 30 m, and 60°. The distance from the top of the fault to the top of the model fault was 260 m. The distances from the top of the fault to the left and right boundaries were 1140 m and 2050 m, respectively.
In order to reveal the influence of fault structure on the behavior of fluid-induced slips, we designed two categories of fault zone: a symmetric fault (Fault Category I) and an asymmetric fault (Fault Category II), both with the same length, thickness, and angle. Fault Category I consisted of the fault core (low permeability) and damage zone (high permeability). The thickness of the fault core was 6 m. Fault Category II consisted of a sliding crush zone (low permeability) and an induced fracture zone (high permeability). The thickness of the sliding crush zone was 12 m. The physical and mechanical properties of the fault core and the sliding crush zone were also the same (Table 1). The model’s representation of fault dimensions and subsurface property values was conceptual. For this information, we relied on observed variations in the caprock, fault, and reservoir characteristics within the Qiabuqia Geothermal Field in Qinghai Province’s Gonghe Basin, China. The unmeasurable parameters were largely estimated using established selection guidelines, and data from additional scholarly sources were referred to [42,61,62,63].
It is the fluid changes in a reservoir that directly induce fault activation during subsurface fluid engineering. In order to reveal the influence of the relative spatial position between the reservoir and the fault, two categories of reservoirs were designed. As shown in Figure 6, they were located at the upper and lower parts of the fault, respectively.
The boundary conditions were as shown in Figure 5. The bottom boundary was fixed, such that vertical and horizontal displacement was not allowed. The left and right boundaries were only constrained horizontally. The top boundary was free, and both vertical and horizontal displacement were allowed. To simulate the actual depth of the fault, a surface pressure of 1.0 × 10⁷ MPa was loaded on the top boundary. The initial pore pressure was hydrostatic, with 10 MPa on the top and 20 MPa on the bottom.

3.2. Fluid Injecting and Extracting

The initial stresses were geostatic. After initial geostress balancing, the fluid injection and extraction were simulated. To thoroughly elucidate the characteristics of the induced fault slip behavior by various subsurface fluid injection and extraction operations, we considered six distinct fluid flow patterns. As shown in Figure 7, Patterns I and II represented fluid injection engineering, such as wastewater injection into deep wells. Pattern I represented fluid injection into the footwall reservoir, while Pattern II illustrated fluid injection into the hanging wall reservoir. Pattern III and Pattern IV represented fluid extraction engineering, such as oil exploitation. Pattern III represented fluid extraction from the footwall reservoir, while Pattern IV represented fluid extraction from the hanging wall reservoir. Pattern V and Pattern VI represented fluid injection and extraction engineering, such as EOR and EWR, which were described in the introduction. The six different fluid patterns can represent all the operations in the various subsurface fluid injection and production engineering methods.
In all six fluid patterns, the injection pressure and the extraction pressure were under 10 MPa. After the simulation, the induced fault slips and earthquakes could be investigated to assess the influence of different fluid operations on the stability of faults with different structures.

4. Results and Discussion

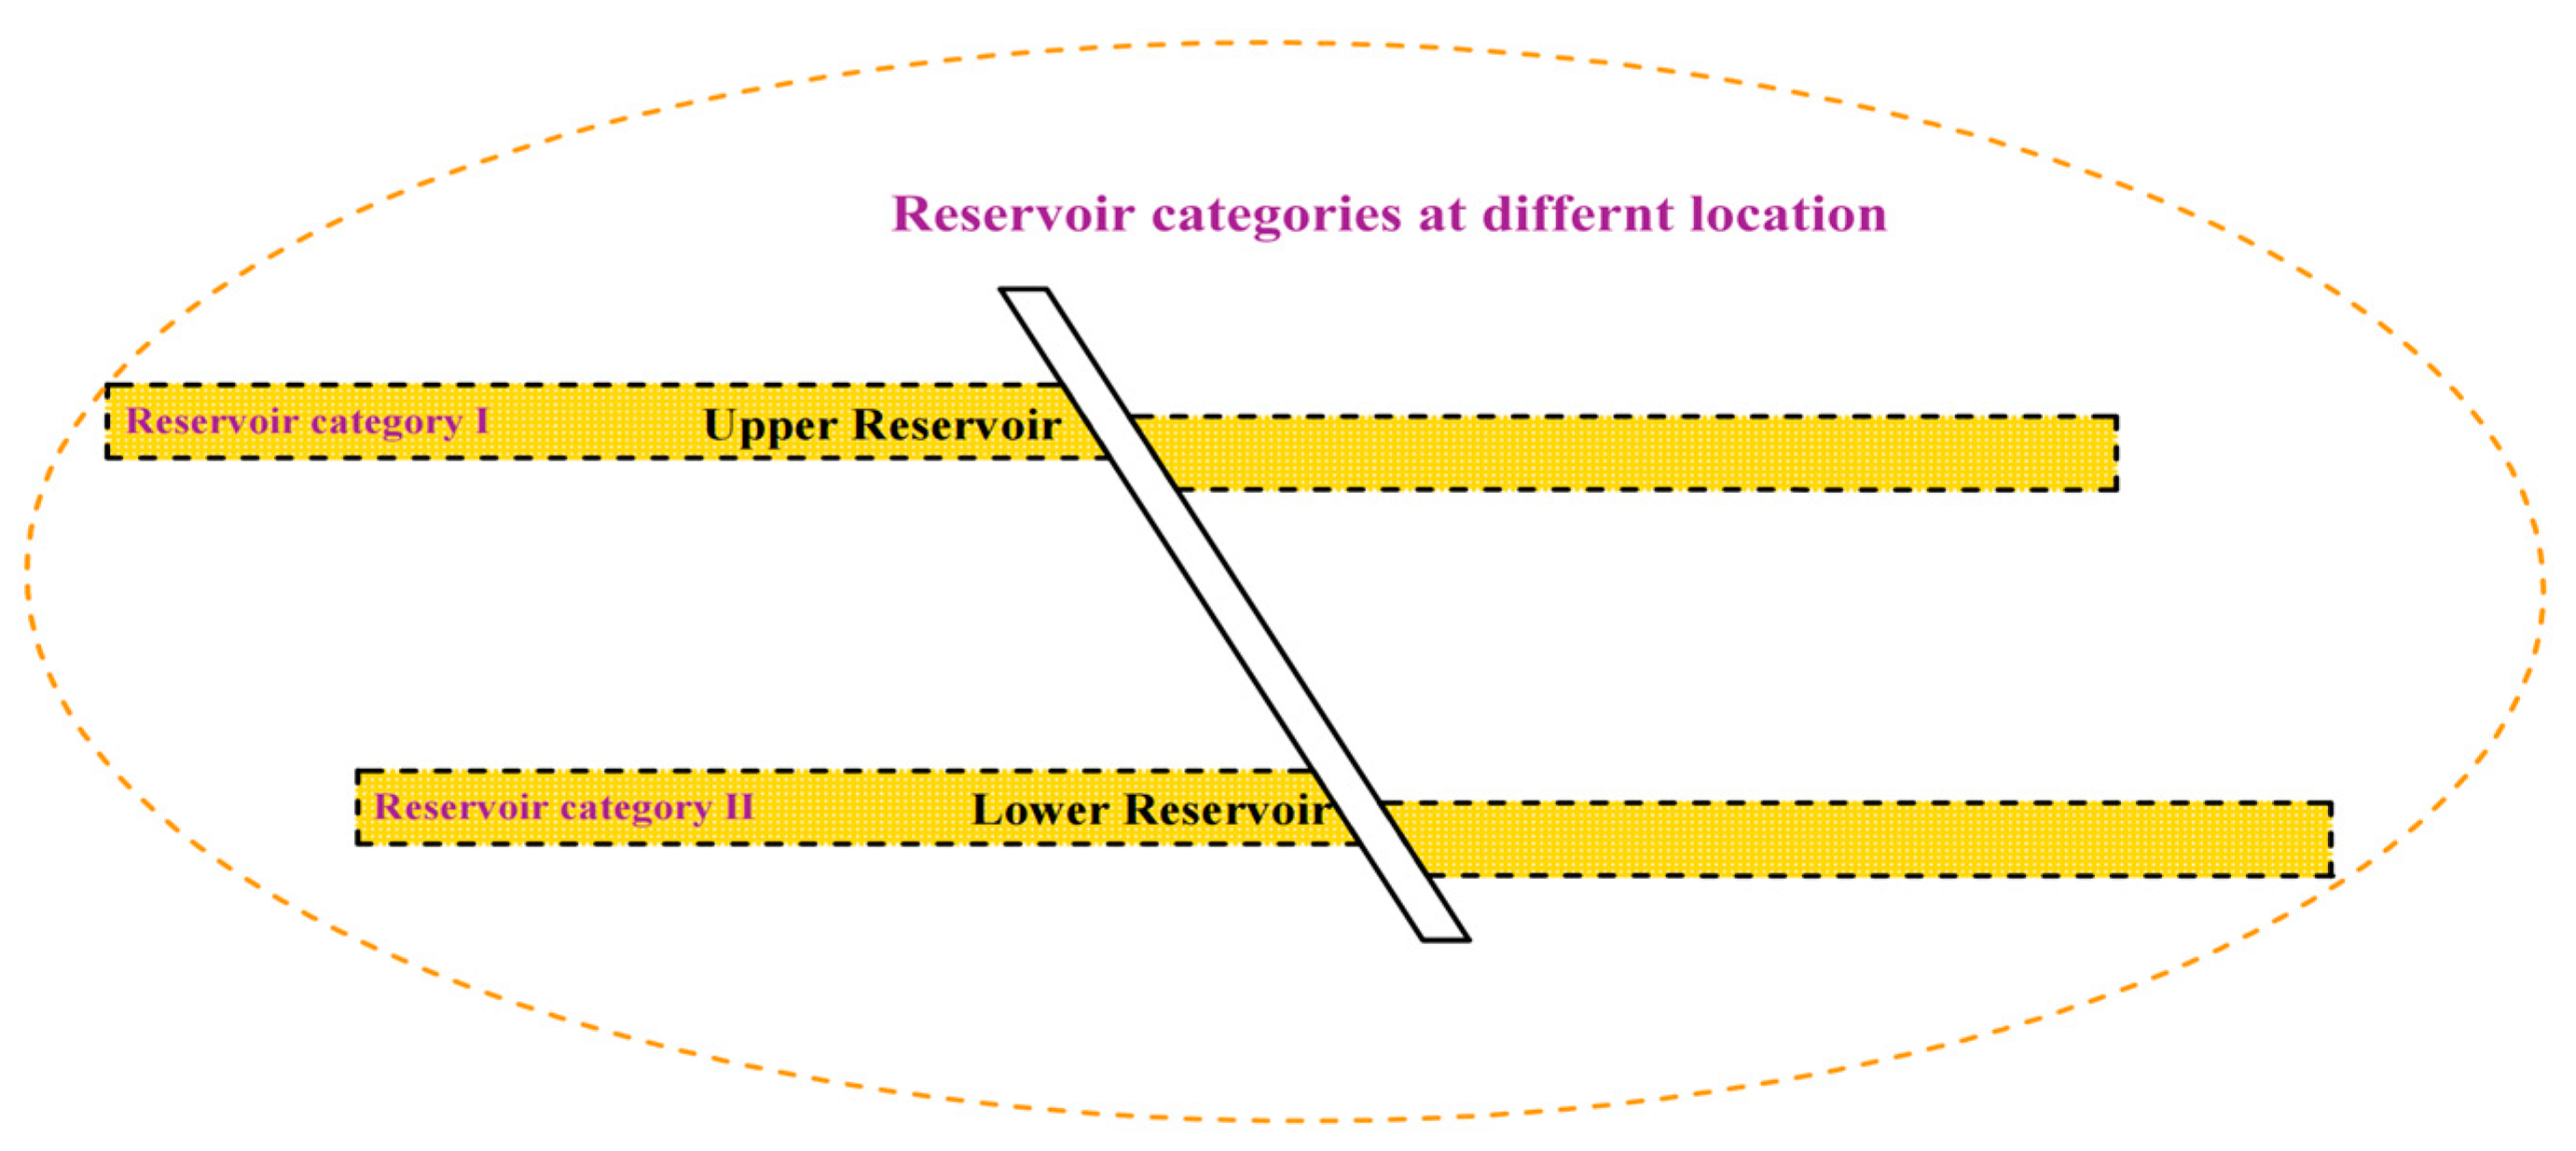
4.1. Upper Reservoir

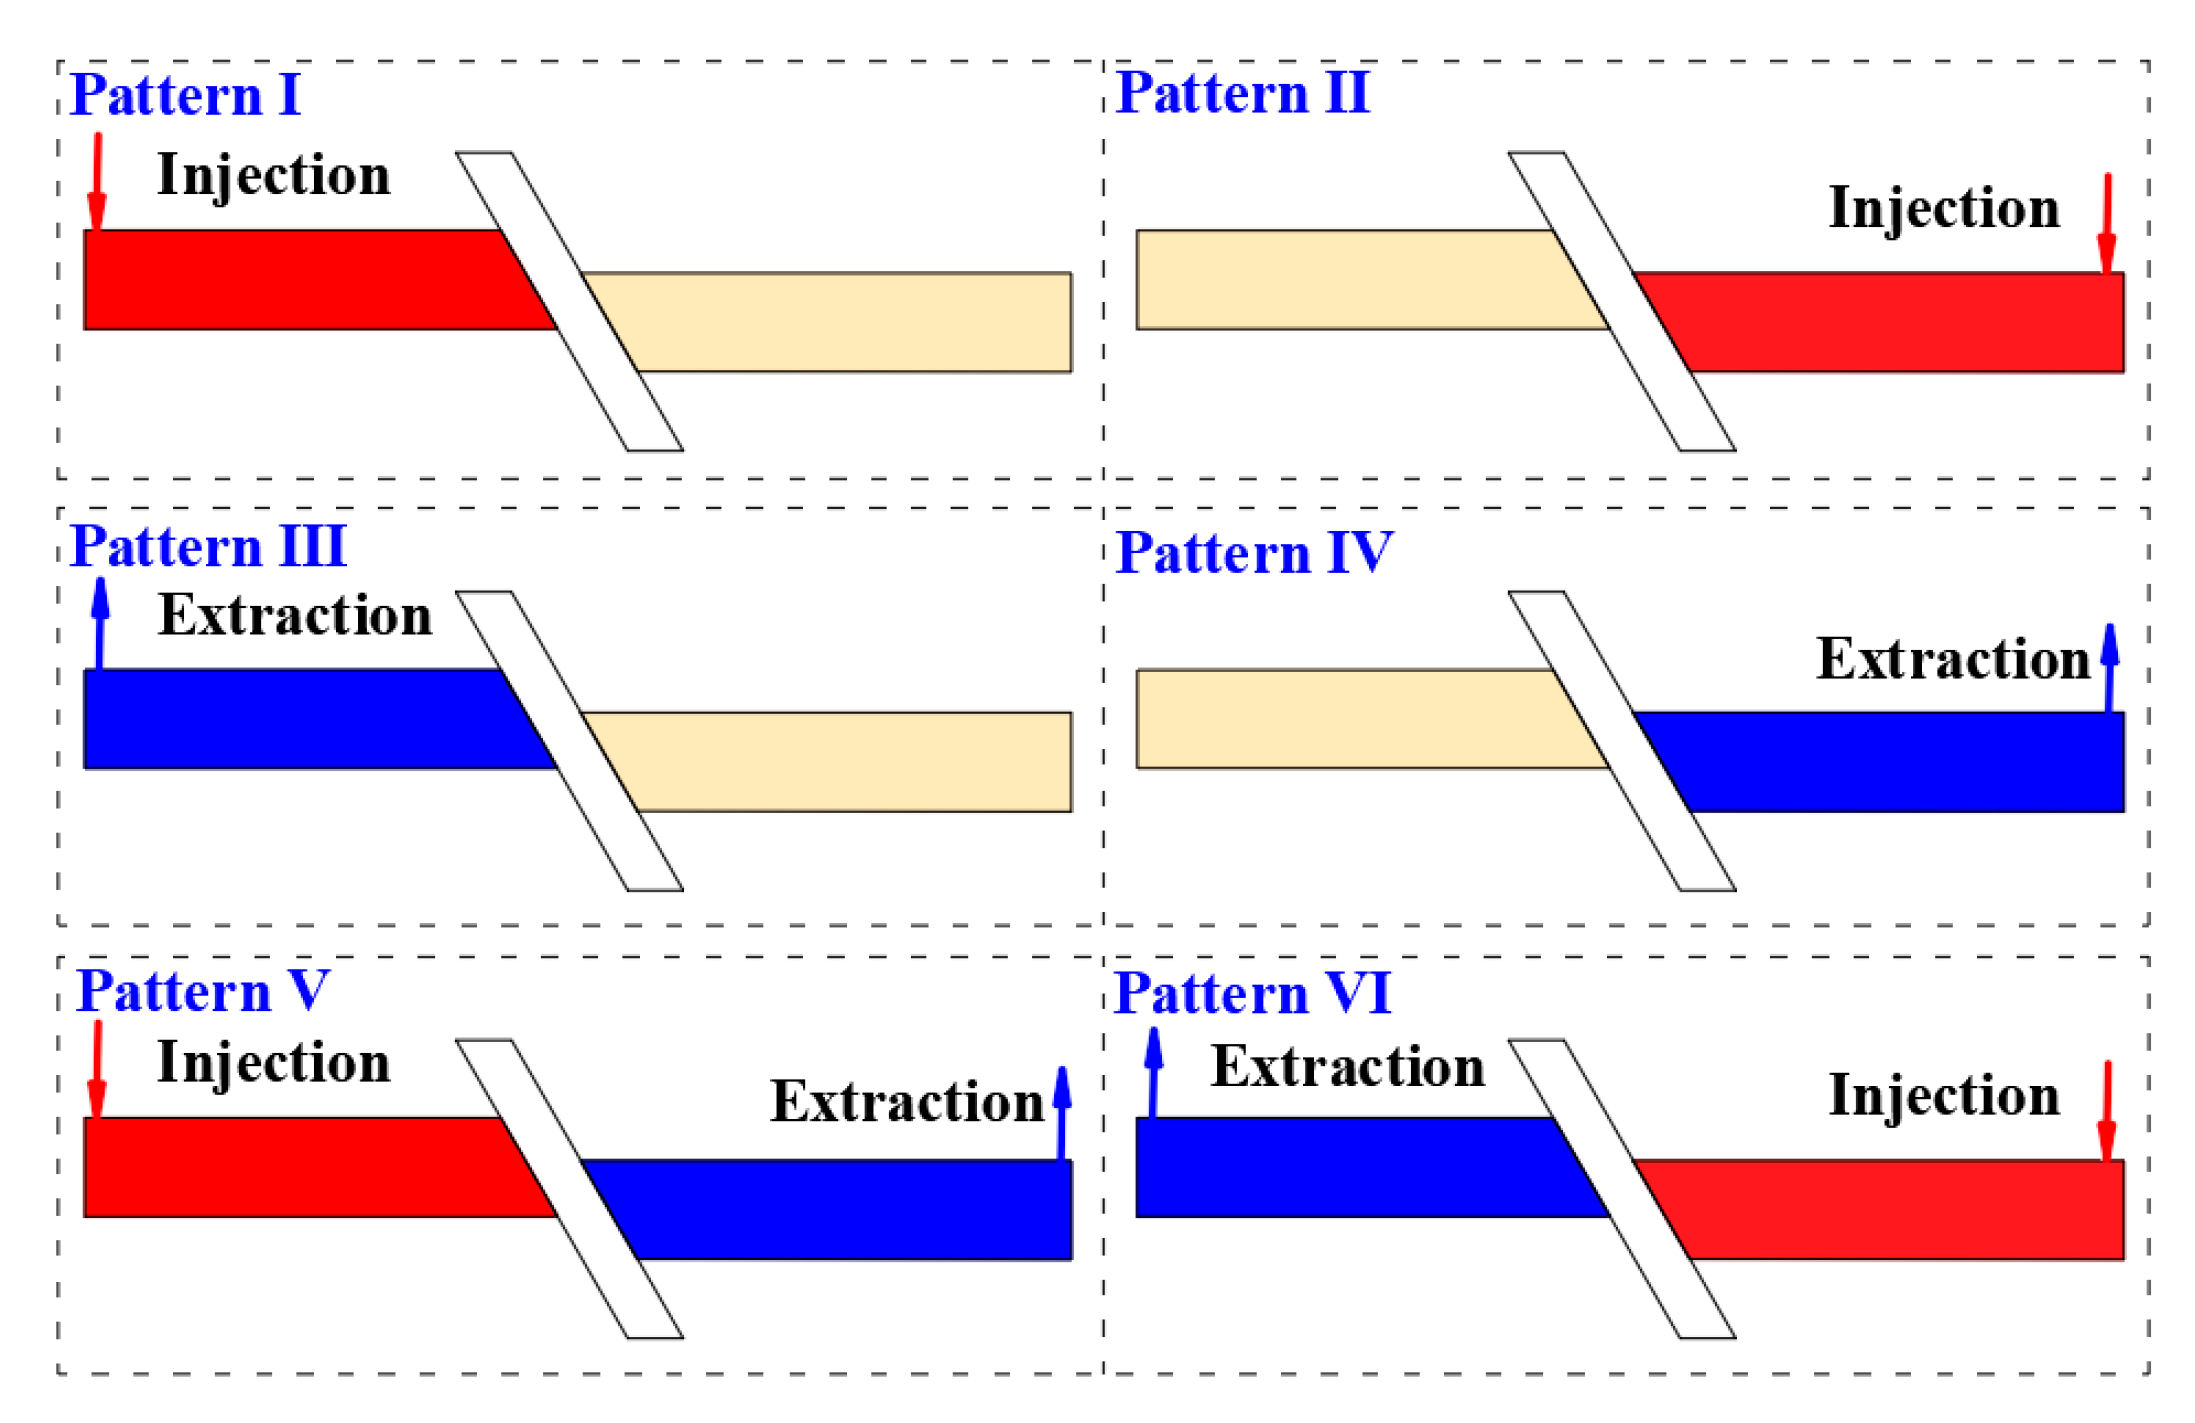
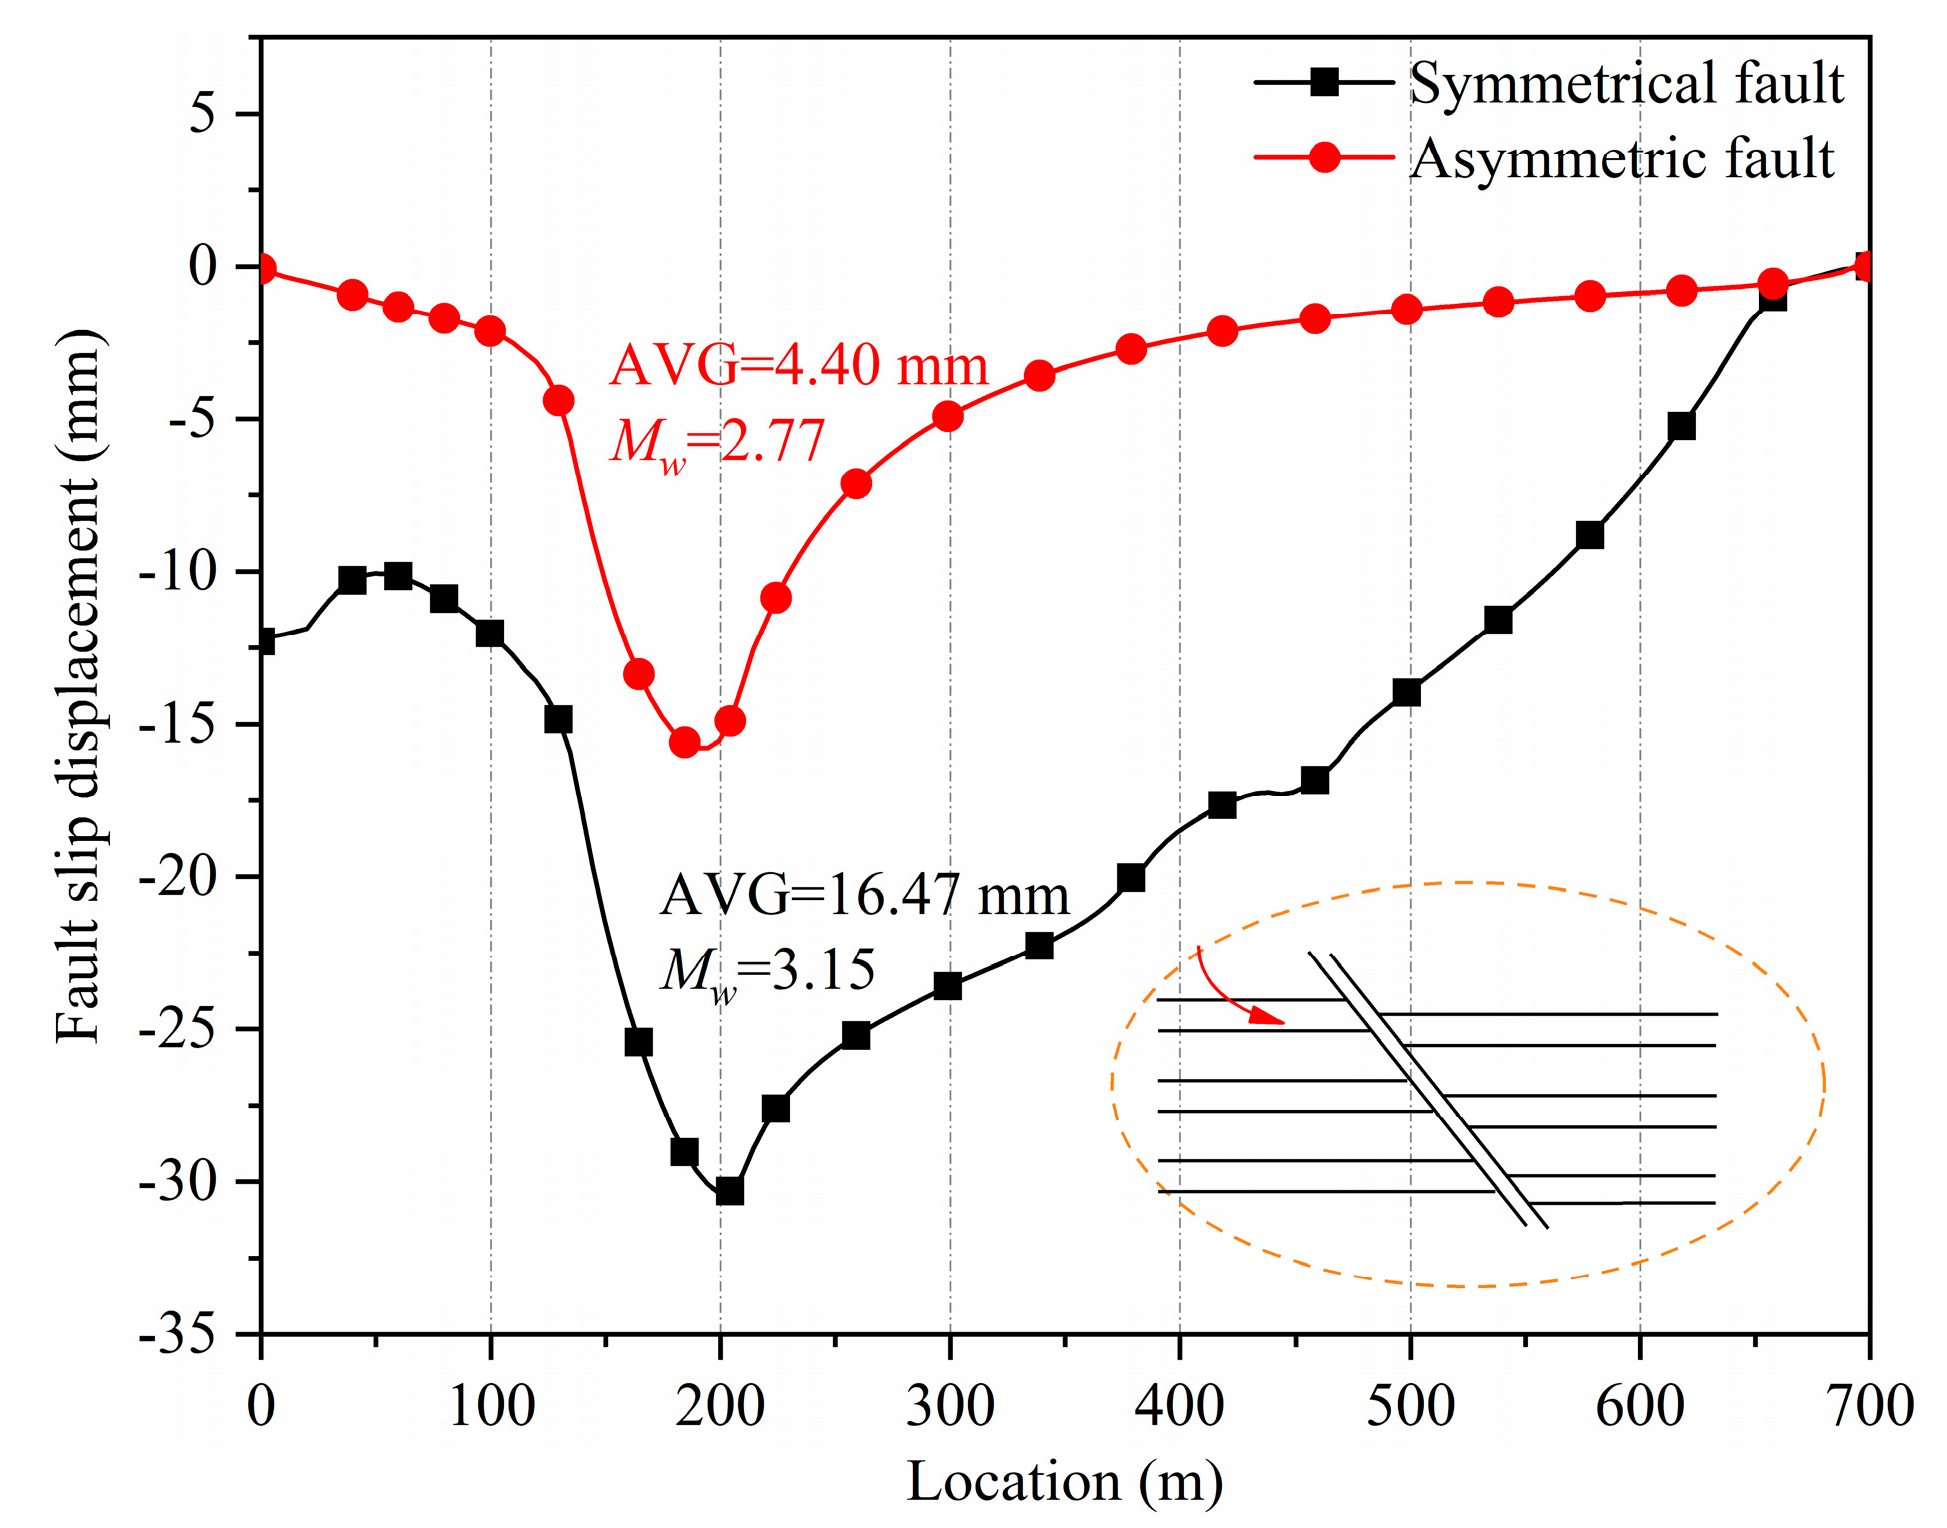
4.1.1. Fluid Pattern I

Figure 8 displays the slip displacement of the symmetrical fault (represented by the black line) and the asymmetric fault (represented by the red line) under Fluid Pattern I when the reservoir was located in the upper part of the fault. The results indicated that the slip behaviors of the two categories of fault were nearly the same. When fluid was injected into the footwall reservoir, the two faults both slid down along the fault plane. The asymmetric fault exhibited a maximum slip displacement of just 15.77 mm. In contrast, the symmetrical fault’s maximum slip displacement reached 30.35 mm, which is nearly double that of the asymmetric fault. The average slip displacement of the asymmetric fault was 4.40 mm, while that of the symmetrical fault was 16.47 mm. The average slip of the symmetrical fault was nearly four times that of the asymmetric fault. According to the seismic computational model in chapter 2, the Mw of the induced earthquake of the symmetrical fault was 3.15 and that of the asymmetric fault was 2.77. The results revealed that the induced slip and earthquake of the asymmetric fault were significantly larger than those of the symmetric fault when fluid was injected into the footwall reservoir.
Figure 9 illustrates the pore-pressure distribution of the symmetrical fault and the asymmetric fault after fluid injection into the footwall reservoir. When the fault was symmetrical, there was a noticeable increase in pore pressure within the left damage zone (as shown in Figure 9a). In contrast, for the asymmetric fault, the pore pressure within the fault remained largely unchanged (refer to Figure 9b). The symmetrical fault comprised a low-permeability fault core surrounded by a high-permeability damage zone, which prevented the formation of lateral sealing. As depicted in Figure 9a, upon fluid injection into the footwall reservoir, the fluid directly flowed into the left damage zone of the fault. The fluid could not flow into the fault core due to its low permeability. Therefore, the pore pressure in the footwall reservoir and the left damage zone of the fault was obviously increased. For the asymmetric fault, the low-permeability sliding crush zone was docked with the injected reservoir. Fluid could not flow into the fault. As can be seen from Figure 9b, the pore pressure of the fault was almost unchanged. According to the principles of effective stress proposed by Biot [57] and Rice [58], the effective stress is reduced when pore pressure increases. According to the Mohr–Coulomb strength criterion, a decrease in effective stress leads to a reduction in the shear strength of the fault plane, which may in turn cause shear failure and slip. In the numerical model, the Coulomb friction model was also used to describe the tangential behavior of the contact pair of the fault and its surrounding rock. This model incorporates a critical shear stress ( τ cirt ) between the two contacting surfaces. When the shear stress exceeds the critical shear stress, the contact pair may experience instability and slip. The increase in pore pressure within the fault can directly reduce the critical shear stress, leading to fault sliding. The greater the increase in pore pressure, the more pronounced the induced fault slippage became. Consequently, when fluid was injected into the footwall reservoir, the slippage of the symmetrical fault was significantly greater than that of the asymmetric fault.
Figure 10 shows the distribution of shearing stress for the symmetrical fault (Figure 10a) and the asymmetric fault (Figure 10b). The shearing stress of the symmetrical fault was obviously larger than that of the asymmetric fault. We set a path on the footwall fault plane to obtain the shear stress data, as shown in Figure 11. As can be seen, the shear stress of the symmetrical fault was greater than that of the asymmetric fault. By calculation, the average shear stress along the fault plane of the symmetrical fault was 1.55 MPa, while that of the asymmetric fault was only 0.80 MPa. This further confirmed that the structure of a fault might greatly affect the distribution of fault stress. When the fluid was injected into the footwall reservoir, the asymmetric fault would be more stable than the symmetrical fault.

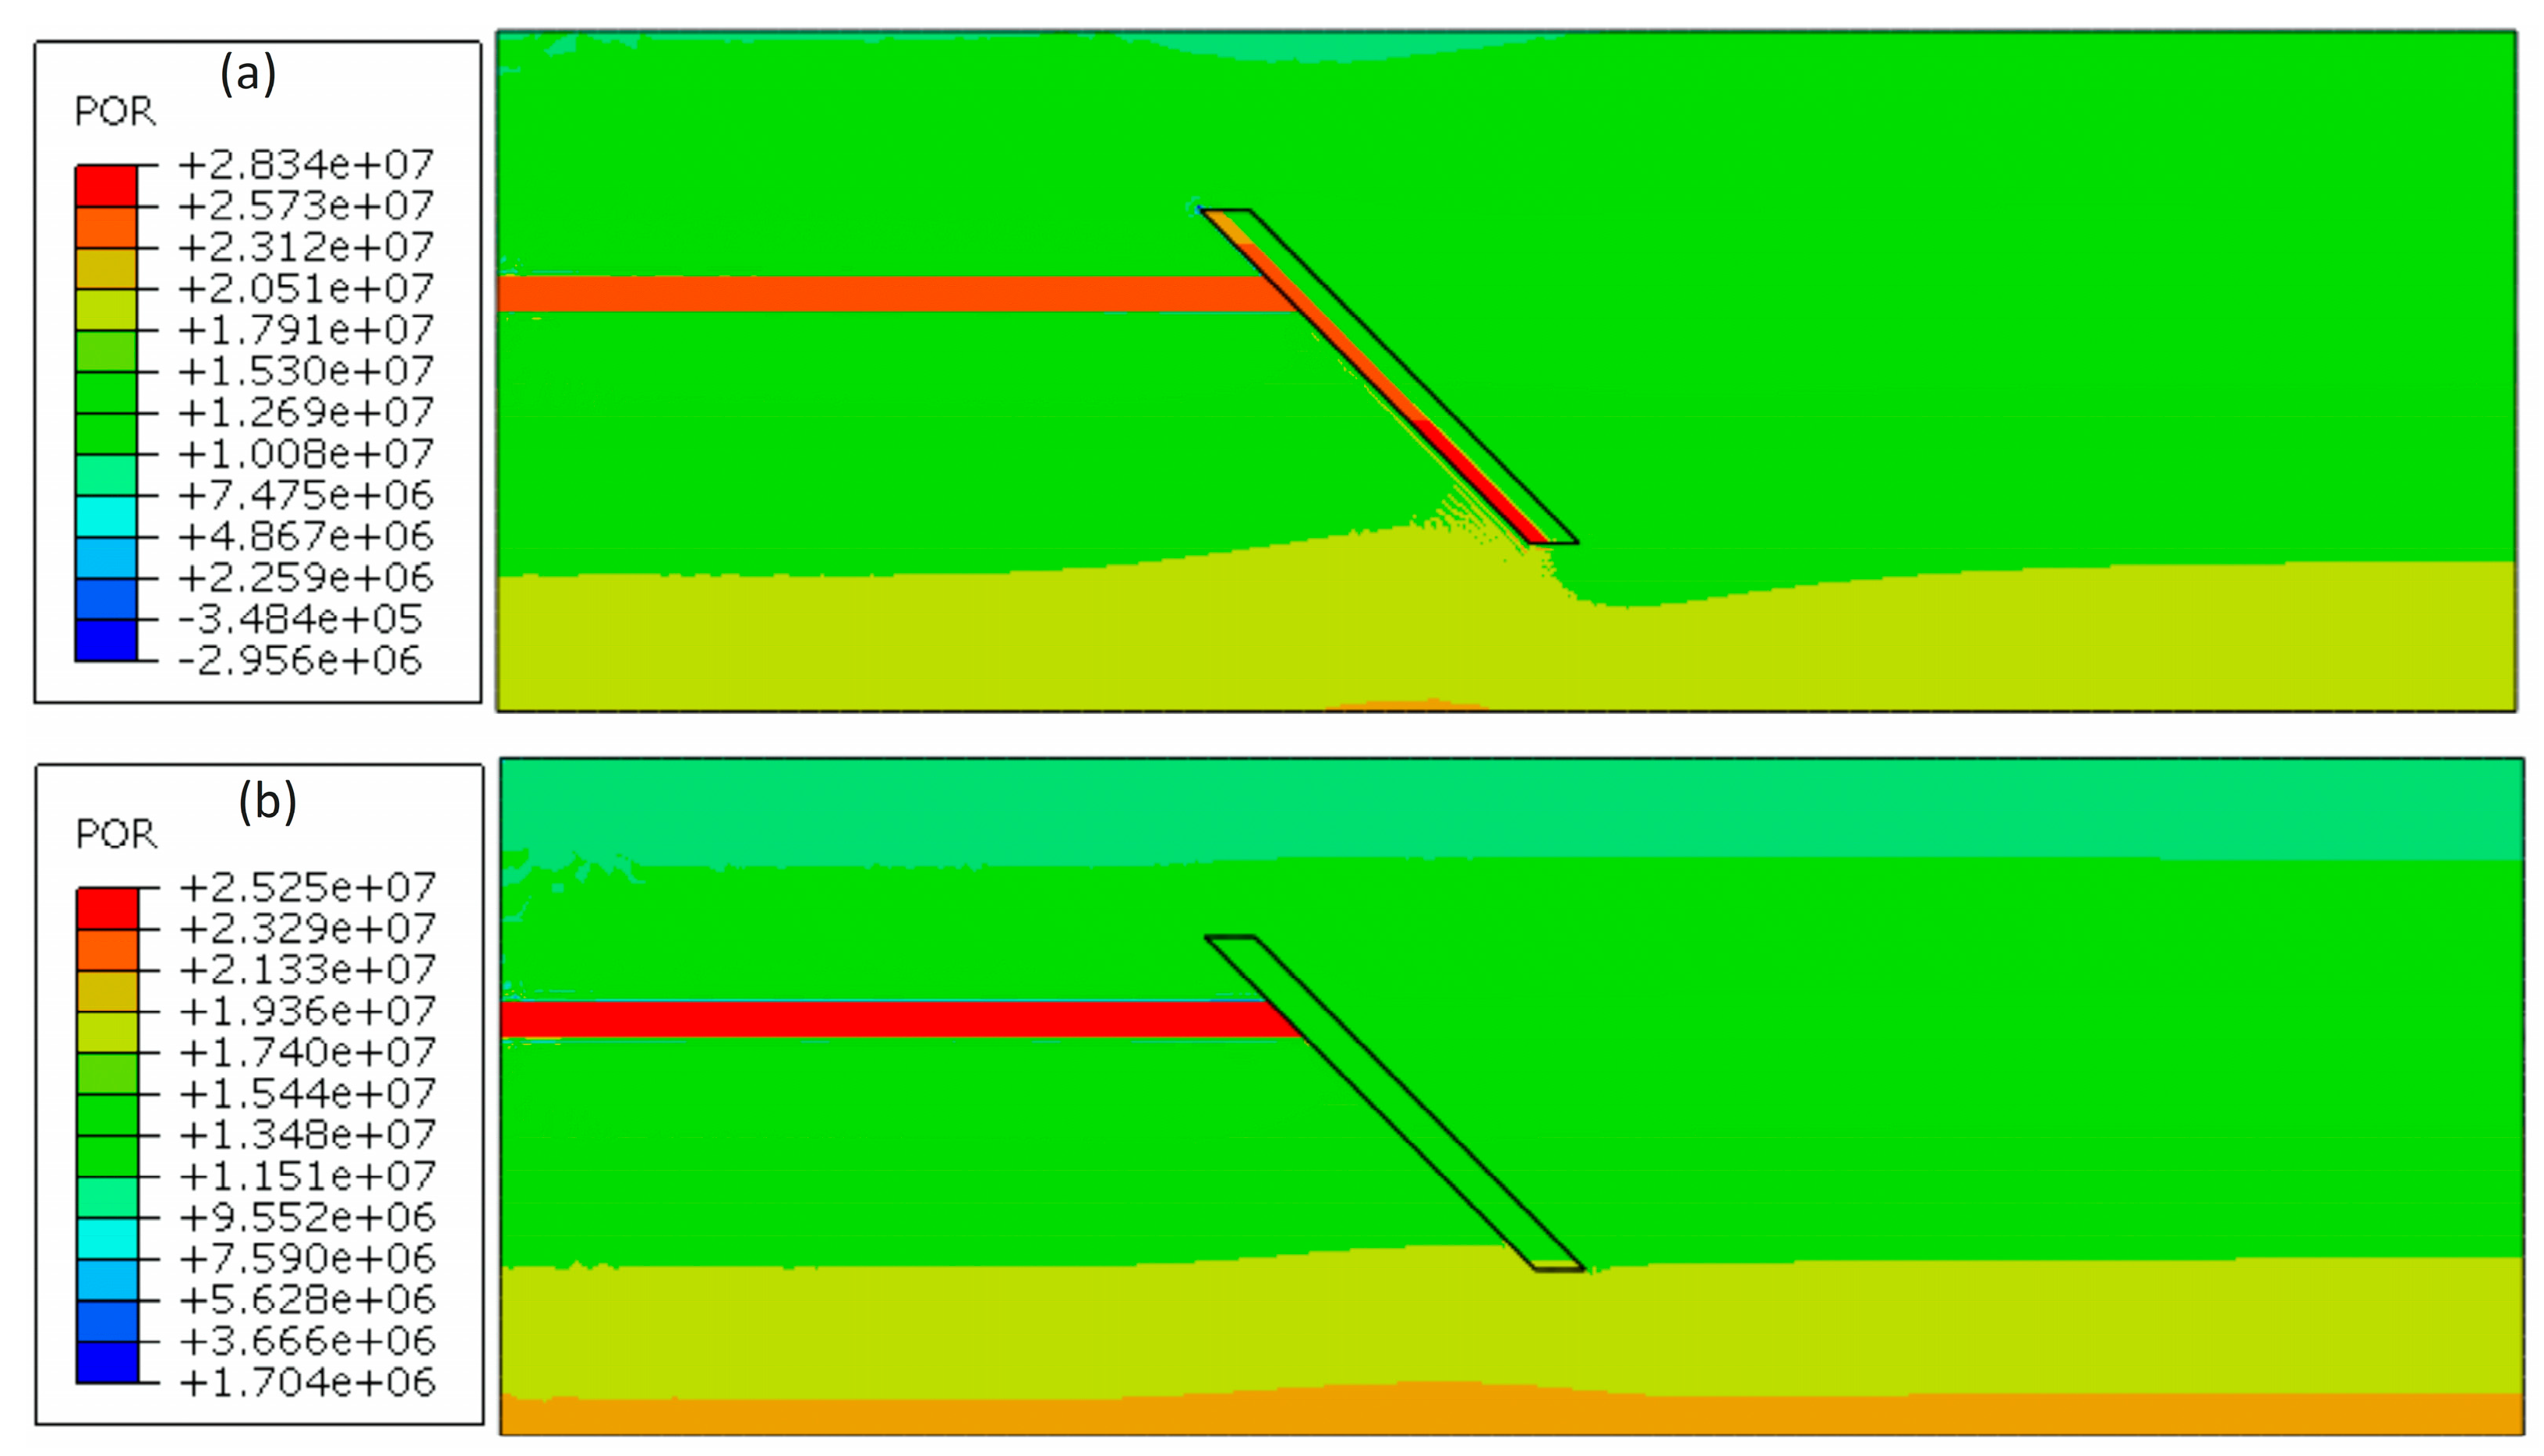
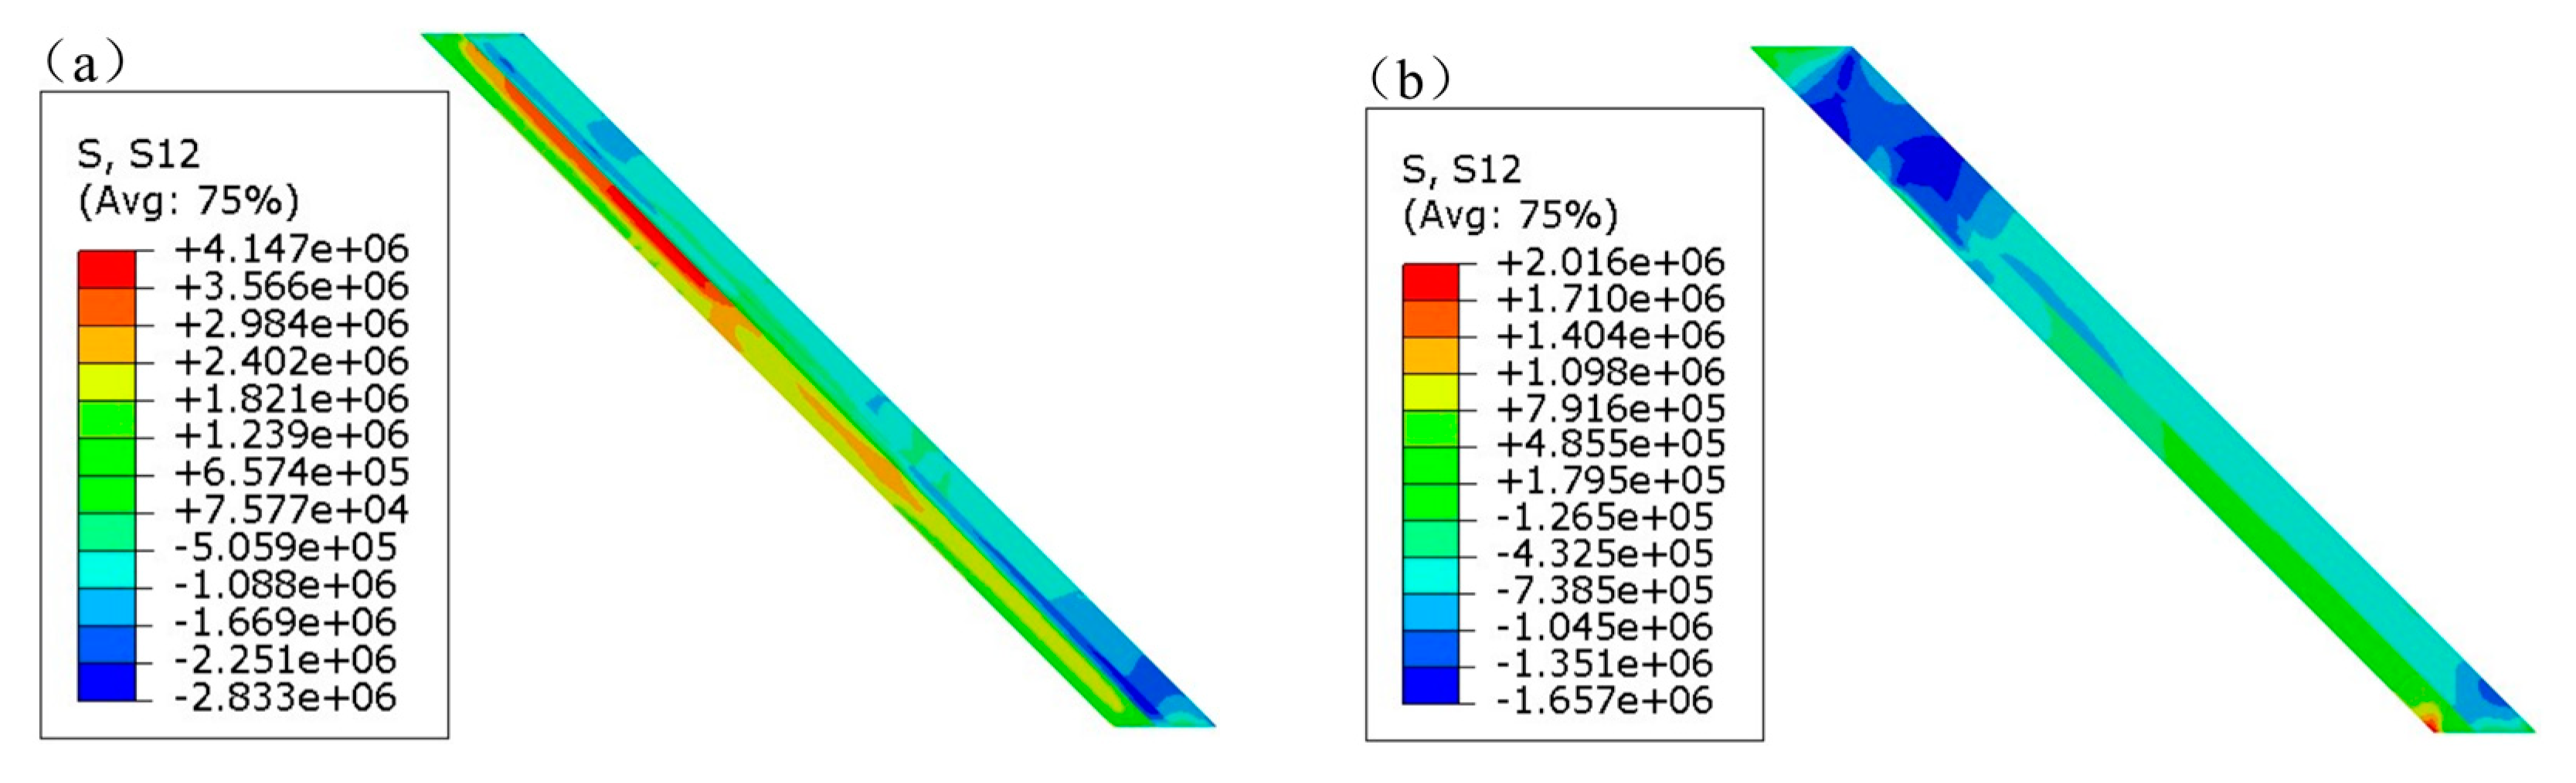
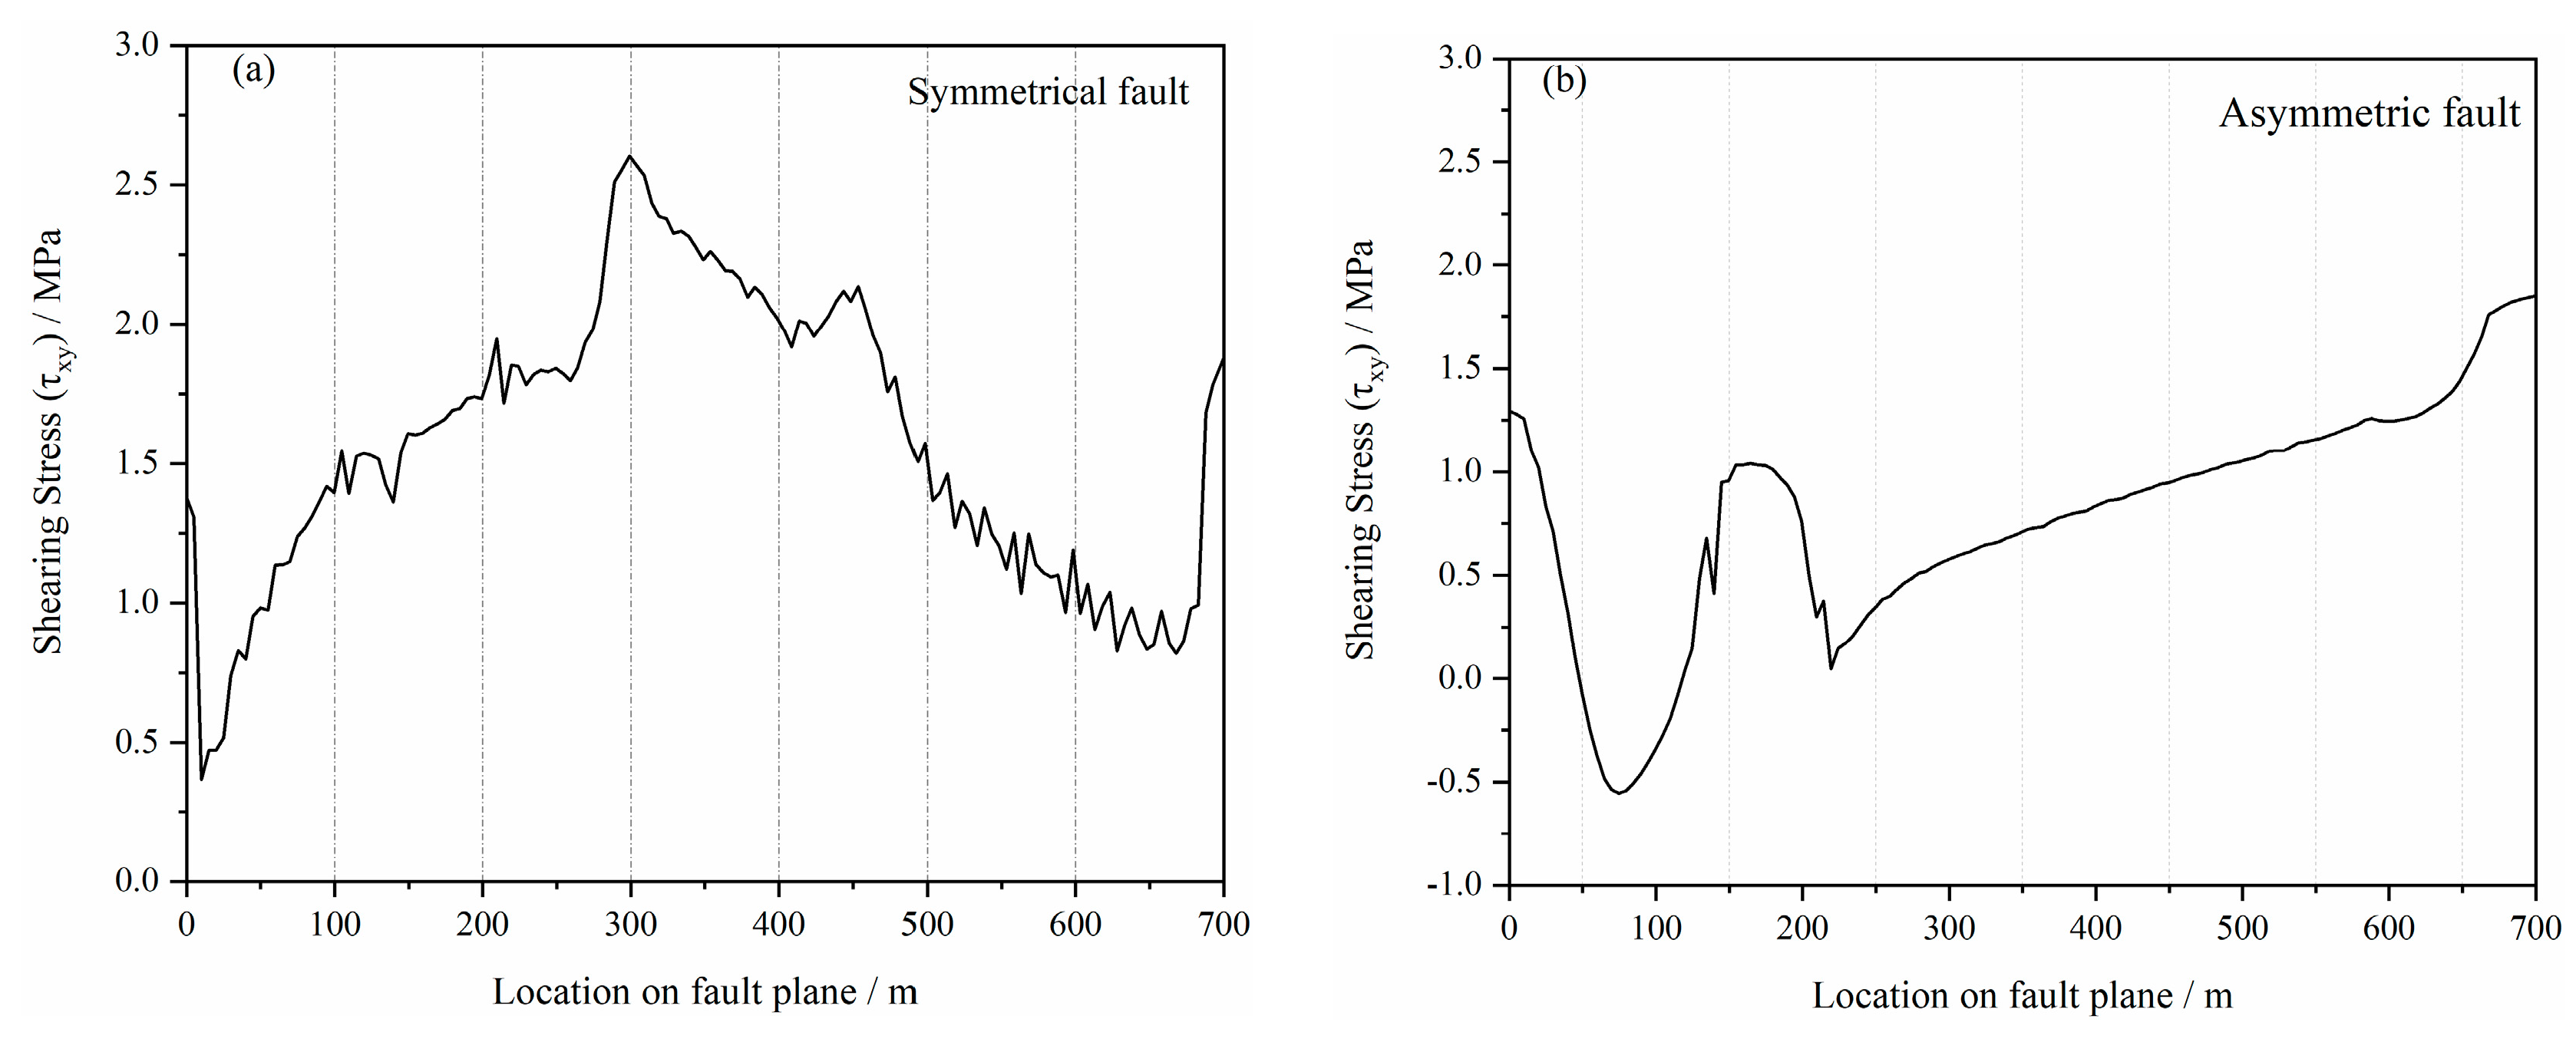
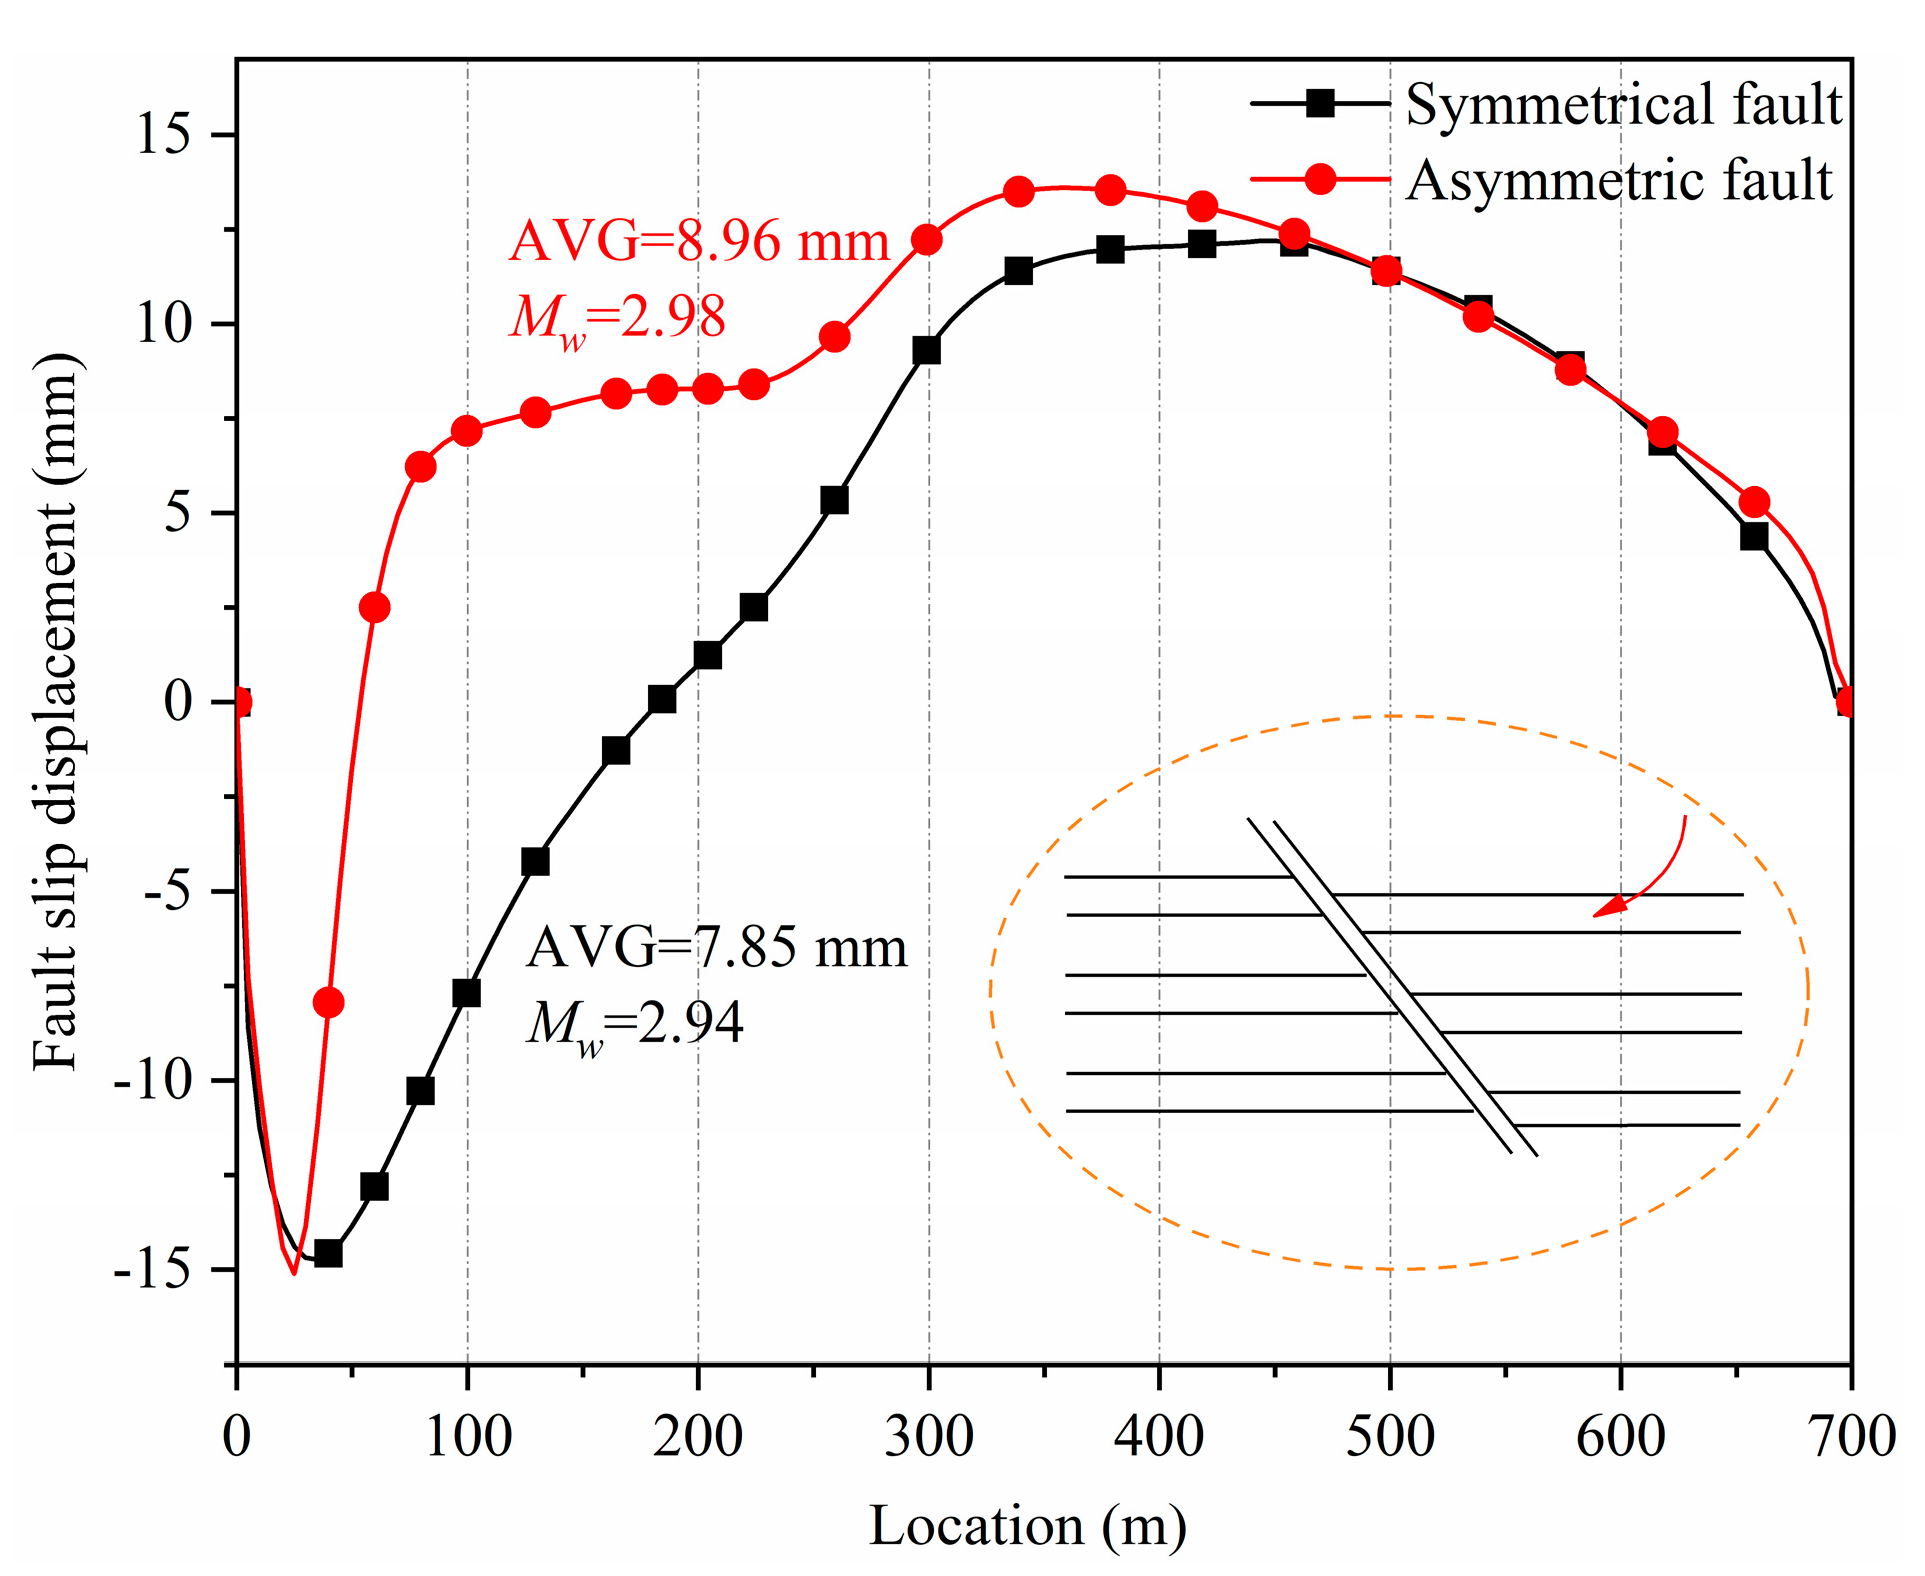
4.1.2. Fluid Pattern II

Figure 12 shows the slip displacement of the symmetrical fault and the asymmetric fault when fluid was injected into the hanging wall reservoir. The slip behaviors of the two categories of faults were also similar. The symmetrical fault exhibited the same varying tendency as the asymmetrical fault, with the upper part sliding downward and the middle and lower parts sliding upward. The maximum slip displacement of the symmetrical fault was 14.74 mm, and that of the asymmetric fault was 15.11 mm. The average slip displacement for the asymmetric fault was 8.96 mm, while the symmetrical fault exhibited an average of 7.85 mm. The results for the two faults were quite close to each other. Based on calculations, the induced earthquake moment (Mw) for the symmetrical fault was 2.94, and for the asymmetric fault, it was 2.98. Although the asymmetric fault induced a slightly larger earthquake, the difference was not statistically significant. The reason was that both the induced fracture zone of the asymmetric fault and the right damage zone of the symmetrical fault had a high permeability. When fluid was injected into hanging wall reservoir, it could flow into both the induced fracture zone and the damage zone. Figure 13 displays the pore-pressure distribution of the two faults after fluid injection into the hanging wall reservoir. Overall, the pore pressure within the asymmetric fault (Figure 13a) was higher and had a wider distribution range than that within the symmetrical fault (Figure 13b). The reason was that the asymmetric fault’s induced fracture zone was thicker than the symmetrical fault’s right damage zone. Fluid injection resulted in a greater reduction in effective stress for the asymmetric fault. As a result, it experienced a slightly higher level of induced slip and seismic activity.

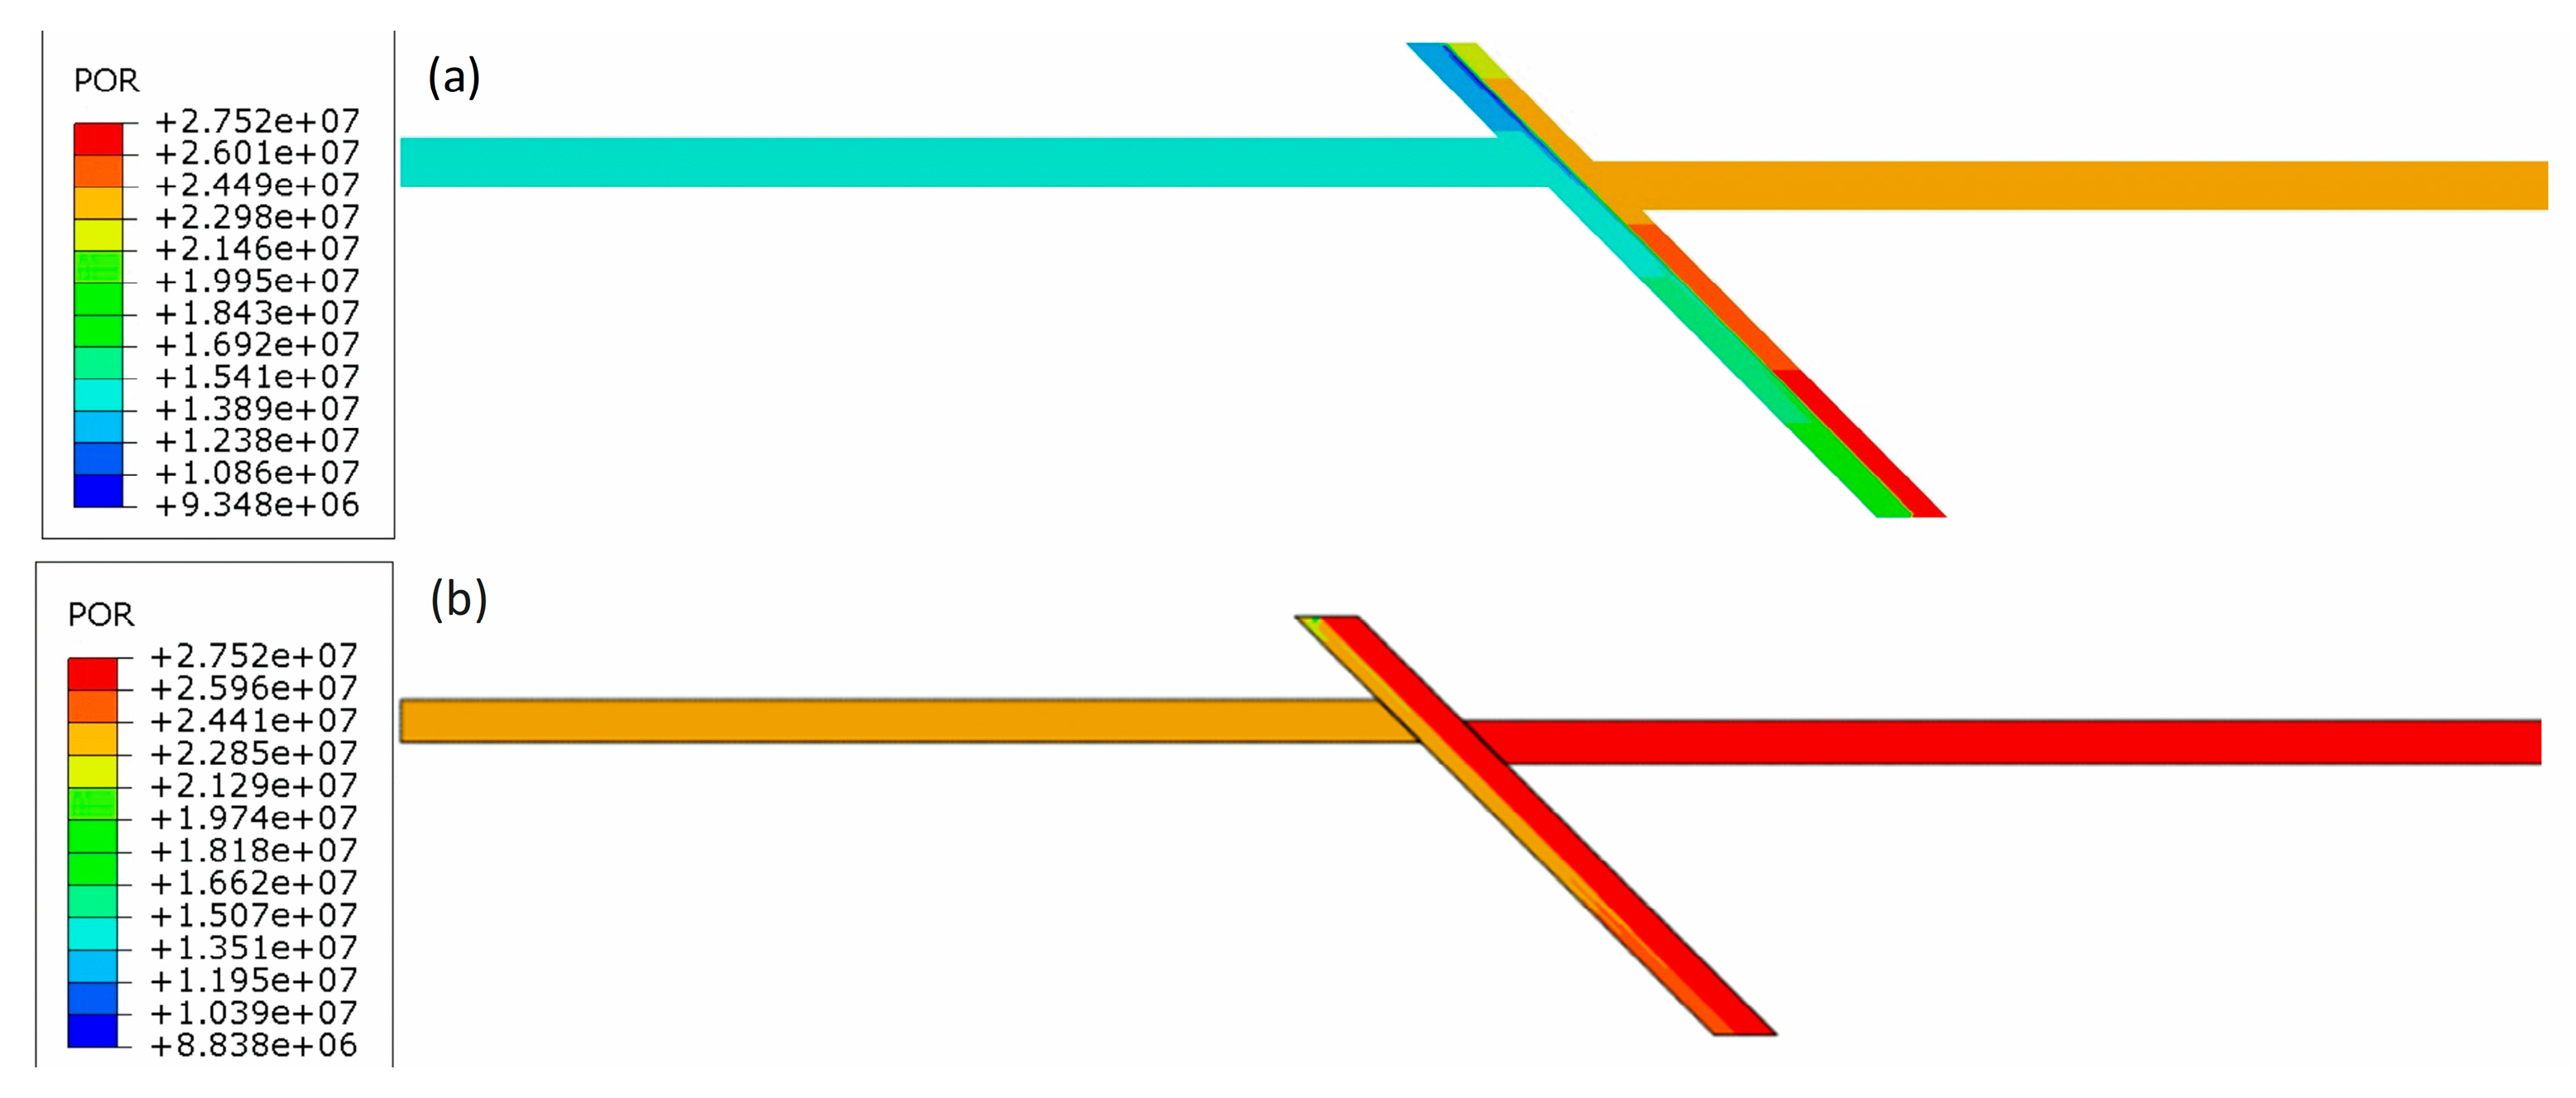
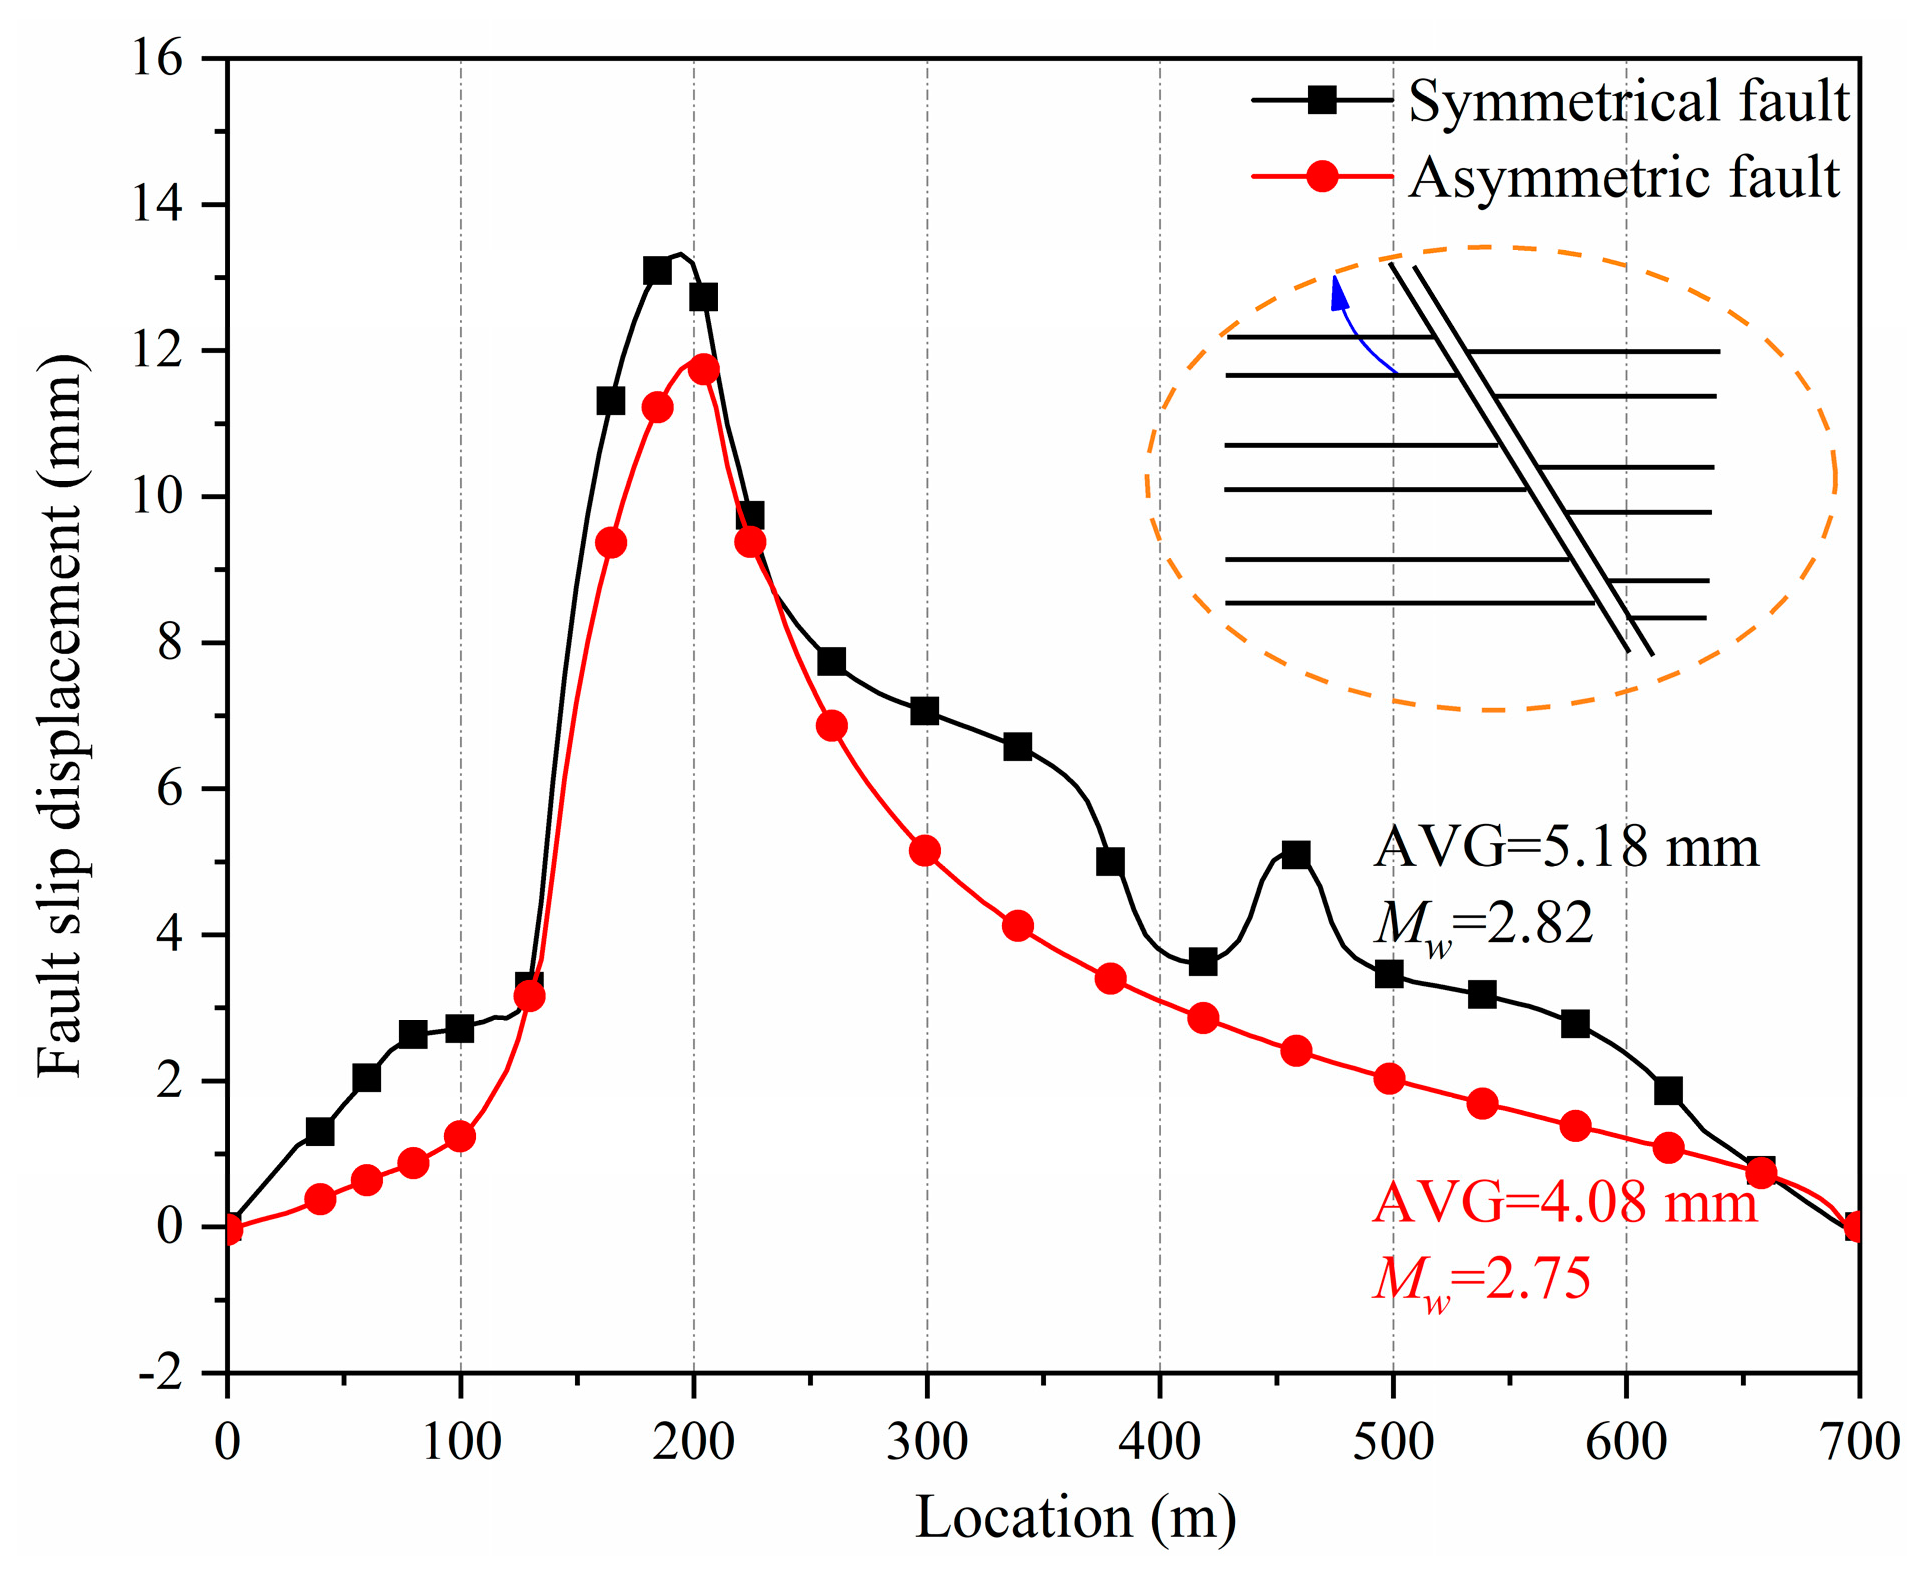
4.1.3. Fluid Pattern III

Figure 14 shows the results under Fluid Pattern III. The slip trends of the two faults were also similar and exhibited a reserved trend consistent with that observed under Pattern I. On the one hand, the slip displacement of the symmetrical fault was larger than that of the asymmetric fault. The asymmetric fault had a maximum slip displacement of 11.85 mm, with an average of 4.08 mm. In contrast, the symmetrical fault’s maximum slip displacement was 13.32 mm, with an average of 5.18 mm. The induced earthquake (Mw) of the symmetrical fault was 2.82. In comparison, the asymmetric fault had an Mw of 2.73. On the other hand, compared with Fluid Pattern I, the difference between the results for the two faults under Pattern III was less significant.
When fluid was extracted from the footwall reservoir, the induced slippage and earthquake of the symmetrical fault were only slightly larger than those of the asymmetric fault. The difference between the two faults was not significant, which differed from the results observed for Pattern I. When fluid was extracted from the reservoir, the primary cause of fault sliding shifted from the Mohr–Coulomb strength criterion to the compressive deformation of the reservoir. Since both the reservoir and the fault consisted of porous elastic materials, compressive deformation occurred in response to increasing load. Fluid extraction directly reduced pore pressure, which was equivalent to applying load. Therefore, when fluid was extracted, the region experienced a decrease in pore pressure and underwent compressive deformation. Excessive deformation can also lead to fault slipping. Since the sliding crush zone of the asymmetric fault was connected to the footwall reservoir, the pore pressure in the fault remained almost unchanged when fluid was extracted from the reservoir. The fault slip was primarily caused by the compressive deformation of the reservoir. For the symmetrical fault, the slip was caused by a combination of the compressive deformation of the reservoir and the damage zone on the fault’s left side. As a result, the induced slippage and earthquake of the symmetrical fault were larger than those of the asymmetric fault.
Figure 15 presents nephograms of the vertical displacement for the symmetrical and asymmetric faults. From these images, it is evident that fluid extraction led to significant compression of the rock formations. We selected the fault and its surrounding area for analysis. When the fault was symmetrical, both the pore pressure in the reservoir and the left fault damage zone decreased. This reduction led to compressive deformation in the fault and its surrounding areas (Figure 15a). As indicated by the purple dashed ellipse, the vertical displacement in the upper part of the fault and its top-right surrounding area was downward, while the vertical displacement in the bottom-left area of the fault was upward. When the fault was asymmetric, the area indicated by the purple dashed ellipse was obviously small (Figure 15b). This was because the sliding crush zone of the fault was impermeable. When fluid was extracted, only the reservoir underwent compression and induced the surrounding fault areas to deform. Therefore, the slip region and degree of the asymmetric fault were smaller than for the symmetrical fault. Next, we compared the outcomes of Fluid Pattern III with those of Fluid Pattern I. Under Pattern I, the induced average slip of the symmetrical fault was 12 mm greater than that of the asymmetric fault. Under Pattern III, the difference was only 1.1 mm. The induced slippage differences of the two faults under Pattern III were less significant than those under Pattern I. It can be concluded that the degree of fault slippage caused by compressive deformation is lower than that caused by shear slippage.

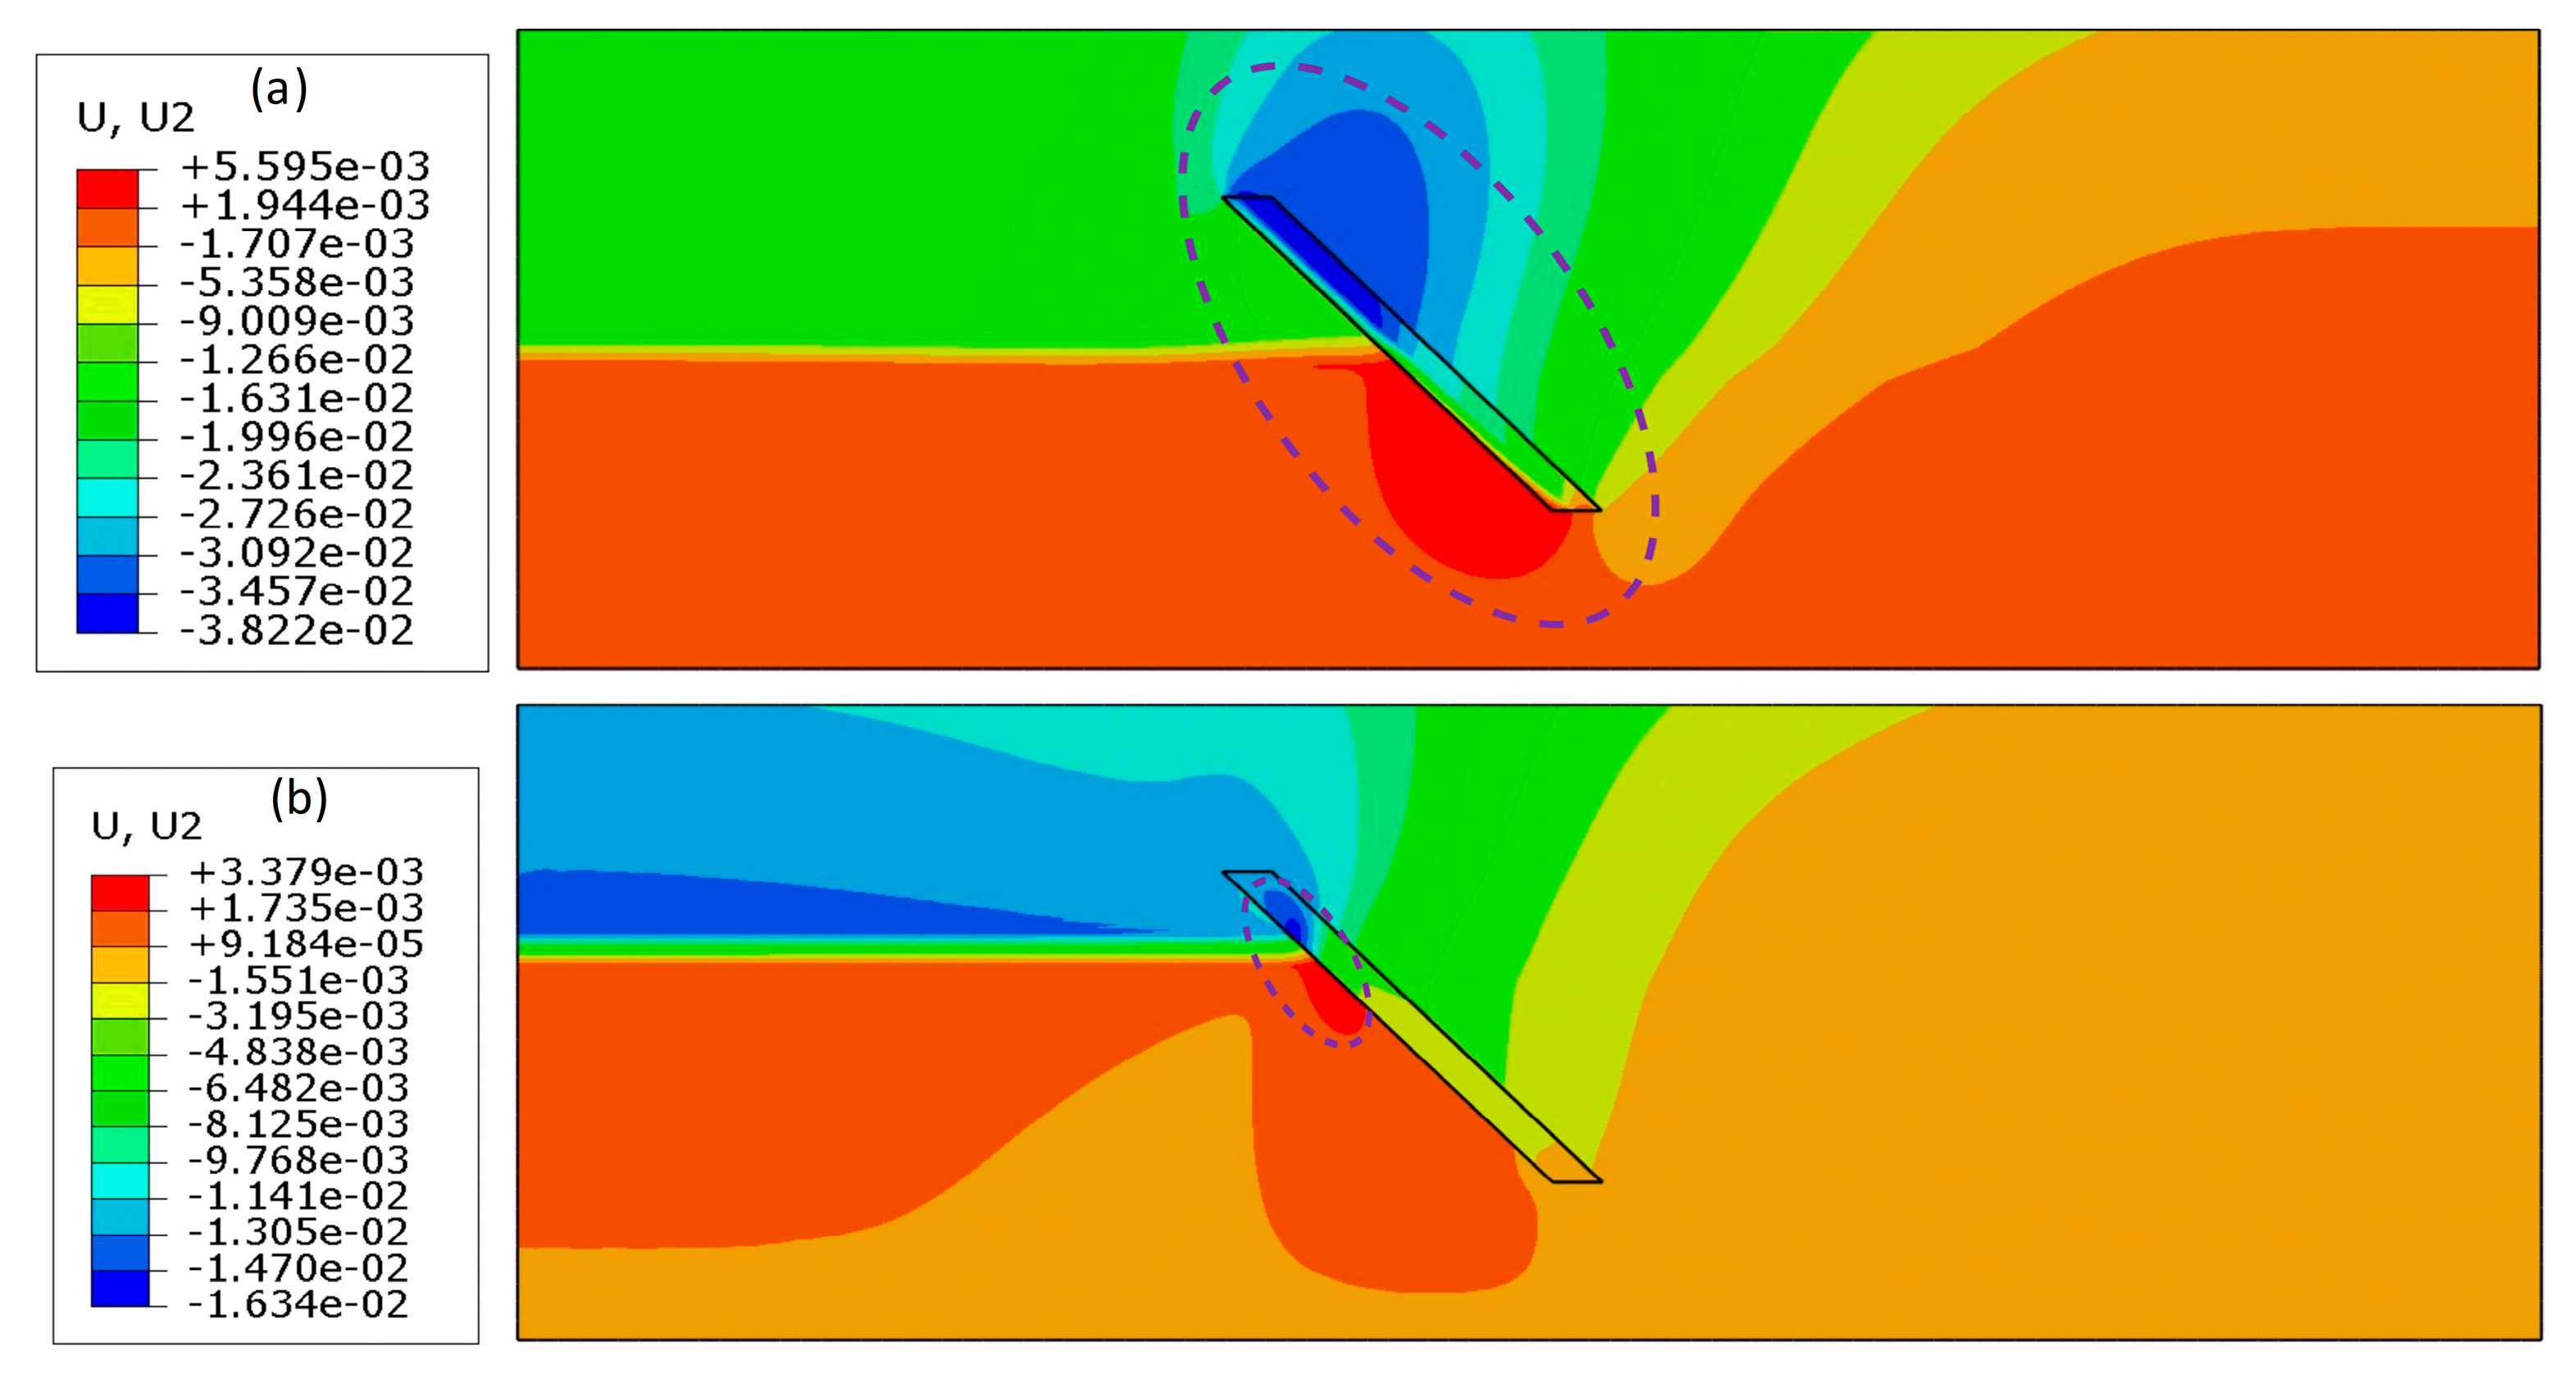
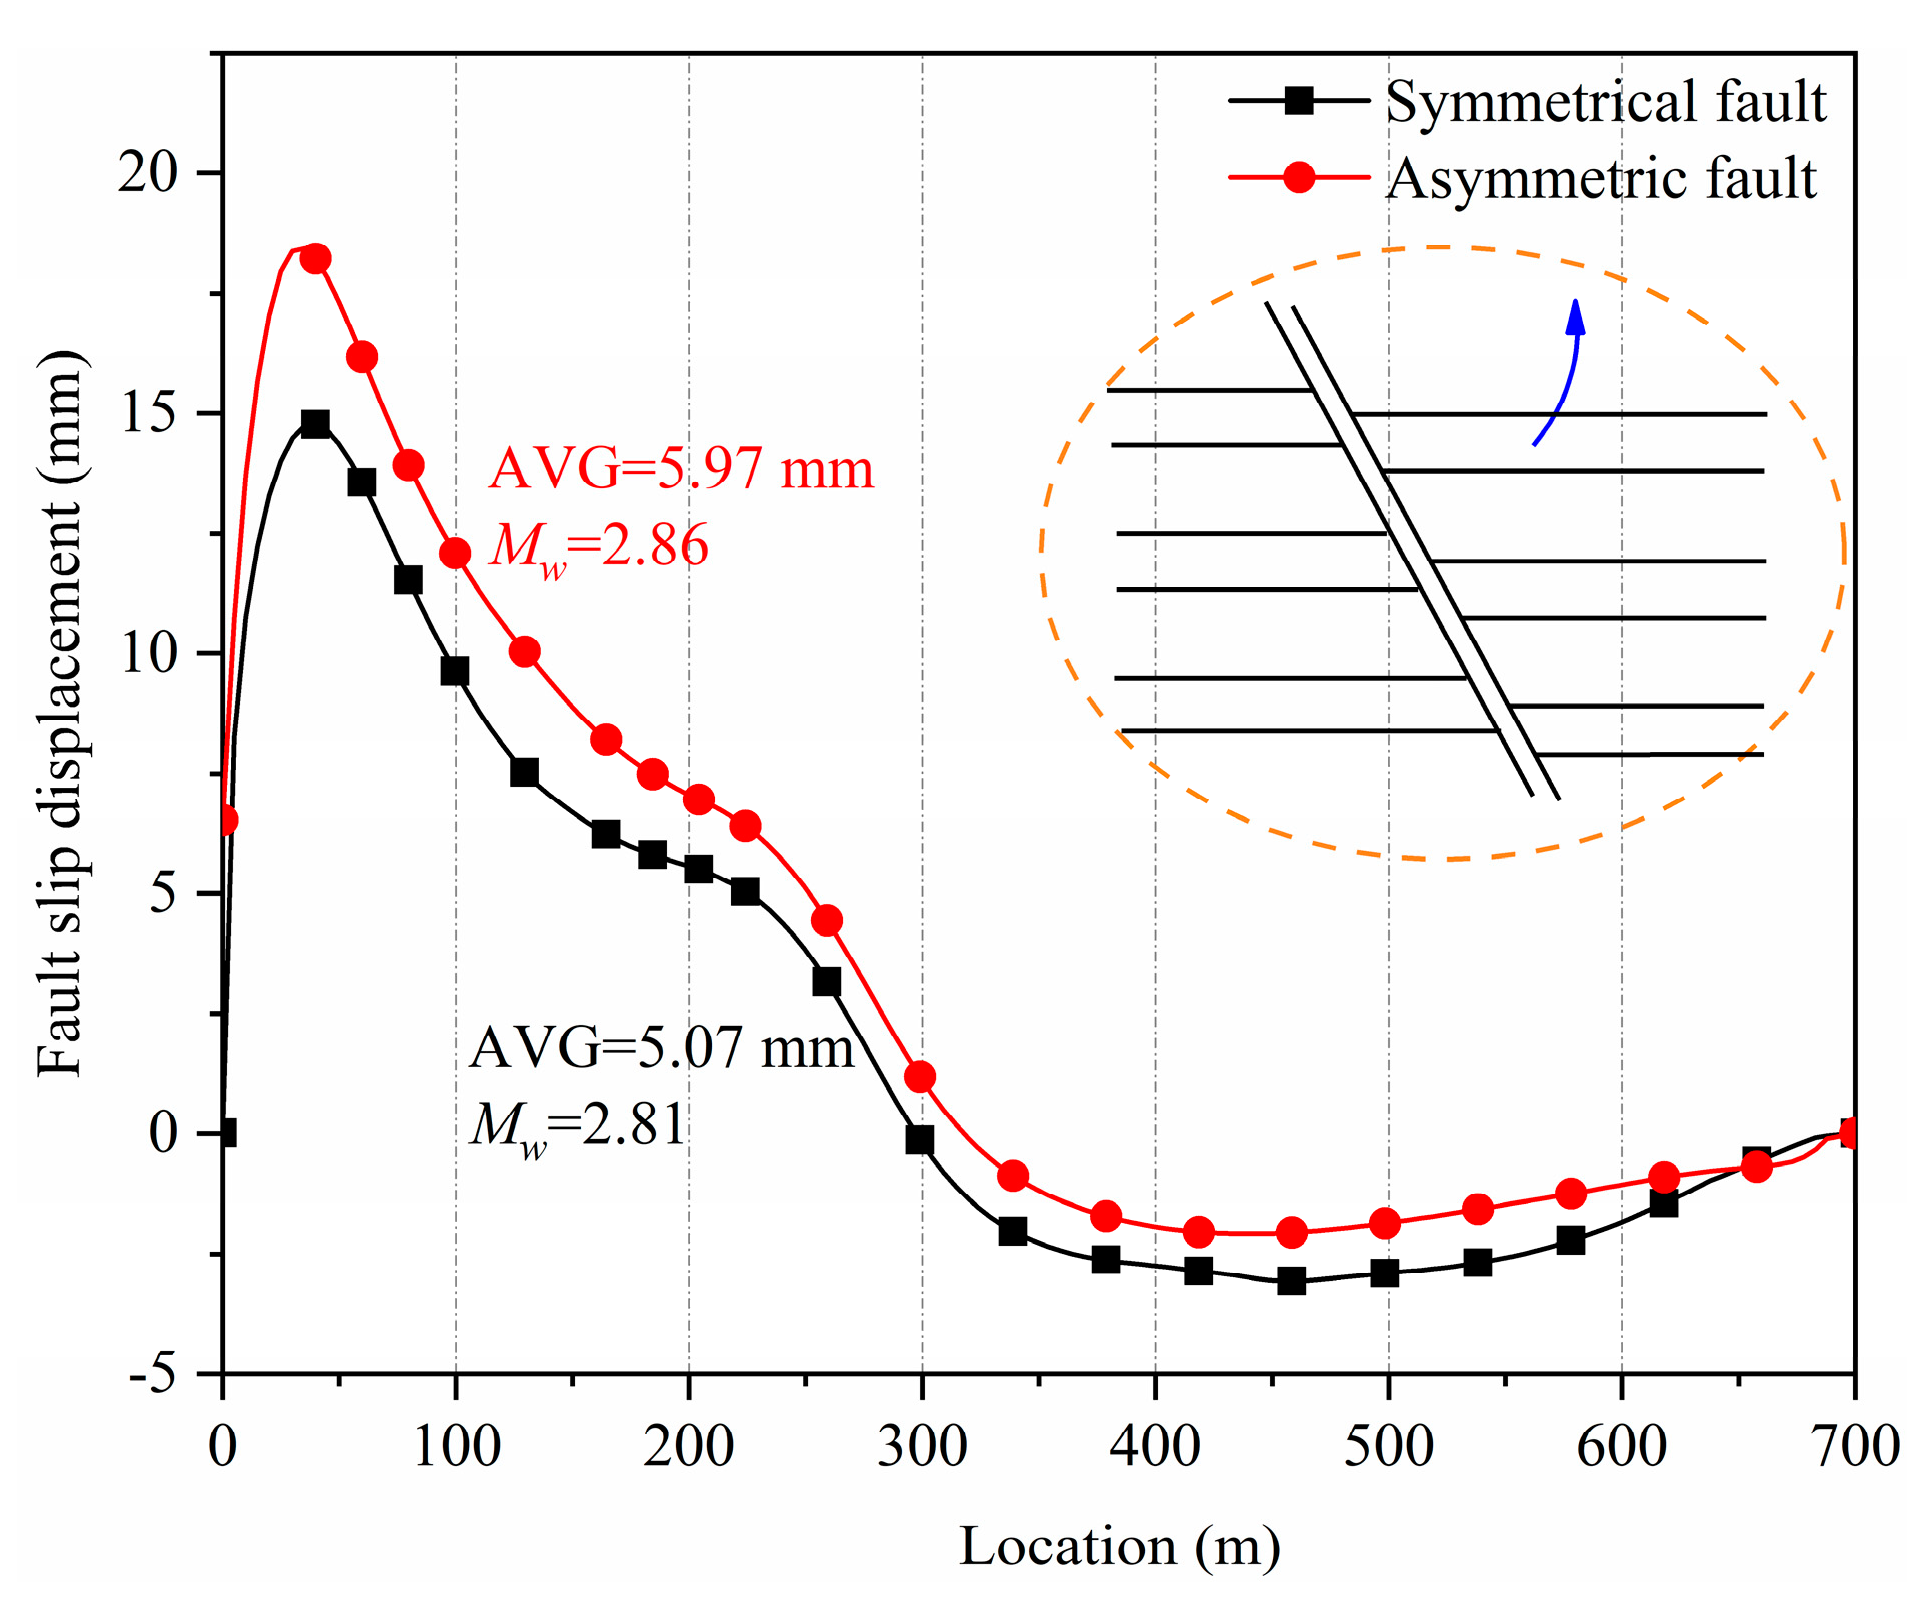
4.1.4. Fluid Pattern IV

Figure 16 shows the slip displacement of the symmetrical fault and the asymmetric fault under Fluid Pattern IV. When fluid was extracted from the hanging reservoir, the slips of the symmetrical fault and the asymmetric fault exhibited similar varying tendencies and quantities. The maximum slip displacements of the symmetrical fault and the asymmetric fault were 14.76 mm and 18.43 mm, respectively. The average slip displacements were 5.07 mm for the symmetrical fault and 5.97 mm for the asymmetric fault. The induced earthquake (Mw) of the symmetrical fault was 2.81, while that for the asymmetric fault was 2.86. The induced slippage and earthquakes of the symmetrical fault were slightly larger. The right damage zone of the symmetrical fault and the induced fractured zone of the asymmetric fault were connected to the hanging wall reservoir. Both zones had high permeability. When fluid was extracted from the hanging wall reservoir, the pore pressure in both zones decreased. The compressive deformation of the reservoir and the fault zone led fault to a loss of stability and to sliding. The induced fracture zone of the symmetrical fault was thicker than its right damage zone, resulting in greater induced slippage and seismic activity for the symmetrical fault. However, the impact was not significant. The difference in slippage between the two faults was minimal.

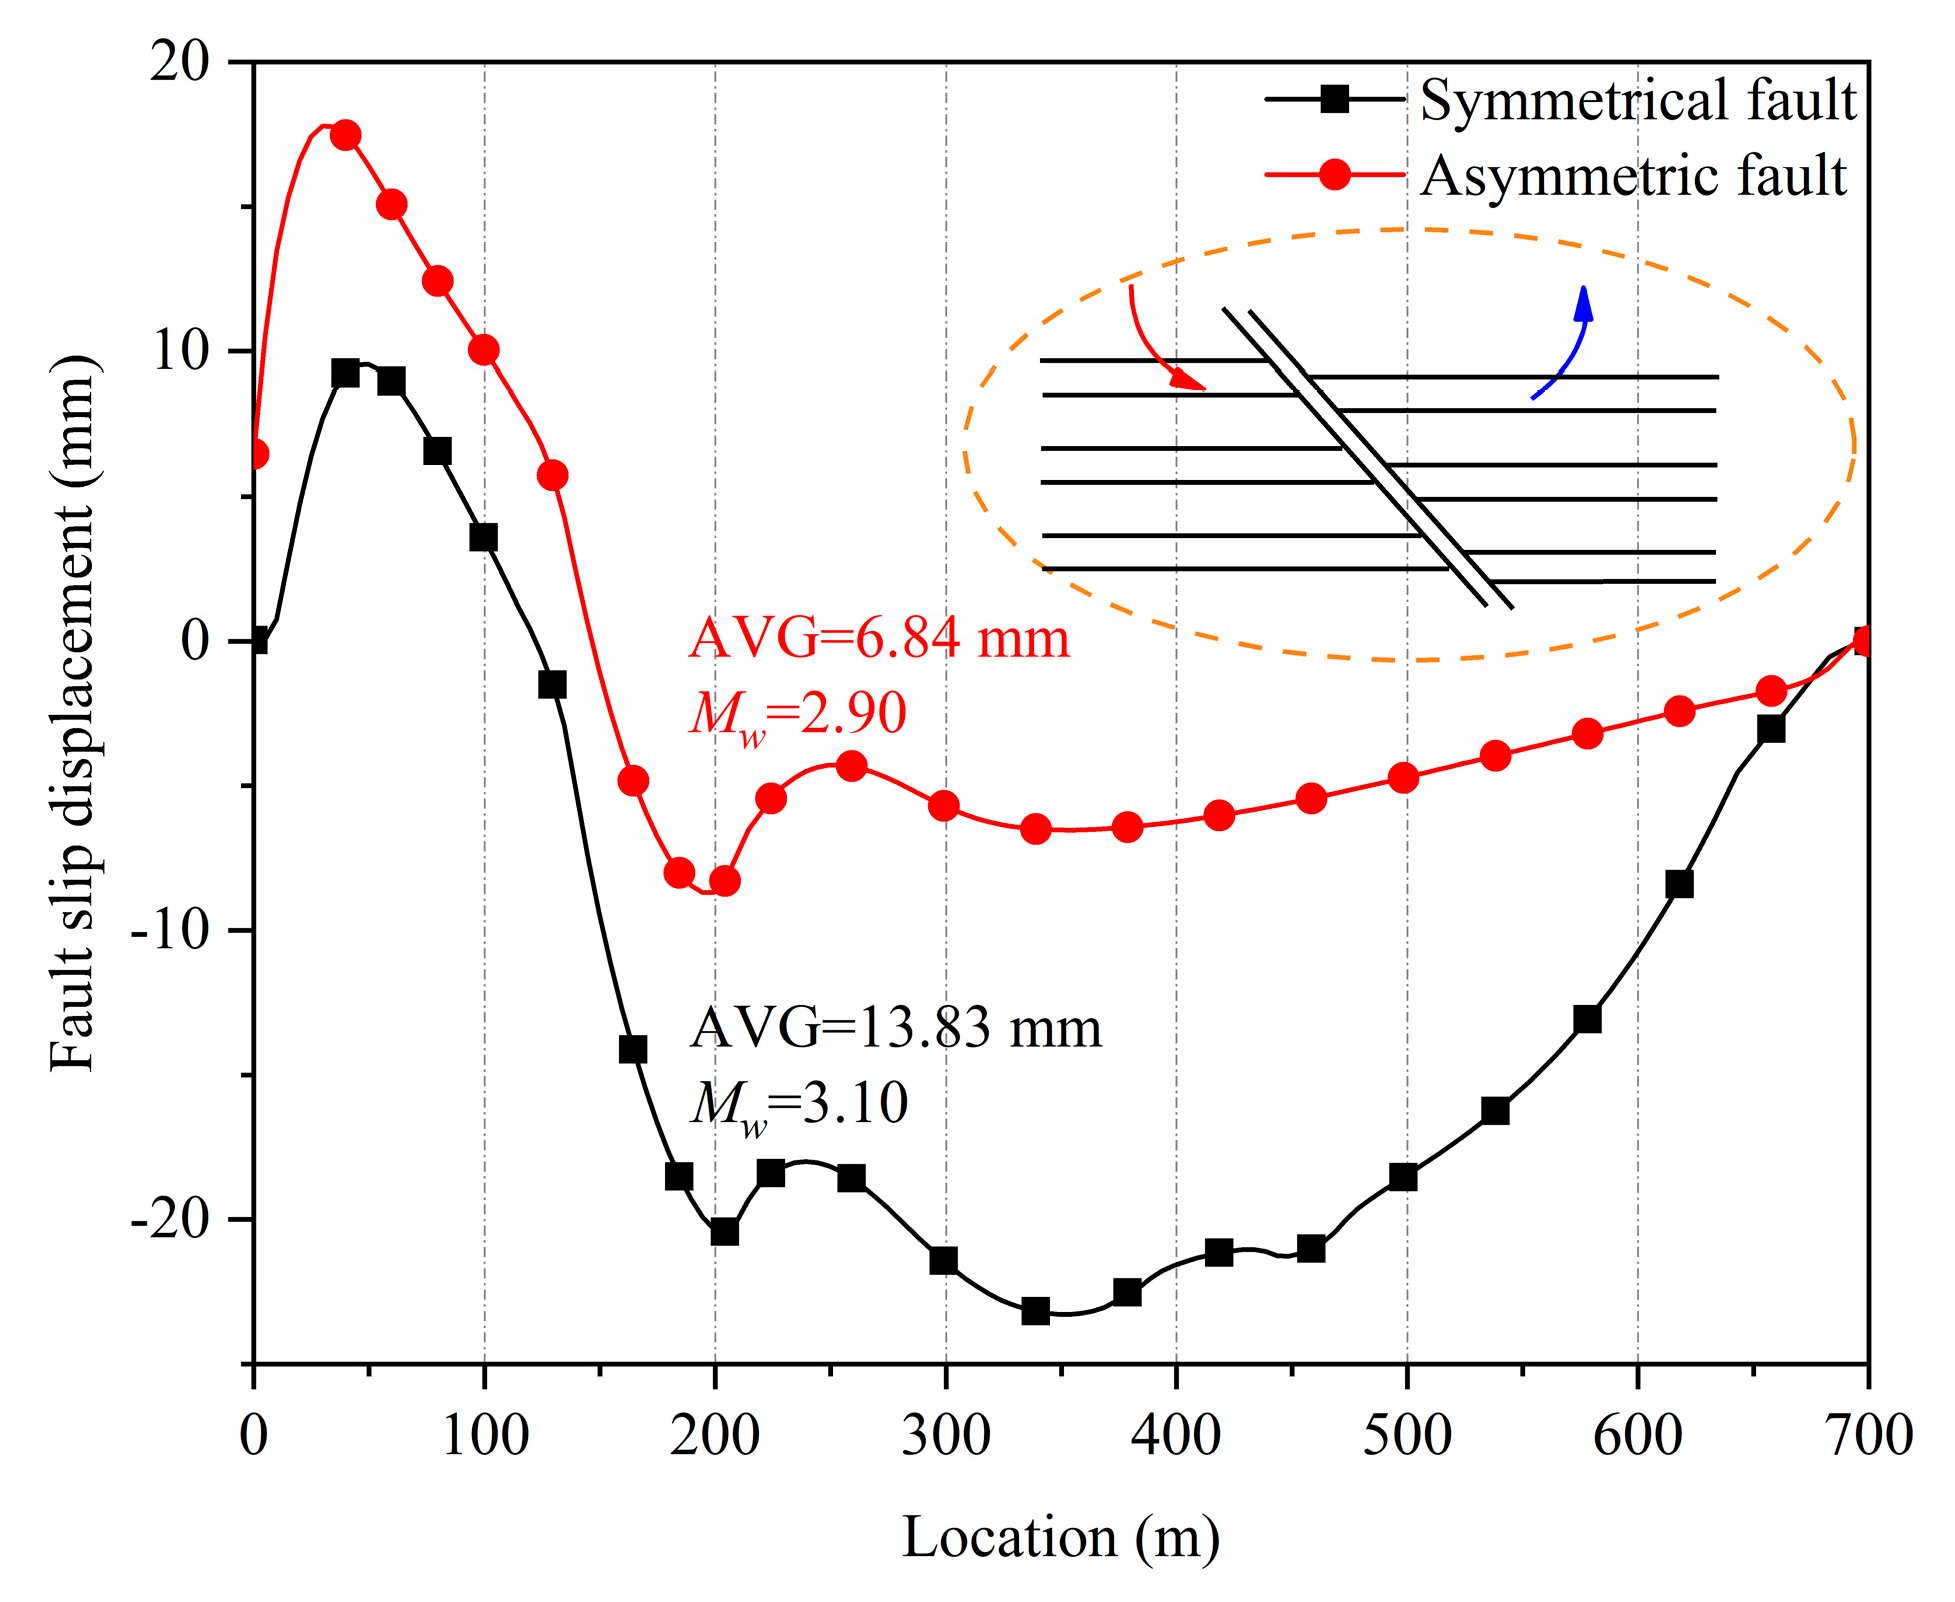
4.1.5. Fluid Pattern V

Fluid Pattern VI represented fluid being injected into the footwall reservoir and simultaneously extracted from the hanging wall reservoir. Figure 17 shows the slip displacement of the two faults under Fluid Pattern V. The slip tendencies of the symmetrical fault and the asymmetric fault were similar, with the upper part sliding upward and the lower part sliding downward. The maximum slip displacement of the asymmetric fault was 17.78 mm, with an average of 6.84 mm. In contrast, the symmetrical fault exhibited a maximum slip displacement of 23.28 mm, with an average of 13.83 mm. The Mw values of the asymmetric fault and the symmetrical fault were 2.90 and 3.10, respectively. The average displacement of the symmetrical fault was more than double that of the asymmetric fault, with the induced earthquake magnitude being larger by 0.2. The differences in the results between the two faults were still quite pronounced.

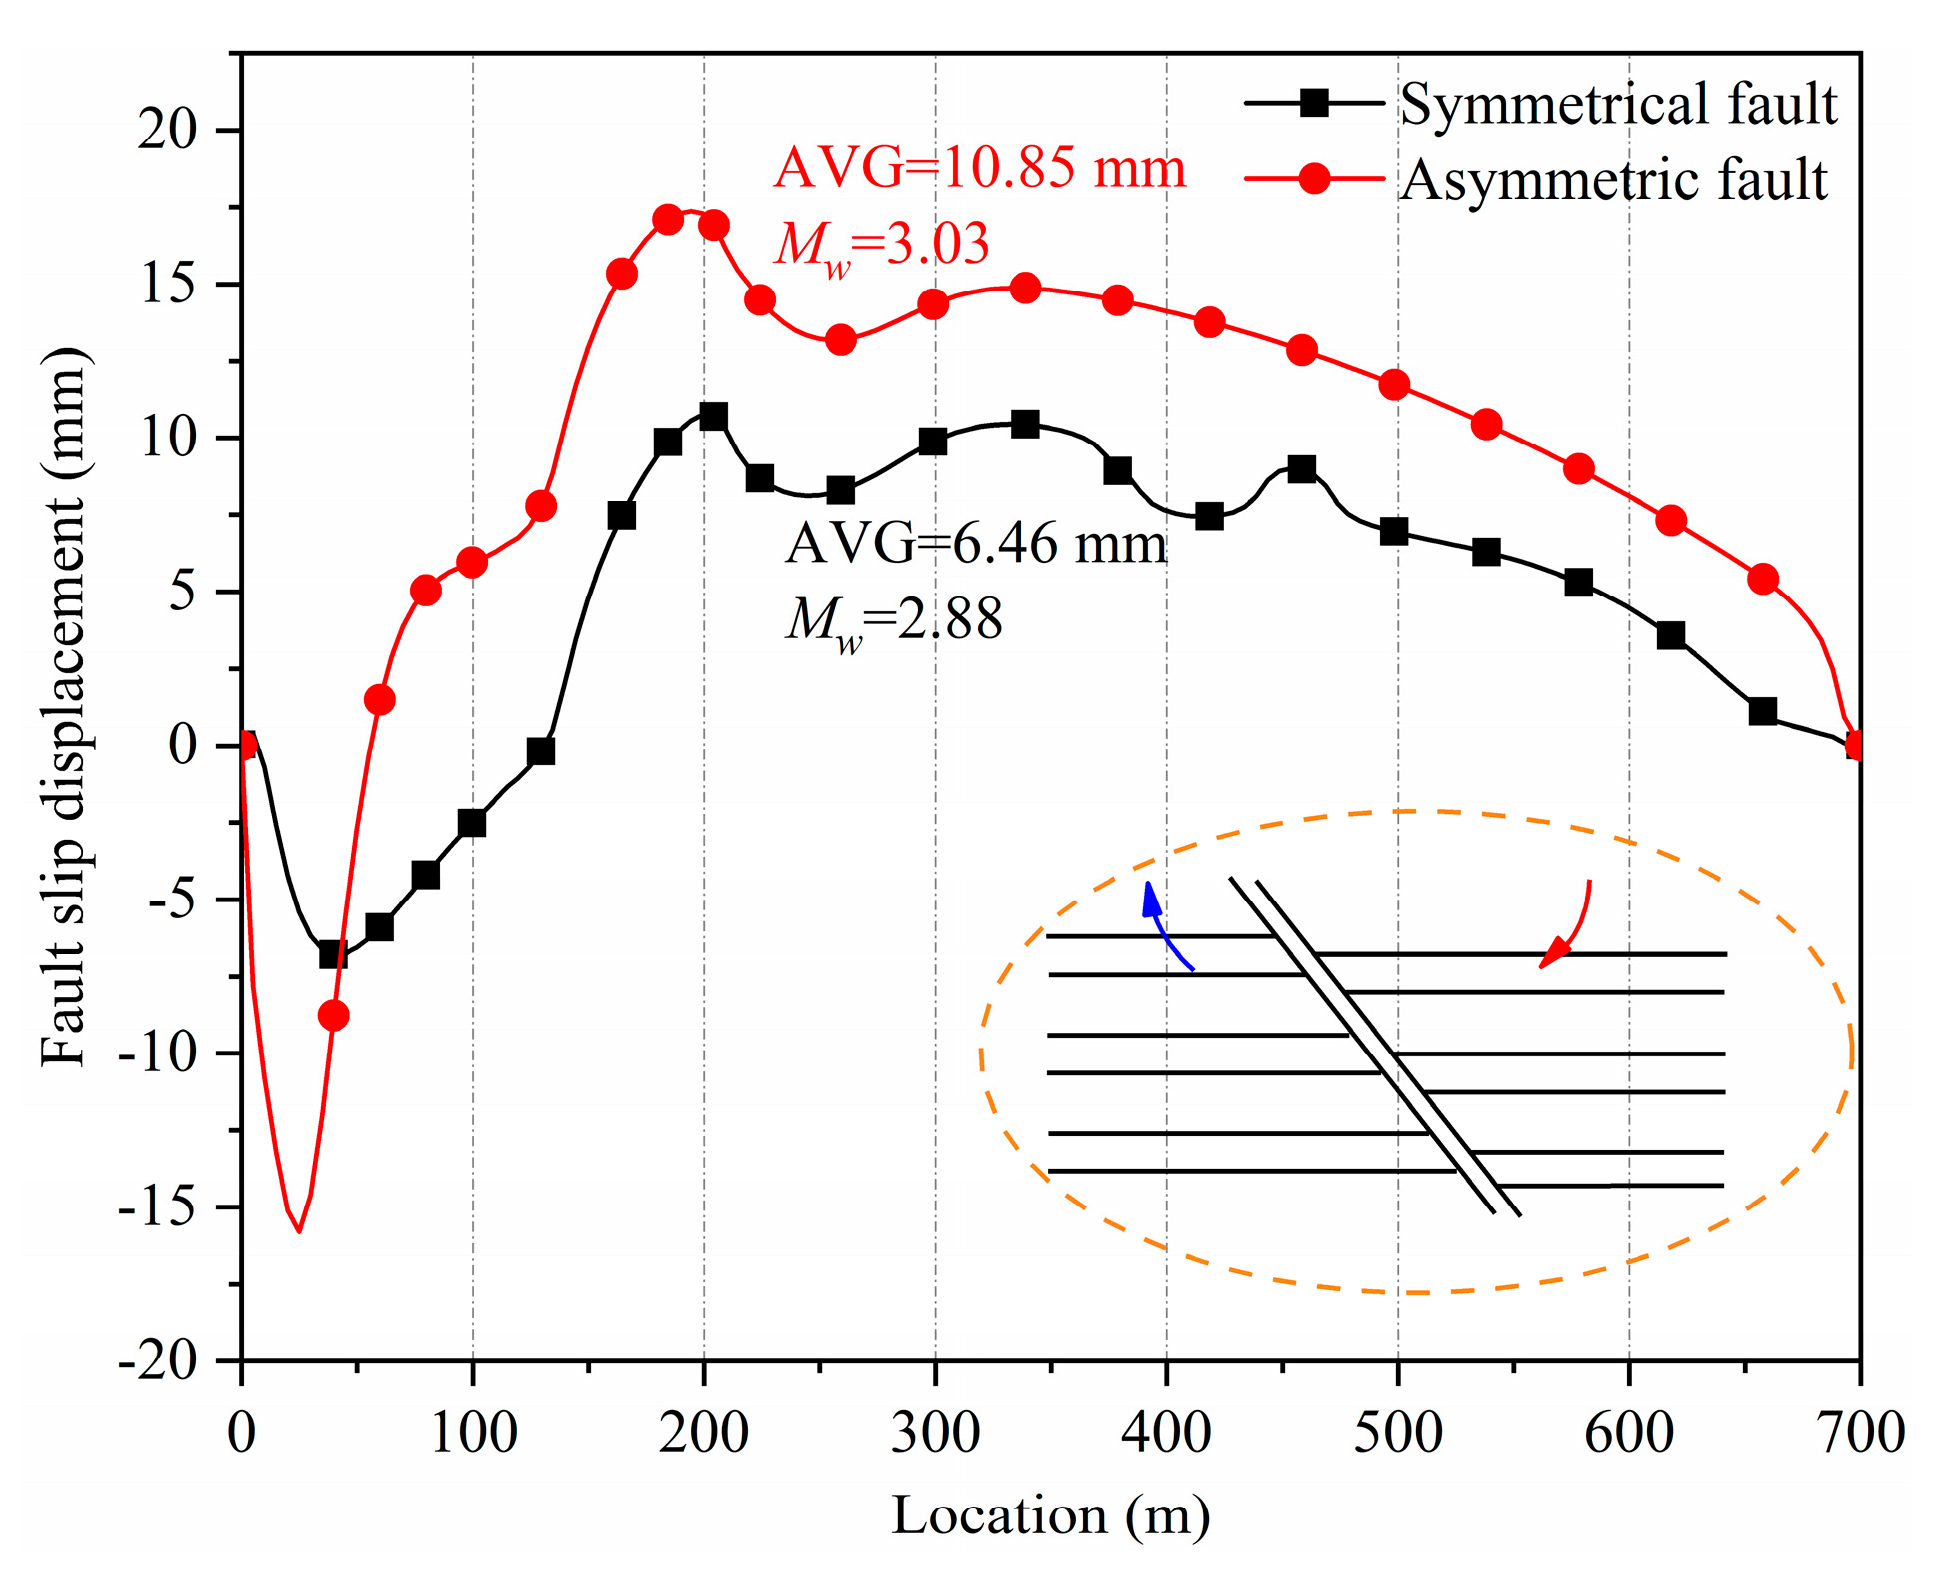
4.1.6. Fluid Pattern VI

Fluid Pattern VI represented the fluid being injected into the hanging wall reservoir and simultaneously extracted from the footwall reservoir. Figure 18 shows the slip displacement of the symmetrical fault and the asymmetric fault. The slip tendency of the faults under Fluid Pattern VI was the opposite of that under Pattern V. The maximum slip displacement of the asymmetric fault was 17.37 mm, with an average of 6.46 mm. The maximum slip displacement of the symmetrical fault was 10.75 mm, with an average of 10.85 mm. The Mw of the induced earthquake of the asymmetric fault was 3.03. The Mw of the induced earthquake of the symmetrical fault was 2.88. The induced slippage and earthquake of the symmetrical fault were larger than those of the asymmetric fault, which was the opposite of what occurred under Pattern V.

4.2. Lower Reservoir

Figure 19 illustrates the fault slip displacement for both the symmetrical and asymmetric faults under the six fluid patterns in the lower reservoir.
Figure 19a shows the slip of the faults under Fluid Pattern I. The asymmetric fault exhibited a maximum slip displacement of 13.40 mm and an average slip displacement of 2.03 mm. In comparison, the symmetrical fault had a maximum slip displacement of 28.21 mm, with an average of 19.44 mm. The Mw of the induced earthquake of the asymmetric fault was 2.55. In contrast, the Mw of the induced earthquake for the symmetrical fault was as high as 3.20. The induced slippage and seismic activity of the symmetrical fault were considerably greater than those of the asymmetric fault, with an Mw difference of 0.65. The induced slippage and earthquake of the symmetrical fault were much larger than those of the asymmetric fault, with the Mw being larger by 0.65.
Figure 19b shows the slip of the faults under Fluid Pattern II. The maximum slip displacement of the asymmetric fault was 14.26 mm, with an average slip displacement of 9.40 mm. The maximum slip displacement of the symmetrical fault was 15.58 mm, with an average slip displacement of 7.92 mm. The induced earthquake of the asymmetric fault had an Mw of 2.99, while the symmetrical fault’s induced earthquake registered an Mw of 2.94. Consequently, the slippage and seismic activity induced by the symmetrical fault were slightly less than those of the asymmetric fault. Compared to the results from the upper reservoir, both the asymmetric and symmetrical faults showed a slight increase in their results when fluid was injected into the lower reservoir.
Figure 19c showed the slip of the faults under Fluid Pattern III. The maximum slip displacement of the asymmetric fault was 9.97 mm, with an average slip displacement of 1.59 mm. The maximum slip displacement of the symmetrical fault was 15.25 mm, with an average slip displacement of 9.35 mm. The Mw of the induced earthquake of the asymmetric fault was 2.47, while that of the induced earthquake of the symmetrical fault was 2.99. The induced slippage of the symmetrical fault was obvious larger than that of the asymmetric one. The earthquake of the symmetrical fault was larger than that of the asymmetric fault by 0.52.
Figure 19d shows the slip of the faults under Fluid Pattern IV. The maximum slip displacement of the asymmetric fault was 17.04 mm, with an average slip displacement of 5.22 mm. The maximum slip displacement of the symmetrical fault was 15.08 mm, with an average slip displacement of 4.28 mm. The Mw of the induced earthquake of the asymmetric fault was 2.82, while that of the induced earthquake of the symmetrical fault was 2.76. The induced slippage and earthquake of the symmetrical fault were slightly smaller than those of the asymmetric fault.
Figure 19e shows the slip of the faults under Fluid Pattern V. The maximum slip displacement of the asymmetric fault was 17.59 mm, with an average slip displacement of 5.25 mm. The maximum slip displacement of the symmetrical fault was 19.72 mm, with an average slip displacement of 11.35 mm. The Mw of the induced earthquake of the asymmetric fault was 2.82, while that of the induced earthquake of the symmetrical fault was 3.04. The induced slippage and earthquake of the symmetrical fault were larger than those of the asymmetric fault.
Figure 19f shows the slip of the faults under Fluid Pattern VI. The maximum slip displacement of the asymmetric fault was 14.98 mm, with an average slip displacement of 9.28 mm. The maximum slip displacement of the symmetrical fault was 13.72 mm, with an average slip displacement of 9.34 mm. The Mw values of the induced earthquake of the asymmetric fault and the symmetrical fault were both 2.99. The induced slippage and earthquake of the symmetrical fault were almost the same as those of the asymmetric fault.
We thus obtained results for fault slips and induced earthquakes for the three categories of reservoir and six fluid injection–production patterns (as shown in Table 2).
First, we compared the outcomes of Fluid Pattern I with those of Pattern II. For both categories of reservoirs, the induced average slippage and earthquake of the asymmetric fault under Pattern II were greater than those under Pattern I. Taking the upper reservoir as an example, the average slip of Pattern I was only 4.40 mm and that of Pattern II was as high as 8.96 mm. This revealed that for the asymmetric fault, injecting fluid into the hanging wall reservoir was more dangerous than injecting fluid into the footwall reservoir. For the symmetrical fault, however, the opposite was the case. Taking the lower reservoir as an example, the average slip of Pattern I was 19.44 mm and that of Pattern II was only 7.92 mm. Therefore, for the symmetrical fault, injecting fluid into the footwall reservoir was more dangerous. Similarly, comparing the results for Fluid Pattern III with those for Pattern IV, we found that extracting fluid from the hanging wall reservoir was more dangerous when the fault was asymmetric. When the fault was symmetrical, extracting fluid from the hanging wall reservoir was more dangerous than extracting fluid from the footwall reservoir.
Then, we compared the results of induced slippage and earthquake for the symmetrical fault and the asymmetric fault for the two categories of reservoir. It was found that the induced slip of the asymmetric fault was smaller than that of the symmetrical fault for Fluid Patterns I, III, and V. For Fluid Patterns II, IV, and VI, however, the induced slip of the asymmetric fault was larger than that of the asymmetric fault. For the same fault, the fault slip results under different fluid patterns were significantly different. Furthermore, under the same fluid patterns, the slip results for the faults with different structures also varied. This tells us that fault stability is the result of various factors. When evaluating the stability of faults in subsurface fluid engineering, it is essential to consider the fault structure, fluid patterns, and their combined effects comprehensively.
Among all the average slip results, the maximum obtained for the asymmetric fault was 1085 mm. This was much larger than that obtained for the symmetrical fault (19.44 mm). Among all the results for the induced earthquake, there were five situations under which Mw was larger than 3.0. These situations were as follows: upper reservoir−Fluid Pattern VI−asymmetric fault; upper reservoir−Fluid Pattern I−symmetrical fault; upper reservoir−Fluid Pattern V−symmetrical fault; lower reservoir−Fluid Pattern I−symmetrical fault; lower reservoir−Fluid Pattern V−symmetrical fault. Among these situations, four concerned the symmetrical fault and only one concerned the asymmetric fault. It was thus revealed that in various subsurface fluid injection and extraction engineering projects, symmetrical faults may pose a greater risk than asymmetric faults. The reason in the cases considered here is that both the left and right damage zones of the symmetrical fault were highly permeable. In contrast, for the asymmetric fault, only the induced fracture zone in the hanging wall exhibited high permeability.

5. Conclusions

Faults are geological structures formed as a result of tectonic movements. Numerous asymmetric faults exist in the Earth’s crust. Despite this, current research on the risk assessment of induced earthquakes and the control of fault stability often describes fault zones as if they were symmetrical structures. In this paper, we concentrate on examining the impact of the structural symmetry of fault zones on fluid-induced slip and the potential for seismic activity. The results of the study can provide some useful references. The main conclusions were as follows:
(1)
The stability of a fault was the result of a variety of factors. For the same fault, the fault slip results under different fluid patterns were significantly different. Simultaneously, under the same fluid pattern, the slip results for faults with different structures also varied. When evaluating the stability of faults in subsurface fluid engineering, the fault structure, the fluid pattern, and their combined action must be considered comprehensively.
(2)
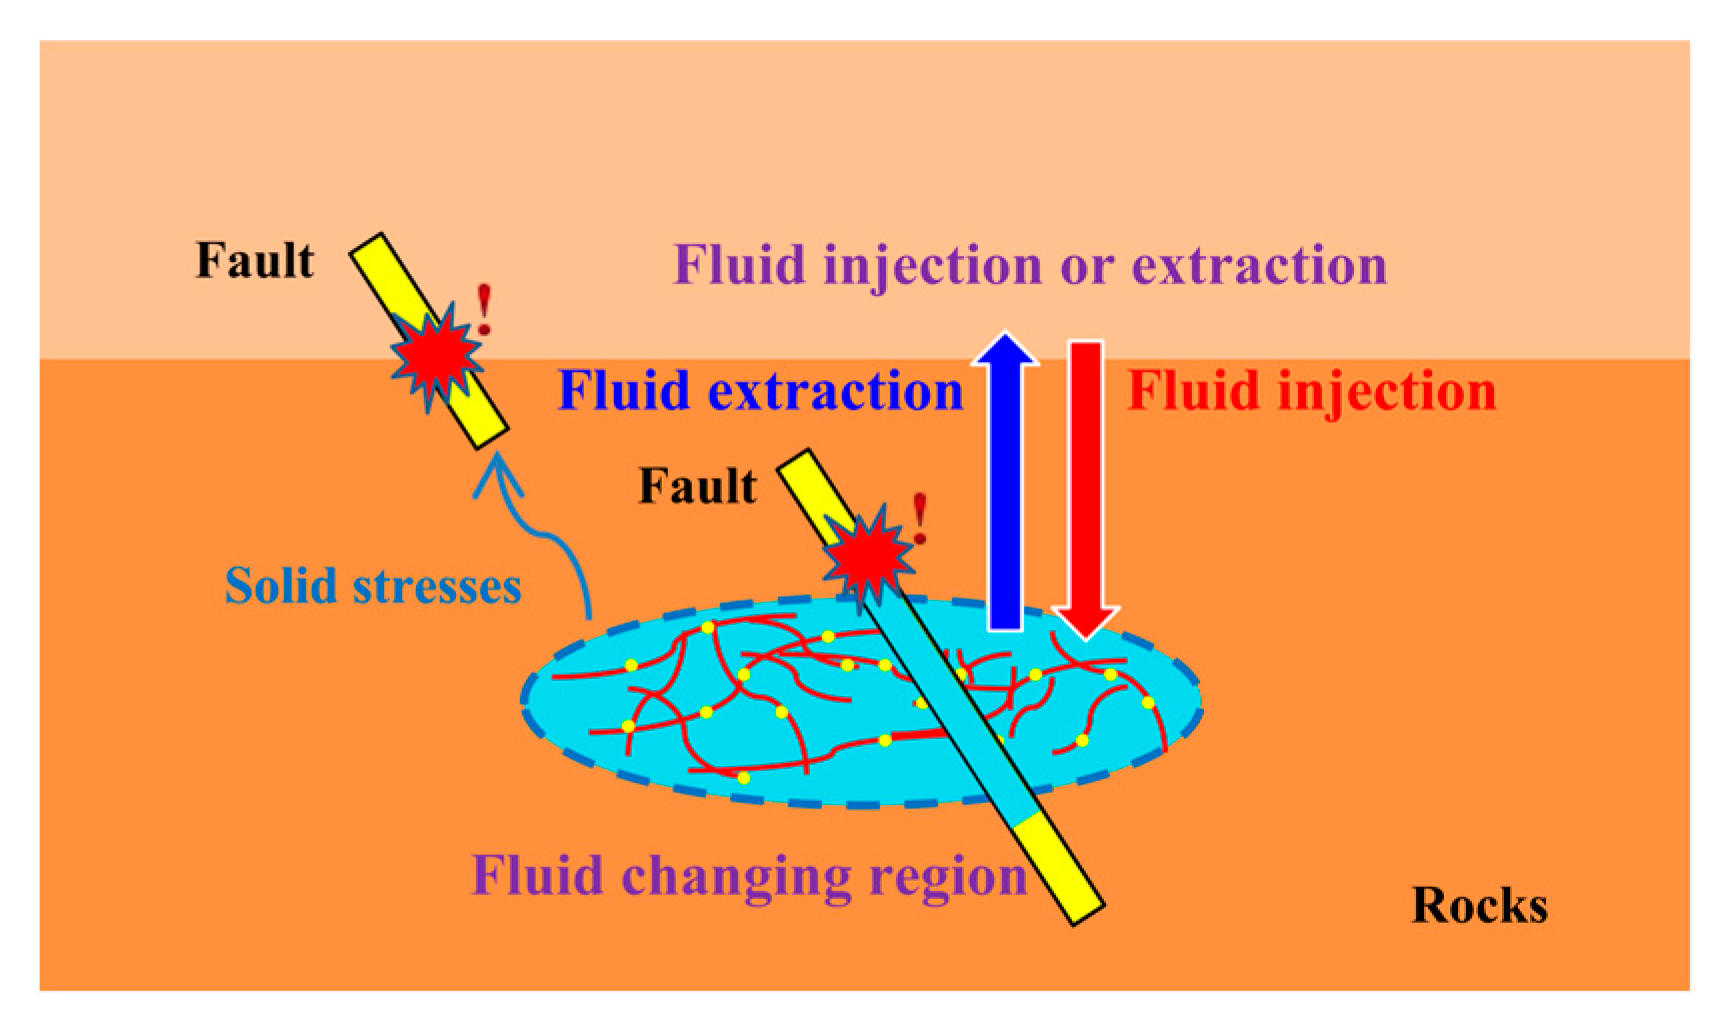
When fluids were injected into a subsurface reservoir, the primary cause of fault slippage was the reduction in shear strength due to a decrease in effective stress. When fluid was extracted from the reservoir, the main cause of fault sliding was often the increase in effective stress, which could lead to compressive deformation of the reservoir rock. When fluid was injected into the footwall reservoir, the asymmetric fault was more stable than the symmetrical fault. When fluid was injected into the hanging wall reservoir, in contrast, the symmetrical fault was more stable.
(3)
When the fault was asymmetric, it was more dangerous if fluid was injected into or extracted from the hanging wall reservoir than from the footwall reservoir. When the fault was symmetrical, injecting fluid into or extracting fluid from the footwall reservoir posed a greater danger.
(4)
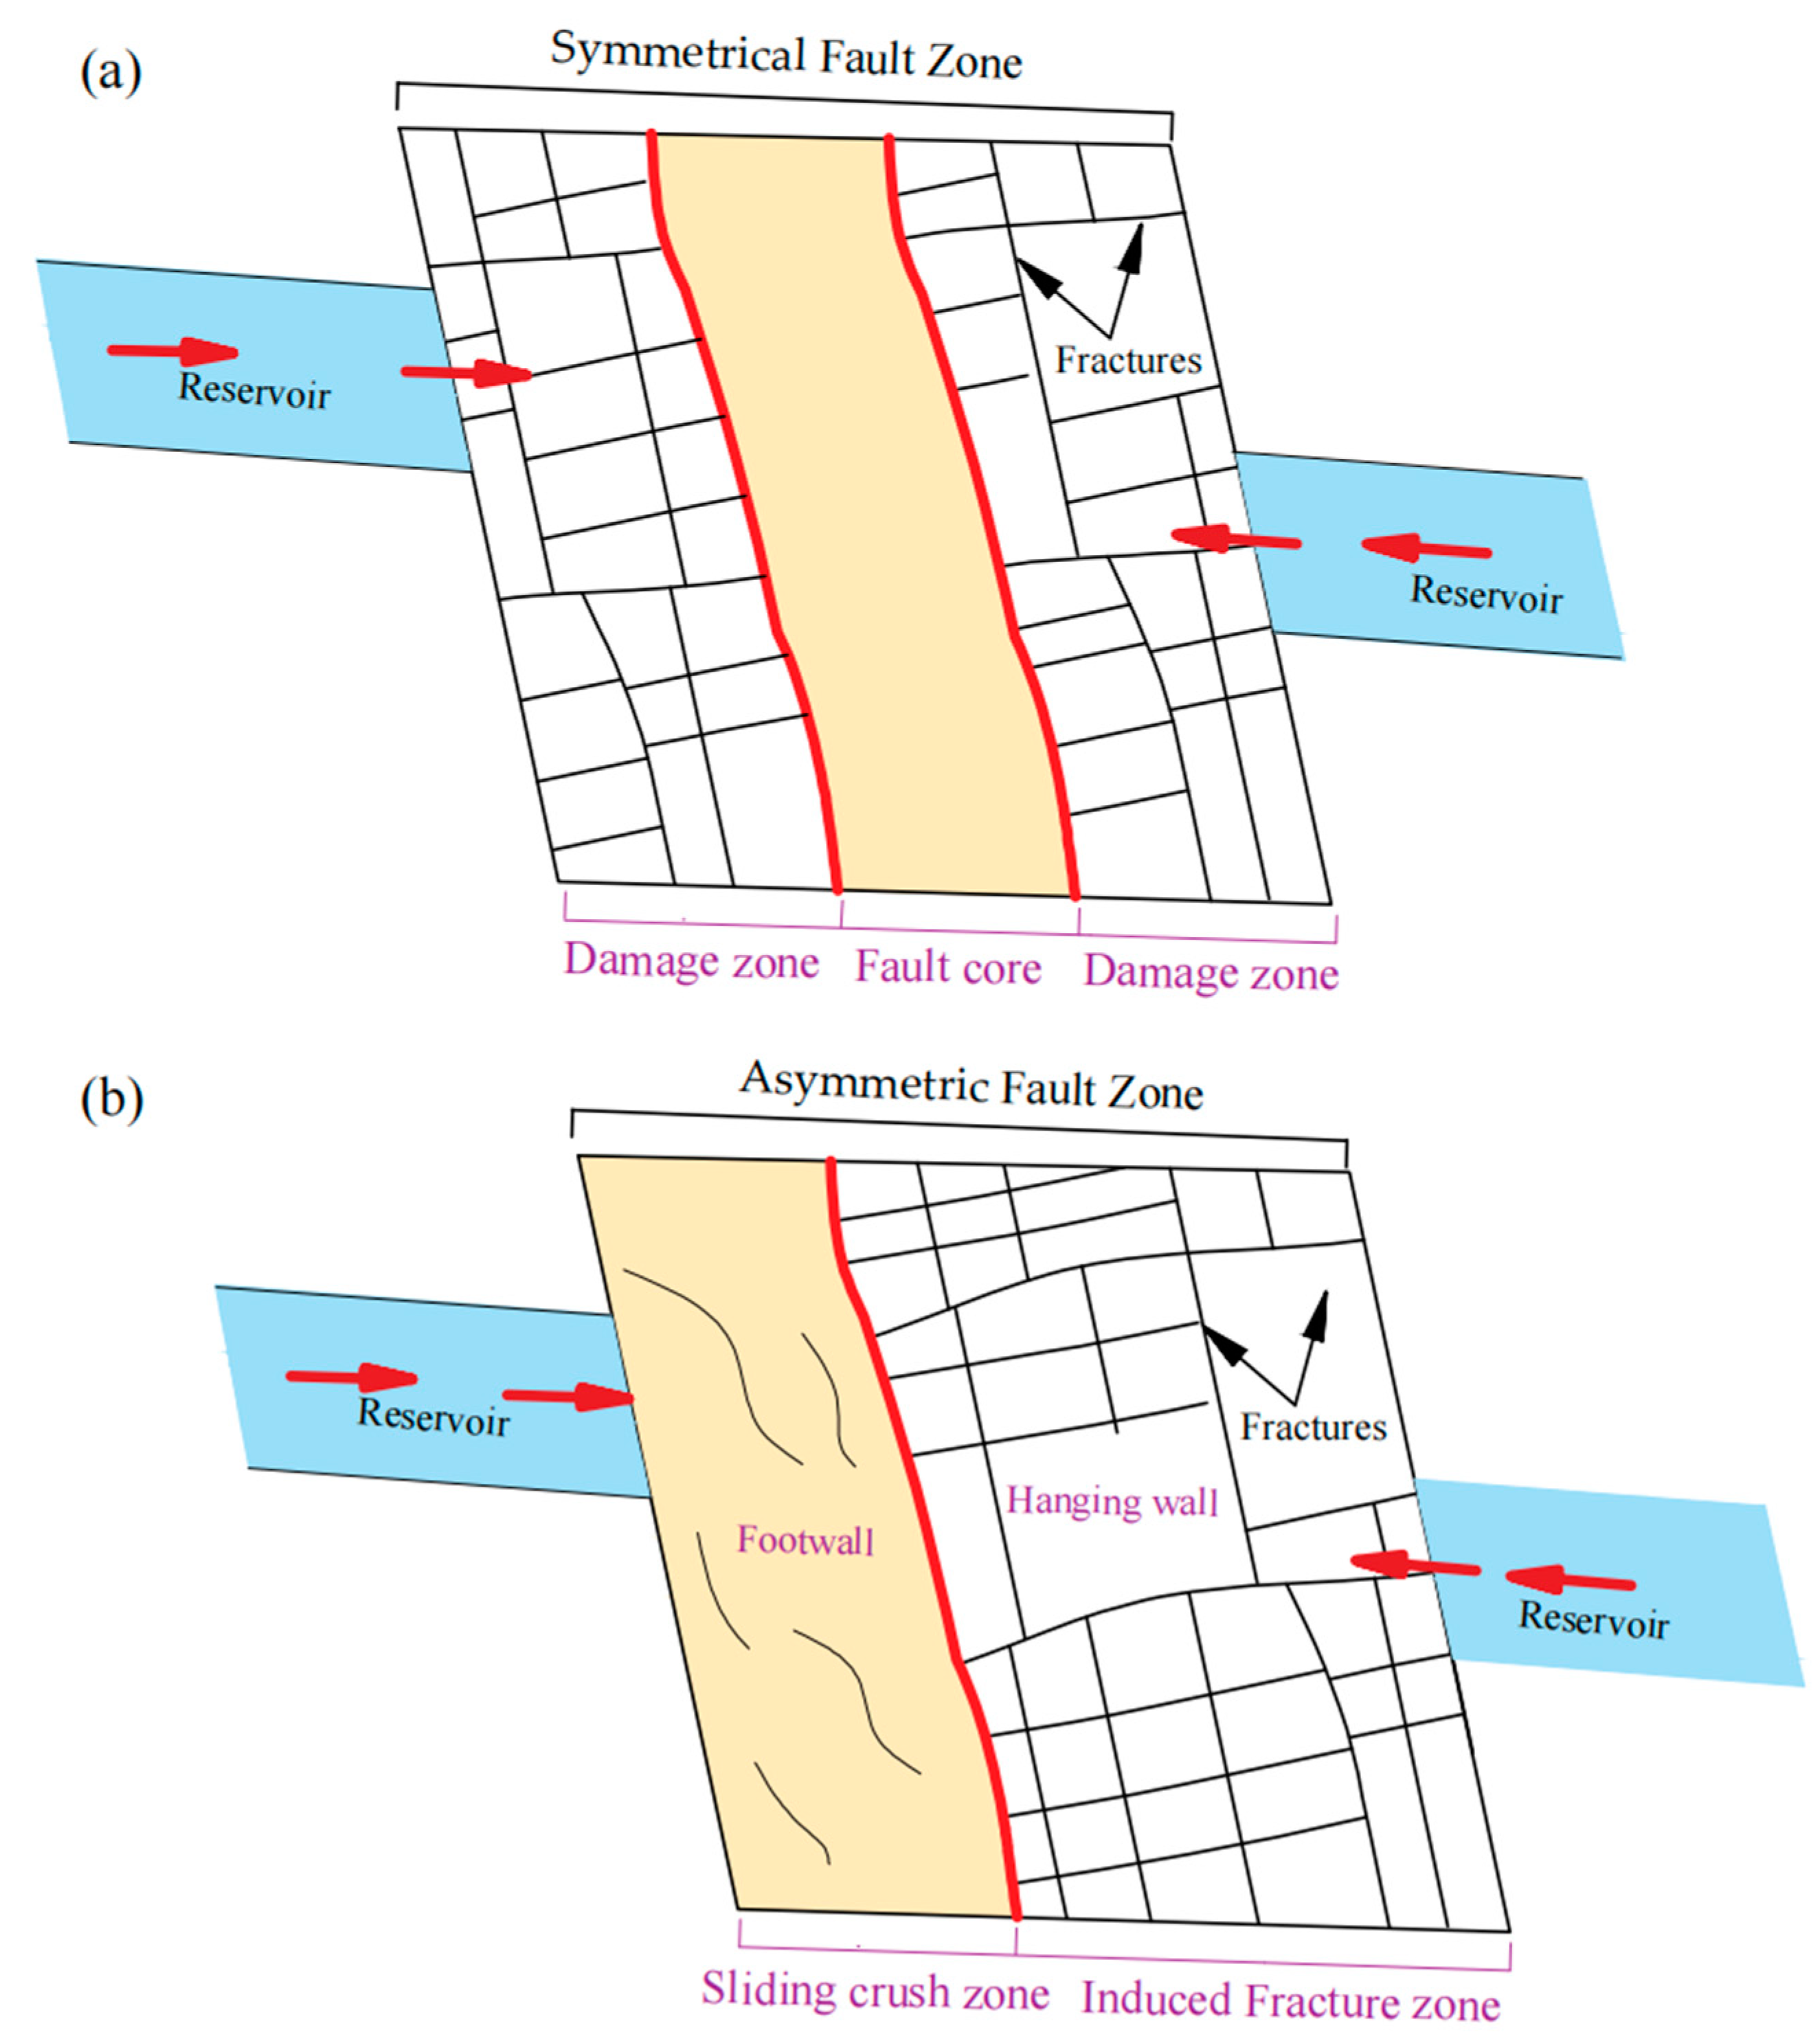
In numerous subsurface fluid injection and extraction projects, symmetrical faults are generally regarded as posing a higher risk compared to asymmetric faults. The reason is that symmetrical faults typically have high permeability in both the left and right damage zones. For asymmetric faults, however, only the induced fracture zone exhibits high permeability. Comprehensive investigation of the effect of fault zone symmetry on fault slips is essential for accurately assessing the risks associated with subsurface fluid injection and extraction.

Author Contributions

Conceptualization, Data curation, Formal analysis, Investigation, Methodology, Visualization, Writing—original draft, Funding acquisition: Z.N.; Software, Writing—review and editing: B.B. All authors have read and agreed to the published version of the manuscript.

Funding

This research work has been made possible thanks to financing from Key Projects of Natural Science Research in Colleges and Universities funded by Anhui Provincial Department of Education (no. KJ2021A1112), provincial quality engineering projects for institutions of higher education funded by Anhui Provincial Department of Education (no. 2022zygzts116), and the Civil Engineering Dual Capable Teaching Team funded by Suzhou University (no. 2023XJSN07).

Data Availability Statement

The original contributions presented in the study are included in the article; further inquiries can be directed to the corresponding author.

Conflicts of Interest

The authors declare no conflicts of interest.

References

  1. Ite, A.E.; Ibok, U.J.; Ite, M.U.; Petters, S.W. Petroleum Exploration and Production: Past and Present Environmental Issues in the Nigeria’s Niger Delta. Am. J. Environ. Prot. 2013, 1, 78–90. [Google Scholar] [CrossRef]
  2. Leather, D.T.B.; Bahadori, A.; Nwaoha, C.; Wood, D.A. Engineering, A review of Australia’s natural gas resources and their exploitation. J. Nat. Gas Sci. Eng. 2013, 10, 68–88. [Google Scholar] [CrossRef]
  3. Luo, X.; Wang, S.; Jing, Z.; Lv, M.; Wang, Z.; Zhai, Z.; Zhang, Y. A Review of Shale Gas Exploitation Technology. In Proceedings of the International Conference on Renewable Energy and Environmental Technology, Bali, Indonesia, 28 September 2014. [Google Scholar]
  4. Neelu, R.; Upadhyay, B.; Parida, A. New Approach to Evaluate and Predict the Reservoir Performance of a Two-Phase Flow Coalbed Methane Well with Fully Coupled Time-Dependent Desorption and Pressure-Dependent Diffusivity Effects. Energy Fuel 2022, 36, 5284–5306. [Google Scholar] [CrossRef]
  5. Huang, J.; Liao, Z.; Hu, Q.; Song, Z.; Wang, X. Fracture mechanism of tight sandstone under high and complex 3-D stress compression: Insights from acoustic emission. J. Pet. Sci. Eng. 2022, 208, 109635. [Google Scholar] [CrossRef]
  6. Yadav, K.; Sircar, A. Geothermal energy provinces in India: A renewable heritage. TIDEE TERI Inf. Dig. Energy Environ. 2022, 21, 175. [Google Scholar] [CrossRef]
  7. Grant, F.J. Groundwater, Deep Injection of Waste Water in the Western Canada Sedimentary Basin. Groundwater 2014, 53, 187–194. [Google Scholar]
  8. van der Zwaan, B.; Gerlagh, R. Economics of geological CO2 storage and leakage. Clim. Change 2009, 93, 285–309. [Google Scholar] [CrossRef]
  9. Wang, J.; Xie, H.P.; Kmatthai, S.; Hu, J.J.; Li, C.B. The role of natural fracture activation in hydraulic fracturing for deep unconventional geo-energy reservoir stimulation. Pet. Sci. 2023, 20, 2141–2164. [Google Scholar] [CrossRef]
  10. Thomas, S. Enhanced Oil Recovery—An Overview. Oil Gas Sci. Technol. Rev. L’ifp 2008, 63, 9–19. [Google Scholar] [CrossRef]
  11. Graham, R.A.; Cox, R.J.; Stadlwieser, J.A.; Stinn, R. Enhanced Oil Recovery by Gas Injection: Proposed Screening Criteria; The Petroleum Society: Richardson, TX, USA, 1996; pp. 96–119. [Google Scholar]
  12. Islam, M.R.; Chakma, A.; Jha, K.N. Engineering, Heavy oil recovery by inert gas injection with horizontal wells. J. Pet. Sci. Eng. 1994, 11, 213–226. [Google Scholar] [CrossRef]
  13. Bayer, P.; Rybach, L.; Blum, P.; Brauchler, R. Review on life cycle environmental effects of geothermal power generation. Renew. Sustain. Energy Rev. 2013, 26, 446–463. [Google Scholar] [CrossRef]
  14. Arman, A.; Christian, B. From hot rock to useful energy: A global estimate of enhanced geothermal systems potential. Appl. Energy 2020, 279, 115769. [Google Scholar]
  15. Feng, Z.; Zhao, Y.; Zhou, A.; Zhang, N. Development program of hot dry rock geothermal resource in the Yangbajing Basin of China. Renew. Energy 2012, 39, 490–495. [Google Scholar] [CrossRef]
  16. Li, Q.; Wei, Y.N.; Liu, G.; Shi, H. CO2-EWR: A cleaner solution for coal chemical industry in China. J. Clean. Prod. 2015, 103, 330–337. [Google Scholar] [CrossRef]
  17. Wei, N.; Liu, S.; Li, X. Evaluation on potential of CO2 enhanced water recovery deployment in China’s coal chemical industry. Clim. Change Res. 2021, 17, 70–78. [Google Scholar]
  18. Tong, L.; Wei, X.; Liu, X.; Liang, L.; Wang, X.; Chen, J.; Lei, H. A Criterion for a Hydraulic Fracture Crossing a Natural Fracture in Toughness Dominant Regime and Viscosity Dominant Regime. Eng. Fract. Mech. 2023, 289, 109421. [Google Scholar] [CrossRef]
  19. Jones, P.; Hillier, D.; Comfort, D. Fracking for Shale Gas: Planning Policy and Practice. Town Ctry. Plan. 2016, 85, 145–150. [Google Scholar]
  20. Wu, B.; Wei, X.; Wang, W.; Li, J.; Liu, T.; Wang, X. Effect of stress and material barriers on hydraulic fracture height containment in layered formations. Environ. Earth Sci. 2022, 81, 255. [Google Scholar] [CrossRef]
  21. Hough, S.E.; Page, M. A Century of Induced Earthquakes in Oklahoma? Bull. Seismol. Soc. Am. 2015, 105, 2863–2870. [Google Scholar] [CrossRef]
  22. Vlek, C. Induced earthquakes from long-term gas extraction in Groningen, the Netherlands: Statistical analysis and prognosis for acceptable-risk regulation. Risk Anal. 2018, 38, 1455–1473. [Google Scholar] [CrossRef]
  23. González, P.J.; Tiampo, K.F.; Palano, M.; Cannavó, F.; Fernández, J. The 2011 Lorca earthquake slip distribution controlled by groundwater crustal unloading. Nat. Geosci. 2012, 5, 821–825. [Google Scholar] [CrossRef]
  24. Fan, Z.; Eichhubl, P.; Gale, J.F.W. Geomechanical analysis of fluid injection and seismic fault slip for the Mw 4.8 Timpson, Texas, earthquake sequence. J. Geophys. Res. Solid Earth 2016, 121, 2798–2812. [Google Scholar] [CrossRef]
  25. Deichmann, N.; Giardini, D. Earthquakes Induced by the Stimulation of an Enhanced Geothermal System below Basel (Switzerland). Seismol. Res. Lett. 2009, 80, 784–798. [Google Scholar] [CrossRef]
  26. Ellsworth, W.L.; Giardini, D.; Townend, J.; Ge, S.; Shimamoto, T. Triggering of the Pohang, Korea, Earthquake (Mw 5.5) by Enhanced Geothermal System Stimulation. Seismol. Res. Lett. 2019, 5, 1844–1858. [Google Scholar] [CrossRef]
  27. Bao, X.; Eaton, D.W. Fault activation by hydraulic fracturing in western Canada. Science 2016, 354, 1406–1409. [Google Scholar] [CrossRef]
  28. Watts, D.R.; Hauser, E.C.; Mohshin, M.; Dominic, D.F. Induced seismicity risk management: The problem of disappearing faults. AAPG Bull. 2021, 105, 265–273. [Google Scholar] [CrossRef]
  29. White, J.A.; Foxall, W. A Phased Approach to Induced Seismicity Risk Management. Energy Procedia 2014, 63, 4841–4849. [Google Scholar] [CrossRef]
  30. Gaucher, E.; Schoenball, M.; Heidbach, O.; Zang, A.; Fokker, P.A.; van Wees, J.D.; Kohl, T. Induced seismicity in geothermal reservoirs: A review of forecasting approaches. Renew. Sustain. Energy Rev. 2015, 52, 1473–1490. [Google Scholar] [CrossRef]
  31. Goertz-Allmann, B.P.; Wiemer, S. Geomechanical modeling of induced seismicity source parameters and implications for seismic hazard assessment. Geophysics 2012, 78, KS25–KS39. [Google Scholar] [CrossRef]
  32. Wang, L.; Kwiatek, G.; Bohnhoff, M.; Rybacki, E.; Dresen, G. Injection-induced fault slip and associated seismicity in the lab: Insights from source mechanisms, local stress states and fault geometry. Earth Planet. Sci. Lett. 2024, 626, 118515. [Google Scholar] [CrossRef]
  33. Wang, L.; Kwiatek, G.; Rybacki, E.; Bonnelye, A.; Bohnhoff, M.; Dresen, G. Laboratory Study on Fluid-Induced Fault Slip Behavior: The Role of Fluid Pressurization Rate. Geophys. Res. Lett. 2020, 47, e2019GL086627. [Google Scholar] [CrossRef]
  34. Jia, Z.; Liu, S.; Cheng, S.; Zhao, X.; Zhang, G. Modeling of Complex Geological Body and Computation of Geomagnetic Anomaly. Math. Probl. Eng. 2020, 2020, 9839606. [Google Scholar] [CrossRef]
  35. Zhang, Q.; Zhang, X.-P.; Ji, P.-Q. Numerical study of interaction between a hydraulic fracture and a weak plane using the bonded-particle model based on moment tensors. Comput. Geotech. 2019, 105, 79–93. [Google Scholar] [CrossRef]
  36. Sainoki, A.; Schwartzkopff, A.K.; Jiang, L.; Mitri, H.S. Numerical Modeling of Complex Stress State in a Fault Damage Zone and Its Implication on Near-Fault Seismic Activity. J. Geophys. Res. Solid Earth 2021, 126, e2021JB021784. [Google Scholar] [CrossRef]
  37. Foley, L.; Daltaban, T.S.; Wang, J.T. Numerical simulation of fluid flow in complex faulted regions. Geol. Soc. Lond. Spec. Publ. 1998, 127, 121–132. [Google Scholar] [CrossRef]
  38. Chen, S.; Ding, B.; Gong, L.; Huang, Z.; Yu, B.; Sun, S. Comparison of multi-field coupling numerical simulation in hot dry rock thermal exploitation of enhanced geothermal systems. Adv. Geo-Energy Res. 2019, 3, 396–409. [Google Scholar] [CrossRef]
  39. Gan, Q.; Elsworth, D. Thermal drawdown and late-stage seismic-slip fault reactivation in enhanced geothermal reservoirs. J. Geophys. Res. Solid Earth 2014, 119, 8936–8949. [Google Scholar] [CrossRef]
  40. Yoon, S.; Lee, H.; Kim, J. The modeling of fault activation, slip, and induced seismicity for geological CO2 storage at a pilot-scale site in the Janggi Basin, South Korea. Int. J. Rock Mech. Min. Sci. 2023, 170, 105441. [Google Scholar] [CrossRef]
  41. Yoon, J.S.; Zang, A.; Stephansson, O.; Zimmermann, G. Modelling of Fluid-injection-induced Fault Reactivation Using a 2D Discrete Element Based Hydro-mechanical Coupled Dynamic Simulator. Energy Procedia 2016, 97, 454–461. [Google Scholar] [CrossRef]
  42. Treffeisen, T.; Henk, A. How pore pressure changes affect stress and strain in fault zones with complex internal structure—Insights from hydromechanical modelling. J. Struct. Geol. 2023, 170, 104847. [Google Scholar] [CrossRef]
  43. Li, C.; Xu, Z. Numerical Modeling and Investigation of Fault-Induced Water Inrush Hazard under Different Mining Advancing Directions. Mathematics 2022, 10, 1561. [Google Scholar] [CrossRef]
  44. Park, J.-W.; Guglielmi, Y.; Graupner, B.; Rutqvist, J.; Park, E.-S. Numerical modelling of Fault Reactivation Experiment at Mont Terri Underground Research Laboratory in Switzerland: DECOVALEX-2019 TASK B (Step 2). Tunn. Undergr. Space 2019, 29, 197–213. [Google Scholar]
  45. Chang, K.W.; Yoon, H.; Kim, Y.; Lee, M.Y. Operational and geological controls of coupled poroelastic stressing and pore-pressure accumulation along faults: Induced earthquakes in Pohang, South Korea. Sci. Rep. 2020, 10, 2073. [Google Scholar] [CrossRef]
  46. Flodin, E.; Aydin, A. Faults with asymmetric damage zones in sandstone, Valley of Fire State Park, southern Nevada. J. Struct. Geol. 2004, 26, 983–988. [Google Scholar] [CrossRef]
  47. Brogi, A. Fault zone architecture and permeability features in siliceous sedimentary rocks: Insights from the Rapolano geothermal area (Northern Apennines, Italy). J. Struct. Geol. 2008, 30, 237–256. [Google Scholar] [CrossRef]
  48. Berg, S.S.; Skar, T. Controls on damage zone asymmetry of a normal fault zone: Outcrop analyses of a segment of the Moab fault, SE Utah. J. Struct. Geol. 2005, 27, 1803–1822. [Google Scholar] [CrossRef]
  49. Ben-Zion, Y.; Sammis, C.G. Characterization of Fault Zones. Pure Appl. Geophys. 2003, 160, 677–715. [Google Scholar] [CrossRef]
  50. Wang, L.; Kwiatek, G.; Renard, F.; Guérin-Marthe, S.; Rybacki, E.; Bohnhoff, M.; Naumann, M.; Dresen, G. Fault roughness controls injection-induced seismicity. Proc. Natl. Acad. Sci. USA 2024, 121, e2310039121. [Google Scholar] [CrossRef]
  51. Wu, Z.; Chen, W.; Xue, Y.; Song, G.; Liu, H. Structural Characteristics of Faulting Zone and Its Ability in Transporting and Sealing Oil and Gas. Acta Geol. Sin. 2010, 84, 570–578. [Google Scholar]
  52. Egholm, D.L.; Clausen, O.R.; Sandiford, M.; Kristensen, M.B.; Korstgård, J.A. The mechanics of clay smearing along faults. Geology 2008, 36, 787–790. [Google Scholar] [CrossRef]
  53. Xiao-Fei, F.U.; Xue, G.; Li-Xu, Z.; Yan-Fang, L.V. Formation and evolution of clay smear and hydrocarbon migration and sealing. J. China Univ. Min. 2012, 41, 52–63. [Google Scholar]
  54. Allan, U.S. Model for hydrocarbon migration and entrapment within faulted structures. AAPG Bull. 1989, 73, 803–811. [Google Scholar]
  55. Hibbitt, Karlsson & Sorensen. ABAQUS Theory Manual, Version 6.2; Hibbitt, Karlsson & Sorensen: Providence, RI, USA, 2001. [Google Scholar]
  56. Zhou, X.; Burbey, T.J. Deformation characteristics of a clayey interbed during fluid injection. Eng. Geol. 2014, 183, 185–192. [Google Scholar] [CrossRef]
  57. Biot, M.A. General Theory of Three-Dimensional Consolidation. J. Appl. Phys. 1941, 12, 155–164. [Google Scholar] [CrossRef]
  58. Rice, J.R.; Cleary, M.P. Some basic stress diffusion solutions for fluid-saturated elastic porous media with compressible constituents. Rev. Geophys. Space Phys. 1976, 14, 227–241. [Google Scholar] [CrossRef]
  59. Aki, K. Scaling Law of Seismic Spectrum. J. Geophys. Res. Atmos. 1967, 72, 1217–1231. [Google Scholar] [CrossRef]
  60. Hanks, T.C.; Kanamori, H. A moment magnitude scale. J. Geophys. Res. 1979, 84, 2348. [Google Scholar] [CrossRef]
  61. Mazzoldi, A.; Rinaldi, A.P.; Borgia, A.; Rutqvist, J. Induced seismicity within geological carbon sequestration projects: Maximum earthquake magnitude and leakage potential from undetected faults. Int. J. Greenh. Gas Control. 2012, 10, 434–442. [Google Scholar] [CrossRef]
  62. Rinaldi, A.P.; Rutqvist, J. Modeling of deep fracture zone opening and transient ground surface uplift at KB-502 CO2 injection well, in Salah, Algeria. Int. J. Greenh. Gas Control. 2013, 12, 155–167. [Google Scholar] [CrossRef]
  63. Guo, M.; Ji, C.; Liu, Z.; Zhang, P. Artificial hydraulic fracture propagation law of hot dry rock reservoir in Gonghe Basin, Qinghai province. J. Xi’an Univ. Sci. Technol. 2023, 43, 514–522. [Google Scholar]
Figure 1. Schematic diagram of fluid-induced earthquakes.
Water 16 01118 g001
Figure 2. Structure of the symmetrical fault (a) and the asymmetric fault (b).
Water 16 01118 g002
Figure 3. Contacting bodies and the trajectory of node S1 in finite-sliding contact.
Water 16 01118 g003
Figure 4. Slide line segment.
Water 16 01118 g004
Figure 5. Basic model.
Water 16 01118 g005
Figure 6. Reservoir categories.
Water 16 01118 g006
Figure 7. Diagram of the six different injection and extraction patterns.
Water 16 01118 g007
Figure 8. The induced fault slip displacement of the upper reservoir−Fluid Pattern I.
Water 16 01118 g008
Figure 9. The pore−pressure distribution of the symmetrical fault (a) and the asymmetric fault (b) under Fluid Pattern I.
Water 16 01118 g009
Figure 10. The shear stress distribution of the symmetrical fault (a) and the asymmetric fault (b) under Fluid Pattern I.
Water 16 01118 g010
Figure 11. The shear stress along the fault plane of the symmetrical fault (a) and the asymmetric fault (b) under Fluid Pattern I.
Water 16 01118 g011
Figure 12. The induced fault slip displacement of the upper reservoir−Fluid Pattern II.
Water 16 01118 g012
Figure 13. The pore-pressure distribution of the symmetrical fault (a) and the asymmetric fault (b) under Fluid Pattern II.
Water 16 01118 g013
Figure 14. The induced fault slip displacement of the upper reservoir−Fluid Pattern III.
Water 16 01118 g014
Figure 15. The vertical displacement distribution of the symmetrical fault (a) and the asymmetric fault (b) under the upper reservoir−Fluid Pattern III.
Water 16 01118 g015
Figure 16. The induced fault slip displacement of the upper reservoir−Fluid Pattern IV.
Water 16 01118 g016
Figure 17. The induced fault slip displacement of the upper reservoir−Fluid Pattern V.
Water 16 01118 g017
Figure 18. The induced fault slip displacement of the upper reservoir−Fluid Pattern VI.
Water 16 01118 g018
Figure 19. The induced fault slip displacements of the lower reservoir under the six fluid patterns: Pattern I (a), Pattern II (b), Pattern III (c), Pattern IV (d), Pattern V (e), and Pattern VI (f).
Water 16 01118 g019
Table 1. Physical parameters of the rock mass.
PropertyDensity
(kg/m3)
Young’s Modulus
(GPa)
Poisson’s Ratio
(-)
Porosity
(-)
Permeability (m/s)
Overburden2600200.370.011 × 10−16
Reservoir2200250.300.21 × 10−7
Underburden2600300.330.361 × 10−16
Fault core2500100.30.051 × 10−15
Damage zone2000100.30.21 × 10−7
Sliding crush zone2500100.30.051 × 10−15
Induced fracture zone2000100.30.21 × 10−7
Table 2. Induced slip of asymmetric and symmetrical faults under different fluid patterns and reservoir categories.
Reservoir
Category
Fluid PatternAsymmetric FaultSymmetrical Fault
Average Slip
(mm)
Induced Earthquake (Mw)Average Slip (mm)Induced Earthquake (Mw)
Upper
reservoir
I4.402.7716.473.15
II8.962.987.852.94
III4.082.755.182.82
IV5.972.865.072.81
V6.842.9013.833.10
VI10.853.036.462.88
Lower
reservoir
I2.032.5519.443.20
II9.402.997.922.94
III1.592.479.352.99
IV5.222.824.282.76
V5.252.8211.353.04
VI9.282.999.342.99
Disclaimer/Publisher’s Note: The statements, opinions and data contained in all publications are solely those of the individual author(s) and contributor(s) and not of MDPI and/or the editor(s). MDPI and/or the editor(s) disclaim responsibility for any injury to people or property resulting from any ideas, methods, instructions or products referred to in the content.

