Article

Assessing the Water Footprints (WFPs) of Agricultural Products across Arid Regions: Insights and Implications for Sustainable Farming

by
Saeed Sharafi
1,*,
Mohammad Javad Nahvinia
2 and
Fatemeh Salehi
1
1
Department of Environment Science and Engineering, Arak University, Arak 38156879, Iran
2
Department of Water Science and Engineering, Arak University, Arak 38156879, Iran
*
Author to whom correspondence should be addressed.
Water 2024, 16(9), 1311; https://doi.org/10.3390/w16091311
Submission received: 26 September 2023 / Revised: 31 October 2023 / Accepted: 1 November 2023 / Published: 6 May 2024

Abstract

:
Water resource management has emerged as a pivotal concern within arid regions in recent times. The water footprint (WFP) index stands out as a principal gauge for facilitating comprehensive watershed management. This study endeavors to compute the WFP of diverse agricultural products encompassing major crops, orchards, cucurbits, and medicinal plants across arid regions. This research focuses on three distinct climate scenarios: the Shazand Plain with a semidry climate, the Khomein Plain characterized by a dry climate, and the Saveh Plain exhibiting a very dry climate. This study also seeks to ascertain the climate most conducive to cultivating crops from a WFP (green, blue, and gray) perspective. To achieve these objectives, this study employed the CropWat family software to determine crop water requirements, as well as considering crop yield and relevant parameters for calculations. The findings of the investigation unveiled that the cultivated areas in the respective climates amounted to 19,479 ha (semidry), 18,166 ha (dry), and 41,682 ha (very dry). These areas were allocated as follows: 88%, 85%, and 55% for crops; 11%, 13%, and 40% for orchards; and 1%, 2%, and 5% for cucurbit crops. Importantly, the very dry climate was predisposed to allocating more land for low-water-demand orchards. Among the major crops, wheat occupied 44%, 39%, and 43% of the total areas in the semidry, dry, and very dry climates, respectively. Analyzing the overall agricultural output in these climates, it was revealed that over 79%, 69%, and 66% of production correlated with crops; 17%, 19%, and 22% with orchards; and 4%, 12%, and 12% with cucurbits, respectively. In terms of water consumption, maize and apples emerged as the highest performers, with varying consumption patterns across different crops. Interestingly, canola exhibited a substantially higher WFP, surpassing wheat and barley by 56.48% and 58.85%, respectively, in dry climates. Cucurbit crops, on the other hand, displayed a lower WFP in dry climates, which could potentially encourage their cultivation. The influence of climate warming on canola’s WFPgray introduced complexity, challenging the conventional correlation between WFP and yields. Medicinal plants consistently demonstrated lower WFP values, underscoring the need for deliberate and considerate cultivation decisions in this regard.

1. Introduction

An ample water supply is essential for cultivating crops to achieve higher yield potential on agricultural land. This underscores the existence of two potential issues. Firstly, future crops are likely to demand more water due to rising temperatures, which exponentially amplify atmospheric drying. Secondly, increased production potential translates to higher yields only when there is an adequate water supply [1]. A clear and ample water supply is indispensable for sustainable human development and health. However, uncertainties stemming from future climate change have heightened concerns regarding already strained freshwater resources [2,3]. Driven by population growth, economic progress, and changing consumption patterns, the global demand for water resources is escalating by 1% annually [4,5,6]. Agriculture alone consumes over 70% of the global freshwater withdrawal [7]. Climate change and rapid population growth are diminishing agricultural water resources across various regions worldwide, particularly in semidry and dry climates [8,9]. Water security and food security are intricately linked to irrigated agriculture [10]. In pursuit of water conservation and sustainable water management within irrigated agriculture, numerous experiments have been conducted to enhance water utilization and crop yield efficiency [8].
There are several indicators for assessing water and food sustainability, such as the water footprint (WFP), water scarcity, and crop water productivity [11]. The WFP measures both direct and indirect water use, serving as a metric to determine how much freshwater a product consumes throughout its life cycle. Its components encompass green water, blue water, and gray water [11]. WFPgreen pertains to rainwater absorbed by plants, not runoff. WFPblue represent water withdrawals from rivers, reservoirs, and groundwater, while WFPgray signifies freshwater resources used to maintain water quality against standard pollutants. Extensive studies on the WFP in agriculture have been conducted across various crops and regions [12]. These studies predominantly target reducing average global freshwater consumption [13]. In cases where water consumption intensifies in inadequately irrigated agriculture, strategic resource redistribution can curtail wastage and boost yields by up to 30% [1,14,15]. Therefore, mitigating water consumption in this economic sector emerges as a pivotal strategy in countering water scarcity [16,17].
The volume of virtual water involved in food production is substantial, and understanding the virtual water content in individual diets or within broader community contexts can inform water management [18,19]. A more comprehensive concept of virtual water is needed to gauge water consumption throughout the production cycle. This gave rise to the WFP concept, which is closely intertwined with virtual water but encompasses a more holistic perspective [12,20,21]. The WFP serves as a multidimensional indicator of freshwater use, encompassing not just direct consumer or producer water consumption but also accounting for indirect water usage [22].
Since its inception in 2002, the WFP index has sparked numerous studies evaluating its applicability across various domains. Initially, research focused on estimating all three WFP components on a global scale, but as water resource management gained prominence on smaller scales, local assessments of the index gained significance [13]. In a case study, Hess et al. [23] investigated water scarcity data locally and globally to assess the WFP of potato cultivation in England. Their findings indicated an average water consumption of 61 million cubic meters solely for potato production in England. Utilizing water scarcity maps, they pinpointed the east of England as unsuitable for such production. Deng et al. [24] divided Chinese provinces into eight regions and studied the WFP of agricultural products alongside other commodities. Their calculations revealed that agriculture predominantly contributed to the WFP in most regions. They advocated measures like improving water consumption efficiency and altering export patterns to control and diminish a substantial portion of the WFP. Ababaei and Etedali [25] assessed the WFP for major cereals (wheat, barley, and maize) in Iran. Their study unveiled that WFPgreen usage for wheat and barley production in Iran exceeded WFPblue usage by 2.3 and 1.9 times, respectively.
In a study by Zhuo and Hoekstra [26], diverse agricultural management practices were evaluated across categories such as irrigation efficiency, water use efficiency (WUE), and WFPblue and WFPgreen for winter wheat crops. The results highlighted that low irrigation treatment had the most significant impact on increasing irrigation water consumption efficiency, leading to a 5% rise in irrigation efficiency and a 38% drop in irrigation WFP. Nonetheless, product performance decreased by 9%. Behmanesh [27] assessed WFPgreen and WFPblue usage in semidry climates for major crops like wheat, sugar beet, tomato, alfalfa, and maize. The findings indicated an average annual water consumption of 3547 m3 ton−1 for these products, with the WFPgreen constituting approximately 83% and irrigated water making up the remaining 17%.
This study’s outcomes not only provide insights into crop-specific water requirements, but also underscore the significance of tailored water management strategies for individual crops. Additionally, the importance of sustainable agricultural practices emerges as a critical factor in ensuring resilient and adaptable agricultural systems amidst evolving climatic conditions. This holds true in arid regions, as illustrated in the case study of the Shazand Plain (semidry climate), the Saveh Plain (very dry climate), and the Khomein Plain (dry climate). This study’s findings offer applied guidance for addressing water management policies to bolster agricultural systems across major crops (wheat, barley, canola, bean, alfalfa, maize, and potato), orchards (almond, walnut, grape, cherry, peach, apple, pistachio, pomegranate, and apricot), cucurbits (cucumber, melon, and watermelon), and medicinal plants (saffron, lemon balm, thyme, safflower, anise, echium, mint, yarrow, marjoram, chicory, lavender, chamomile, peppermint, sage, and rose).

2. Materials and Methods

2.1. Study Area and Datasets

Table 1 provides descriptions of three distinct plains: Shazand, Khomein, and Saveh (in the center of Iran), encompassing their geographical, climatic, and hydrological characteristics. Long-term meteorological data spanning from 1991 to 2021 for these three plains—Shazand, Khomein, and Saveh—were sourced from the National Meteorological Organization (NMO). Utilizing the Ivanov–Köppen classification, the Shazand Plain is located within a semidry climate zone. Its topography, consisting of mountains, results in warm summers and cold winters. Notably, Shazand stands as one of the coldest regions in Markazi Province, experiencing a maximum temperature (Tmax) of 19.4 °C, a minimum temperature (Tmin) of 4.71 °C, and an average daily precipitation (P) of 8.24 mm. Based on various indicators, it is apparent that the hydrological conditions of the Shazand and Khomein plains are quite similar (both classified as forbidden plains), whereas the Saveh Plain (classified as a critical forbidden plain) exhibits distinct climate characteristics.
All three plains—Shazand, Khomein, and Saveh—are grappling with decreasing reservoir levels at rates of 2.9, 61.7, and 8.2 Mm3 y−1, respectively. These discrepancies contribute to their individual water resource challenges, predominantly stemming from excessive groundwater extraction for agricultural purposes. The geographical positions of these plains are visually depicted in Figure 1. Analyzing Table 1 reveals that Shazand sits at a relatively higher elevation of 1913 meters above sea level. Consequently, this plain exhibits lower average Tmax and solar radiation (Srad) indices. Consequently, the average weekly reference evapotranspiration (ETref) values are also lower. In contrast, both the Khomein and Saveh plains record a higher Tmax of 1.2 and 4.63 °C, respectively. Additionally, these two plains receive more significant Srad indices compared to the Shazand Plain. This leads to higher reported ETref values for the Khomein and Saveh plains, with increases of 2.35 and 5.59 mm w−1, respectively, in comparison to the Shazand Plain.
This study focused on the assessment of major crops, including wheat, barley, canola, bean, alfalfa, maize, and potato, across the studied plains. Furthermore, it encompassed the examination of significant orchard plants such as almond, walnut, grape, cherry, peach, apple, pistachio, pomegranate, and apricot. Additionally, the investigation delved into major cucurbit crops, namely cucumber, melon, and watermelon, as well as major medicinal plants, including saffron, lemon balm, thyme, safflower, anise, echium, mint, yarrow, marjoram, chicory, lavender, chamomile, peppermint, sage, and rose (with the cultivated area of major medicinal plants being less than 5 ha). Data gathering was performed for every aspect of cultivation, area measurement using a global positioning system (GPS), crop yield determination, and crop production recording. The investigation encompassed the evaluation of 2972 farms within the Shazand Plain (characterized by a semidry climate), 1859 farms within the Khomein Plain (characterized by a dry climate), and 5053 farms within the Saveh Plain (characterized by a very dry climate) (Figure 1).
Top of Form

2.2. WFP Calculations

The WFPblue, WFPgreen, and WFPgray of different products were calculated using the models presented by Chapagain et al. [28] and Hoekstra and Chapagain [12]. In these instructions, the WFP is considered as an indicator in which the allocation of water for human consumption is considered and ecosystem consumption is not considered. Effective water requirements and P were obtained using NETWAT software provided by the Meteorological Organization. This model is a native version of the CROPWAT model in which crop evapotranspiration (ETc) is taken from the USDA-SCS model based on the Penman–Monteith equation and the amount of effective precipitation (EP). In calculating the WFP, it is assumed that irrigation took place when 50% of the water was out of reach of the crop and the moisture in the root rhizosphere reached the amount of field capacity. The WFP of all products consists of three components: WFPblue, WFPgreen, and WFPgray defined as in Equation (1):
W F P t = W F P g r e e n + W F P b l u e + W F P g r a y
Each component of the crop’s WFP is expressed in cubic meters per kilogram (m3 kg−1).

2.2.1. WFPgreen

Water consumption in this period is examined according to the calculation of ETc during the growing period, which is finally expressed numerically in m3 kg−1. The WFPgreen of the crop is calculated using Equation (2):
W F P g r e e n = C W U g r e e n Y
where CWUgreen is the amount of water used to trace the green water of the crop in each climate (m3 kg−1) and Y is the yield of the crop (kg ha−1). The amount of WFPgreen of the crop is determined based on Equation (3):
C W U g r e e n = 10 × d = 1 T E T g r e e n
where the coefficient of 10 converts ETref from millimeters (height) to the volume of water per unit area (m3 kg−1). In this regard, T is the duration of crop growth during the growth period d (days). ETgreen also indicates green water evapotranspiration. Another assumption in this calculation is that only when the green water in the soil is not enough for the crop to use does the crop use the available water. Therefore, ETgreen is obtained from the method presented by Hoekstra and Chapagain [12] (Equation (4)):
E T g r e e n = min ( E T C + P E )
where ETc is the amount of evapotranspiration of the crop and PE is also the amount of EP. The crop’s water requirement is affected by rainfall, temperature, air pressure, wind speed, crop type, soil conditions, and planting time.

2.2.2. WFPblue

WFPblue (Equations (5)–(7)) is calculated almost exactly like WFPgreen, except that ETblue is calculated as in Equation (7):
W F P b l u e = C W U b l u e Y
C W U b l u e = 10 × d = 1 T E T b l u e
E T b l u e = max ( 0 , E T C + P E )
where CWUblue (Equation (6)) is the amount of irrigated WFP in each climate (m3 ha−1) and Y is the yield (kg ha−1).

2.2.3. WFPgray

In this study, the WFPgray was also examined. For this purpose, only the use of N fertilizer as a source of pollution was studied. Information on the average application of N fertilizer (NAR; kg ha−1) was obtained through face-to-face interviews with farmers. The calculation method is based on the model presented by Chapagain et al. [28] and Hoekstra and Chapagain [12]. The US Environmental Protection Agency (USEPA) recommends a maximum allowable concentration of N in surface and groundwater sources of 10 mg l−1, according to a study by Chapagain et al. [28]. This standard was adopted when water from agricultural activities was recycled and used in urban regions after being transferred to its sources. Therefore, it was necessary to keep the concentration of this factor below one threshold. Since no information was available on the natural concentration of N in the water and the environment, its value was considered zero in this study. As explained, the relation used to calculate the WFPgray is given as in Equation (8):
W F P g r a y = α I r r × N A R I r r C max C n a t × 1 Y I r r
where α is considered as a specific coefficient, given in Table 2. NARIrr is the application rate of N fertilizer (kg ha−1), Cmax is the maximum acceptable N (mg l−1), Cnat is the normal concentration of N (assumed to be 0), and YIrr is the crop yield in irrigated cultivation (kg ha−1).

3. Results and Discussion

3.1. Agricultural Situation

This study examines agricultural characteristics in semidry, dry, and very dry climates, with a focus on harvested areas, production values, and crop yields (Table 3). Recent research identifies these regions as restricted plains due to specific agricultural challenges, necessitating a reduction in cultivation area as a crucial part of long-term management strategies. Despite this, unauthorized well construction has increased due to livelihood challenges. The findings reveal that in semidry, dry, and very dry climates, harvested areas encompassed 19,479 ha, 18,166 ha, and 41,682 ha, respectively. Of these, 88%, 85%, and 55% were allocated to crops; 11%, 13%, and 40% to orchards; and only 1%, 2%, and 5% to cucurbit crops like cucumbers, melons, and watermelons. Notably, in very dry climates, a significant portion of land was dedicated to low-water orchard crops such as pistachio and pomegranate, primarily utilizing surface water for conservation. Conversely, challenging conditions like mountainous terrain and low Tmin during the growing season make orchard crop cultivation, like pistachio and pomegranate, more difficult in semidry and dry climates, emphasizing major crop cultivation.
Unfortunately, inadequate management practices over recent decades have resulted in the neglect of orchards crops like walnut, almond, and grape. Many orchards have even been converted to crop cultivation. Notably, in these climates, 44%, 39%, and 43% of cultivation areas are dedicated to wheat, a strategically vital crop for the nation. When considering agricultural production in semidry (110,627 tons), dry (111,097 tons), and very dry (326,706 tons) climates, over 79%, 69%, and 66% correspond to crops; 17%, 19%, and 22% to orchard crops; and a mere 4%, 12%, and 12% to cucurbit crops, respectively. Wheat emerges as the most significant contributor among crops, while grapes dominate orchard crop production in semidry and dry climates, and pomegranates excel in very dry climates. Across all three climates, maize and apples consistently exhibit the highest yields among both crops and orchards (Table 3).
These findings support the classification of enclosed plains in semidry, dry, and very dry climates as restricted areas, necessitating a deliberate reduction in cultivation area as part of long-term management strategies [30]. This approach aligns with the principles of sustainable land management, aiming to prevent degradation and preserve resources in arid and semiarid regions [31,32]. It also addresses the challenge of unauthorized well construction, which is a response to water scarcity challenges in these climates. In very dry climates, the emphasis on cultivating water-efficient orchard crops using surface water aligns with the concept of selecting crops adapted to local water availability, optimizing water utilization in arid settings. Furthermore, the influence of mountainous terrain and low temperatures on specific tree crops highlights the importance of climate suitability in crop selection [33].

3.2. Water Consumption

The distribution of agricultural output among distinct crop categories within varying climate zones validates the principle of comprehending crop production and yield distribution to optimize resource allocation and safeguard food security [34]. The substantial allocation of cultivation area to wheat, a strategically vital crop for the nation, underscores its pivotal role in ensuring food security and fostering economic stability [35]. As highlighted above, the findings firmly establish that maize and apples consistently yield the highest outputs across all three climates, both among crops and orchards. This observation underscores the importance of selecting high-yield crop varieties tailored to local climatic and soil conditions [36]. The neglect of certain tree species like walnuts, almonds, and grapes due to inadequate management underlines the urgency of implementing effective land management practices to sustain agricultural diversity and longevity [37].
The findings reveal that, among the examined crops, alfalfa (680, 820, and 953 mm), maize (531, 585, and 598 mm), and potato (469, 530, and 611 mm) exhibit the highest ETc values, while saffron records the lowest ETc values (195, 304, and 311 mm) across semidry, dry, and very dry climates, respectively. Conversely, crops with the lowest ETc values in these climates are rose (343, 410, and 563 mm), grape (513, 579, and 567 mm), and pomegranate (490, 525, and 565 mm). Similar ETc values are observed for other tree species. These outcomes emphasize the considerable maintenance costs associated with plant cultivation, encompassing water and nutritional requirements, especially in arid plains. Consequently, it may be necessary to consider substituting certain crops prevalent in these regions with alternatives like saffron, grapes, pomegranates, and even medicinal plants. Unfortunately, improper agricultural management, combined with ineffective policies such as guaranteed purchase support, over the past 45 years in Iran has resulted in detrimental effects. Despite the historical prevalence of grape, pomegranate, and saffron cultivation, these misguided policies have adversely affected the environment, causing the degradation of fertile plains nationwide [38].
Alfalfa stands out among the studied crops, exhibiting the highest water requirement (621, 780, and 917 mm), while saffron demands the least amount of water (136, 261, and 268 mm) across the different climates. Conversely, the crops with the highest water demands are cucumber (685, 706, and 866 mm) and cherry (662, 690, and 837 mm). Meanwhile, rose (462, 510, and 539 mm) and grapes (500, 565, and 633 mm) demonstrate the lowest water requirements. An essential observation pertains to the significant climate changes experienced by the studied plains over the last half-century. These plains once maintained normal hydrological conditions that supported crops like grapes, saffron, pomegranates, almonds, and walnuts with considerably lower water needs. However, long-term meteorological data (33 years) illustrate a staggering decrease in rainfall of 69%, 73%, and 92% in semiarid, dry, and very dry climates, respectively. This decline highlights the excessive exploitation of groundwater, evident through the proliferation of both authorized and unauthorized wells, which increased by over 350% during this period [38].
This study underscores that crops such as alfalfa, maize, and potato exhibit the highest ETc values, reflecting their significant water demand. Conversely, saffron, rose, grapes, and pomegranate exhibit lower ETc values, signifying their more economical water usage. These findings resonate with existing research that emphasizes the variability in crop water demand due to factors like crop type, growth stage, and environmental conditions [39]. Moreover, the pronounced climate shifts of recent decades have had substantial implications on water requirements across various crops. The noticeable decrease in P, reaching reductions of up to 92% in specific regions, highlights the complex challenges posed by evolving climate patterns. The study by Lobell et al. [40] sheds light on the crucial need to understand the consequences of climate change for both agriculture and water resources. Furthermore, the surge in well drilling and excessive groundwater extraction underscores the evident consequences of declining P for water availability. The adverse effects of such practices on ecosystems and agriculture are well documented [41]. Thus, it becomes imperative to implement sustainable groundwater management and conservation strategies to address these challenges. Through analyzing the effectiveness of P for alfalfa in dry climates, it becomes apparent that its impact is less pronounced than in semidry climates, yet is more substantial than in very dry climates. Additionally, maize, potato, and bean display no discernible response to rainfall across all three climates (refer to Table 4). Cucumber and cherry stand out as orchard crops with the highest ETc values and water demands across the studied climates, while grape and rose exhibit the lowest water demands and ETc values. Among orchard plants, melons exhibit the least responsiveness to rainfall, whereas almonds and roses demonstrate the most significant effects. Notably, almonds boast high ETc values, extensive water requirements, and substantial P responsiveness across all climates. In dry climates, crops such as alfalfa, canola, wheat, and saffron, alongside orchard crops like cherry, apple, pistachio, and peach, demonstrate the highest levels of EP (Table 4).
The proposal to substitute water-intensive crops with alternatives like saffron, grapes, and pomegranates aligns well with strategies geared toward adapting to fluctuating water availability. Research by Kumar et al. [42] underscores the importance of crop diversification and the selection of drought-resistant varieties to enhance water use efficiency. Furthermore, the examination of EP for different crops reveals varying levels of responsiveness to P. This underscores the crucial role that irrigation practices play in supplementing water requirements for crops with lower responsiveness to rain. Investigations into irrigation efficiency and scheduling, as exemplified by Pereira et al. [43], provide valuable insights into optimizing water allocation within agricultural contexts. The results also underscore the adverse consequences of ill-conceived agricultural management policies on environmental degradation. Implementing effective policies that promote sustainable water use and prudent agricultural practices becomes a necessary step to mitigate these negative impacts. The concept of integrated water resource management, as outlined by Biswas [44], emphasizes the need for comprehensive and harmonized approaches to water governance. Therefore, the findings highlight elevated water requirements for crops.
Top of Form

3.3. WFPs

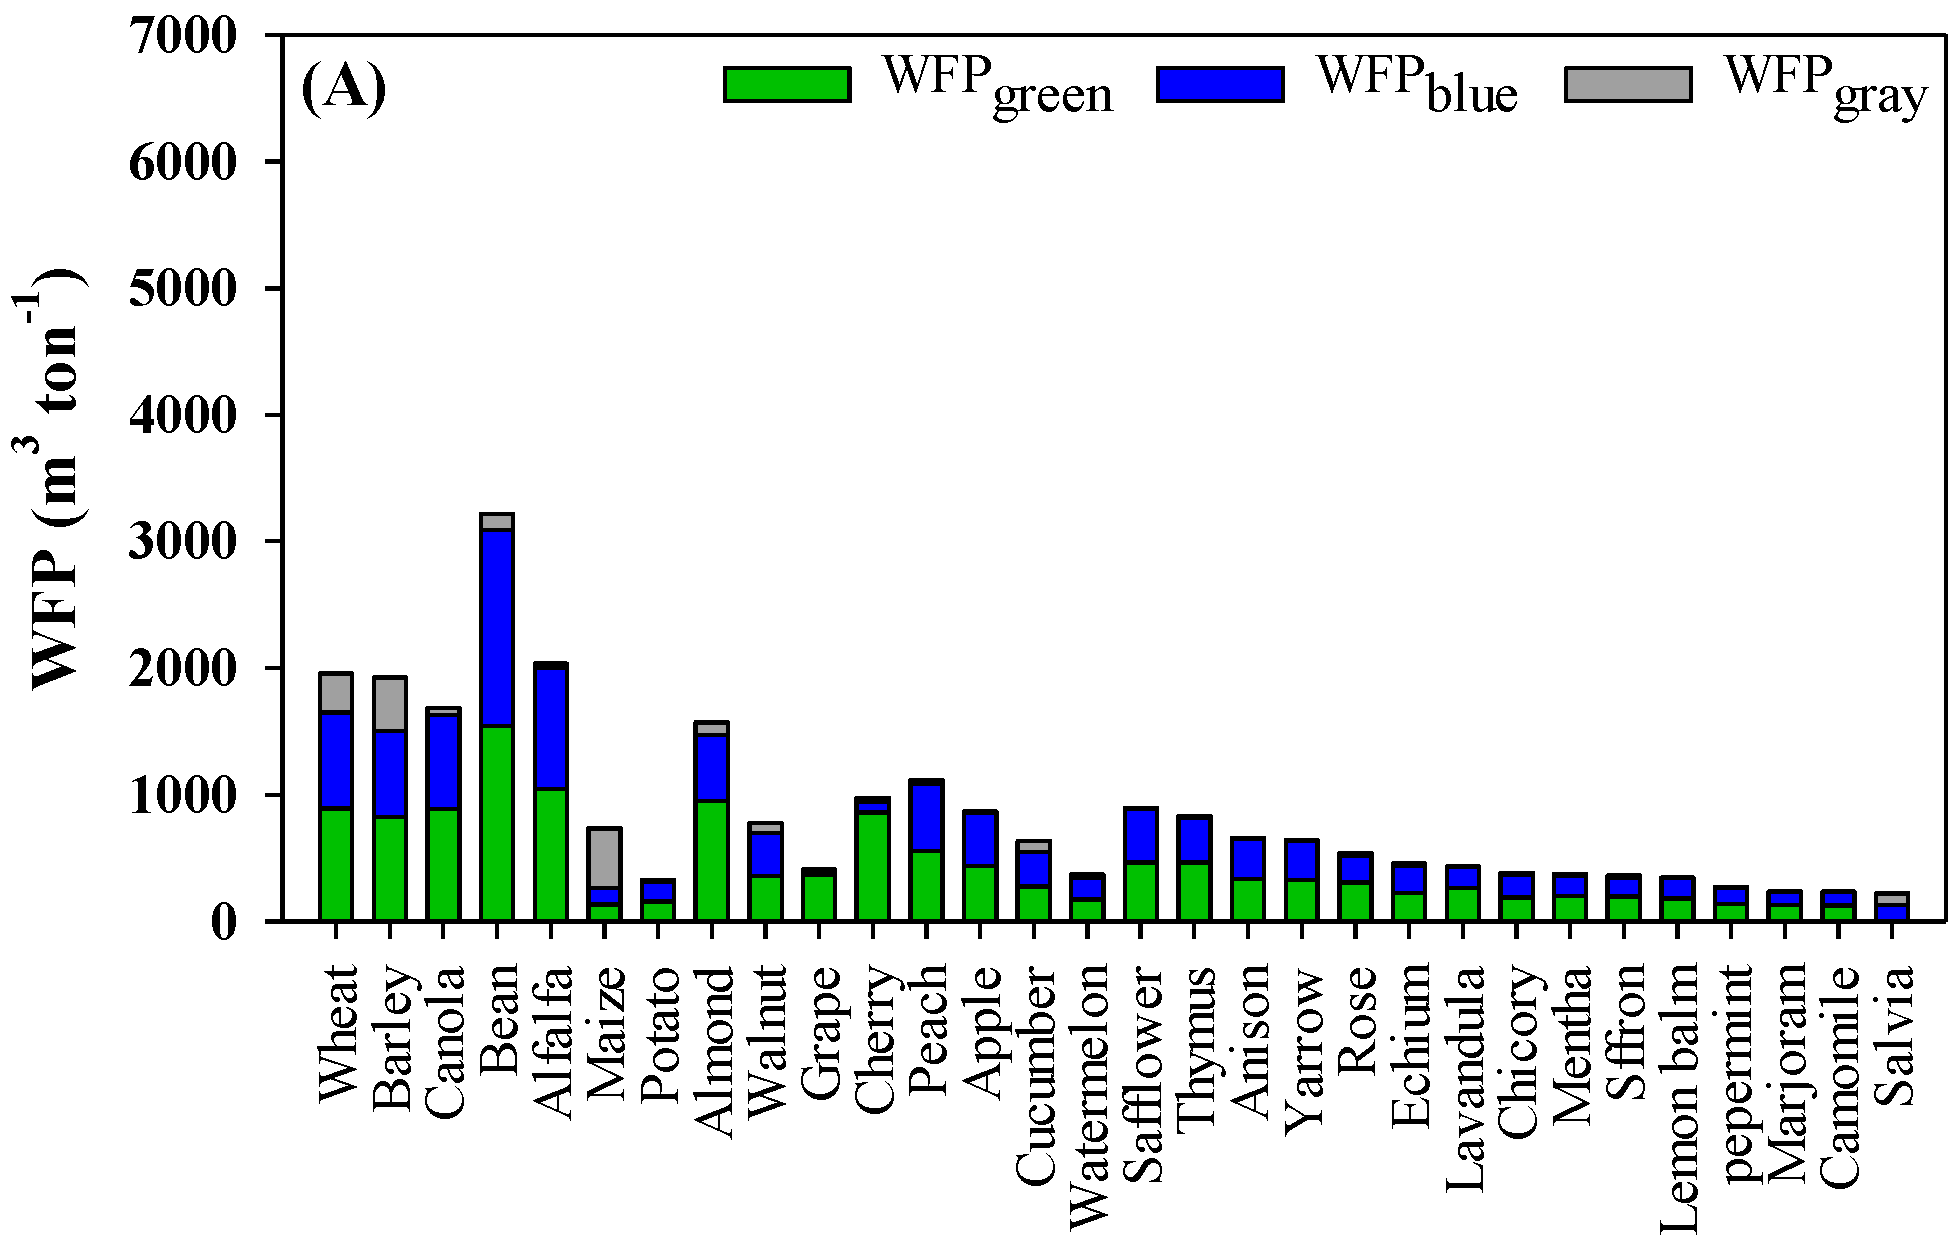
In semidry climates, bean has the highest allocated WFP at 3121.08 m3 ton−1, while potato exhibits the lowest WFP at 326.93 m3 ton−1. Among orchard products, almond demonstrates the highest WFP at 1569.74 m3 ton−1, with grape having the lowest WFP, even lower than roses, at 410.19 m3 ton−1. Bean consistently holds the highest WFP in all three sectors, emphasizing the importance of soil water retention and consistent irrigation practices. Potato cultivation requires more water than maize, highlighting the role of direct irrigation and surface or groundwater resources in potato production. In the orchard produce sector, peach has a WFP of 530.28 m3 ton−1, surpassing other horticultural products. Comparing cucurbit products, cucumbers’ WFP exceeds watermelons’ WFP by 58.62%.
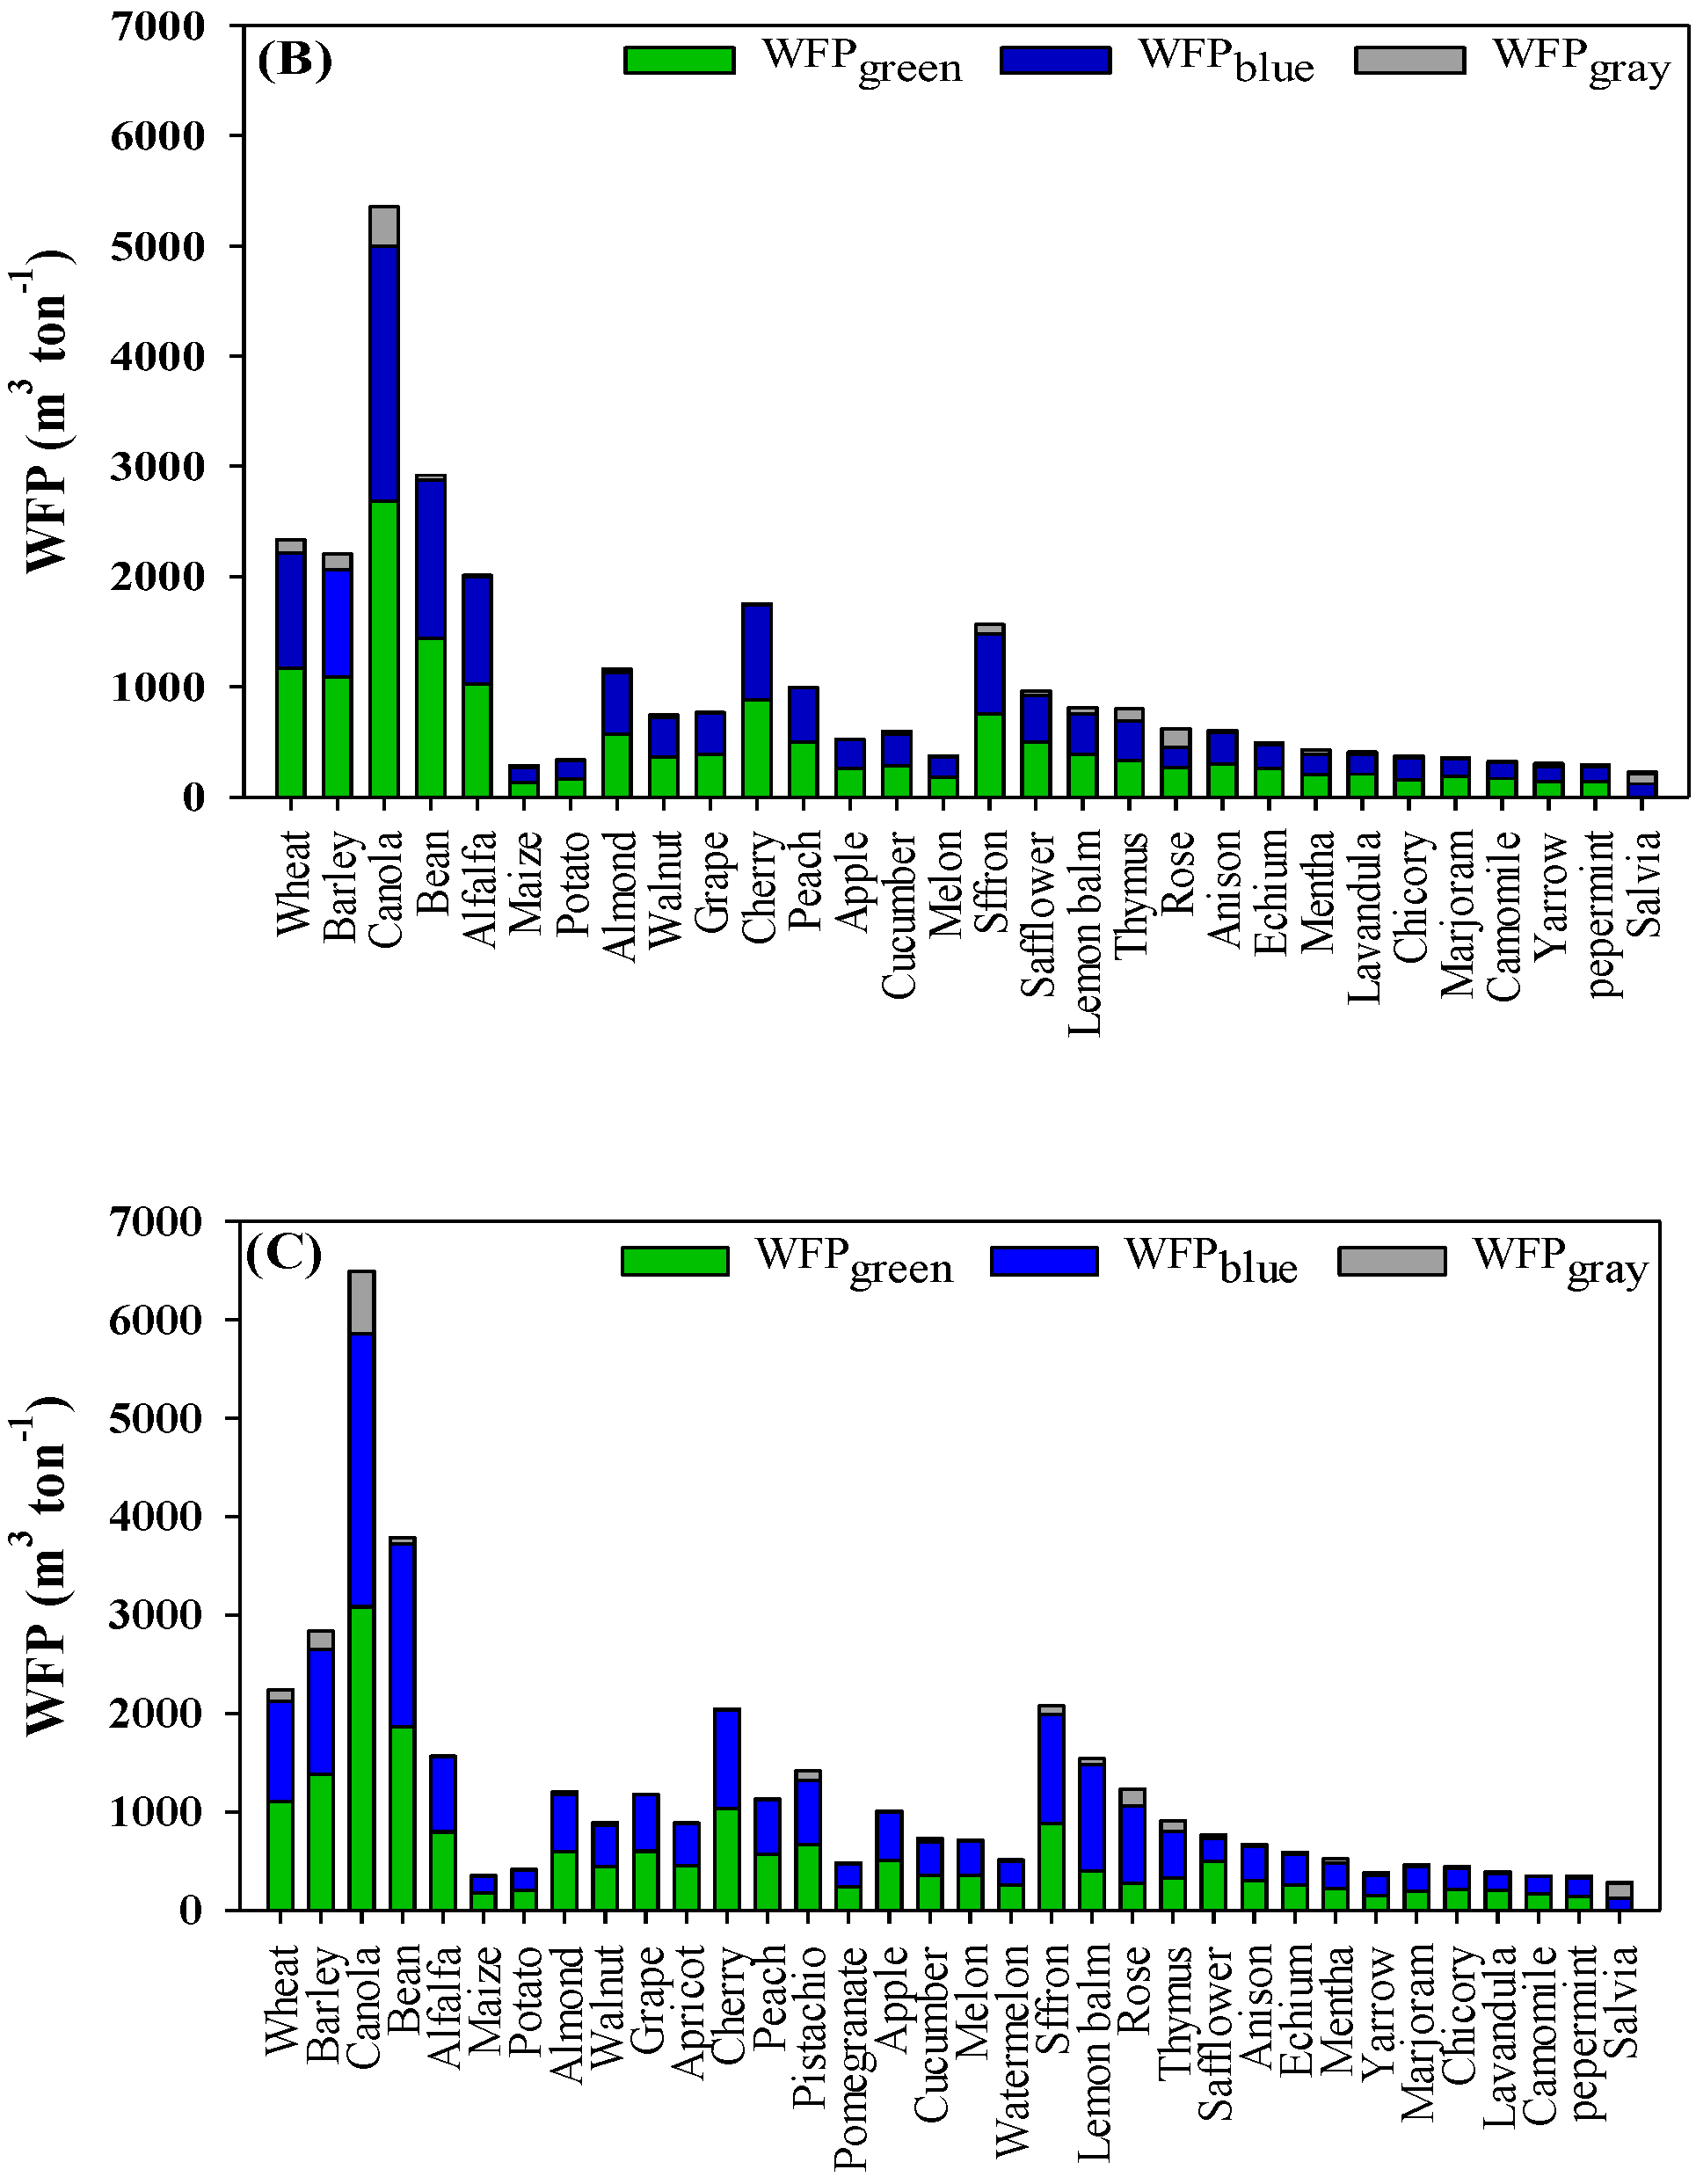
In semidry climates, the prominence of bean with the highest WFP underscores their substantial water demand, aligning with recent studies emphasizing the importance of understanding crop water requirements in water-limited regions. Disparities between the WFPgreen and WFPblue lines of bean and other crops underscore the significance of soil water retention and efficient irrigation strategies, especially in water-scarce regions. Comparing water usage between potato and maize cultivation, potato consumes more water in line with the recent literature on crop-specific water requirements. In dry climates, canola stands out with the highest WFP at 5355.36 m3 ton−1, surpassing all other crops, orchard, and cucurbits by a significant margin. Cherry, also grown in this climate, exhibit a substantial WFP. Barley’s production results involve more pollution than wheat due to increased fertilizer usage, elevating wheat’s WFP relative to barley. Within this dry climate, cherries demonstrate the highest water consumption and the lowest pollution output (Figure 2).
Cucurbit crops, including cucumbers, melons, and watermelons, have significantly lower WFPs than critical crops in dry climates, suggesting the potential for a shift towards cultivating more cucurbit crops in these areas. Canola’s remarkable WFP in dry climates is attributed to its dependence on phosphorus (P) and associated pollution, allowing it to exceed the WFP of other products in this climate. In conclusion, these findings provide valuable insights into WFP allocation across diverse crops in different climatic contexts, substantiated by the recent scientific literature. They underscore the need for sustainable water management strategies and informed crop selection to address water scarcity and environmental concerns, as referenced throughout the text [11,45,46,47,48,49,50,51].

3.3.1. WFP of Major Crops

The findings presented in Figure 3 provide valuable insights into the intricate relationship between major crops and the World Food Programme (WFP) across diverse climatic conditions. These results align with existing research that underscores the complex interplay involving crop selection, climate, and water resource management. In semidry climates, crops such as wheat, barley, canola, and potatoes exhibit favorable WFP levels. In dry climates, maize, bean, and saffron products also show relatively positive WFP conditions. Notably, in exceedingly dry climates, alfalfa displays promising WFP performance. These findings underscore the substantial impact of EP on the growth of winter crops. As a result, the timing of planting and autumn P prove critical for optimal water absorption by winter crops.
The analysis reveals that WFPgreen and WFPblue levels for winter crops in semidry climates are lower compared to both dry and very dry climates. This underscores the significant influence of EP on the growth of winter crops. As such, timely planting dates and adequate autumn rainfall are essential for optimal water absorption by winter crops. Overall, this study indicates that canola demonstrates the highest WFP in both dry and very dry climates, followed by wheat and barley, respectively. What was particularly noteworthy, in a comparison between wheat and barley in dry climates, is that wheat displays higher WFPgreen and WFPblue values, while barley exhibits a higher WFPgray. Among the crops in semidry climates, bean shows the highest WFP, while potato exhibits the lowest.
Conversely, the WFPgray for wheat and barley in semidry climates is 53% higher than in other climates. Consequently, the use of chemical fertilizers and sufficient autumn rainfall leads to increased reliance on chemical fertilizers during the fall season (see Figure 3A,B). Remarkably, canola experiences a significant increase in WFPgray with climate warming. This highlights that enhancing the WFP does not necessarily correlate with higher yields. In semidry climates, canola yield surpasses that of dry and very dry climates by 57% and 60%, respectively (see Figure 3C). Cultivating inappropriate crops in rotation on a broader scale and over the long term could result in irreversible damage to water and land resources, especially in dry climates. It can even be argued that cultivating crops like canola in semidry climates lacks scientific justification, given the average yield of canola in semi humid regions (its primary origin), rendering such cultivation unsuitable.
In semidry climates, the favorable WFP levels exhibited by crops such as wheat, barley, canola, and potatoes suggest an adaptability to available water resources. This aligns with studies emphasizing the significance of crop selection in regions characterized by limited water availability [52]. Additionally, the contrasting WFPgreen and WFPblue values for winter crops in semidry, dry, and very dry climates underscore the essential role of EP in influencing crop performance. This reaffirms the importance of timely planting and P patterns in maximizing water absorption, a key factor in optimizing crop yields [9,53].
The differences observed in the WFPgray for wheat and barley across different climates emphasize the complex relationship between fertilization practices, P, and resulting water pollution. The higher WFPgray in semidry climates could be attributed to the increased use of chemical fertilizers, possibly driven by the need to compensate for water scarcity [54]. However, the increase in WFPgray for canola with climate warming indicates the need for a nuanced understanding of the implications of the increasing WFP. This echoes studies suggesting that focusing solely on WUE might not guarantee sustainable crop yields [55]. In dry climates, bean, despite its lower water consumption, can achieve the same yield as in semidry climates (2500 kg ha−1). However, in very dry climates, despite consuming 350 m3 ton−1 more water, bean yield is 28% lower compared to dry climates (Figure 3D). Interestingly, the results differ for alfalfa, as its yield in very dry climates surpasses that of semidry and dry climates by 46% and 33%, respectively. Despite this, the WFPblue and WFPgreen are 18% and 15% lower in these climates. Therefore, water utilization in such conditions remains optimal, given that fodder harvesting occurs five times annually in very dry climates and three times in dry and semidry climates. As a result, year-round temperature uniformity significantly impacts alfalfa growth and development (Figure 3E). The significant variations in bean yield across dry and very dry climates despite differing water consumption levels highlight the importance of WUE in crop performance. This finding supports the notion that the volume of water consumed is not the sole determinant; rather, it is the effectiveness of its translation into yield that matters [56]. Conversely, the positive results for alfalfa yield in very dry climates, despite lower WFPblue and WFPgreen levels, underscore the crop’s adaptability and efficient water utilization strategies. This aligns with research indicating that certain crops can thrive in arid conditions through specialized water use mechanisms [57].
The quantities of WFP for maize and potato are nearly identical, even though they produce substantial dry matter concerning water consumption. This aspect should not be overlooked in interpreting the results, including potential environmental and agricultural implications in the study areas. It is advisable to use a consistent unit for evaluating crop yield in future research. In both semidry and dry climates, the WFP for maize and potato remains similar. However, the yield of these crops in dry climates surpasses that in semidry climates by 9% for maize and 6% for potato. Furthermore, maize and potato yield in very dry climates are 20% lower than in dry climates, despite their WFPs being 9% and 15% higher, respectively. Given the pivotal role these crops have played in human and livestock food security in recent decades, neglecting their significance poses a substantial challenge (Figure 3F,G). The similarity in WFP quantities for maize and potato, despite their substantial dry matter production, highlights the importance of considering both water consumption and yield. This observation underscores the significance of adopting holistic assessment approaches that encompass environmental impact and resource efficiency [58]. The recommendation for consistent units in future research echoes the need for standardized metrics to facilitate cross-study comparisons [59]. Furthermore, the yield disparities for maize and potato between semidry and dry climates, as well as the yield decrease in very dry climates despite higher WFPs, emphasize the complexity of factors influencing crop productivity. These findings underline the necessity for context-specific strategies in crop planning and agricultural management [60]. As the global agricultural landscape faces increasing challenges related to water scarcity and climate change, these findings underscore the need for adaptive and science-informed strategies to ensure food security and environmental sustainability.

3.3.2. WFP of Orchard Crops

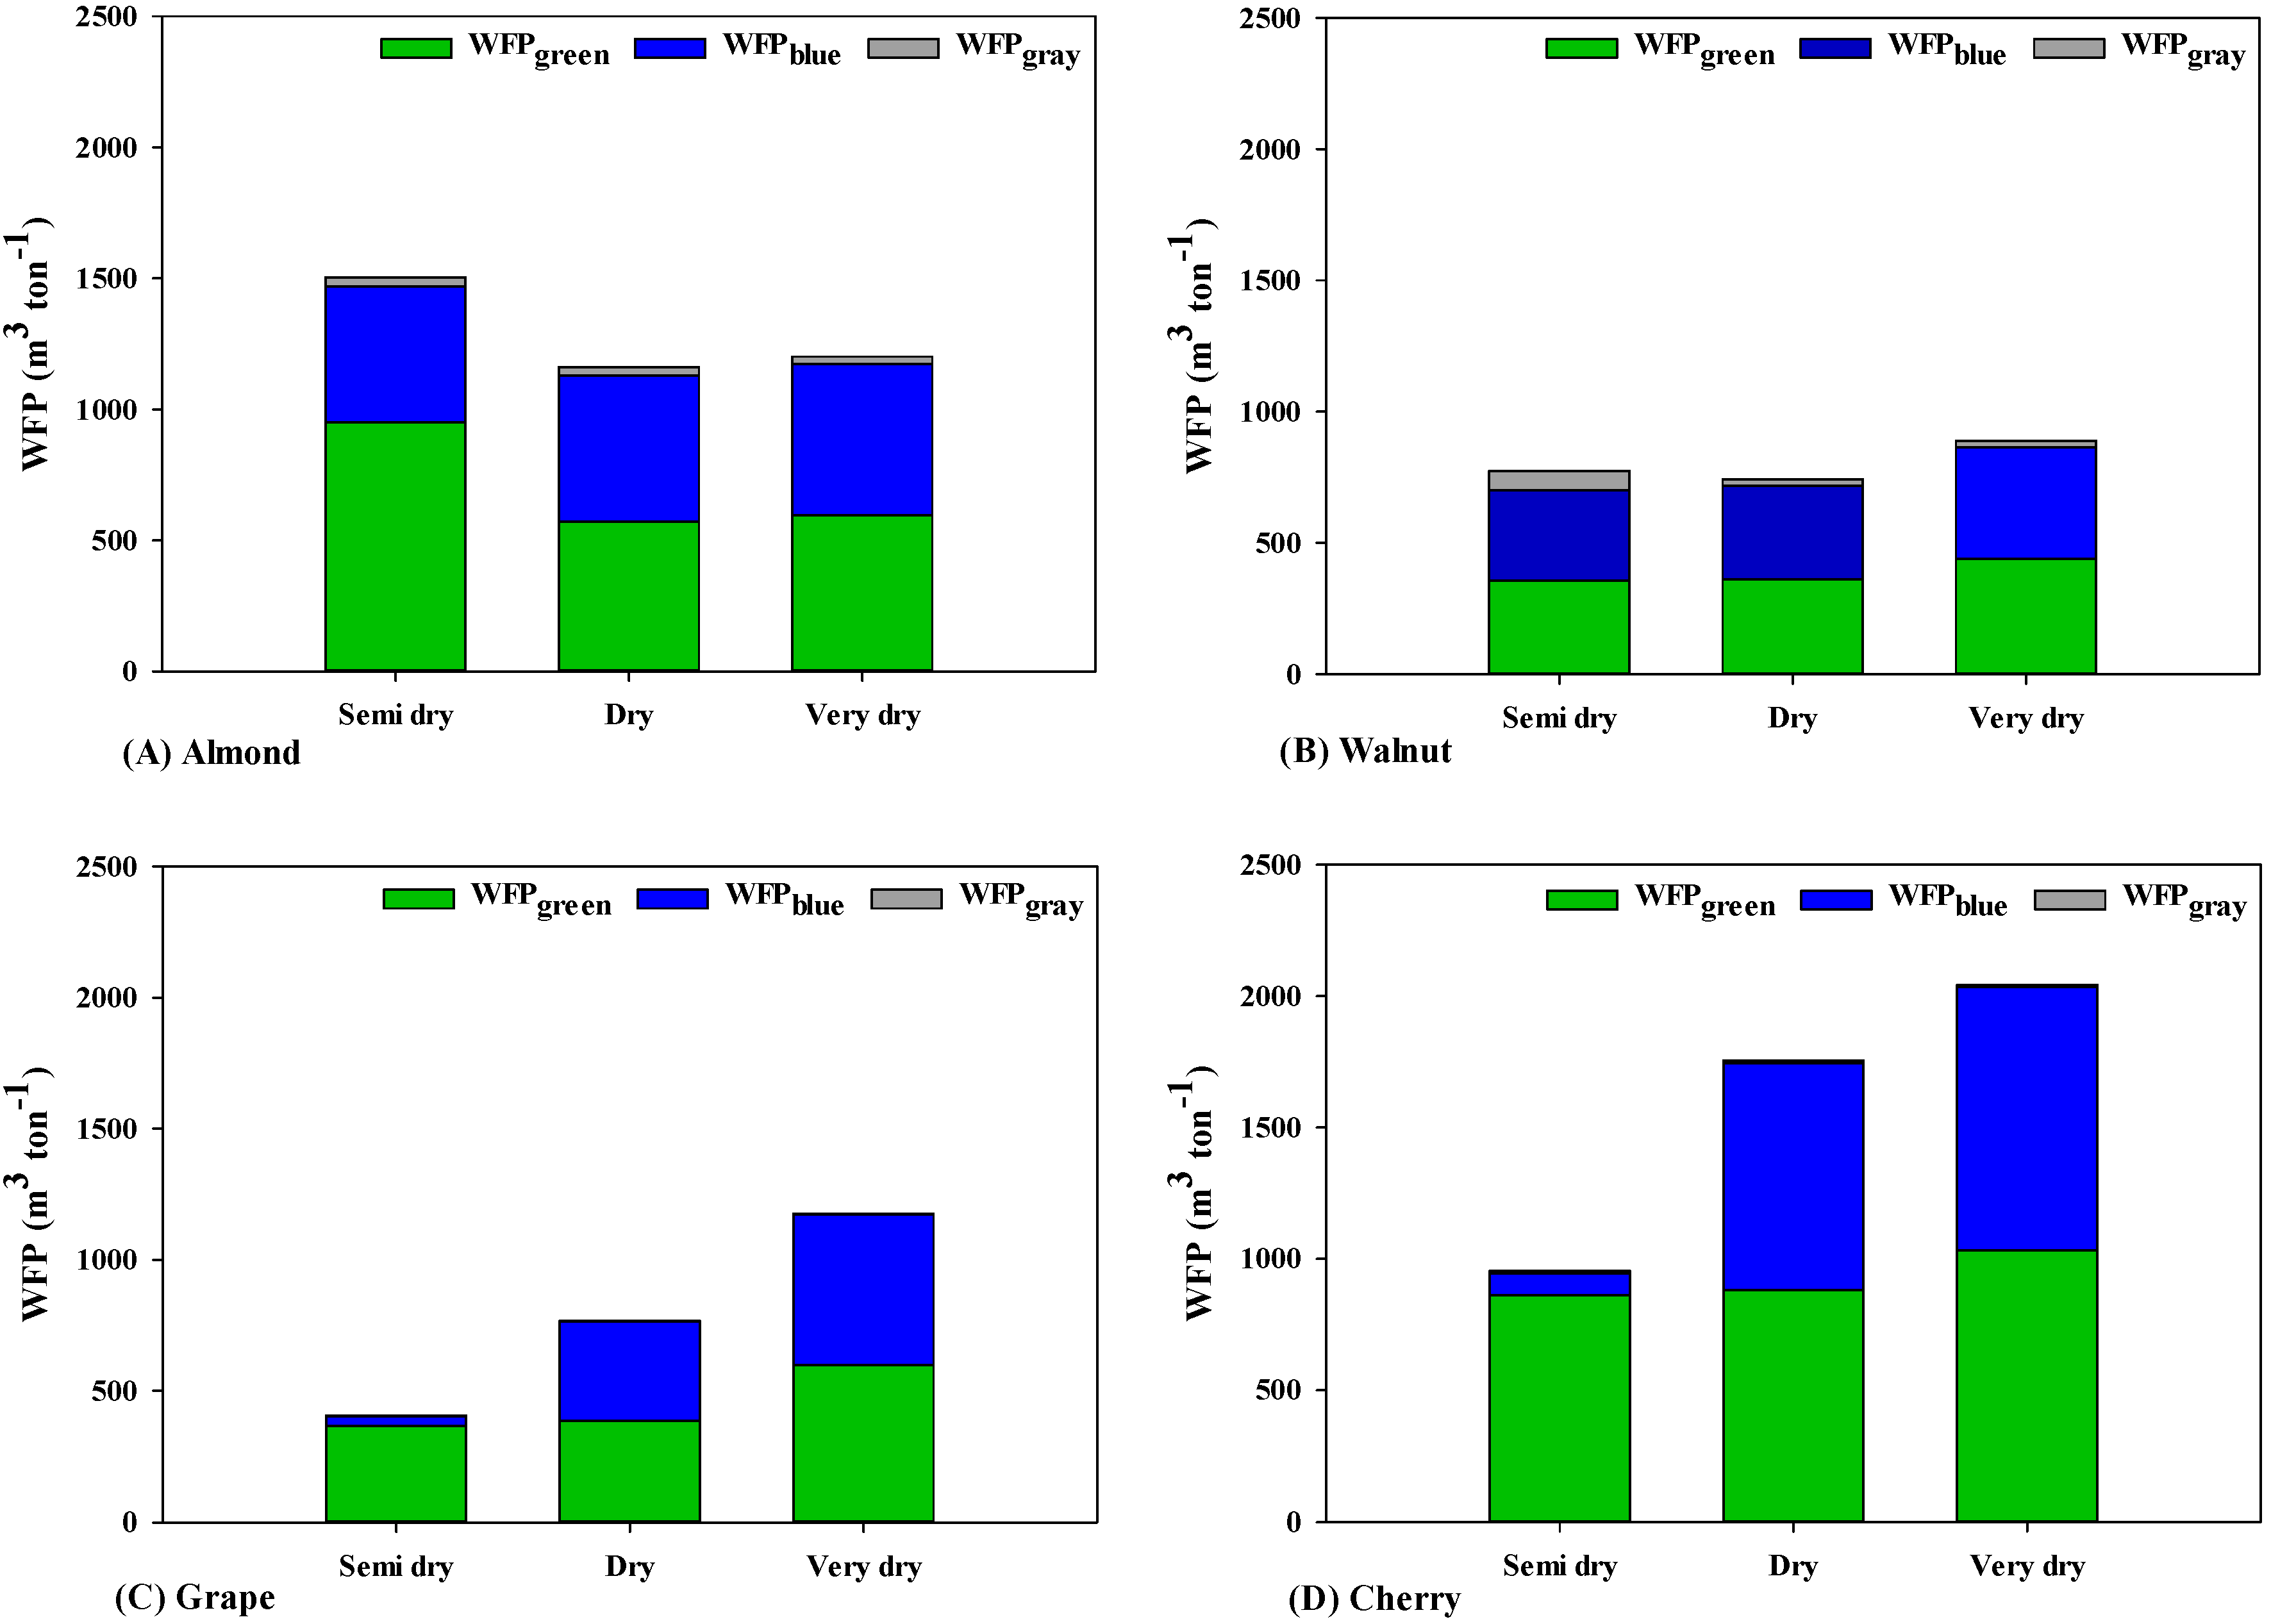
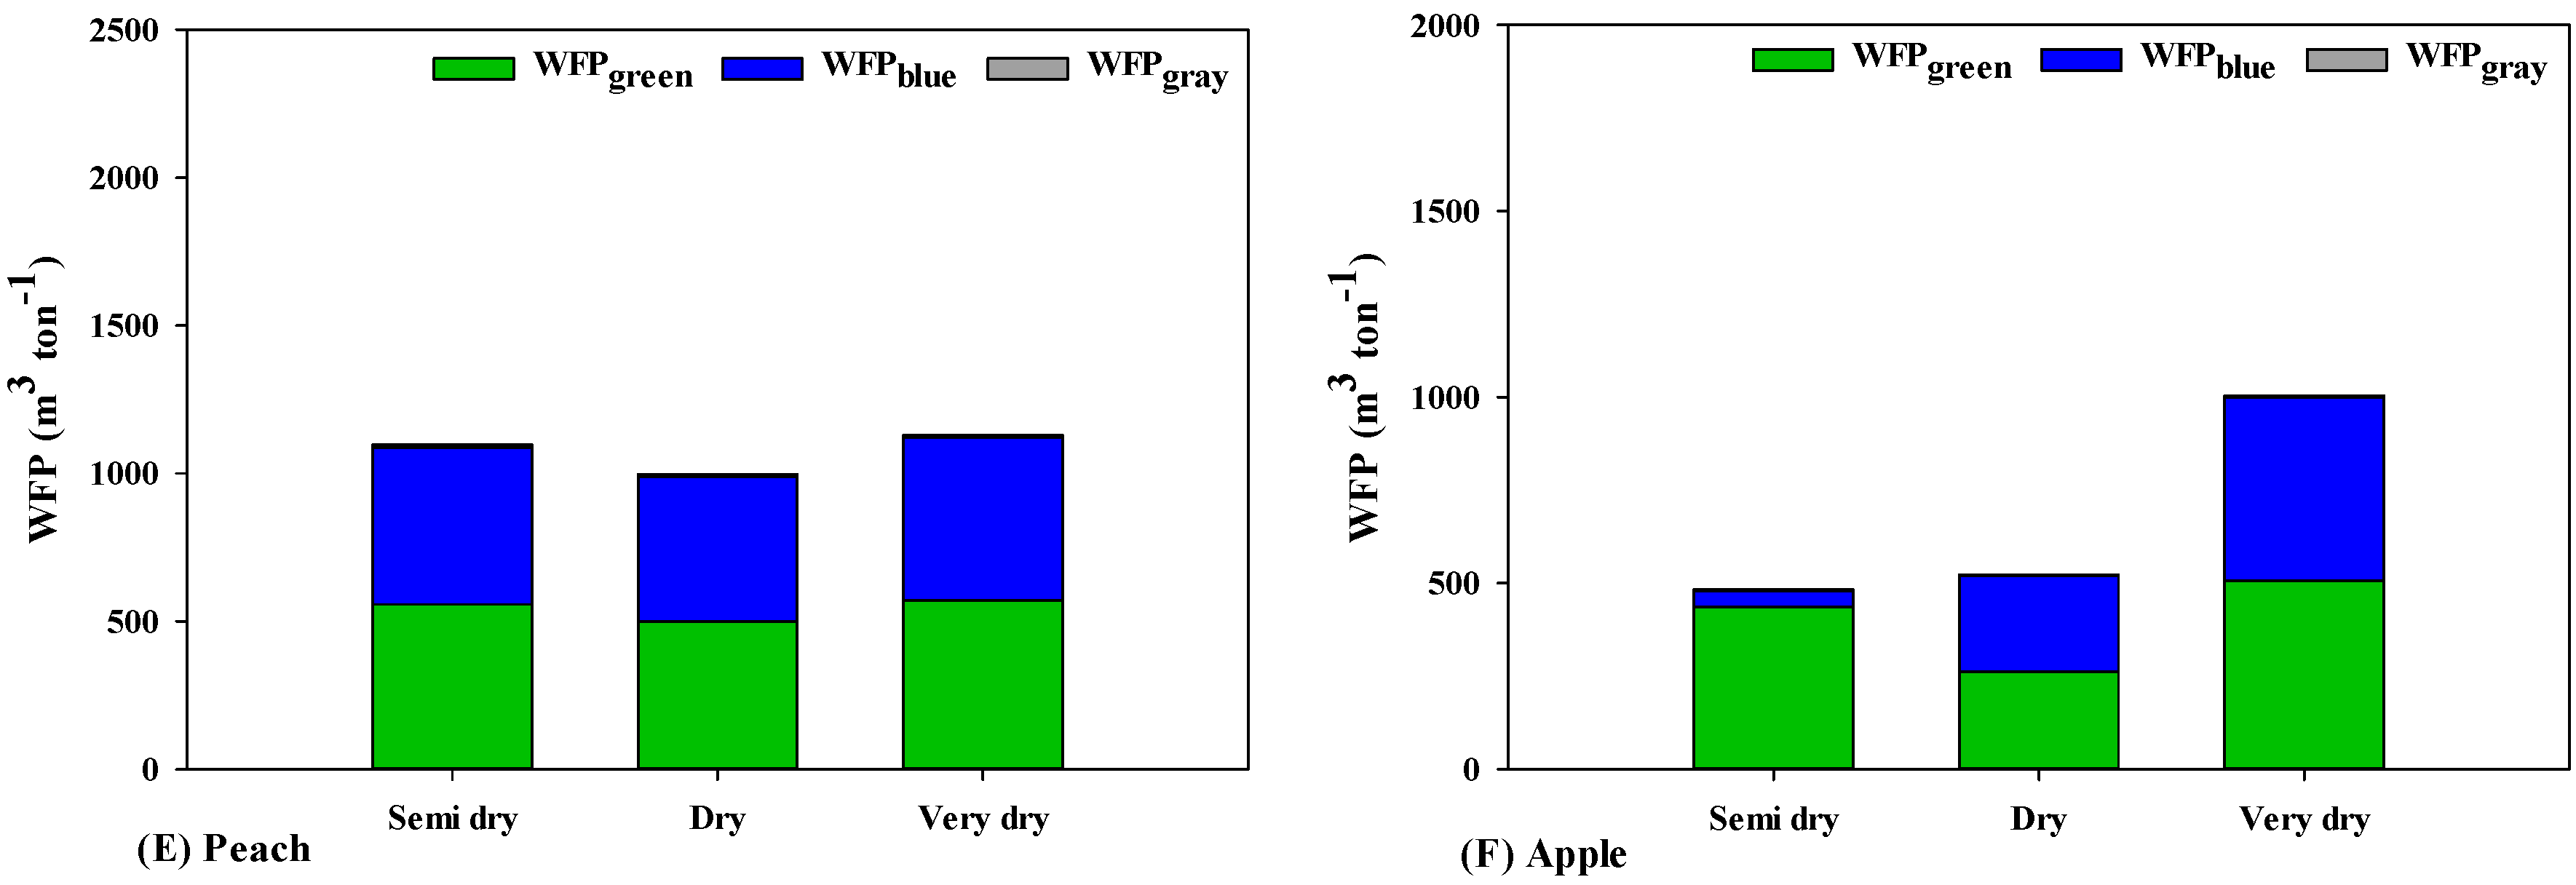
In the domain of horticultural products within this climatic context, almonds and grape exhibited the highest WFPs. The findings also unveiled a significant disparity in the WFP of peach between its WFPgreen and WFPblue components, with the widest gap observed among all products. Moreover, in the semidry climate, the WFPblue for peach notably surpassed that of the dry climate. In contrast, within the very dry climate, maize displayed the lowest WFP, while cherry showed the lowest WFPgray, despite having higher WFPgreen and WFPblue values. Based on the insights depicted in Figure 4A, it is apparent that the cultivation of almond displays distinct variations in WFP across diverse climatic conditions. Notably, the lowest WFPgreen was recorded in dry climates (570.04 m3 ton−1), whereas the lowest WFPblue was identified in semidry climates (520.32 m3 ton−1), and the least WFPgray was observed in very dry climates (28.33 m3 ton−1). Overall, given its minimal WFPgreen, almond cultivation is generally advisable in dry climates. This climate also proves favorable for growing walnut and peach, surpassing the other two climate types. Conversely, semidry climates yield better outcomes for the cultivation of grape, cherry, apple, and rose, as illustrated in Figure 4B–F.
The findings presented in Figure 4A offer valuable insights into the intricate connection between WFP and almond cultivation across a range of climatic conditions. These outcomes resonate with contemporary research that underscores the significance of understanding the interplay between crops and water for sustainable agricultural planning [61,62]. The observed variations in WFPgreen, WFPblue, and WFPgray for almond across different climates highlight the multifaceted nature of water utilization in agricultural systems. The identification of the lowest WFPgreen in dry climates aligns with the understanding that water scarcity often compels crops to optimize WUE [62]. This observation underscores the rationale for almond cultivation in such settings, aiming to conserve water resources while sustaining productivity. Similarly, the preference for dry climates for cultivating walnuts and peaches in terms of WFP echoes these crops’ adaptability to regions with limited water availability [63].
Regarding grape and rose production, semidry climates prove superior in terms of WFP, outperforming other climate conditions (Figure 4C–G). It is notable that, while the difference in WFP between semidry and dry climates is not statistically significant, the variance in their respective WFP values is substantial. This distinct fluctuation underscores the prominence of semidry climates. In the case of peach production, the contrast in WFP between dry and semidry climates is relatively marginal. This discrepancy is primarily attributed to the WFP in semidry climates. While the WFPgray for peach in very dry climates slightly exceeds that of other climates by 2 m3 ton−1, it remains lower than that of semidry climates when accounting for other components of WFP (Figure 4E). This finding aligns with studies emphasizing certain crops’ capacity to thrive under specific climatic conditions that strike a balance between water supply and demand [64]. Importantly, the nuanced discussion of WFP differences between semidry and dry climates underscores the need to consider the broader context of water management and allocation in agricultural decision making [65]. Furthermore, the slight discrepancy in WFP between dry and semidry climates for peach cultivation indicates a relatively consistent water utilization pattern for this crop. The notable influence of semidry climates on this observation reinforces the importance of evaluating various WFP components to comprehensively gauge the WUE of agricultural systems [66]. Despite the higher WFPgray in very dry climates for peach, the examination of other WFP components underscores the intricate trade-offs between water consumption and yield, further emphasizing the holistic evaluation of WFPs [67].

3.3.3. WFP of Cucurbit Crops

Considering the prominent role of cucurbit crops in Iran, encompassing factors such as their significance, geographical distribution, and cultivation extent, especially within highly arid climates, it becomes evident that these crops are relatively less prevalent in semidry and dry conditions. The insights illustrated in Figure 5 shed light on how, under such arid circumstances, the WFP associated with cucurbit cultivation surpasses that of the other two climates. Interestingly, the WFP patterns for cucumber and watermelon exhibit similarities in both semidry and dry climates (Figure 5A–C).
The findings from this study try to offer valuable insights into the cultivation of cucurbit crops in arid regions, especially in the context of their significance, distribution, and growth extent. This discussion will delve into the implications of these findings while incorporating recent scientific references to bolster the presented arguments. Cucurbit crops hold substantial agricultural and economic importance in Iran due to their contributions to essential nutrients and the local agricultural output. The cultivation of these crops across various climates, particularly in arid regions, poses complex challenges due to limited water resources. As emphasized by recent studies [68,69], water scarcity and effective water management have become pivotal aspects of agricultural sustainability in arid and semiarid zones. Specifically, the results indicate that, in extremely dry climates, the WFP linked to cucurbit cultivation notably surpasses that of other climates. This aligns with research by Forin et al. [70], underlining that water-intensive crops like cucurbits tend to exert heightened demands on water resources in regions characterized by water scarcity.
Furthermore, the observed congruence in WFP patterns for cucumber and watermelon in both semidry and dry climates, as shown in Figure 5A–C, raises intriguing questions regarding the inherent water use traits of these crops. Recent work by Xu et al. [71] has delved into the genetic and physiological characteristics of cucurbit crops, suggesting that certain shared genetic factors might contribute to similar water consumption patterns, influencing their WUE. These findings bear considerable implications for agricultural practices in dry and semidry climates. Given the restricted availability of water resources, adopting strategies that enhance WUE while preserving optimal crop yields becomes imperative. References such as Haque et al. [72] underscore the effectiveness of precision irrigation techniques and drought-resistant crop varieties in addressing the water-related challenges confronting cucurbit cultivation in dry climates.

3.3.4. WFP of Endemic Plants

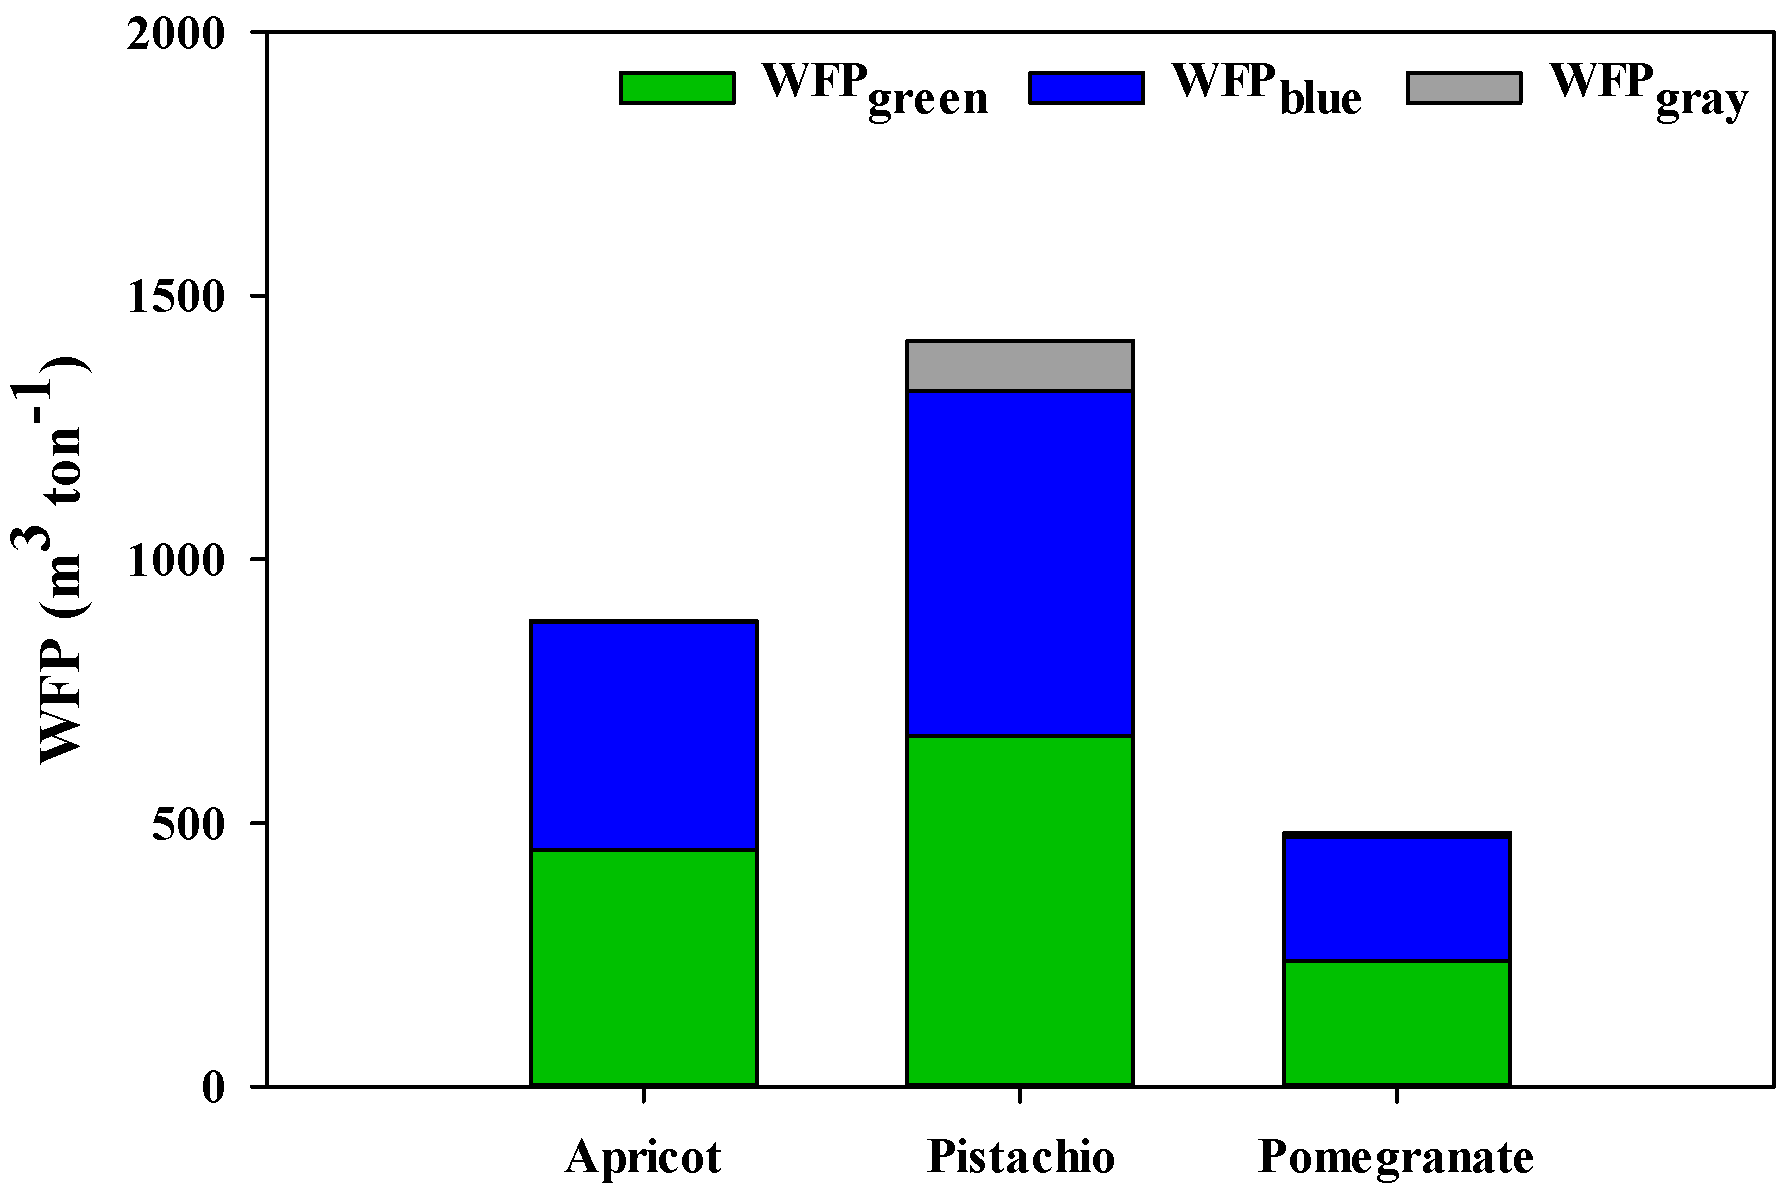
In the context of the importance of yield and the scale of cultivation of orchard crops such as pomegranate, pistachio, and apricot within highly dry climates, and recognizing the limited occurrence of these crops in the other two climatic conditions, their corresponding WFPs are illustrated in Figure 6. The findings of this study show that pomegranate crops displayed the lowest WFP. This observation can be attributed to the historical cultivation practices of pomegranates, which have likely evolved over time to acclimate to arid conditions, resulting in optimized WUE. Notably, this finding is consistent with recent research by Lima et al. [73], highlighting the role of traditional farming knowledge in enhancing crop resilience to water scarcity. Moreover, considering the relatively lower WFP values associated with pistachios and apricots in comparison to other crops, the cultivation of these tree species in highly dry climates gains heightened significance (refer to Figure 6). Consequently, this study proposes the cultivation of pistachio and apricot as a favorable strategy in regions characterized by very dry climatic conditions.
The results focus on the importance of pomegranate, pistachio, and apricot cultivation in horticultural production, emphasizing their economic and nutritional value. It aligns with the principles of agroecology and crop diversification mentioned by Altieri and Koohafkan [74], highlighting the need to incorporate tree species with lower water requirements for more resilient and resource-efficient agricultural systems. This study acknowledges the challenges and opportunities of adapting these crops to dry climates, given global concerns about water scarcity and the importance of sustainable agriculture [75,76]. It recommends strategically cultivating pistachio and apricot in very dry regions due to their adaptability and significant roles in global agricultural markets. This recommendation is supported by recent advances in horticultural practices [3,77], showcasing innovative methods to improve yield and water use efficiency in fruit tree cultivation.

3.3.5. WFP of Medicinal Plants

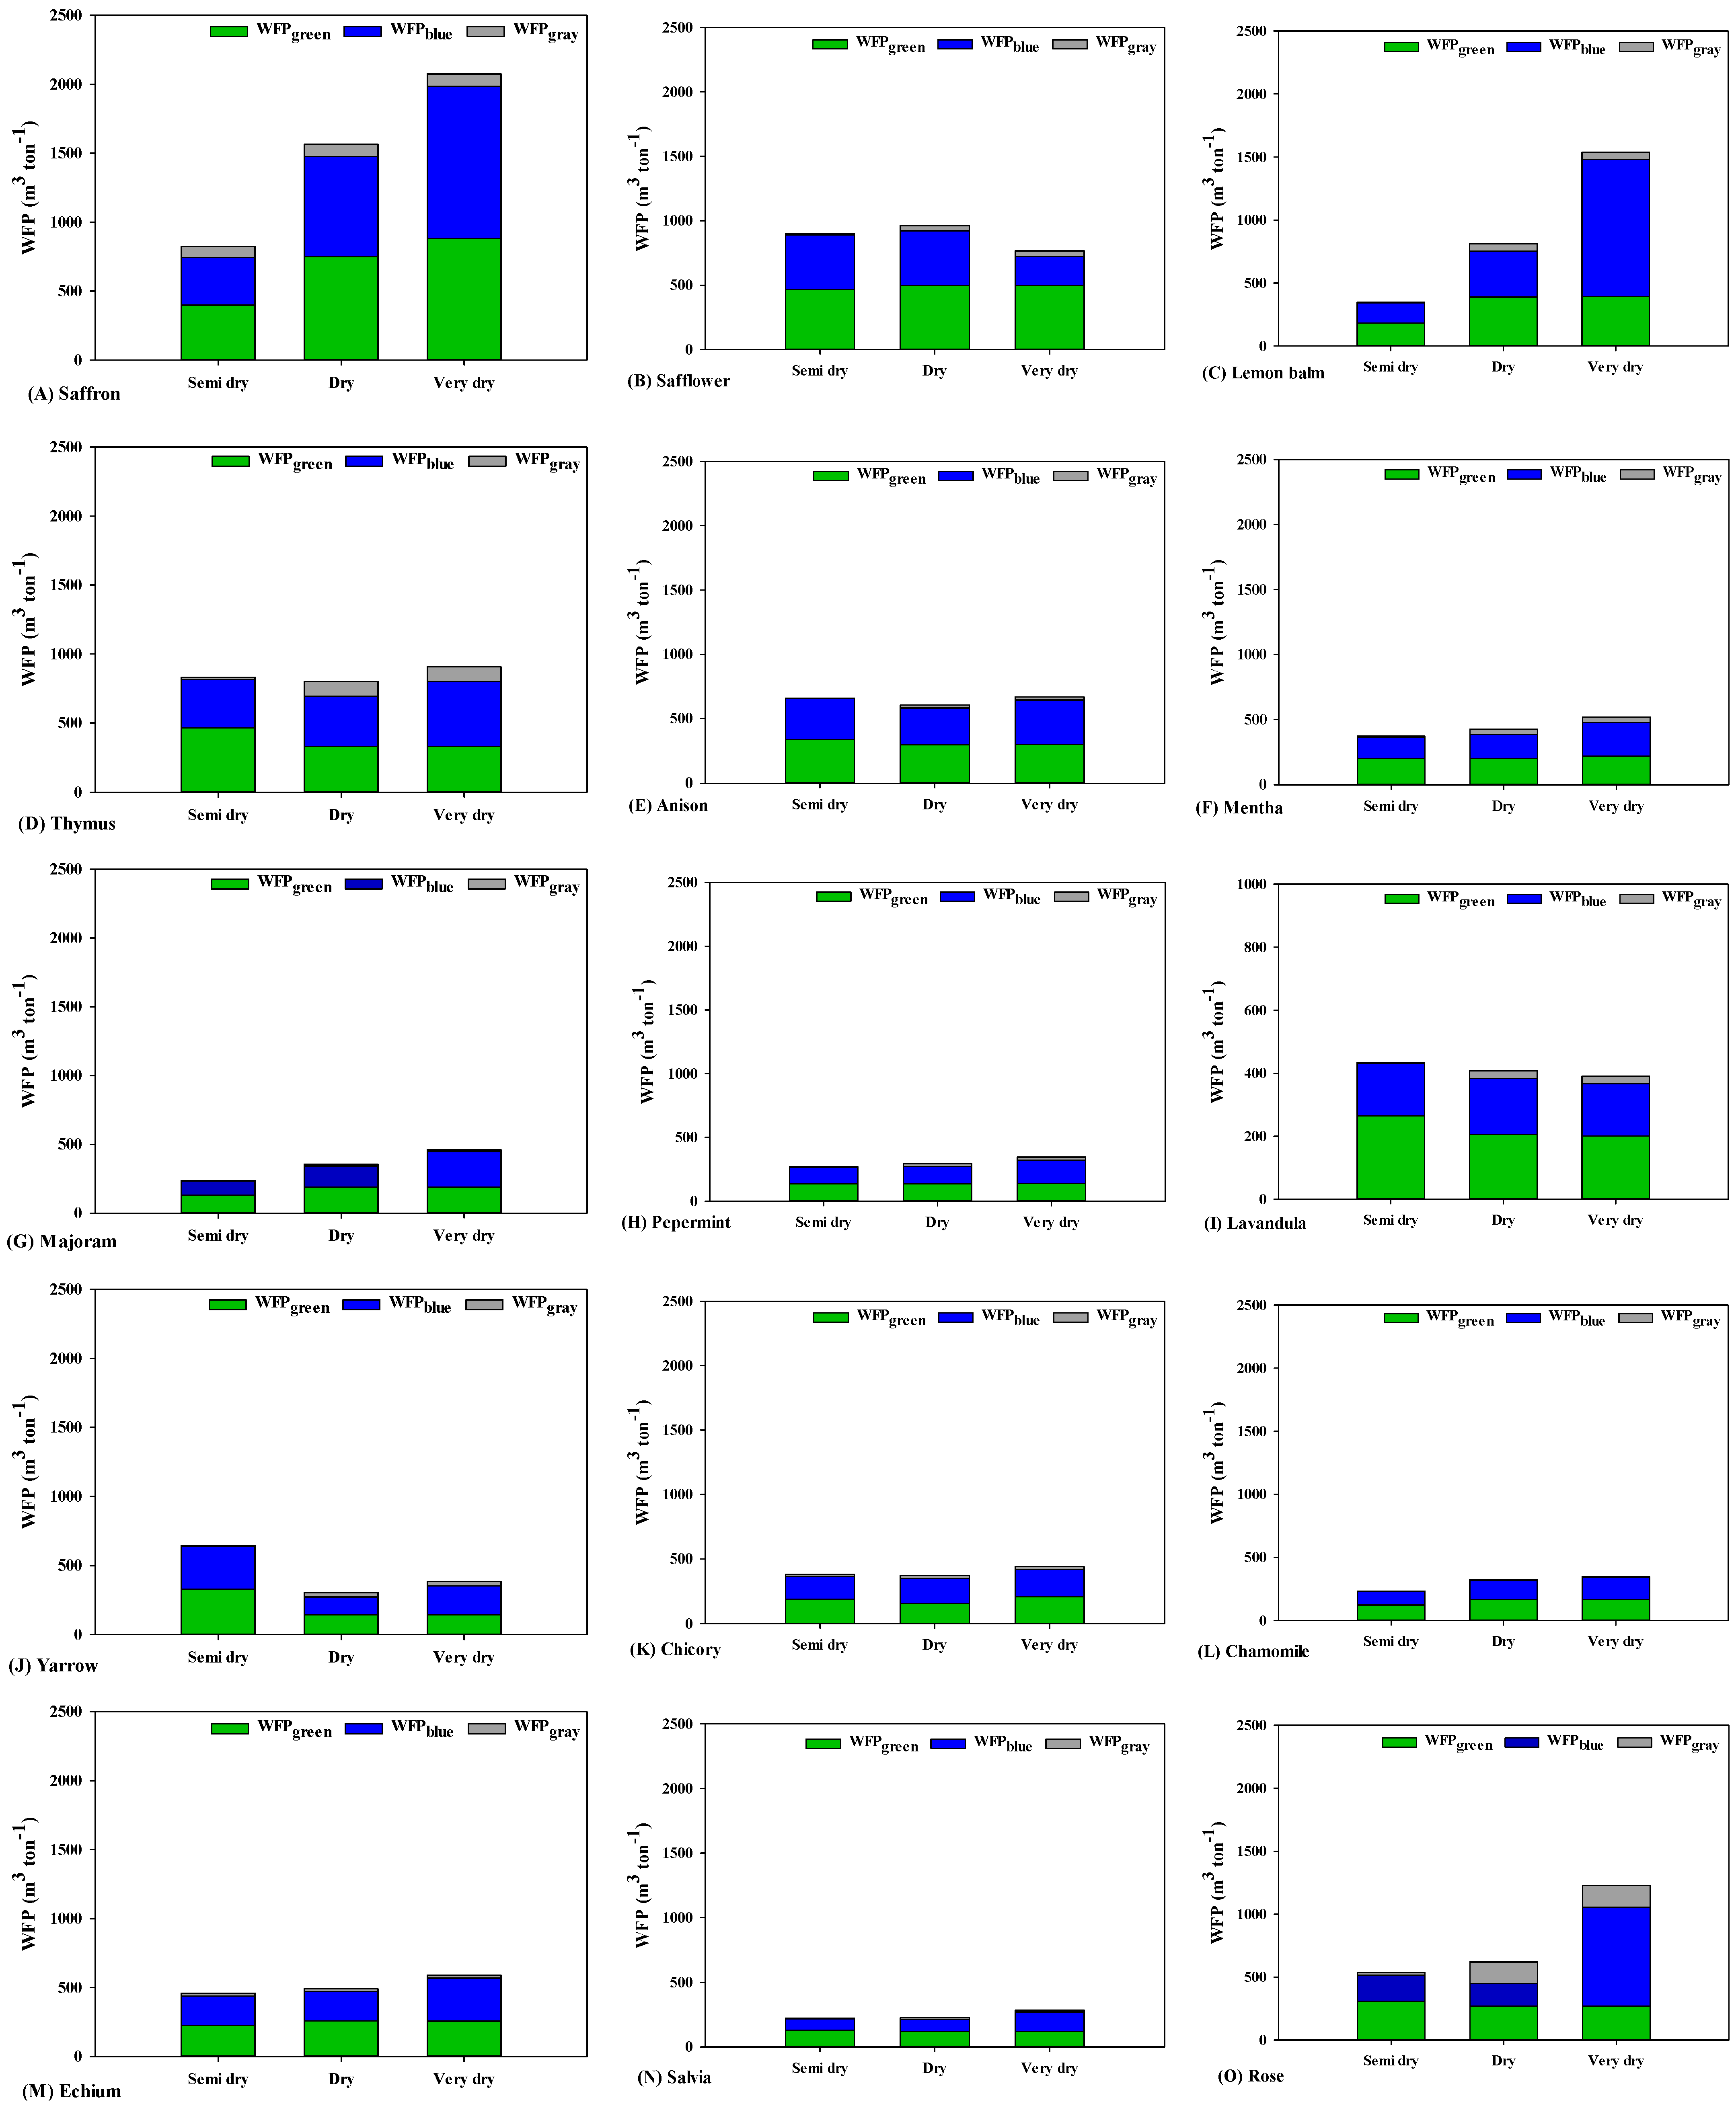
The cultivation of medicinal plants holds substantial value due to the therapeutic and economic benefits they offer. However, the impact of water usage in such cultivation practices, particularly in water-scarce environments, necessitates meticulous investigation. Recent studies [78,79] underscore the importance of adopting sustainable water management strategies in agricultural practices involving water-demanding crops, including medicinal plants. Furthermore, these findings highlight distinctive WFP patterns influenced by climatic differences. Figure 7 presents the WFP values of major medicinal plants cultivated in semidry, dry, and very dry climates. Based on the findings, it is evident that, in semidry climates, peppermint, marjoram, lemon balm, chamomile, and salvia exhibit the lowest WFP values. Similarly, in dry climates, salvia, lemon balm, and peppermint showcase the lowest WFP. Conversely, lavandula demonstrates the highest WFP in semidry climates, while saffron holds this position in dry climates, and saffron, lemon balm, and rose lead in very dry climates.
The observed WFP patterns in semidry climates reveal that peppermint, marjoram, lemon balm, chamomile, and salvia exhibit the lowest WFPs. Similarly, in dry climates, salvia, lemon balm, and peppermint have the lowest WFPs. These findings align with research by Zhang et al. [80], which highlights the WUE potential of certain herbaceous plants like peppermint and chamomile in water-limited regions.
Upon closer examination of the graphs, the most prominent WFPblue traces are associated with rose and lemon balm in very dry climates, while safflower displays the most distinct WFPgreen imprints in dry climates. Intriguingly, the WFPblue traces in rose and lemon balm in very dry climates are more pronounced compared to the WFPgreen traces, and this relationship is reversed. Concerning safflower, the WFPgreen outweighs the WFPblue in dry climates. In both dry and very dry climates, rose stands out with the highest WFPgray readings. In a broader context, considering all three components of WFPblue, WFPgreen, and WFPgray across all three climates simultaneously, the analysis reveals that peppermint and salvia consistently maintain the lowest WFPblue, WFPgreen, and WFPgray values. Conversely, safflower and thymus consistently register the highest WFP values across all three climate categories (refer to Figure 7).
This text discusses the WFP of different medicinal plants in various climatic conditions. It highlights that certain plants like lavandula require more water in semidry climates, while saffron demands more water in dry and very dry climates, emphasizing the challenges of cultivating water-intensive crops in water-scarce regions. The results also emphasize that different plants employ different WUE strategies, with some relying on blue water resources (rose and lemon balm) and others on green water resources (safflower) in arid conditions. These findings align with existing WFP assessment principles. In conclusion, Figure 7 suggests that selecting the right plant species, using appropriate cultivation techniques, and managing water efficiently are crucial for addressing water scarcity issues in medicinal plant cultivation [81,82,83].

4. Conclusions

This in-depth study offers valuable insights into agricultural practices and their environmental consequences, quantifying multiple factors to facilitate informed decision making. The analysis of harvested areas in various climates produced significant results: 19,479 hectares in semidry regions, 18,166 hectares in dry regions, and 41,682 hectares in very dry regions. These figures, combined with the allocation percentages for crops, orchards, and cucurbits, provide a clear depiction of land utilization patterns. The examination of crop water requirements, represented as ETc values, highlights the challenges posed by water scarcity. Crops like alfalfa, maize, and potatoes show high ETc values, emphasizing their resource-intensive cultivation. In contrast, saffron, rose, and grape exhibit lower ETc values, revealing their comparatively efficient water use. Noteworthy findings include canola’s 5355 m3 ton−1 in a dry climate, a stark contrast to the minimal 326 m3 ton−1 attributed to potatoes. These results underscore the importance of carefully selecting crops in water-scarce environments. Additionally, this study elucidates shifting climatic conditions, evident in the precipitation decrease percentages of 69%, 73%, and 92% in semidry, dry, and very dry climates, respectively, over the past 50 years.
In light of these findings, it becomes apparent that dry climates have the highest WFPgreen values, advocating for almond cultivation in such regions. Regarding crops primarily grown in very dry climates, the pomegranate product, with its minimal WFP, is recommended for expanded cultivation. Consequently, the production of wheat, barley, canola, and potatoes in semidry climates offers more favorable conditions in all aspects except for the WFP. Within dry climates, the production of maize, beans, and saffron shows more promising prospects. Furthermore, conditions align more favorably with alfalfa growth in very dry climates. Although no significant distinctions emerge between semidry and dry climates for bean, alfalfa, and potato, and between dry and very dry climates for wheat and saffron, a partial analysis of WFPs suggests that WFPgreen and WFPblue exhibit lower values compared to their counterparts in dry climates. However, with the exception of its WFPgray of 2.5 cubic meters per ton, the WFP in very dry climates surpasses that in dry climates. This emphasizes the urgency of adaptive agricultural strategies to align practices with evolving environmental conditions. Evaluating WFPs across different crops and sectors highlights the importance of sustainable crop choices. Almonds, with varying WFP values, are best suited for dry climates, alongside walnuts and peaches. Safflower, thyme, and other crops consistently demonstrate higher WFP values, underscoring the need for thoughtful cultivation decisions. Conversely, lavandula boasts the highest WFP in semidry climates, saffron leads in dry climates, and saffron, lemon balm, and rose are prominent in very dry climates. These distinct WFP patterns are influenced by specific climatic conditions. In conclusion, the quantified results of this study emphasize the compelling need for balanced resource management and informed decision making in arid regions. By harnessing these insights, policymakers and stakeholders can collaborate to achieve sustainable agricultural practices that ensure food security, conserve water resources, and mitigate environmental challenges.

Author Contributions

S.S. and M.J.N.; conceptualization, methodology, S.S; formal analysis, data curation and visualization, supervision, writing—original draft preparation and editing, F.S.; writing. All authors have read and agreed to the published version of the manuscript.

Funding

This research received no external funding.

Data Availability Statement

Data are available on reasonable request from the first author.

Acknowledgments

This research was conducted through a collaboration between Arak University and the Department of Agriculture of Markazi Province. The authors wish to thank Arak University for giving us the opportunity to carry out this research. We are immensely thankful for the assistance and cooperation of the students of the Agriculture and Environment Faculty, particularly Davoud Khosravi, Mohammad Ashayeri, Arif Jabari Zahra, Majid Naimi, Mohadeseh Hejrati, Mahdieh Soltani, Elham Maleki, Fatemeh Salehi, Fatemeh Sharifdoust, Sara Abbasi, Zahra Heydari, Sara Pouyandeh, and Sara Shahghalei.

Conflicts of Interest

The authors declare no conflict of interest.

References

  1. Horton, P.; Long, S.P.; Smith, P.; Banwart, S.A.; Beerling, D.J. Technologies to deliver food and climate security through agriculture. Nat. Plants 2021, 7, 250–255. [Google Scholar] [CrossRef] [PubMed]
  2. Ferguson, B.R.; Gao, W.-J. PV Interneurons: Critical Regulators of E/I Balance for Prefrontal Cortex-Dependent Behavior and Psychiatric Disorders. Front. Neural Circuits 2018, 12, 37. [Google Scholar] [CrossRef] [PubMed]
  3. Zhang, C.-Y.; Oki, T. Water pricing reform for sustainable water resources management in China’s agricultural sector. Agric. Water Manag. 2023, 275, 108045. [Google Scholar] [CrossRef]
  4. Guterres, A. The Sustainable Development Goals Report 2020; United Nations Department of Economic and Social Affairs: New York, NY, USA, 2020; pp. 1–64. [Google Scholar]
  5. Mekonnen, M.M.; Hoekstra, A.Y. A global and high-resolution assessment of the green, blue and grey water footprint of wheat. Hydrol. Earth Syst. Sci. 2010, 14, 1259–1276. [Google Scholar] [CrossRef]
  6. Sharafi, S.; Ghaleni, M.M. Spatial assessment of drought features over different climates and seasons across Iran. Theor. Appl. Clim. 2022, 147, 941–957. [Google Scholar] [CrossRef]
  7. FAO. The Water-Energy-Food Nexus: A New Approach in Support of Food Security and Sustainable Agriculture; FAO: Rome, Italy, 2014. [Google Scholar]
  8. Haris, M.; Hussain, T.; Mohamed, H.I.; Khan, A.; Ansari, M.S.; Tauseef, A.; Khan, A.A.; Akhtar, N. Nanotechnology—A new frontier of nano-farming in agricultural and food production and its development. Sci. Total Environ. 2023, 857, 159639. [Google Scholar] [CrossRef]
  9. Sharafi, S. Predicting Iran’s future agro-climate variability and coherence using zonation? based PCA. Ital. J. Agrometeorol. 2022, 2, 17–30. [Google Scholar] [CrossRef]
  10. Chaudhary, P.; Chaudhary, A.; Dhaigude, V.; Abou Fayssal, S.; Kumar, P.; Sharma, A.; Chen, S. 13 Environmental-Friendly Nanoparticles in Agriculture. Adv. Nanotechnol. Smart Agric. 2023, 15, 267. [Google Scholar]
  11. Mekonen, B.; Moges, M.; Gelagl, D. Innovative irrigation water-saving strategies to improve water and yield productivity of onions. Int. J. Res. Agric. Sci. 2022, 9, 2348–3997. [Google Scholar]
  12. Hoekstra, A.Y.; Chapagain, A.K. Water footprints of nations: Water use by people as a function of their consumption pattern. Integr. Assess. Water Resour. Glob. Chang. North-South Anal. 2007, 21, 35–48. [Google Scholar] [CrossRef]
  13. Lovarelli, D.; Bacenetti, J.; Fiala, M. Water Footprint of crop productions: A review. Sci. Total Environ. 2016, 548, 236–251. [Google Scholar] [CrossRef]
  14. Caputo, S.; Schoen, V.; Specht, K.; Grard, B.; Blythe, C.; Cohen, N.; Fox-Kämper, R.; Hawes, J.; Newell, J.; Poniży, L. Applying the food-energy-water nexus approach to urban agriculture: From FEW to FEWP (Food-Energy-Water-People). Urban For. Urban Green. 2021, 58, 126934. [Google Scholar] [CrossRef]
  15. Pfister, S.; Bayer, P.; Koehler, A.; Hellweg, S. Projected water consumption in future global agriculture: Scenarios and related impacts. Sci. Total Environ. 2011, 409, 4206–4216. [Google Scholar] [CrossRef]
  16. Chukalla, A.D.; Krol, M.S.; Hoekstra, A.Y. Green and blue water footprint reduction in irrigated agriculture: Effect of irrigation techniques, irrigation strategies and mulching. Hydrol. Earth Syst. Sci. 2015, 19, 4877–4891. [Google Scholar] [CrossRef]
  17. Mcdougall, R.; Kristiansen, P.; Rader, R. Small-scale urban agriculture results in high yields but requires judicious management of inputs to achieve sustainability. Proc. Natl. Acad. Sci. USA 2019, 116, 129–134. [Google Scholar] [CrossRef] [PubMed]
  18. Duarte, R.; Pinilla, V.; Serrano, A. Long term drivers of global virtual water trade: A trade gravity approach for 1965–2010. Ecol. Econ. 2019, 156, 318–326. [Google Scholar] [CrossRef]
  19. Salmoral, G.; Yan, X. Food-energy-water nexus: A life cycle analysis on virtual water and embodied energy in food consumption in the Tamar catchment, UK. Resour. Conserv. Recycl. 2018, 133, 320–330. [Google Scholar] [CrossRef]
  20. Covarrubias, M. The nexus between water, energy and food in cities: Towards conceptualizing socio-material interconnections. Sustain. Sci. 2019, 14, 277–287. [Google Scholar] [CrossRef]
  21. Głowacka, K.; Kromdijk, J.; Kucera, K.; Xie, J.; Cavanagh, A.P.; Leonelli, L.; Leakey, A.D.B.; Ort, D.R.; Niyogi, K.K.; Long, S.P. Photosystem II Subunit S overexpression increases the efficiency of water use in a field-grown crop. Nat. Commun. 2018, 9, 868. [Google Scholar] [CrossRef]
  22. Aldaya, M.M.; Chapagain, A.K.; Hoekstra, A.Y.; Mekonnen, M.M. The Water Footprint Assessment Manual: Setting the Global Standard; Routledge: London, UK, 2012. [Google Scholar]
  23. Hess, T.; Lennard, A.; Daccache, A. Comparing local and global water scarcity information in determining the water scarcity footprint of potato cultivation in Great Britain. J. Clean. Prod. 2015, 87, 666–674. [Google Scholar] [CrossRef]
  24. Deng, G.; Ma, Y.; Li, X. Regional water footprint evaluation and trend analysis of China—Based on interregional input–output model. J. Clean. Prod. 2016, 112, 4674–4682. [Google Scholar] [CrossRef]
  25. Ababaei, B.; Etedali, H.R. Water footprint assessment of main cereals in Iran. Agric. Water Manag. 2017, 179, 401–411. [Google Scholar] [CrossRef]
  26. Zhuo, L.; Hoekstra, A.Y. The effect of different agricultural management practices on irrigation efficiency, water use efficiency and green and blue water footprint. Front. Agric. Sci. Eng. 2017, 4, 185–194. [Google Scholar] [CrossRef]
  27. Behmanesh, J. Determination and evaluation of blue and green water footprint of dominant tillage crops in Urmia lake watershed. J. Water Soil Conserv. 2016, 23, 337–344. [Google Scholar]
  28. Chapagain, A.K.; Hoekstra, A.Y.; Savenije, H.H.G. Water saving through international trade of agricultural products. Hydrol. Earth Syst. Sci. 2006, 10, 455–468. [Google Scholar] [CrossRef]
  29. Shejbalová, Š.; Černý, J.; Vašák, F.; Kulhánek, M.; Balík, J. Nitrogen efficiency of spring barley in long-term experiment. Plant Soil Environ. 2014, 60, 291–296. [Google Scholar] [CrossRef]
  30. FAOSTAT, F.A.O. Food and Agriculture Organization of the United Nations; F.A.O.: Rome, Italy, 2019. [Google Scholar]
  31. Awan, A.B.; Khan, M.; Zubair, M.; Bellos, E. Commercial parabolic trough CSP plants: Research trends and technological advancements. Sol. Energy 2020, 211, 1422–1458. [Google Scholar] [CrossRef]
  32. Shahnazari, A.; Liu, F.; Andersen, M.N.; Jacobsen, S.-E.; Jensen, C.R. Effects of partial root-zone drying on yield, tuber size and water use efficiency in potato under field conditions. Field Crop. Res. 2007, 100, 117–124. [Google Scholar] [CrossRef]
  33. Luedeling, E.; Kunz, A.; Blanke, M.M. Identification of chilling and heat requirements of cherry trees—A statistical approach. Int. J. Biometeorol. 2013, 57, 679–689. [Google Scholar] [CrossRef]
  34. Rosegrant, M.W.; Cai, X.; Cline, S.A.; Nakagawa, N. The Role of Rainfed Agriculture in the Future of Global Food Production; International Food Policy Research Institute: Washington, DC, USA, 2002. [Google Scholar]
  35. FAOSTAT, F.A.O. Food and Agriculture Organization of the United Nations; F.A.O.: Rome, Italy, 2017. [Google Scholar]
  36. Lobell, D.B.; Roberts, M.J.; Schlenker, W.; Braun, N.; Little, B.B.; Rejesus, R.M.; Hammer, G.L. Greater sensitivity to drought accompanies maize yield increase in the U.S. midwest. Science 2014, 344, 516–519. [Google Scholar] [CrossRef]
  37. El Bilali, H.; Allahyari, M.S. Transition towards sustainability in agriculture and food systems: Role of information and communication technologies. Inf. Process. Agric. 2018, 5, 456–464. [Google Scholar] [CrossRef]
  38. Sharafi, S.; Kazemi, A.; Amiri, Z. Estimating energy consumption and GHG emissions in crop production: A machine learning approach. J. Clean. Prod. 2023, 408, 137242. [Google Scholar] [CrossRef]
  39. Choudhury, A.T.M.A.; Kennedy, I.R. Prospects and potentials for systems of biological nitrogen fixation in sustainable rice production. Biol. Fertil. Soils 2004, 39, 219–227. [Google Scholar] [CrossRef]
  40. Lobell, D.B.; Bänziger, M.; Magorokosho, C.; Vivek, B. Nonlinear heat effects on African maize as evidenced by historical yield trials. Nat. Clim. Chang. 2011, 1, 42–45. [Google Scholar] [CrossRef]
  41. Gleeson, T.; Wada, Y.; Bierkens, M.F.P.; Van Beek, L.P.H. Water balance of global aquifers revealed by groundwater footprint. Nature 2012, 488, 197–200. [Google Scholar] [CrossRef] [PubMed]
  42. Kumar, A.; Saha, S.; Das, A.; Babu, S.; Layek, J.; Mishra, V.K.; Singh, R.; Chowdhury, S.; Yadav, D.; Bhutia, T.L. Resource Management for Enhancing Nutrient Use Efficiency in Crops and Cropping Systems of Rainfed Hill Ecosystems of the North-Eastern Region of India. Indian J. Fertil. 2022, 18, 1090–1111. [Google Scholar]
  43. Pereira, L.S.; Cordery, I.; Iacovides, I. Improved indicators of water use performance and productivity for sustainable water conservation and saving. Agric. Water Manag. 2012, 108, 39–51. [Google Scholar] [CrossRef]
  44. Biswas, A.K. Integrated water resources management: Is it working? Int. J. Water Resour. Dev. 2008, 24, 5–22. [Google Scholar] [CrossRef]
  45. Teixeira, E.I.; Fischer, G.; van Velthuizen, H.; Walter, C.; Ewert, F. Global hot-spots of heat stress on agricultural crops due to climate change. Agric. For. Meteorol. 2013, 170, 206–215. [Google Scholar] [CrossRef]
  46. Nazari, B.; Liaghat, A.; Akbari, M.R.; Keshavarz, M. Irrigation water management in Iran: Implications for water use efficiency improvement. Agric. Water Manag. 2018, 208, 7–18. [Google Scholar] [CrossRef]
  47. Krupnik, T.J.; Timsina, J.; Devkota, K.P.; Tripathi, B.P.; Karki, T.B.; Urfels, A.; Gaihre, Y.K.; Choudhary, D.; Beshir, A.R.; Pandey, V.P. Agronomic, socio-economic, and environmental challenges and opportunities in Nepal’s cereal-based farming systems. Adv. Agron. 2021, 170, 155–287. [Google Scholar]
  48. Adesina, I.; Bhowmik, A.; Sharma, H.; Shahbazi, A. A review on the current state of knowledge of growing conditions, agronomic soil health practices and utilities of hemp in the United States. Agriculture 2020, 10, 129. [Google Scholar] [CrossRef]
  49. Zanetti, F.; Monti, A.; Berti, M.T. Challenges and opportunities for new industrial oilseed crops in EU-27: A review. Ind. Crop. Prod. 2013, 50, 580–595. [Google Scholar] [CrossRef]
  50. Mason, M.; Zeitoun, M.; El Sheikh, R. Conflict and social vulnerability to climate change: Lessons from Gaza. Clim. Dev. 2011, 3, 285–297. [Google Scholar] [CrossRef]
  51. Mainuddin, M.; Mojid, M.A.; Scobie, M.; Gaydon, D.; Kirby, M.; Janardhanan, S.; Pena-Arancibia, J.; Kumar, S.; Davies, P.; Schmidt, E. The Regional Hydrological Impact of Farm-Scale Water Saving Measures in the Eastern Gangetic Plains; CSIRO: Canberra, Australia, 2021.
  52. Kukal, M.; Irmak, S. Characterization of water use and productivity dynamics across four C3 and C4 row crops under optimal growth conditions. Agric. Water Manag. 2020, 227, 105840. [Google Scholar] [CrossRef]
  53. Jacobsen, S.-E.; Jensen, C.R.; Liu, F. Improving crop production in the arid Mediterranean climate. Field Crop. Res. 2012, 128, 34–47. [Google Scholar] [CrossRef]
  54. Zhou, L.-Y.; Zhu, Y.; Kan, Z.-R.; Li, F.-M.; Zhang, F. The impact of crop residue return on the food–carbon–water–energy nexus in a rice–wheat rotation system under climate warming. Sci. Total Environ. 2023, 894, 164675. [Google Scholar] [CrossRef]
  55. Shah, F.; Wu, W. Soil and crop management strategies to ensure Higher crop productivity within sustainable environments. Sustainability 2019, 11, 1485. [Google Scholar] [CrossRef]
  56. Blum, A. Effective use of water (EUW) and not water-use efficiency (WUE) is the target of crop yield improvement under drought stress. Field Crop. Res. 2009, 112, 119–123. [Google Scholar] [CrossRef]
  57. Kapoor, D.; Bhardwaj, S.; Landi, M.; Sharma, A.; Ramakrishnan, M.; Sharma, A. The impact of drought in plant metabolism: How to exploit tolerance mechanisms to increase crop production. Appl. Sci. 2020, 10, 5692. [Google Scholar] [CrossRef]
  58. Ness, D.A.; Xing, K. Toward a resource-efficient built environment: A literature review and conceptual model. J. Ind. Ecol. 2017, 21, 572–592. [Google Scholar] [CrossRef]
  59. Ives, C.; Pan, H.; Edwards, S.W.; Nelms, M.; Covert, H.; Lichtveld, M.Y.; Harville, E.W.; Wickliffe, J.K.; Zijlmans, W.; Hamilton, C.M. Linking complex disease and exposure data—Insights from an environmental and occupational health study. J. Expo. Sci. Environ. Epidemiol. 2023, 33, 12–16. [Google Scholar] [CrossRef] [PubMed]
  60. Mwongera, C.; Shikuku, K.M.; Twyman, J.; Läderach, P.; Ampaire, E.; Van Asten, P.; Twomlow, S.; Winowiecki, L.A. Climate smart agriculture rapid appraisal (CSA-RA): A tool for prioritizing context-specific climate smart agriculture technologies. Agric. Syst. 2017, 151, 192–203. [Google Scholar] [CrossRef]
  61. Fan, X.; Zhang, W.; Chen, W.; Chen, B. Land–water–energy nexus in agricultural management for greenhouse gas mitigation. Appl. Energy 2020, 265, 114796. [Google Scholar] [CrossRef]
  62. Gorripati, R.; Thakur, M.; Kolagani, N. Promoting Climate Resilient Sustainable Agriculture Through Participatory System Dynamics with Crop-Water-Income Dynamics. Water Resour. Manag. 2023, 37, 3935–3951. [Google Scholar] [CrossRef]
  63. Sanga, U. Beyond Adaptation: Exploring Transformative Pathways to Socio-Ecological Resilience in Agricultural Systems in Mali; Michigan State University: East Lansing, MI, USA, 2020. [Google Scholar]
  64. Elliott, J.; Deryng, D.; Müller, C.; Frieler, K.; Konzmann, M.; Gerten, D.; Glotter, M.; Flörke, M.; Wada, Y.; Best, N.; et al. Constraints and potentials of future irrigation water availability on agricultural production under climate change. Proc. Natl. Acad. Sci. USA 2014, 111, 3239–3244. [Google Scholar] [CrossRef] [PubMed]
  65. Elleuch, M.A.; Anane, M.; Euchi, J.; Frikha, A. Hybrid fuzzy multi-criteria decision making to solve the irrigation water allocation problem in the Tunisian case. Agric. Syst. 2019, 176, 102644. [Google Scholar] [CrossRef]
  66. Wang, W.; Wang, J.; Cao, X. Water use efficiency and sensitivity assessment for agricultural production system from the water footprint perspective. Sustainability 2020, 12, 9665. [Google Scholar] [CrossRef]
  67. Deepa, R.; Anandhi, A.; Alhashim, R. Volumetric and impact-oriented water footprint of agricultural crops: A review. Ecol. Indic. 2021, 130, 108093. [Google Scholar] [CrossRef]
  68. Tahiri, A.Z.; Carmi, G.; Ünlü, M. Promising water management strategies for arid and semiarid environments. In Landscape Architecture-Processes and Practices towards Sustainable Development; IntechOpen: London, UK, 2020. [Google Scholar] [CrossRef]
  69. Wang, W.; Straffelini, E.; Pijl, A.; Tarolli, P. Sustainable water resource management in steep-slope agriculture. Geogr. Sustain. 2022, 3, 214–219. [Google Scholar] [CrossRef]
  70. Forin, S.; Mikosch, N.; Berger, M.; Finkbeiner, M. Organizational water footprint: A methodological guidance. Int. J. Life Cycle Assess. 2020, 25, 403–422. [Google Scholar] [CrossRef]
  71. Xu, X.; Zhang, Y.; Li, Y.; Liao, S.; Sun, Y.; Liu, F. Supplemental light and silicon improved strawberry fruit size and sugars concentration under both full and deficit irrigation. Sci. Hortic. 2023, 313, 111912. [Google Scholar] [CrossRef]
  72. Haque, A.K.E.; Mukhopadhyay, P.; Nepal, M.; Shammin, M.R. Communities, Climate Change Adaptation and Win–Win Solutions. Clim. Change Community Resil. 2022, 445. [Google Scholar] [CrossRef]
  73. Lima, V.P.; de Lima, R.A.F.; Joner, F.; Siddique, I.; Raes, N.; ter Steege, H. Climate change threatens native potential agroforestry plant species in Brazil. Sci. Rep. 2022, 12, 2267. [Google Scholar] [CrossRef]
  74. Altieri, M.A.; Koohafkan, P. Enduring Farms: Climate Change, Smallholders and Traditional Farming Communities; Third World Network (TWN): George, Malaysia, 2008; Volume 6. [Google Scholar]
  75. Shi, X.; Zhao, J.; Jia, H.; Zhao, J.; Lu, J.; Zhao, M.; Chu, Q. Seeking sustainable pathway of crop production by optimizing planting structures and management practices from the perspective of water footprint. Sci. Total Environ. 2022, 843, 157091. [Google Scholar] [CrossRef]
  76. Wineland, S.M.; Bașağaoğlu, H.; Fleming, J.; Friedman, J.; Garza-Diaz, L.; Kellogg, W.; Koch, J.; Lane, B.A.; Mirchi, A.; Nava, L.F.; et al. The environmental flows implementation challenge: Insights and recommendations across water-limited systems. WIREs Water 2021, 9, e1565. [Google Scholar] [CrossRef]
  77. Muhie, S.H. Novel approaches and practices to sustainable agriculture. J. Agric. Food Res. 2022, 10, 100446. [Google Scholar] [CrossRef]
  78. Fulton, J.; Cooley, H. The water footprint of California’s energy system, 1990–2012. Environ. Sci. Technol. 2015, 49, 3314–3321. [Google Scholar] [CrossRef]
  79. Velasco-Muñoz, J.F.; Aznar-Sánchez, J.A.; Belmonte-Ureña, L.J.; Román-Sánchez, I.M. Sustainable water use in agriculture: A review of worldwide research. Sustainability 2018, 10, 1084. [Google Scholar] [CrossRef]
  80. Zhang, S.; Chen, S.; Hu, T.; Geng, C.; Liu, J. Optimization of irrigation and nitrogen levels for a trade-off: Yield, quality, water use efficiency and environment effect in a drip-fertigated apple orchard based on TOPSIS method. Sci. Hortic. 2023, 309, 111700. [Google Scholar] [CrossRef]
  81. Fujimori, S.; Wu, W.; Doelman, J.; Frank, S.; Hristov, J.; Kyle, P.; Sands, R.; van Zeist, W.-J.; Havlik, P.; Domínguez, I.P.; et al. Land-based climate change mitigation measures can affect agricultural markets and food security. Nat. Food 2022, 3, 110–121. [Google Scholar] [CrossRef] [PubMed]
  82. Bazrafshan, O.; Etedali, H.R.; Moshizi, Z.G.N.; Shamili, M. Virtual water trade and water footprint accounting of Saffron production in Iran. Agric. Water Manag. 2019, 213, 368–374. [Google Scholar] [CrossRef]
  83. Castillo, R.M.; Feng, K.; Sun, L.; Guilhoto, J.; Pfister, S.; Miralles-Wilhelm, F.; Hubacek, K. The land-water nexus of biofuel production in Brazil: Analysis of synergies and trade-offs using a multiregional input-output model. J. Clean. Prod. 2019, 214, 52–61. [Google Scholar] [CrossRef]
Figure 1. Geographical situation of sampling points in studied farms.
Water 16 01311 g001
Figure 2. The values of the important crops’ water footprint in (A) semidry, (B) dry, and (C) very dry climates.
Water 16 01311 g002aWater 16 01311 g002b
Figure 3. The comparison of WFPs of the major crops in different climates.
Water 16 01311 g003aWater 16 01311 g003b
Figure 4. The comparison of the WFPs of the major orchards in different climates.
Water 16 01311 g004aWater 16 01311 g004b
Figure 5. The comparison of the WFPs of cucurbit crops in different climates.
Water 16 01311 g005
Figure 6. The WFPs of apricot, pistachio, and pomegranate in the very dry climate.
Water 16 01311 g006
Figure 7. The WFPs of major medicinal plants in different climates.
Water 16 01311 g007
Table 1. The geographical, climatic, and hydrological conditions of the examined plains.
Geographical Situation
LongitudeLatitudeElevation (m)Area (km−2)ClimatePlain Condition
Shazand49.2533.571913984SemidryForbidden
Khomein50.0533.3718342126DryForbidden
Saveh50.2035.0311084066Very dryCritical forbidden
Climatic Situation
Tmin (°C)Tmax (°C)Tmean (°C)P (mm w−1)Srad (Mj m−2 d−1)ETref (mm w−1)
Shazand4.7119.412.088.2416.0527.99
Khomein6.521.613.75.1718.8733.51
Saveh12.6924.0318.033.5522.7654.95
Hydrological Situation
WD (mm w−1)Run OffR-CoefficientAridity indexAD 1AARD 2
Shazand19.75799.911.67−10.212.9
Khomein28.34310.741.03−1.20.498.2
Saveh51.4143.910.68−1.626.161.7
Note(s):1. Annual drop in meters. 2. Average annual MCM reservoir deficit.
Table 2. The application rate of N fertilizer and Alpha index * (α) for each crop.
CropsFertilizer Usage (kg ha−1)αOrchardFertilizer Usage (kg ha−1)αCucurbit CropsFertilizer Usage (kg ha−1)α
Wheat34540Almond7017Cucumber41052
Barley33950Walnut7518Melon15030
Maize57040Grape6018Watermelon28430
Bean15021Apricot6015
Alfalfa12517Cherry8029
Canola35040Peach15021
Potato17823Pistachio10037
Saffron10040Pomegranate6012
Apple12018
Rose00
Notes: * The Alpha index is an index which defines as α amount of N leaching [29]. * The cultivation management of medicinal plants was organic.
Table 3. The agricultural status of different climates.
SemidryDry Very Dry
CropHarvested Area (ha)Production (ton)Yield (kg ha−1)Harvested Area (ha)Production (ton)Yield (kg ha−1)Harvested Area (ha)Production (ton)Yield (kg ha−1)
Wheat750033,7504500610024,4004000980040,1804100
Barley200080004000420016,3803900600018,0003000
Canola501503000135175.513006007201200
Bean30007500250027076767.525002003601800
Alfalfa400026,0006500197515,8008000260031,20012,000
Maize23092040,00024310,69244,0003000105,00035,000
Potato38011,40030,00065208032,00070021,00030,000
Saffron550.224.675.660.344.580.0344.3
Almond418501.61200812974120089012,4601400
Walnut268482.41800168302180059610,782.81800
Grape72910,20614,00079211,88015,000319350911,000
Cherry897128000393128000134.511718706
Peach3134111,0003140313,000105147014,000
Apple397595515,000273682525,0008691527.517,500
Pistachio1903802000135.9407.7300034194444.71300
Pomegranate>5>12420>5>12850980226,955.52750
Apricot>5>11750>5>11610507.58536.216,820
Rose>5>1150>5>13006212402000
Cucumber512525,0002460025,000120300025,000
Melon>5>112,0001339030,000170028,90017,000
Watermelon120420035,00036312,70535,000250625025,000
Lemon balm>5>13500>5>13500>5>13400
Thymus>5>12800>5>12800>5>12100
Safflower>5>1820>5>1925>5>11100
Anison>5>1950>5>1820>5>1650
Echium>5>1450>5>1450>5>1450
Mentha>5>14000>5>14000>5>12563
Yarrow>5>11300>5>11300>5>11200
Marjoram>5>11800>5>11800>5>12150
Chicory>5>13400>5>13426>5>12560
Lavandula>5>1450>5>1450>5>1500
Chamomile>5>11200>5>11200>5>11300
Peppermint>5>13100>5>13000>5>13200
Salvia>5>12500>5>12400>5>12200
Table 4. ETc, water requirement, and EP in different climates.
SemidryDryVery Dry
CropETcWREPETcWREPETcWREP
Wheat400.8342.158.7467.7418.449.3453.6417.536.2
Barley330.0271.358.7426.1376.849.3414.9378.736.2
Canola354.9296.258.7349.4300.149.3369.9333.736.2
Bean386.3386.32.3359.6359.61.3335.2335.21.0
Alfalfa680.2621.558.7820.2780.539.7953.3917.136.2
Maize531.1531.11.3585.4585.40.0591.8591.80.0
Potato469.9469.91.0529.6529.60.0611.0611.00.0
Saffron195.5136.858.7311.1261.849.3304.8268.736.2
Almond650.6624.436.3684.0670.634.1833.4809.531.3
Walnut642.7616.530.5652.5639.125.2789.8765.923.5
Grape513.4500.926.2579.2565.823.7657.1633.221.9
Cherry688.5662.333.2704.4690.929.4897.6873.727.4
Peach612.3586.127.4648.9635.525.7797.1773.225.8
Apple653.8627.627.1655.6642.226.4887.0863.126.7
Pistachio590.2563.930.4620.6407.727.9863.8852.512.6
Pomegranate490.6546.918.6526.0601.314.3656.0644.710.7
Apricot489.4648.425.4559.4681.323.1753.9730.022.9
Rose343.4462.934.0410.3510.727.3563.3539.423.0
Cucumber685.0685.02.3713.1706.96.2877.8866.417.6
Melon550.4473.21.0545.5545.52.3602.8591.410.7
Watermelon607.5607.52.0578.2578.27.2627.5616.215.5
Disclaimer/Publisher’s Note: The statements, opinions and data contained in all publications are solely those of the individual author(s) and contributor(s) and not of MDPI and/or the editor(s). MDPI and/or the editor(s) disclaim responsibility for any injury to people or property resulting from any ideas, methods, instructions or products referred to in the content.