Article

Wastewater Treatment Technology for Sustainable Tourism: Sunny Beach, Ravda WWTP Case Study

by
Magdalena Bogdanova
1,
Ivaylo Yotinov
1,2,*,
Yana Topalova
1,2 and
Valentina Lyubomirova
2,3
1
Faculty of Biology, Sofia University “St. Kliment Ohridski”, 1164 Sofia, Bulgaria
2
Center of Competence “Clean Technologies for Sustainable Environment–Water, Waste, Energy for Circular Economy”, 1000 Sofia, Bulgaria
3
Faculty of Chemistry and Pharmacy, Sofia University “St. Kliment Ohridski”, 1164 Sofia, Bulgaria
*
Author to whom correspondence should be addressed.
Water 2025, 17(1), 7; https://doi.org/10.3390/w17010007
Submission received: 25 November 2024 / Revised: 18 December 2024 / Accepted: 20 December 2024 / Published: 24 December 2024

Abstract

:
The sustainable management of water resources is crucial for maintaining high-quality tourism, as it ensures the availability and reuse of water through effective wastewater treatment processes. This requires the implementation of technologies and circular measures for managing water resources. In this context, the present study focuses on the Ravda Wastewater Treatment Plant (WWTP), which treats the wastewater of the largest coastal resort in Bulgaria, Sunny Beach. Data from seven consecutive years (2018–2024), including the years of COVID-19 measures, have been analyzed. Particular attention has been paid to analysis during the last two years of this study. For the period 2018–2022, hydrochemical parameters (total nitrogen and total phosphorus, volumetric load of activated sludge/volumetric organic load) and technological parameters (treatment efficiency, COD/BOD5) were examined. In 2023 and 2024, additional parameters such as the SVI, comparative microscopic analysis of activated sludge, dynamics and quantities of aerobic and anaerobic heterotrophic bacteria and denitrifying bacteria, the abundance of genera Pseudomonas and Acinetobacter, and the elemental composition of the water at the inlet and outlet of the treatment plant, were studied. Samples were taken from five critical control points in the course of the treatment process during the off-season, in April and November, when the plant operates with a reduced number of facilities. The aim of this study is to determine the efficiency of water treatment during the off-season and the possibility of its enlargement and improvement to meet the needs during the high season. Overall, the results of the comprehensive analyses show that the biotechnological system has significant biodegradation potential but requires improvement due to large fluctuations in the number of residents. The socio-economic and environmental situation in the area is extremely dynamic, necessitating the introduction of innovative wastewater treatment measures to balance the negative impact on the environment and ensure the sustainability of high-quality tourism.

1. Introduction

The relationship between the sustainable functioning of marine tourism and the management of water resources, particularly water purification, has been examined by numerous authors from various perspectives [1,2,3,4,5,6,7,8,9,10,11,12,13]. Several prominent issues have been highlighted in this context. Firstly, the increasing demand for fresh water and the production of larger quantities of wastewater is highlighted [5,14,15]. Secondly, the pursuit and achievement of a balance between water purification, the discharge of treated water into receiving bodies, and the preservation of the ecosystem health, including seas, rivers, and oceans, is discussed [6,16,17,18,19]. Thirdly, the shortage of fresh water and the increase in its consumption are linked to the requirements of the Water Framework Directive (WFD) for maintaining and improving the quality of water in receiving bodies [3,20,21,22,23,24]. This is also related to maintaining the ecological and sanitary standards of bathing waters in the recreational zones of tourist complexes [25]. Fourthly, mass tourism is seasonal, and the volume and pollution of wastewater depend on whether it is the summer or winter season. It is known that the tourism industry consumes between 84 and 2000 L per tourist per day, or up to 3423 L per room per day [4,7,20]. Fifthly, the systemic shortage of fresh water nowadays necessitates the introduction of Environmental, Social, and Governance (ESG) standards and the principles of the circular economy in the tourism sector [26,27,28,29,30,31]. Sixthly, the principles of the circular economy are also applied in the use of sludge from wastewater treatment in two directions: minimizing sludge through specialized wastewater treatment processes, controlling pathogens and toxic substances, and reusing it either for energy production or after composting and drying on drying fields for fertilization or other purposes according to introduced innovations [32,33,34,35]. Seventhly, a critical issue in water treatment and the control of processes and the quality of treated wastewater is the presence of toxic substances (contaminants of emerging concern, CECs). These are residues of pharmaceuticals, antibiotics, fuel residues, PFAS, steroid hormones, detergents, microplastics and nanoplastics of various types and morphologies, residues of personal care products, and other industrial chemicals [3,14,36]. They remain in the treated water, thereby hindering the reuse of water or, when entering receiving bodies, permanently affecting the ecosystem and human health [37,38,39] and reducing the quality and demand for the tourism product [14,40,41]. Although present in low concentrations of effluents, these contaminants have a significant impact due to their strong influence on the physiological processes and overall metabolism of ecosystems related to tourism. Addressing these issues involves targeted control, the creation of innovative detoxification modules in conventional treatment plants, and/or the adaptation of biological treatment systems such as activated sludge and biofilms. Adaptation is aimed at the targeted elimination of toxicants from wastewater [42]. This is typically achieved by incorporating targeted detoxification processes during treatment. It is known that specialized xenobiotic-degrading bacteria, primarily from the genera Pseudomonas and Acinetobacter, can proliferate in activated sludge and biofilms. These bacteria, due to their powerful biodegradation and adaptation potential, can degrade the aforementioned xenobiotics during treatment processes in WWTP and self-purification processes in receiving bodies [21,42]. In this regard, microbiological control and the characteristics of activated sludge and other active microbial communities play a key role in managing detoxification processes within the overall treatment process, where carbon-, nitrogen-, and phosphorus-containing conventional pollutants are simultaneously eliminated with toxic pollutants [14,43]. Eighthly, an important role in the simultaneous development of the tourism and water management sectors is played by the environmental education and culture of the employed staff and the management of tourist complexes. From this perspective, the presence of scientific articles linking the two sectors is an important factor, contributing to achieving significant results in the aforementioned sectors [25,44,45]. Information is usually obtained based on case studies, which are good examples and practices for the joint and mutually conditioned development of tourism and water cycles, including wastewater treatment technologies [8,46].
In the present article, a case study of the operation of the Ravda WWTP is examined, which centrally treats the waters from the resorts of Sunny Beach, Ravda; Nessebar, Aheloy; the village of Tankovo; the village of Kosharitsa; and part of St. Vlas. The wastewater treatment process is reviewed and evaluated over a seven-year period from 2018 to 2024. The focus is on its operation during the off-season in the winter period. The wastewater treatment is assessed based on technological, chemical, and biotechnological indicators. It is essential to note that during the study period, various socio-economic events have influenced the load of pollutants entering the treatment plant and, consequently, the overall treatment process. In 2019–2020, tourism products and water pollution were affected by the consequences of the COVID-19 pandemic. This is associated, on one hand, with a significant reduction in tourists and transport services, but, on the other hand, an increase in the volumes of water used with pollutants/disinfectants and pharmaceutical preparations, including steroids.
During the years of recovery and an economic boom (2021–2022), a new socio-economic environment of intensive economic revival and tourism growth emerged. After 2022, particularly in the summer season of 2022–2023, the load on the waters and their volume significantly increased due to the rise in the number of tourists, transport activities, and industrial activities necessary to support a quality tourism product. In addition, it is important to note the effect of the war in Ukraine on the Bulgarian Black Sea coast. Since the conflict began, approximately 1.1 million Ukrainian refugees have entered Bulgaria, significantly impacting the country’s wastewater management systems. As of September 2023, around 167,478 Ukrainians have registered for temporary protection, with 55,153 still remaining in the country [47,48]. In the Burgas area alone (where Sunny Beach is located), approximately 10,000 Ukrainian refugees are residing, including those in state-funded accommodations [49]. This influx has increased the volume of wastewater, necessitating enhanced treatment processes to ensure that the treated water, which flows into the Black Sea, meets environmental standards. Together with this, in the resort of Sunny Beach, there were 947,586 tourists accommodated and a total of 4,975,299 overnight stays in the 2023 season, which is almost 5% more than in 2022 and 65% more than in 2021 [50]. This growth is significant and calls for new measures to manage water resources. It is also important to note the economic need for these changes, as tourism accounts for 14% of the country’s gross domestic product (2023 data) [50].
At the Ravda WWTP, the larger volume of polluted water and the increased load of pollutants are managed by expanding the WWTP with additional facilities and enhancing the efficiency of the treatment process through accelerated nitrification, denitrification, phosphorus elimination and strict biotechnological control of wastewater treatment technology. Concurrently, indicators are used to monitor the reduction in pollutant toxicity during treatment. In the last year, 2024, microbiological control has been intensified to identify and propose additional mechanisms to enhance the depth of the biodegradation process for eliminating biogens and toxic industrial pollutants from the wastewater of the Sunny Beach tourist complex.
The present study uses data from seven consecutive years (2018–2024), including the years of COVID-19 measures. Particular attention has been paid to analysis during the last two years of the study. For the period 2018–2022, hydrochemical parameters (total nitrogen and total phosphorus, volumetric load of activated sludge/volumetric organic load) and technological parameters (treatment efficiency, COD/BOD5) were examined. In 2023 and 2024, additional parameters such as the SVI; comparative microscopic analysis of the activated sludge; dynamics and quantities of aerobic and anaerobic heterotrophic bacteria, denitrifying bacteria, and bacteria from the genera Pseudomonas and Acinetobacter; and the elemental composition of the water at the inlet and outlet of the treatment plant, were studied. Samples were taken from five critical control points in the course of the treatment process during the off-season in November, just after the tourist season (May–October) and April, just before the opening of the hotels. This study examines the adaptive potential of the biotechnological system in two very important periods–in November (when the biotechnological system contracts after the intensive summer season) and in May (when the system has been operating in a reduced mode during the winter season and needs to expand before the summer season). In other words, this study was conducted at the end of the old active tourist season and the beginning of the new tourist season. It is essential to know if the wastewater can be sufficiently purified at the moment of switching on and off some of the equipment so it will not harm the recreation zone.

2. Materials and Methods

The Ravda WWTP is located between the town of Aheloy and the village of Ravda, Bulgaria, 300 m from tourist complexes and 200 m from Avata Beach with its adjacent campsite (Figure 1). It is strategically positioned to serve the agglomeration of Nessebar —Sunny Beach—Ravda, collecting and treating wastewater from these resort areas. Additionally, it receives wastewater from Aheloy, the villages of Kosharitsa and Tankovo, and partially from the resort complex of St. Vlas. This treatment plant is crucial for maintaining the cleanliness of the seawater and the environment in the region, which is essential for tourism and local residents.
The plant operates with two treatment lines, one with bio-basins and the other with sequencing batch reactors (SBRs). This allows for the facilities to be turned on and off according to the number of tourists. The treated water is discharged into the Black Sea through two pipes, each 2.5 km long and 18 m deep.
There are numerous WWTPs in tourism areas globally [1,2,3,16,25,28,30,43]. However, none utilize the same technology as Ravda WWTP. Its unique design, featuring two operational lines that can function independently or together during peak summer months, distinguishes it and was a key factor in selecting it for our research.
The plant has four SBRs that operate only in summer, and two bio-basins that operate all year round. In addition to the biological treatment with activated sludge, the quality of the water treatment is also controlled by the addition of ferric chloride (FeCl3) in the phosphorus release basin, which optimizes the adaptive potential of the treatment plant. This not only removes excess phosphate in the water but also supports the coagulation process, important for the removal of heavy metals. Detailed schema of Ravda WWTP with all its facilities is shown on Figure 2.

2.1. Samplings

For the period 2018–2022, average values for the operation of the WWTP were taken for April and November. In 2023 and 2024 two samplings were performed prior to the 2024 summer tourist season. One was just after the end of the 2023 season, on 1 November 2023, and the other just before the next season, on 15 April 2024. In both sampling events, the Ravda WWTP was operating in the technologically reduced winter mode scheme shown in Figure 2. The samples were taken from five critical control points: inlet (1), phosphorus release basin (2), denitrification basin (3), nitrification basin (4), and outlet (5), as shown in Figure 2.
In this figure, the period from November to April is marked as the “off-season”, as there are no tourists and the hotels are closed. The period from May to October is the active tourist season, which is divided into two periods: the months of May, June, September, and October are referred to as the “shoulder season” or “low season”, when the volume of tourists is lower; during the months of July and August, the hotels operate at full or near-full capacity, hence it is designated as the “high season”.

2.2. Analyzed Parameters and Methods

In order to assess the content of chemical elements in the wastewater samples and the degree of their removal during the wastewater treatment process, the concentrations of 70 elements in the influent and effluent were determined. The analysis of the chemical elements in the wastewater samples was performed using ICP-MS (Perkin-Elmer SCIEX Elan DRC-e) with a cross-flow nebulizer after acid digestion with HNO3/H2O2 mixture. The sample preparation procedure is described in detail by Valchev et al. [51] and the ICP-MS instrumental parameters (ICP-RF power, Ar gas flow, lens voltage, detector voltage) and the isotopes, used for element analysis, are described by Lyubomirova et al. [52]. The estimation of accuracy was performed by the analysis of wastewater CRM LGC6177 and surface water RM SPS-SW2 and NWTM-23.5.
During the adaptation, technological, hydrochemical, and microbiological parameters were analyzed. From the technological parameters, dry matter and sludge volume index (SVI) were analyzed, which gives information about the presence or the absence of structural deformation of the activated sludge. SVI was analyzed according to BDS EN 14702-1:2006 [53]. It presents the volume in mL, which occupies 1 g of sludge after 30 min of precipitation.
From the hydrochemical parameters, the chemical oxygen demand (COD) that indicates the organic content in the wastewater and its assimilation during the process has been analyzed. COD was determined by method with potassium dichromate (K2Cr2O7) and sample heating in presence of sulfuric acid (H2SO4) [54]. In addition, the BOD5 (according to BDS EN ISO 5815-1:2019) [55], the total nitrogen (TN) (according to BDS EN 25663:2000) [56], and total phosphorus (TP) (according to 58. BDS EN ISO 6878:2005), were analyzed [57].
For a determination of the effectiveness (Eff) of the organic matter decrease (measured by COD, BOD5, TN, and TP) the following formula was used (Equation (1)):
E f f = C t 1 C t 2 C t 1 × 100 ,   %  
where Ct1 is the value of the COD in the influent and Ct2 is the value of the COD in the effluent.
The volumetric load of the activated sludge is calculated using the following formula (Equation (2)):
F M = Q × B O D 5   M L S S × V  
where Q is the flow rate of sewage, MLSS is the mixed liquor suspended solid, and V is the volume of aeration tank.
The volumetric organic load is calculated using the following formula (Equation (3)):
R w B O D 5 × Q W ,   g B O D / m 3 . d
The coefficient (K) is an indicator of the biodegradability of organic substances in water. It is calculated as the ratio between the BOD5 for 5 days and COD. This indicator can assess how many hard-to-degrade and non-degradable pollutants are present in the water. It is particularly suitable for evaluating the presence of toxic substances. The formula is (Equation (4)):
K = B O D 5 ÷ C O D
This coefficient provides information on the degree of biodegradability of organic pollutants in wastewater. A high value of K indicates that most of the organic substances are biodegradable, while a low value may indicate the presence of hard-to-degrade or toxic substances.
Comparative microscopic analysis of the activated sludge was performed using a light microscope Carl Zeiss Axiolab E re at 100× magnification.
From the microbiological parameters, the quantity of heterotrophic bacteria (aerobic and anaerobic), denitrification bacteria, and bacteria from genera Pseudomonas and Acinetobacter was analyzed. For this, activated sludge is subjected to ultrasonic disintegration, after which 1 mL of the homogenic bacterial suspension is taken and serially diluted with 9 mL of saline solution in 15 mL test tubes in a sterile environment.
The quantitative analysis of microorganisms was carried out by growing them on solid nutrient medium, following standard microbiological procedures [58]. The specific groups of microorganisms examined, the nutrient medium used for their isolation, and the conditions for their cultivation are detailed in Table 1.
Microbiological analyses were performed on activated sludge samples after pretreatment with a UD-20 automatic Sonics VibraCell ultrasonic disintegrator in triplicate for 10 s. The bacterial quantity was presented as colony-forming units per gram dry weight (CFU/g) using a standardized method [59]. This will enable the prediction of the adaptive potential of the activated sludge.

2.3. Data Analysis

All the analyses were made in three independent replicates. The results and standard deviations were calculated with the software product SigmaPlot 11 (Systat Software Inc., San Jose, CA, USA). Statistical analysis was performed using a t-test in Sigma Stat (version 4.0). Differences were considered statistically significant at the p < 0.05 level.

3. Results

3.1. Water Quantity per Overnight

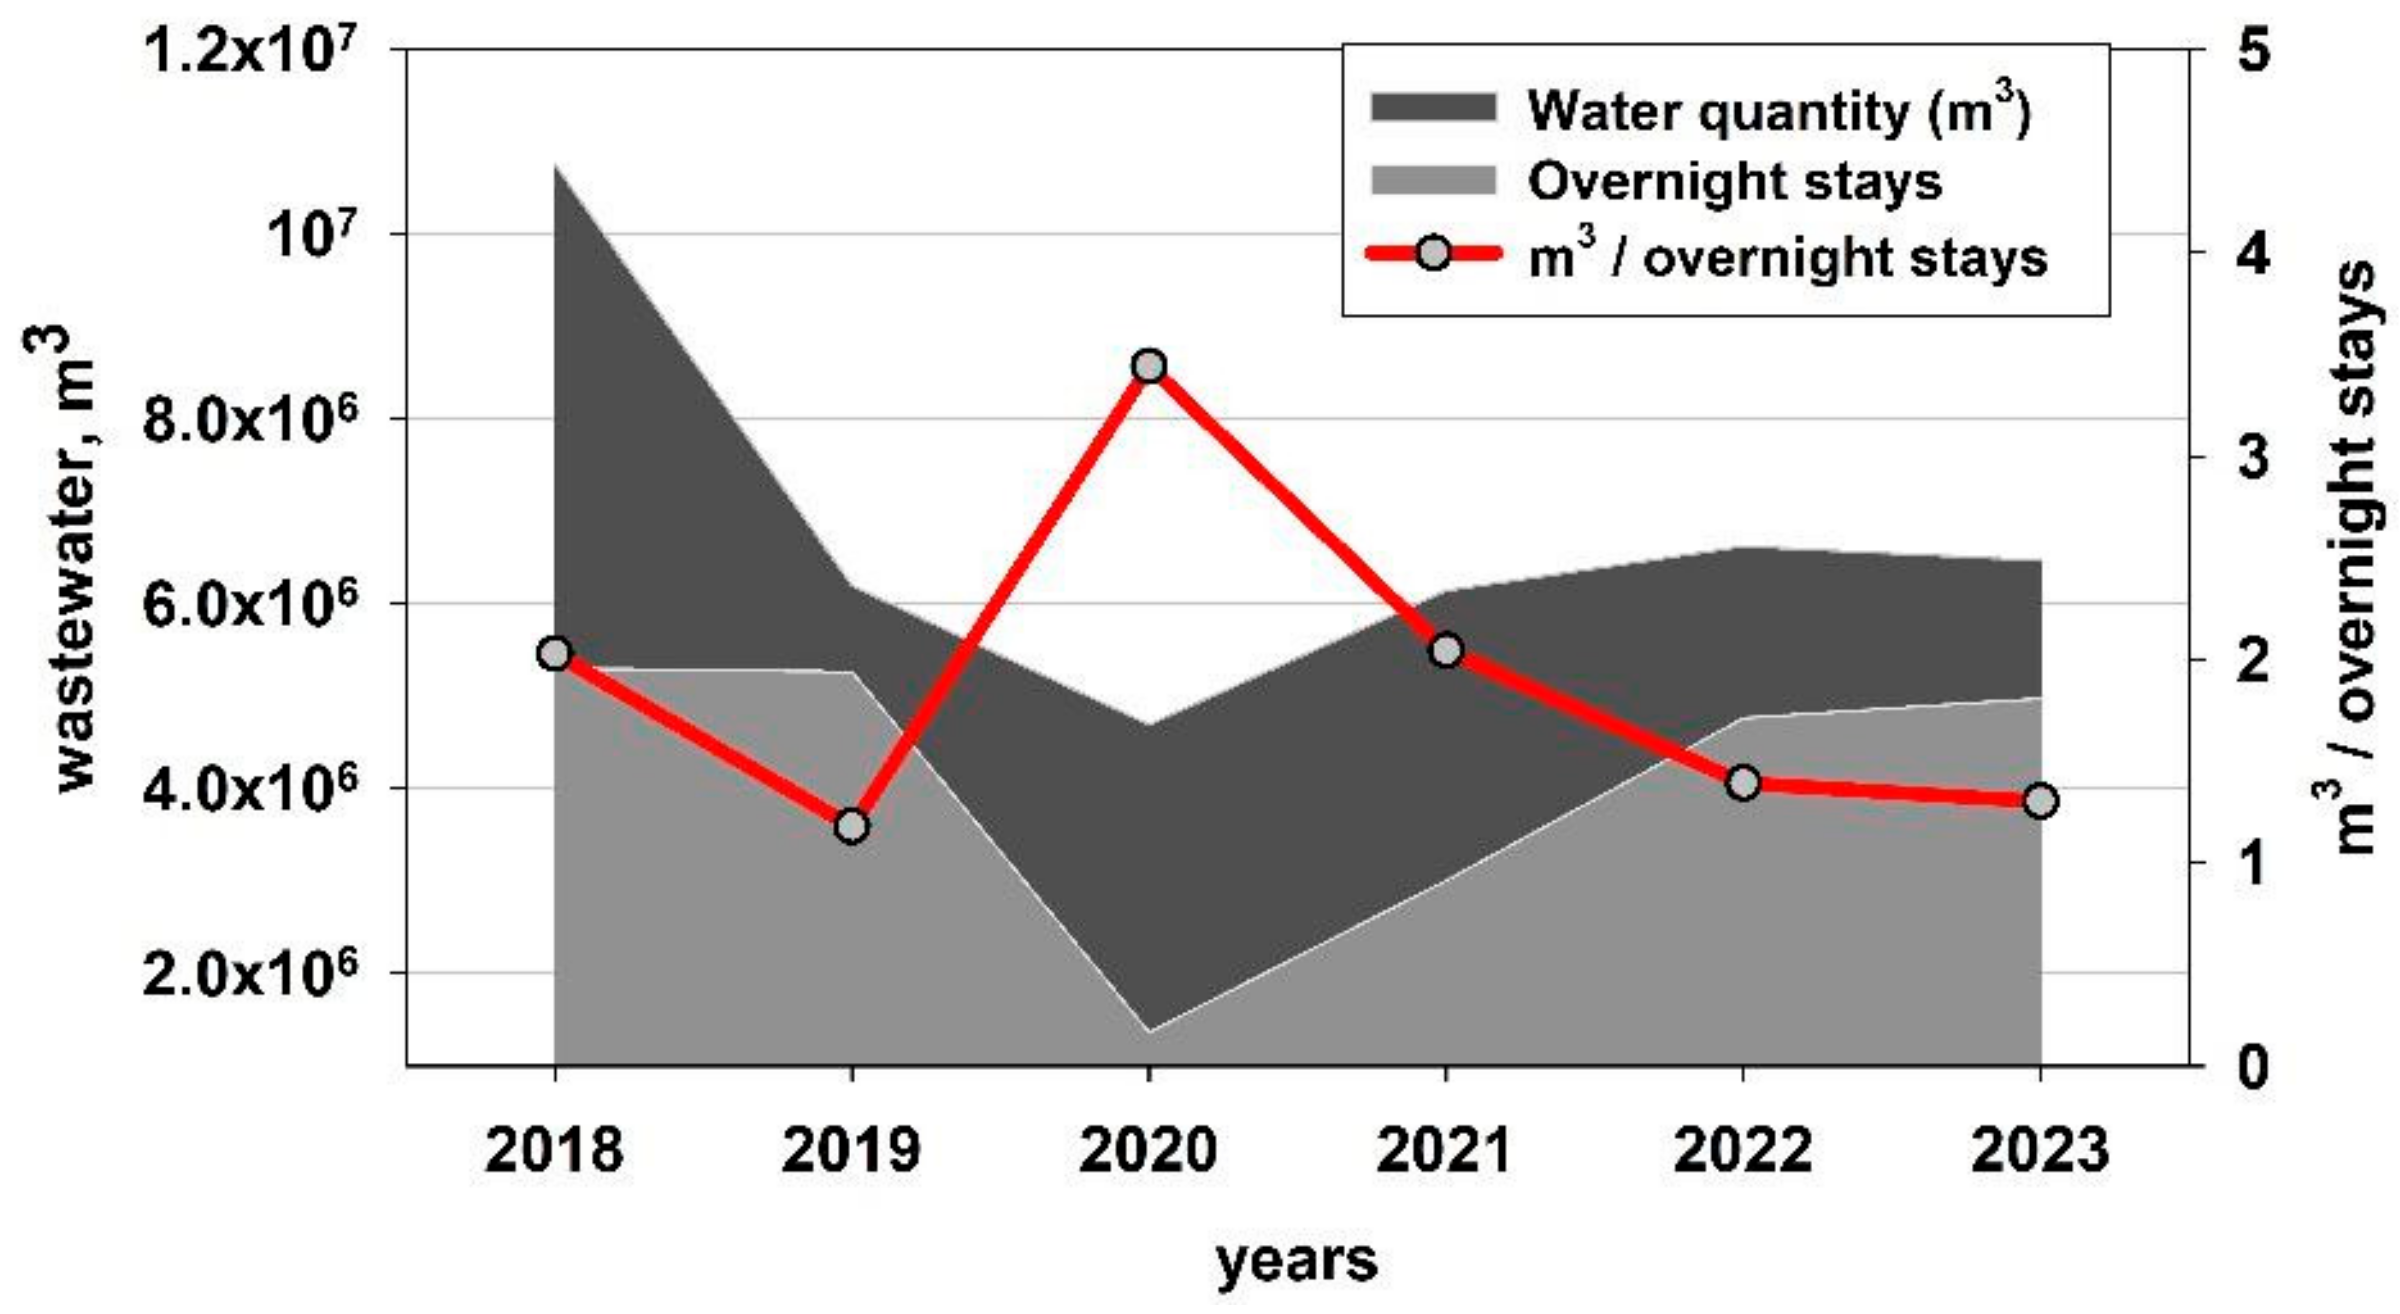
The quantity of water influent of Ravda WWTP, the overnight stays in the resort of Sunny Beach, and the quantity of water per overnight are shown in Figure 3.
The graph illustrates the relationship between wastewater, overnight stays, and the quantity of water used per overnight stay in Sunny Beach during the summer season.
It is clearly seen that the number of realized overnight stays remained constant in 2018 and 2019, but there was an exceptional decrease in the amount of wastewater. This can be linked to repairs in the water supply and sewerage system [60] and the introduction of sustainability measures in hotel complexes (replacement of mixers, installation of rainwater collectors). In 2020, the impact of the COVID-19 pandemic is clearly visible as the amount of water used per overnight stay rises sharply. This is due to increased safety levels and more frequent sanitizations of hotels, which require more resources than usual. In 2021, tourists returned, and their number increased, along with the amount of water used. However, the amount per overnight stay decreased. In 2022 and 2023, the number of overnight stays increased, while the amount of water used per night continued to decrease. This indicates the establishment of a balance given the well-developed systems and cleaning habits and the introduction of eco-friendly measures by more and more hotels.

3.2. Hydrochemical and Technological Parameters

The COD, measured at the inlet and outlet of the treatment plant in November 2023 and April 2024, is presented in Figure 4.
Figure 4a shows that the COD generally varies between 140 mg/L and 320 mg/L over the years for both seasons, indicating consistently high levels of organic pollution in the influent. The year 2022 had the highest recorded COD values for both seasons, with autumn peaking above 300 mg/L, the highest in the dataset. This could indicate an unusual increase in pollution sources during that year.
Figure 4b shows the effluent COD for both spring and autumn after wastewater treatment, with a red line indicating the maximum permissible level of 125 mg O2/L, based on the complex permit of the Ravda WWTP and the Water Act of the Ministry of Environment and Water (MOEW) of the Republic of Bulgaria [61]. All effluent CODs are significantly below the limit across the entire period from 2018 to 2024. This suggests that the treatment process is effective in consistently reducing the COD to within permissible limits, even though the WWTP is working with a reduced number of installations. Although there is some fluctuation between the spring and autumn effluent COD levels, the differences are minor compared to the untreated influent data. This indicates that the treatment process is well controlled and minimizes seasonal variations in the effluent COD.
The BOD5 measured at the inlet and outlet of the treatment plant in November 2023 and April 2024 is presented in Figure 5.
A higher BOD5 is observed in autumn, except in 2020 and 2023 after the tourist season. This suggests that residual organic matter and pollutants have accumulated in the wastewater system during the peak tourism months. This “leftover” pollution could stem from organic buildup in the wastewater system from hotel and resort operations that may be gradually flushed out after the season and increased organic material from maintenance activities, cleaning, or waste disposal as hotels close for the season.
In spring, the BOD5 values are generally lower, possibly because the system has had time over winter to flush out residual organic waste. However, some organic load may be present due to pre-opening preparations by hotels, such as cleaning, facility maintenance, and initial supply stocking, which could contribute to a minor increase in organic material.
Since only local residents are present during sampling in spring and autumn, part of the BOD5 observed in these periods could also reflect regular household organic waste. However, the significant difference between autumn and spring levels implies that the tourism season has a much larger influence, with local contributions remaining relatively constant.
The results shown in Figure 4b clearly show the effective functioning of the wastewater treatment, as the BOD5 at the outlet is below the limiting concentrations declared by the MOEW: BOD—25 mgO2/L.
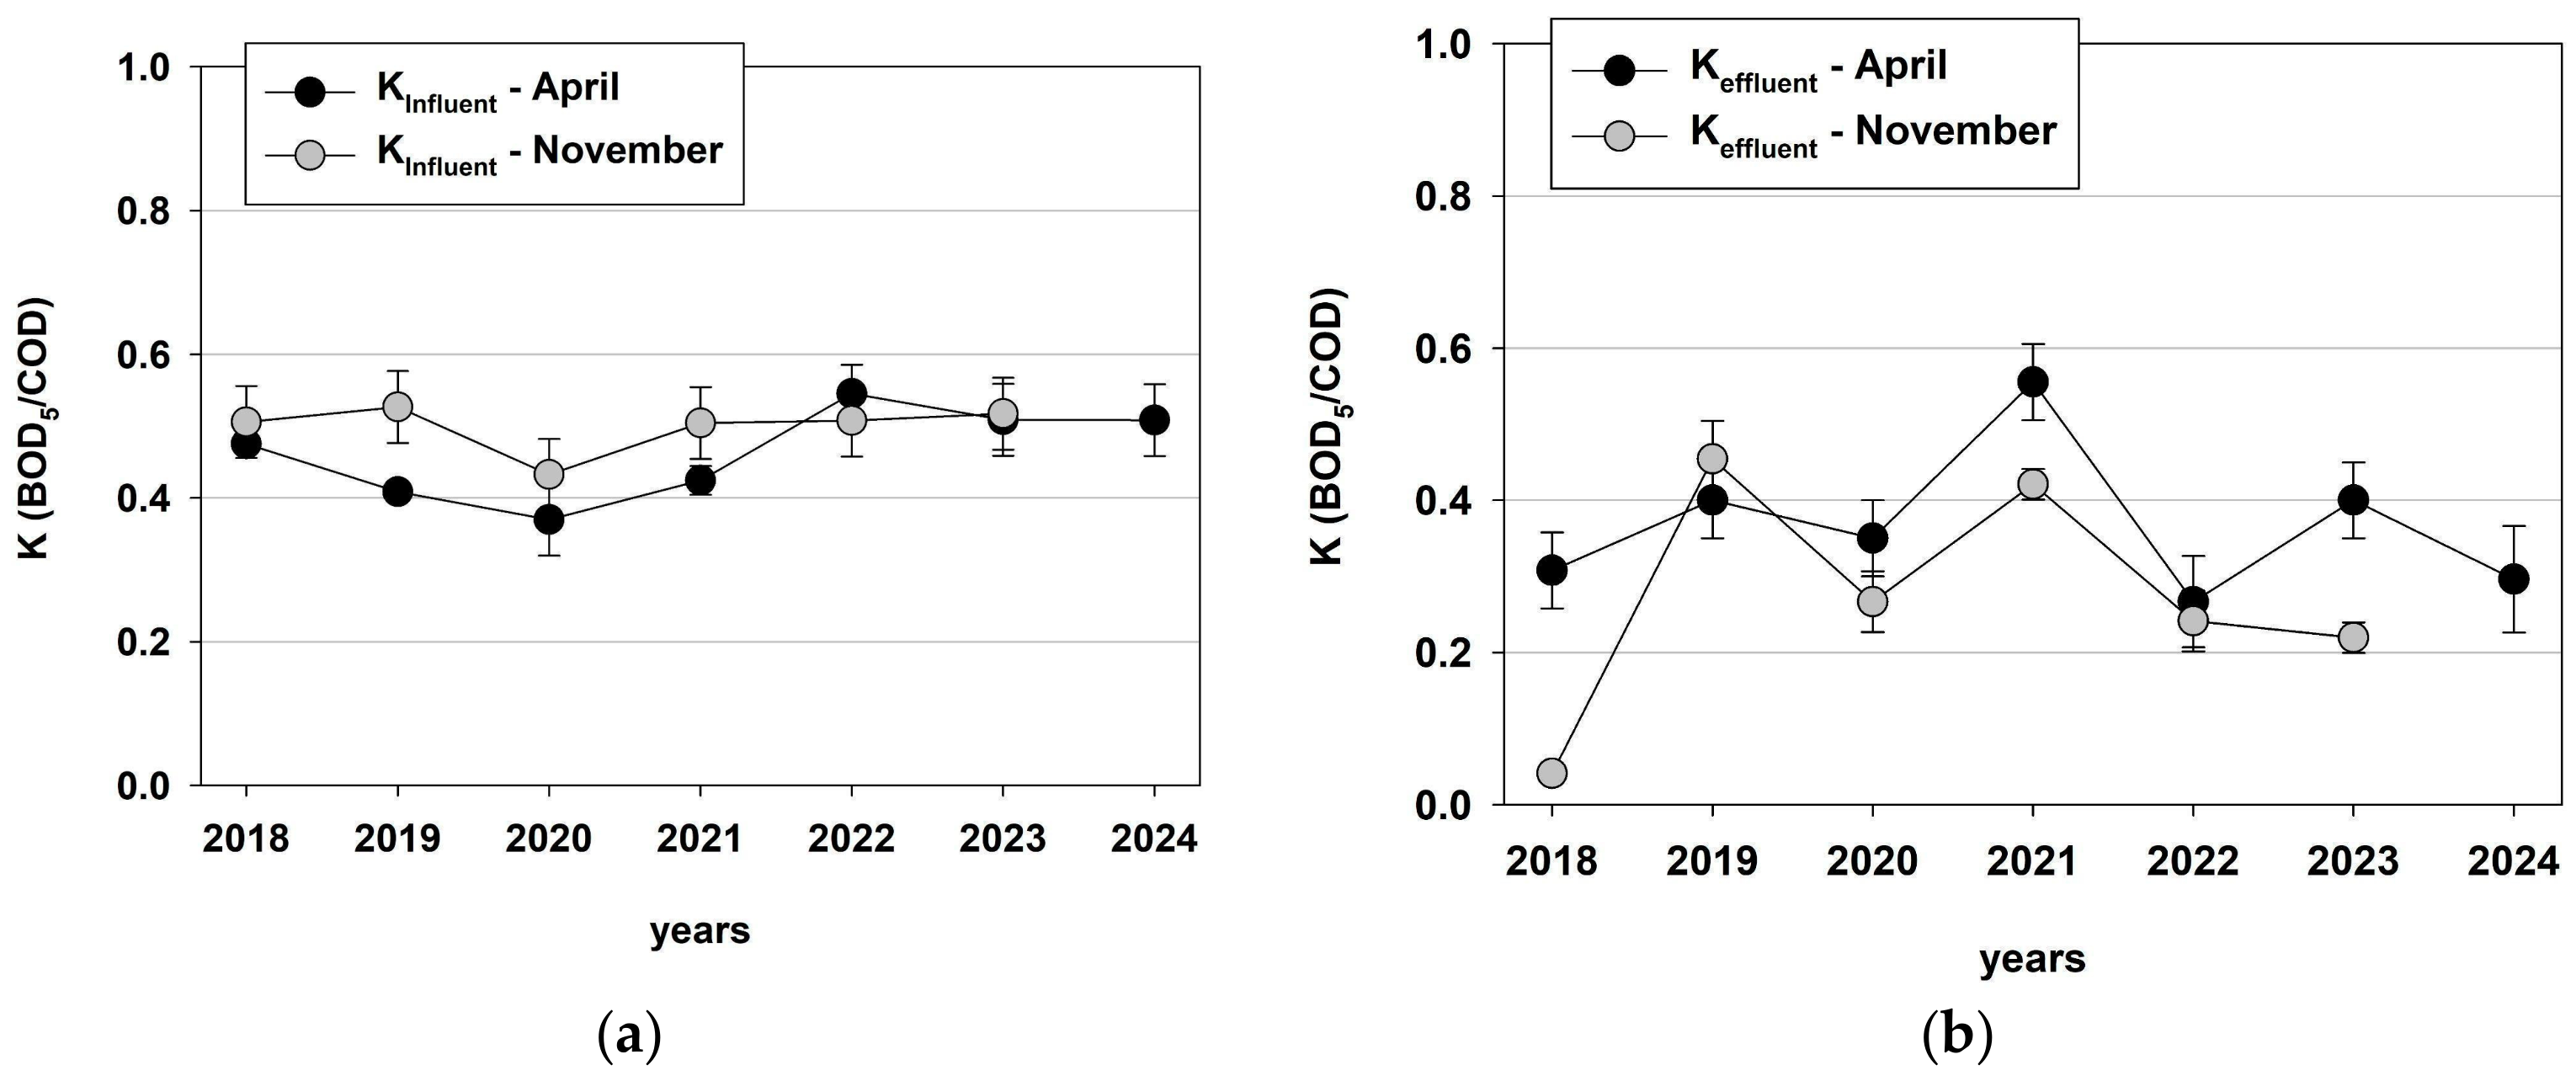
The ratio of BOD5 to COD—K is shown in Figure 6.
The ratio of BOD5/COD (Figure 6), also called the economic coefficient of biological decomposition (K), is an important indicator for assessing the level of water pollution. In this case, the values of K indicate the presence of difficult-to-degrade or non-degradable organic compounds in the water at the outlet of the Ravda WWTP (K < 0.5).
The values of K for the influent/input in both of the studied seasons were similar. This proves that in both studied periods, the organic load is relatively the same since there is not an active summer season. The values of K for the effluent/output, however, indicate that when hotels are preparing for operation, degradable organic matter increases, which makes it possible to predict that the recovery of activated sludge and the increase in its biomass will become easier. This also indicates the possibility of the development of the adaptive potential of the activated sludge and its ability to grow so that the treatment plant can switch to an extended summer operation.
The coefficient K indicates that in the incoming water during November, following the active season in 2019, 2020, and 2021, there was a higher amount of hard-to-degrade pollutants. These years are associated with the COVID-19 pandemic. It is assumed that these non-degradable pollutants are mainly xenobiotics used for treatment and disinfection, such as antibiotics, steroids, detergents, and other disinfectants. It is also likely that there are increased amounts of microplastics and nanoplastics due to the use of more personal care and protection products. This trend is even more pronounced in the treated effluent, where easily degradable organic matter has been removed, leaving mainly hard-to-degrade xenobiotics in the water. K is low in November, following the summer seasonal load for 2018 and 2020, the years around the COVID-19 pandemic. Low K is also observed in 2023 and 2024, when there was an increased number of tourists during the season, leading to the increased use of personal hygiene products, steroids, pharmaceuticals, and other xenobiotics. A similar dependency for K is observed in April, but the values are slightly higher compared to November. The reason is that during the winter months before the season, the WWTP operated with a smaller volume of water due to fewer local residents in the region. Overall, the fluctuations of K at the outlet during the studied years are greater, indicating the instability of K, i.e., the uneven dynamics of the entry of non-degradable and hard-to-degrade substances. This suggests that innovative solutions should be sought in this direction, such as the integration of innovative modules for the detoxification of treated water or the stimulation of the targeted development of microbial populations in the AS, which are more active in the biodegradation of xenobiotic organic pollutants during the treatment process.
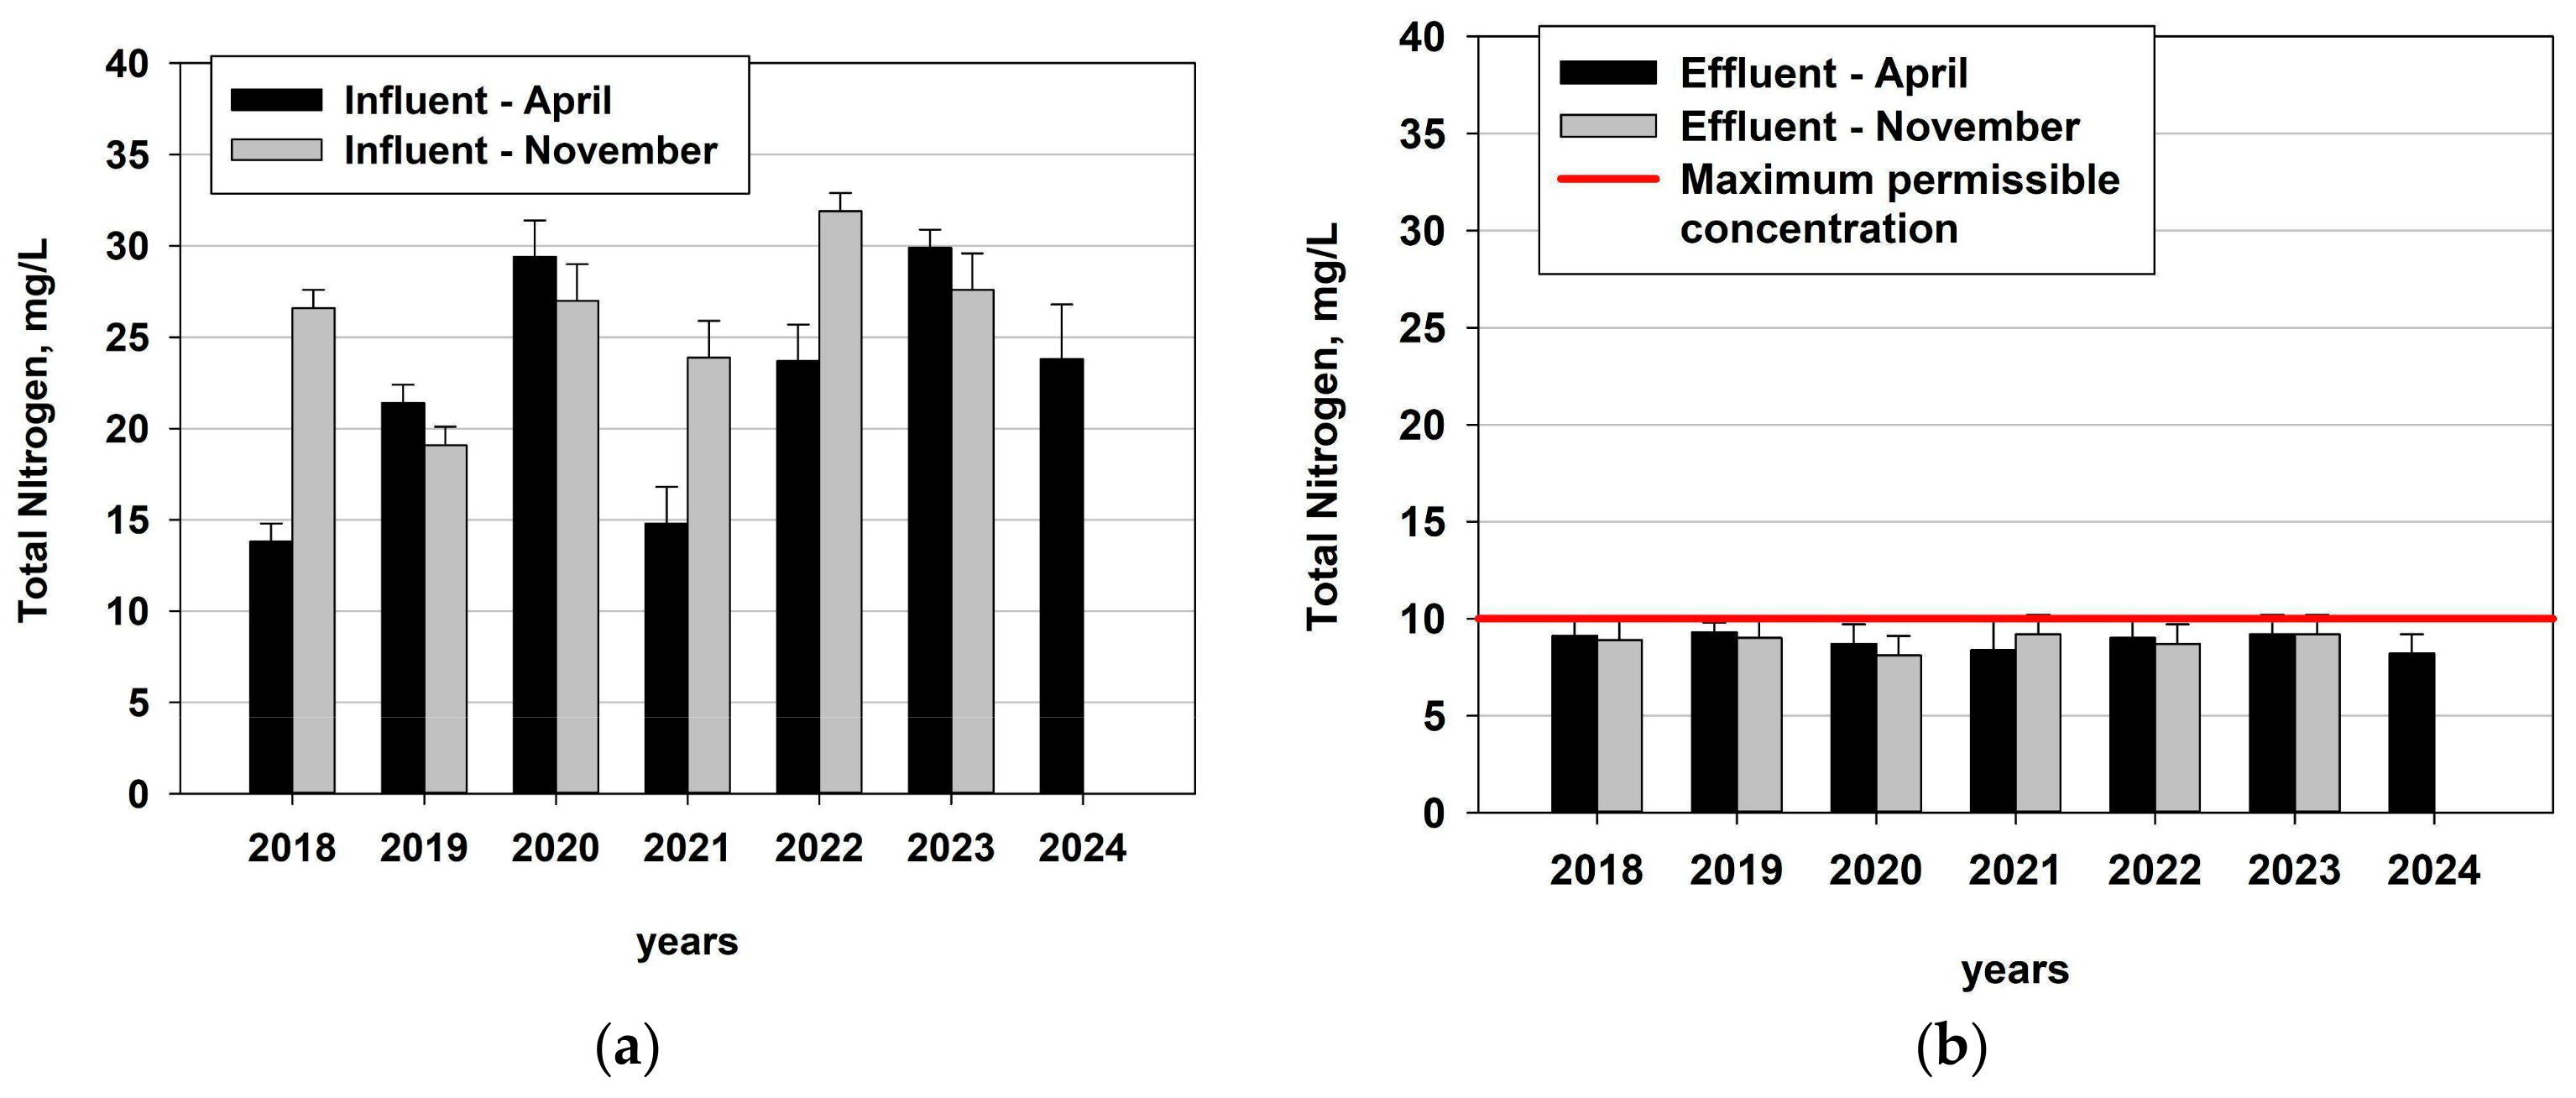
According to the comprehensive permit of the Ravda WWTP and the Water Act of the MOEW of the Republic of Bulgaria [61], the water discharge standard for TN is 10 mg/L. In this case, the results show that the Ravda WWTP is coping with the removal of pollutants, but the data are close to the maximum allowable values.
From the data in Figure 7a, it is established that the TN content varies greatly over the years. Viewed through the prism of the COVID-19 pandemic, an increase in values in the spring and autumn of 2020 is seen. The high values in the spring can be linked to the lockdown imposed by the authorities, during which people stayed at home, leading to a greater consumption of food and household products. This cannot be said for the spring of 2021, which recorded some of the lowest results for the seven years studied. In the following years, there is a clear trend of increasing TN values. In 2022, the high values can be distinctly differentiated, which can largely be linked to the migrant flow along the Black Sea coast due to the Russian invasion of Ukraine.
Regarding the data at the station outlet in Figure 7b, it is established that the Ravda WWTP strictly adheres to the discharge values imposed by Bulgarian legislation. In none of the years does it exceed the maximum allowable threshold of 10 mg/l. The highest values are recorded in 2021 and 2022. Nevertheless, achieving the levels of TN in the effluent within the maximum permissible limits set by the regulations of Republic Bulgaria [60] suggests that in the process of improving the efficiency of biogenic element elimination, mechanisms to increase the rate of denitrification should be sought. Given that the quantities of denitrifying bacteria and bacteria of the genus Pseudomonas are being studied, discussing the obtained results forms the basis for recommendations and guidelines on how to increase the rate of complex nitrogen elimination processes during wastewater treatment. Enhancing the efficiency of denitrification will also provide a better opportunity for the elimination of toxic pollutants, as denitrification involving the genus Pseudomonas is associated with detoxification. The implementation of this procedure in winter can gradually adapt the biological system until spring, so it can meet the need of the WWTP to treat the higher load of wastewater during tourist season.
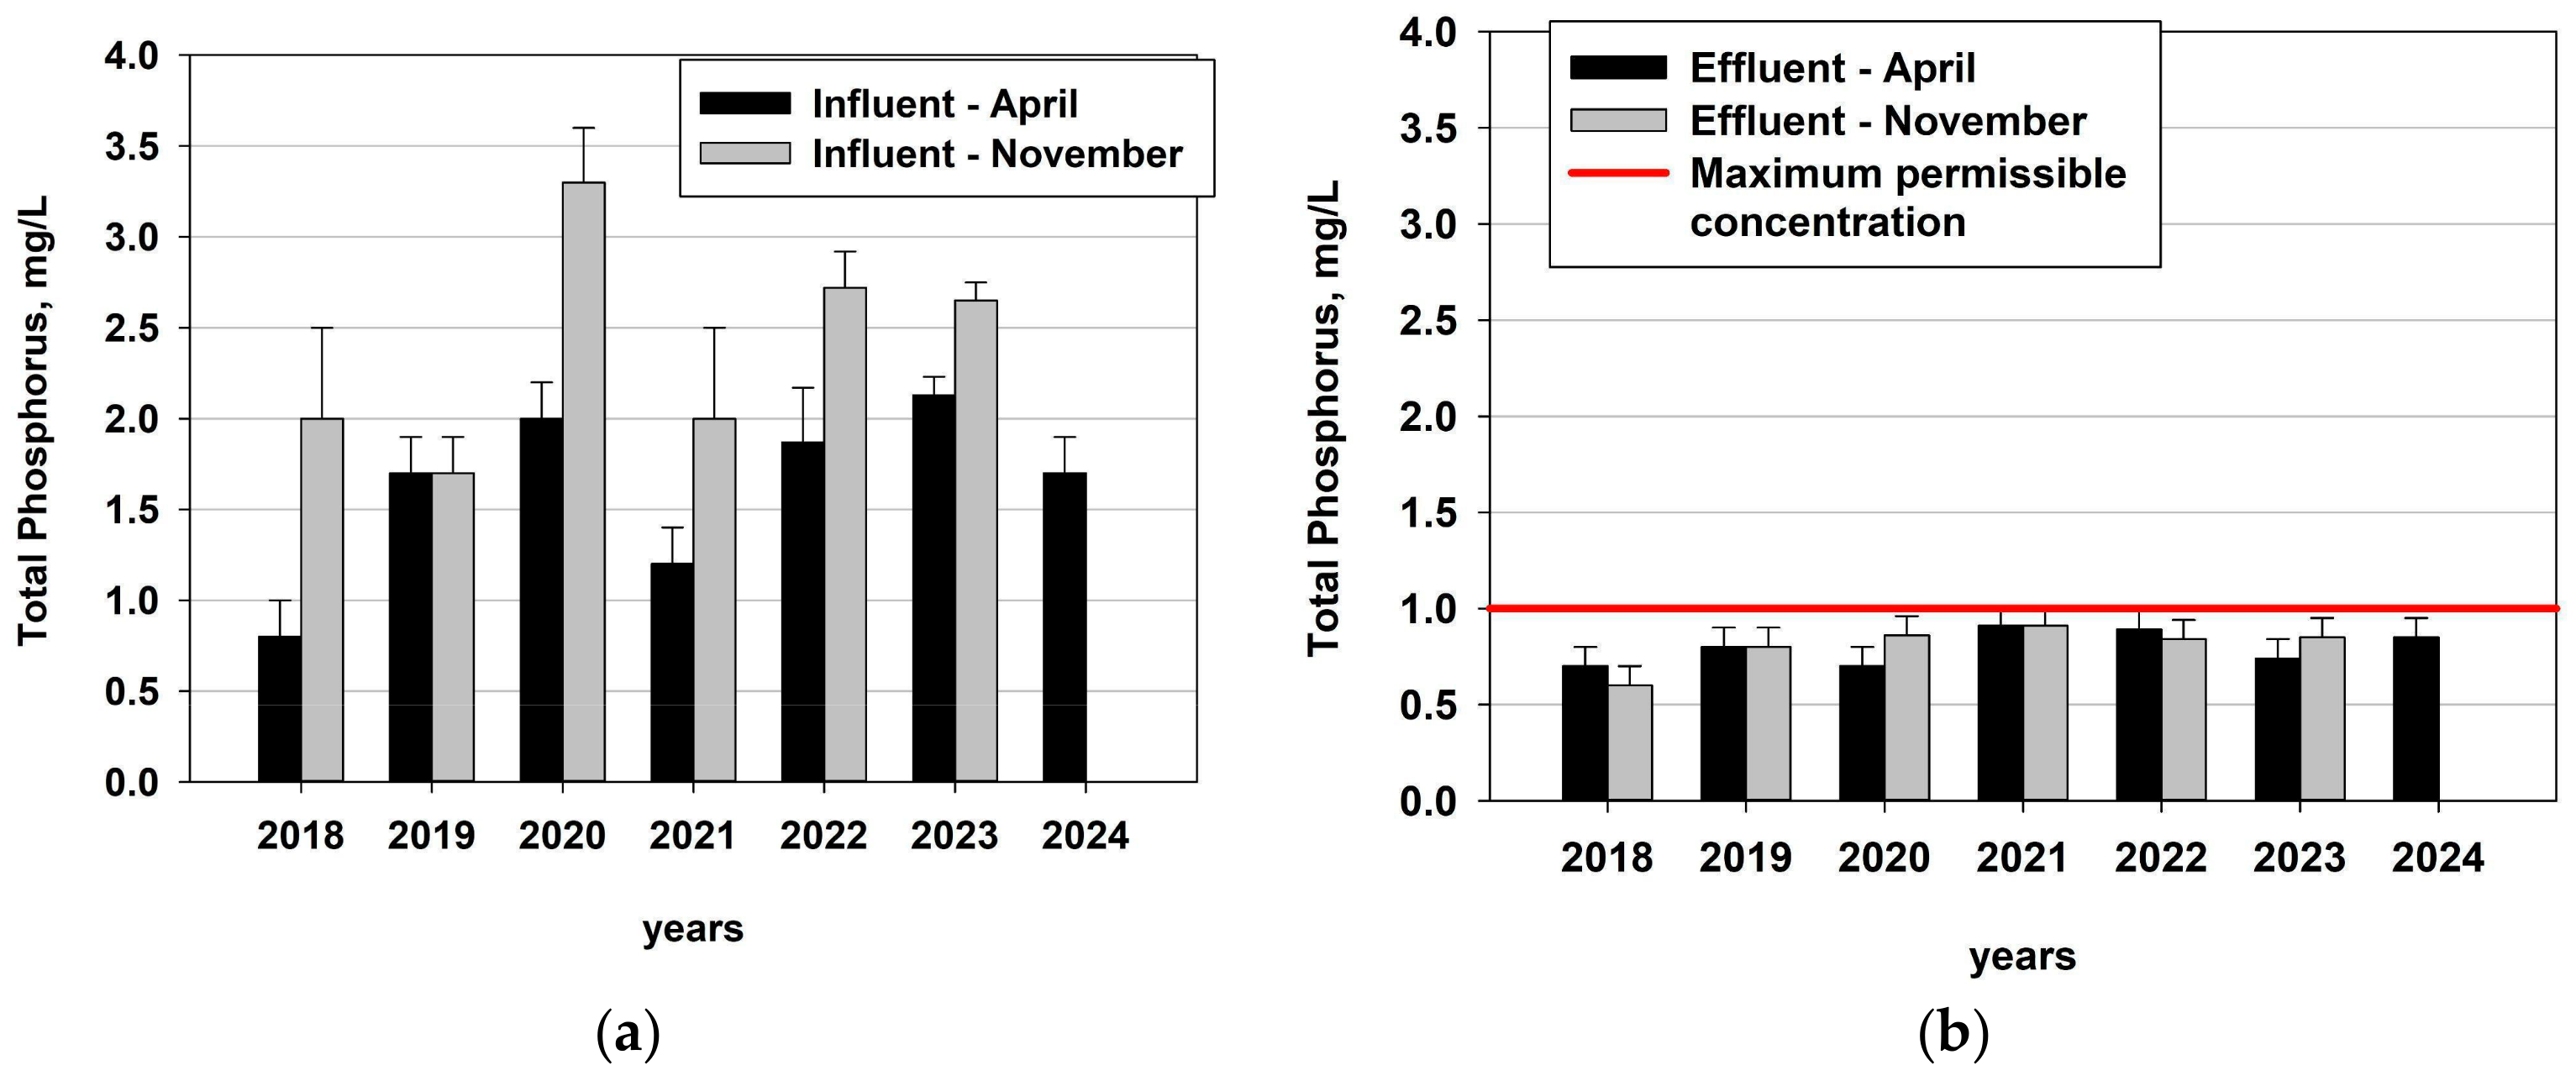
According to the comprehensive permit of the Ravda WWTP and the Water Regulation of the MOEW of the Republic of Bulgaria [58], the water discharge standard for TP is 1 mg/L.
In Figure 8a, the data for TP over the 7 years studied at the inlet station of the Ravda WWTP is presented. The data shows that the highest values were recorded in the autumn of 2020 after the high season. After that, there was a decline in 2021. From 2022 onwards, there is an increase in these values, especially in the autumn. The higher values from 2022 onwards may again be influenced by the accumulation of TP in the high season and/or migrant flow from Ukraine. TP originally accumulates by means of detergents after the closing of the hotels.
Regarding the data for TP at the outlet station (Figure 8b), the plant strictly adheres to the values from the integrated permit, 1.0 mg/l, which is permissible for discharge. Overall, the highest values are recorded in 2021 and 2022.
High levels of treatment efficiency (>90%) were observed for the parameter BOD5 in both samplings and the COD in the second sampling. For the other parameters and the COD in the 2023 sampling, the levels were low. According to literature data, good removal efficiencies are as follows: BOD5—above 90% [62]; COD—above 90% [62].
This shows the need to take measures by expanding the Ravda WWTP in winter, i.e., to use its full capacity even after the summer, or by introducing innovative methods to deal with the load. The facilities operate efficiently. It is unlikely that the efficiency can be significantly increased within the reduced scheme of the WWTP.
Figure 9a presents the treatment efficiency at the Ravda WWTP in terms of the COD. During the studied years from 2018 to 2021, despite the COVID-19 pandemic, a relatively high treatment efficiency is reported. In the spring of 2022, a drop in the COD efficiency percentages is observed, which may be linked to the impact of the strong migrant flow in March and April 2022. The lowest COD removal efficiency values are also recorded in the autumn of 2023. This is likely related to either the poor functioning of the biological water treatment at the plant or an event involving the discharge of large concentrations of xenobiotics.
Regarding the BOD5 treatment efficiency, a high purification percentage, over 90%, is maintained for all the studied years. The only slight declines are observed in the autumn of 2019 and the spring of 2020 during the COVID-19 pandemic. The results indicate that the Ravda WWTP has a good purification effect in terms of BOD5.
Figure 10 shows that the TN and TP removal efficiencies are low (65% and 57%). According to literature data, good removal efficiencies are as follows: TN—in the range of 70–90% [63] and TP—above 80% [64,65].
Figure 10a presents the data on the treatment efficiency for TN. The data varies greatly across seasons and years. The lowest values are recorded in the spring of 2018 and 2021—only around 40%. In 2020, despite the COVID-19 pandemic, a treatment efficiency of about 70% was reported. In 2022, the highest treatment efficiency for TN was recorded (almost 100%), coinciding with the large migrant flow. The high fluctuations in the nitrogen removal efficiency confirm the previously stated assertion that measures are needed to improve the elimination of nitrogen-containing organic matter, which can be achieved by optimizing denitrification. During the summer months of the active tourist season, when the load of biogenic elements, including TN, is higher, this is accomplished by activating four SBRs, where denitrification is enhanced and better controlled.
Figure 10b presents the data on the treatment efficiency for TP. Similar to the efficiency for TN, the data varies greatly over the studied years. The lowest values were recorded in the spring of 2018 and 2021, which also coincides with the low values for TN treatment. Specifically, in the spring of 2021, the low value may be linked to one of the last strong waves of the COVID-19 epidemic. Overall, the treatment efficiency for TP does not exceed 80% in any of the studied years from 2018 to 2024. Higher efficiency in phosphorus removal can be achieved by promoting the growth of polyphosphate-accumulating bacteria, such as those from the genus Pseudomonas. In this context, quantifying these bacteria, along with aerobic and anaerobic populations, provides insights into optimizing the combined processes of denitrification, dephosphatation, and detoxification. This provides information on how to optimize the treatment in the summer season as well.
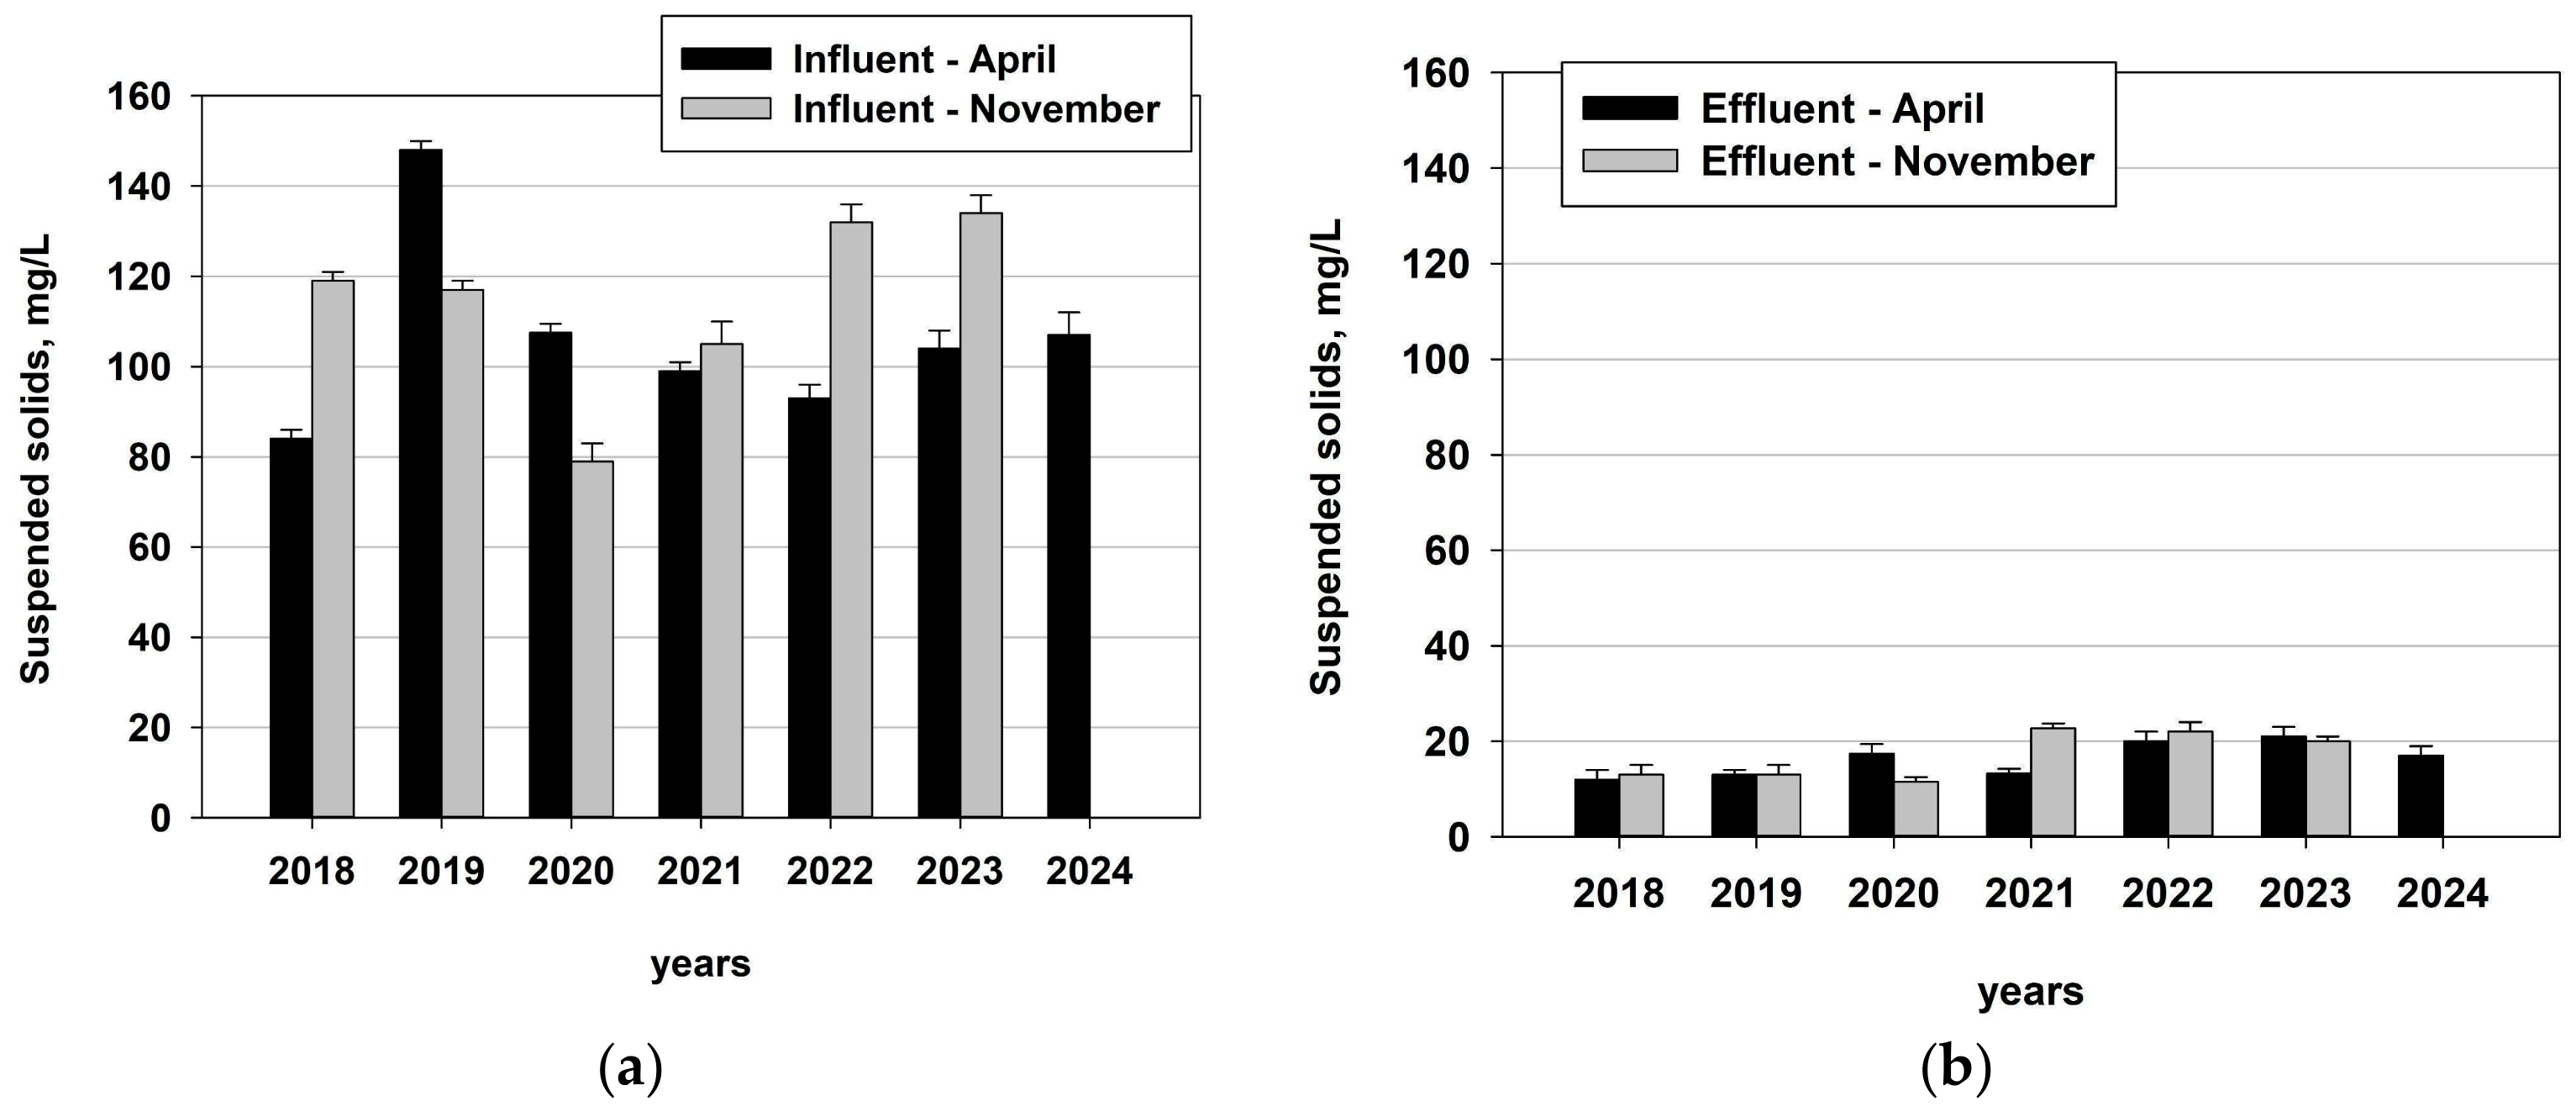
Figure 11a shows the data on the content of suspended solids at the inlet station of the Ravda WWTP. The data varies significantly over the years of the study. The highest values were recorded in the spring of 2019–148 mg/L. A sharp decline in suspended solids was observed in 2020, during the COVID-19 pandemic. Relatively low values were also recorded in the autumn of 2020 and the spring and autumn of 2021, at 79 mg/L, 99 mg/L, and 105 mg/L, respectively. Data for 2022 and 2023 show an increase in suspended solids, especially in November due to the higher number of tourists and overnight stays. The influx of visitors significantly increases the volume of wastewater generated, which often contains higher levels of suspended solids due to increased usage of water in hotels, restaurants, and recreational facilities. This can strain the WWTP, requiring more intensive treatment processes to maintain water quality standards.
Figure 11b shows the data on suspended solids at the outlet station of the Ravda WWTP. High values were observed from the autumn of 2021, coinciding with the period of emerging from the COVID-19 pandemic. Overall, the values reached a maximum of 22.75 mg/L.
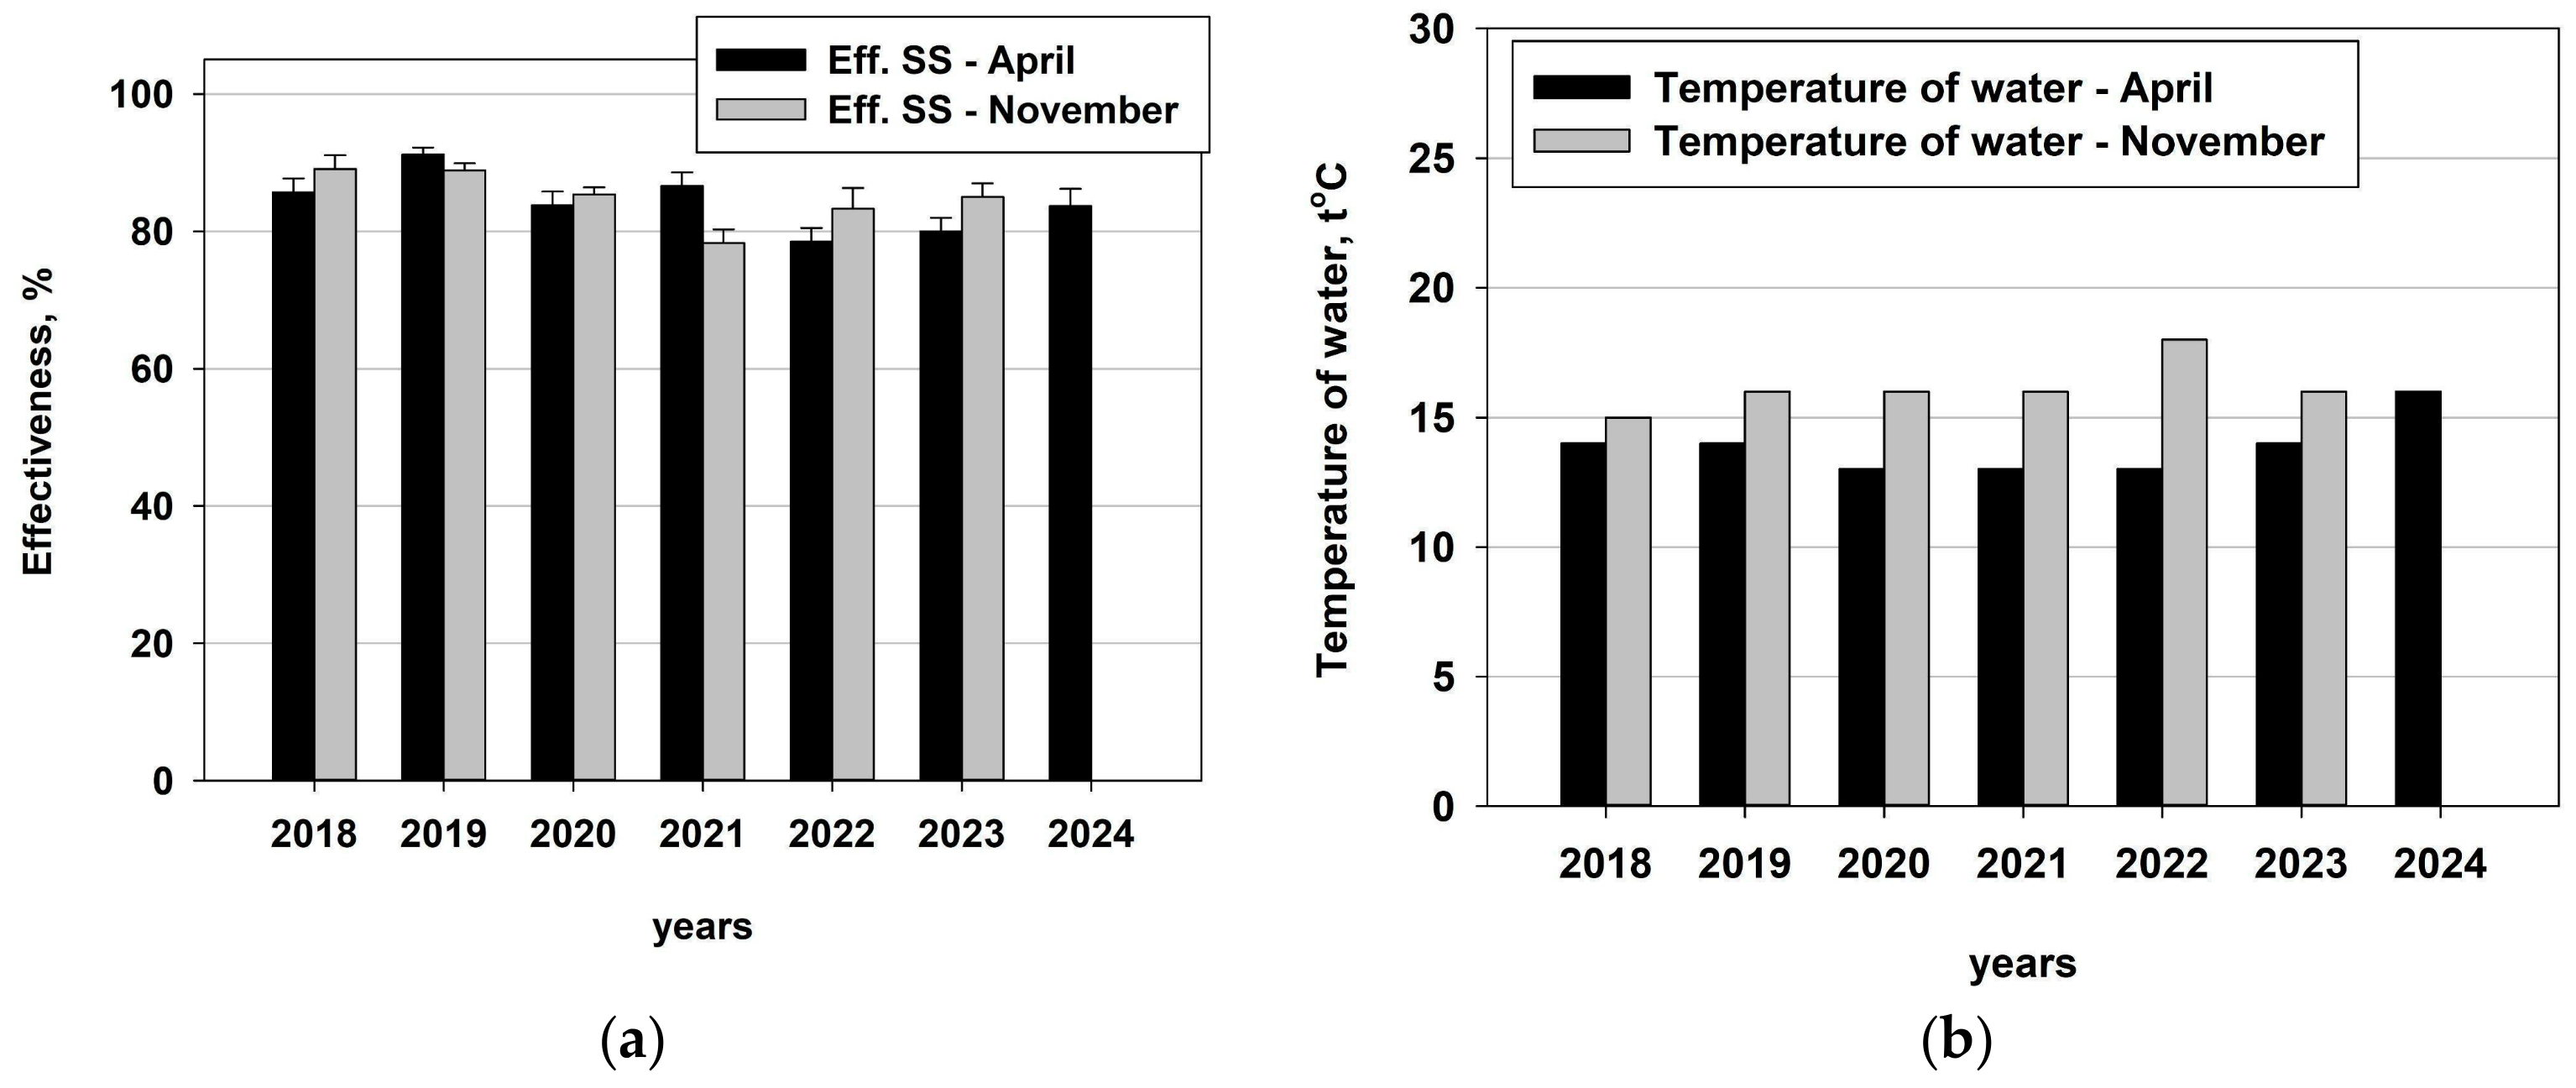
Figure 12a presents the data on the efficiency of the removal of suspended solids. Over the years, a level of around 80% is maintained. A decline in efficiency percentages is observed in the autumn of 2021 and the spring of 2022. In the years before the COVID-19 pandemic, a higher efficiency in the removal of suspended solids was recorded.
This can be attributed to the increased presence of microplastics following the active summer season in the post-COVID-19 period and the intensified preparations for the new season in April 2022, driven by the resurgence of tourism after the years of COVID-19.
Figure 12b presents the data on the water temperature at the Ravda WWTP. During the spring seasons of the studied years, the water temperature ranged from 13 °C to 16 °C, while in the autumn seasons, higher temperatures were recorded, ranging from 15 °C to 18 °C.
Figure 13 presents the F/M ratio and the volumetric load of the activated sludge/volumetric organic load.
A lower F/M ratio indicates an increased presence of filamentous microorganisms compared to regular bacteria. This, in turn, signals the starvation of AS or the presence of toxic pollutants. The F/M ratio was the lowest in 2019, 2020, and 2021, suggesting that during the COVID-19 years, wastewater contained a significant amount of recalcitrant pollutants due to their use as anti-epidemic agents.
When referring to the potential of the biotechnological system, it is understood to predict the ability of the system to adapt to new quantities of wastewater and different concentrations of carbon-, nitrogen- and phosphorus-containing pollutants and non-degradable and hardly degradable xenobiotics. In addition, the biological characteristics of the activated sludge provide a basis for predicting the reactivity of the biological system to rapidly develop its biodegradation potential to the available pollutants. This is determined by the floccular structure of the activated sludge and the density and quantity of the microbial segment.
Table 2 presents the concentrations of selected chemical elements in the influent and effluent from 2023 and 2024. The concentrations of 70 elements were determined. For some of them (e.g., the platinum group elements, rare earth elements, Ag, Au, Bi, Ga, Ge, Th, etc.), including potentially toxic elements (Cd, Hg, Pb, U), the concentrations ranged from max. 1 µg/L to below the LOD (0.001 µg/L) in all investigated samples and are not presented.
The current wastewater discharge regulations do not specify the maximum permissible limits for chemical elements. The experimental data were compared to Regulation No. H-4 of 14 September 2012 on the characterization of surface waters [66], which specifies maximum the permissible limits only for Al—25 µg/L, As–25 µg/L, Cr—32 µg/L, and U—40 µg/L. The data showed an increased level of risk, associated with the seasonal dynamics of Al, which exceeded the maximum permissible limit in the influent by six times and was close to it in the effluent in 2023. The concentrations of Al in the samples from 2024, and those of As and U, were below the maximum permissible limits and do not pose an environmental risk. The concentration of Cr is also below the maximum permissible limit; however, the significant increase both in the influent and effluent in 2024 is worth mentioning. A significant difference between the studied years is found also for W, which was higher in 2024, and K, Ca, Co, Mn, and Ni, which were higher in 2023. The comparison of the obtained concentrations in the influent and the effluent shows that effective metal removal is observed only for Al, Ba, and Mn (between 52 and 98%) in both years. Also, metal removal was observed to some extent for As, Cu, Fe, Se, Sr, and Ti (varying between 14 and 86%), though the effectiveness differed between 2023 and 2024. For the rest of the elements, metal removal during the purification process does not occur, as demonstrated by the close concentrations in the influent and the effluent. The lack of metal removal does not represent an environmental risk, considering the fact that the measured concentrations are comparable to those in drinking water [52]. The lack of variations in the influent and the effluent for the main part of the elements is also evidence that the measured concentrations are a result of the natural presence of the elements and not due to pollution.
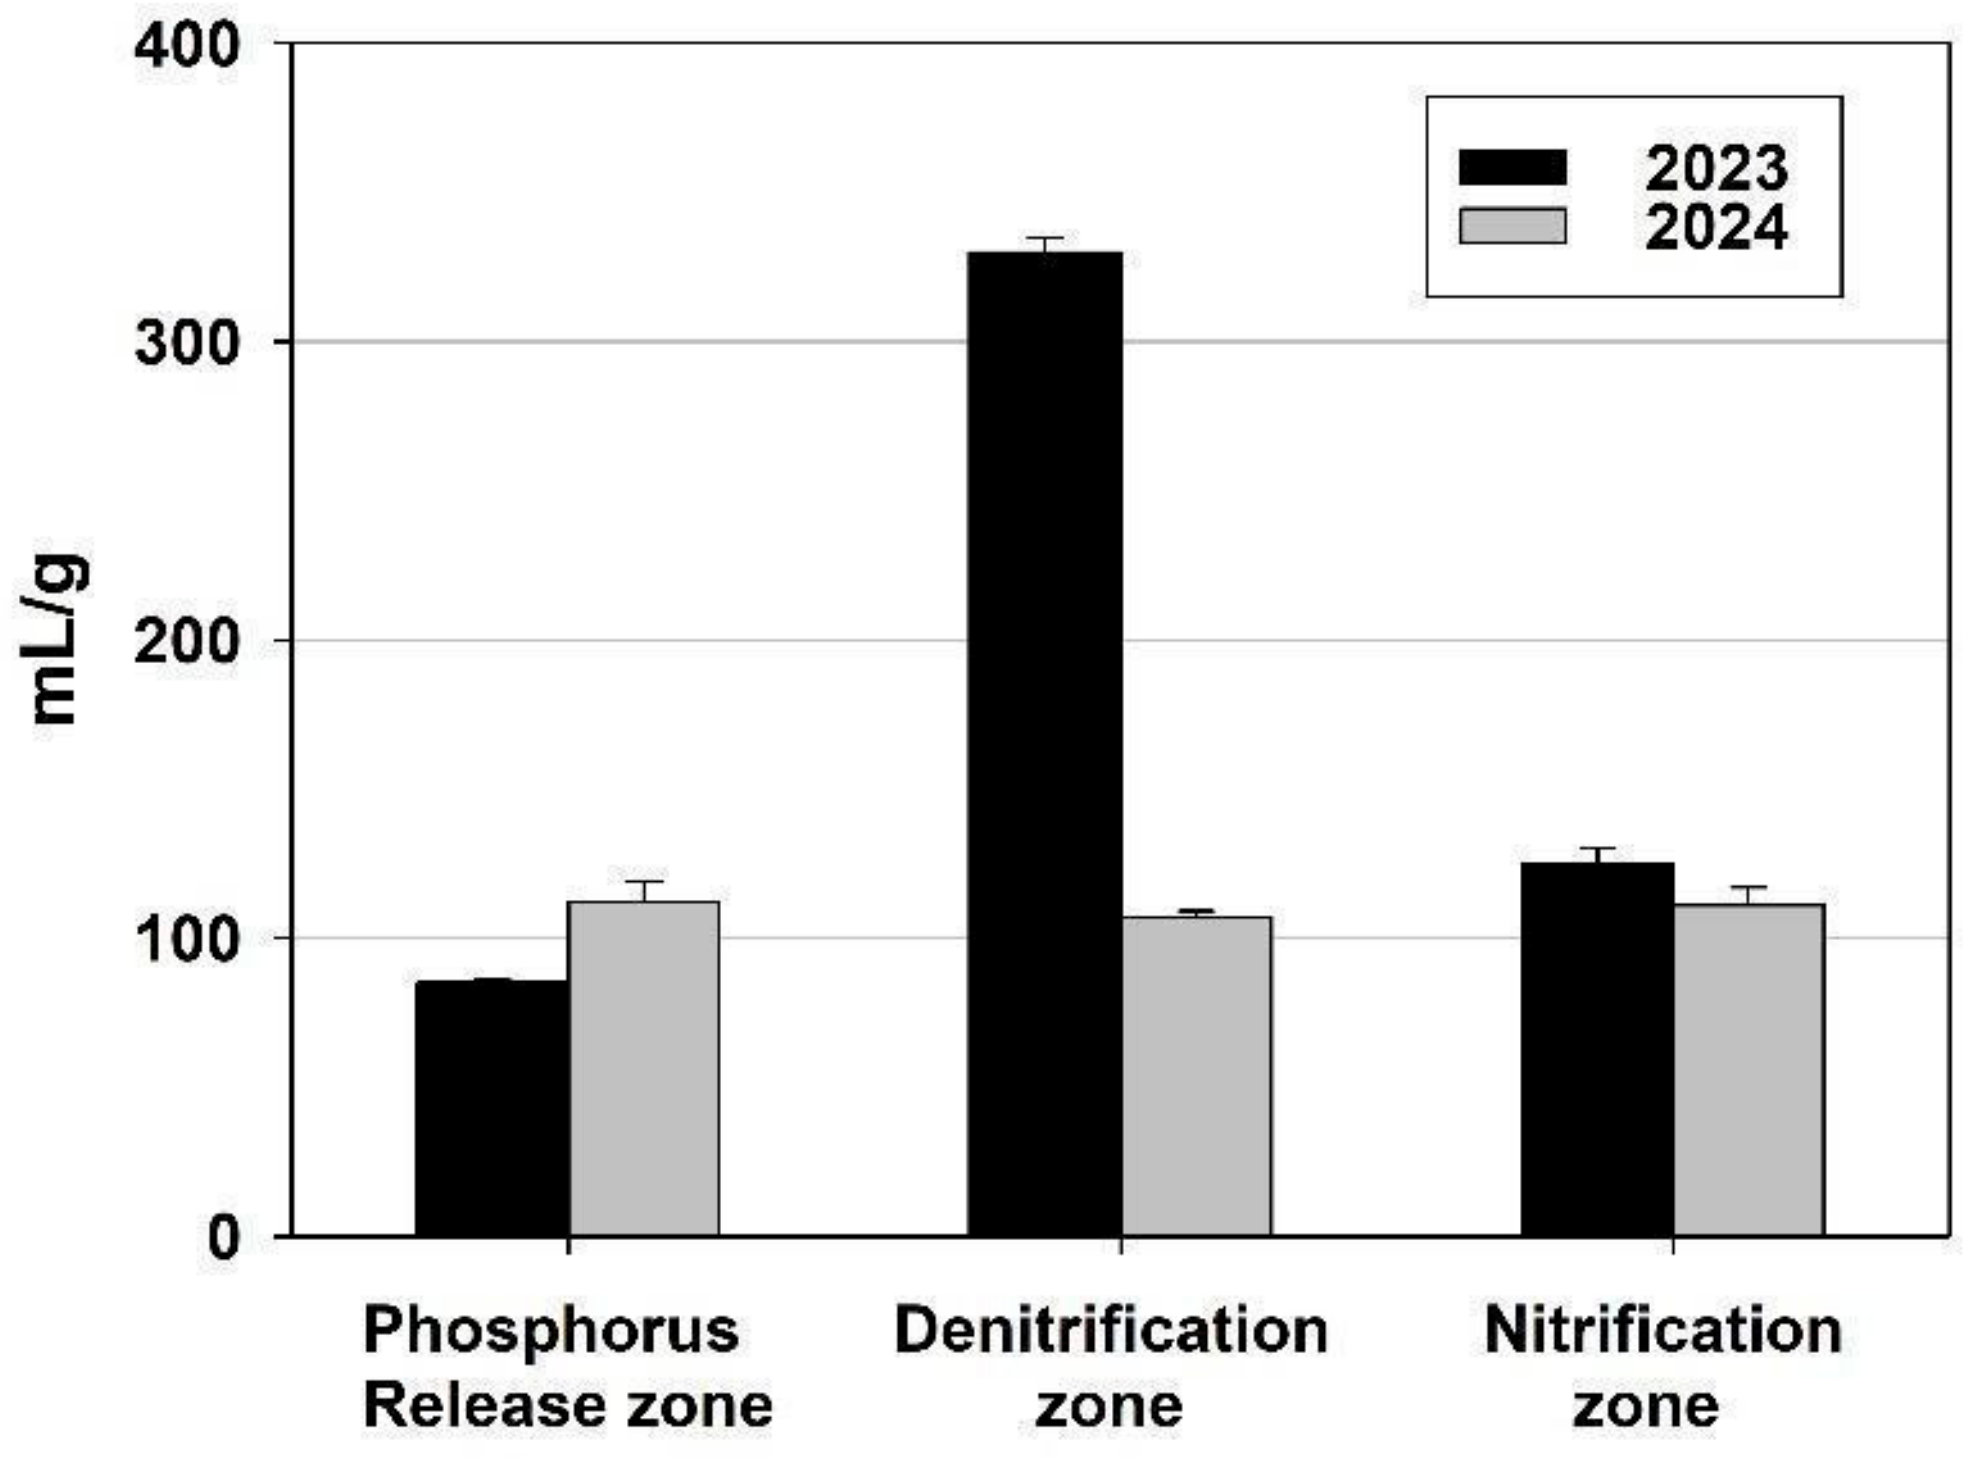
Figure 14 presents the sludge volume index for 30 min in the three zones of biological treatment: phosphorus release zone, denitrification, and nitrification zones.
The typical sludge volume index for a sludge wastewater system that is operating optimally should be between 50 and 150 mL/g. If it is above 250 mL/g, the sludge is very slow to settle and does not compact well. The result is a light and fluffy texture. If the SVI is between 100 and 200 mL/g, the sludge will settle a little more slowly, trapping more particulate matter during the settling process [67].
An anomaly was observed in the first sample taken on 1 November 2023 in the denitrification zone. The sludge index there is 330 mL/g, which is a signal of low settling levels. In this case, activated sludge swelling caused by an overgrowth of filamentous bacteria or by insufficient denitrification is often observed. This deformation of the SVI in the denitrification zone at the transition from summer to winter regime is normal, since then the most significant fluctuations in the process parameters were found and a sharp shortage of nitrate was noted. This is also related to the macrostructural changes in the activated sludge in the denitrifier where there is a greater number of pin–point flocs and, at the same time, a filamentous swelling in the nitrifier. In November, when the process operating scheme of the WWTP is contracted, the activated sludge experiences a shortage of carbon- and nitrogen-containing compounds and starves. That is because of the reduced quantity of water, which is also less polluted. The activated sludge is used with the high volume of organic pollutants until October (including), and this quantity suddenly drops, which leads to starving. This clearly shows the link between tourism and the wastewater treatment process and the need to investigate this relationship in order to optimize the process so that it has a minimum effect on the ecosystem (in this case Black Sea).
Figure 15 presents the quantity of Mixed liquor suspended solids in the three zones of biological treatment of WWTP: phosphorus release zone, denitrification, and nitrification zones.
The MLSS is an important parameter that indicates the concentration of biomass in the various elements of the system. Here, an increase in values is also observed, which reduces the efficiency and effectiveness of water treatment. Measures need to be taken to optimize the operation of the Ravda WWTP during winter mode, which will increase the adaptability of the biotechnological system to changes in the incoming water in terms of both pollution levels and volume. The results are also visible in the microscopic analysis of the activated sludge, as shown in Figure 16.

3.3. Microscopic Analysis

Figure 16 presents microscopic images of activated sludge from the three zones of the Ravda WWTP. From the 2023 photographs, it can be seen that the phosphorus elimination zone and the denitrification zone contain relatively small, not very dense, brown-colored flocs. The presence of filamentous microorganisms is also low in these two zones, and almost completely absent in the denitrification zone. Here, we can also make reference to the high SVI values in 2023 in this zone, most likely referring to the so-called non-filamentous swelling. This is very often due to the massive growth of some floc-forming microorganisms, e.g., Zoogloea ramigera. However, it can be seen that the nitrification zone in 2023 has relatively larger floccules with many more filamentous microorganisms. The 2024 photos show that the phosphorus elimination zone and the nitrification zone have larger flocs and more filamentous microorganisms compared to the flocs in the denitrification zone. Overall, the activated sludge flocs in the three zones studied in 2023 were larger and had a greater number of filamentous microorganisms compared to those in 2024. This is because the activated sludge in November is after the summer tourist season and has still retained its active biodegradation activity. However, it can be seen that the preparation of the WWTP for the extended mode of operation in the three zones revealed a large amount of growing spherical bacteria that formed actively growing yet incompletely formed floccules. The absence of many filamentous organisms indicates that the F/M ratio is sufficiently high, and the possibility of growing the floccules to their most appropriate size and increasing their activity is found [42]. Therefore, it becomes clear that the biological and biotechnological system has great potential to expand based on additional facilities operating at high contaminant concentrations and water volumes corresponding to the intensive mode of operation in summer.

3.4. Microbiological Parameters

From the data on aerobic heterotrophs for 2023, after an active summer tourist season, it is found that they are the most in the nitrification zone (Figure 17a). This is normal considering the aerobic regime of this zone. High amounts are also found in the other two zones, significantly exceeding 2024 before an active summer season. Relating the results for aerobic heterotrophs to the microscopic pictures, there is an obvious correlation between the high number of aerobes in the nitrification zone with the large and dense flocs in 2023. From the aerobic heterotroph data for 2024, they are found to be almost half the number for 2023. This clear decrease in numbers is apparently due to the activated sludge ceasing to be subjected to the strong press of organic loading. From November to April, there are six months during which the activated sludge is not subjected to the various types of xenobiotics released in the wastewater during the active summer season, such as medicaments, contraceptives, sunscreen creams and oils, and disinfectants. However, it can be noted that the lower number of aerobes in 2024 is associated with a higher COD and BOD5 treatment efficiency.
A similar trend is found in the data for anaerobic heterotrophs (Figure 17b). In 2023, after the active summer season, the amounts of anaerobic heterotrophs were higher in all three bio-basin zones compared to the 2024 data. Again, there are 2 times more anaerobes in the autumn after the tourist season. The low number in April 2024 can be related to the higher COD and BOD5 removal efficiency. This indicates that the anaerobic heterotrophs are more adapted and prepared for the upcoming summer season. This is established in the denitrification and phosphorus release zone.
The results about the lower number of bacteria during the period of preparing the facility for extended operation seem to contradict microbiological logic. However, it is a very clear signal, which is confirmed by the chemical and process indicators, which show that the bacteria in the activated sludge are in a period of adjustment and increasing enzyme activity, enzyme synthesis, and activation. This does not lead to an increase in the number of bacteria, but only in their metabolic activity during the preparatory stage. In the subsequent stages, as the organics increase, the number of bacteria and other organisms in the activated sludge will also increase. Such dependencies have been demonstrated in many previous studies by Topalova’s team [42]. During periods of intensive operation and deployment of the biodegradation potential of microbiological systems, enzymatic activities increase first and the number of microorganisms increases subsequently [42]. When the adaptive potential is activated, enzymatic activities are activated first, followed by structural changes in the activated sludge. These results, when considered, combining chemical and biotechnological results from the macrostructure of the activated sludge and the number of bacteria, show the great potential and reactivity of the activated sludge in Ravda WWTP to adapt to the intensive mode of operation.
Based on the data in Table 3 regarding denitrifying bacteria, it is found that their number in 2023 is several times higher than in April 2024. This is observed in all three zones of the bio-basins. This indicates a difficulty in the denitrification process. In November, it could be considered that the biological system is still adapted to the high concentrations of pollutants entering during the summer season. In contrast, in April, the quantities of denitrifying bacteria reach critically low levels, in line with the lower organic load of the treatment plant. Thus, a gradual increase in the number of denitrifying bacteria from April to summer can be expected, when concentrations of nitrogen-containing organic matter increase.
Regarding the data for bacteria from the genus Pseudomonas, a similar trend is observed, where the number of pseudomonads is much higher in November compared to April in all three zones of the bio-basins (Table 3). This is likely due to a similar situation where, in November, the activated sludge is still under the influence of the high pressure from the summer season. Additionally, it can be noted that a significant portion of the pseudomonads also constitute the denitrifying complex.
However, for bacteria from the genus Acinetobacter, it is found that higher values are observed in November only for the dephosphatation and nitrification zones but not in the denitrification zone. In these two zones, we also observe a smaller decrease compared to the other groups of bacteria in Table 3. Maintaining a relatively high number of Acinetobacter bacteria definitely leads us to the conclusion that they are very crucial for the biodegradation processes in the bio-basins of the Ravda WWTP. It has been repeatedly established that bacteria from the genus Acinetobacter, together with those from the genus Pseudomonas, participate in the xenobiotic-degrading complex in activated sludge [68].
Denitrification bacteria play a crucial role in wastewater treatment plants by facilitating the conversion of nitrates (NO3) into nitrogen gas (N2), which is then released into the atmosphere. This process is essential for reducing the concentration of nitrogen compounds in treated water, thereby preventing eutrophication in aquatic ecosystems. Denitrification occurs under anoxic conditions, where these bacteria use nitrate as an electron acceptor in the absence of oxygen, effectively removing excess nitrogen from the wastewater. This not only helps in maintaining water quality but also recovers alkalinity lost during nitrification, contributing to the overall stability and efficiency of the treatment process [68]. The integration of denitrification processes in wastewater treatment is vital for meeting stringent environmental regulations and ensuring the sustainability of water resources, which is directly linked with the recreational zone and the health of tourists.

4. Discussion

Ravda WWTP
The Ravda WWTP in April and November, with a shortened technological scheme, functions relatively effectively, and all the technological parameters are within the maximum permissible limits set by the Water Act of the Ministry of Environment and Water (MOEW) of the Republic of Bulgaria [58]. All the technological and biotechnological parameters in November and May, when the Ravda WWTP switches to a shortened technological scheme and when the system prepares for the expansion of the technology for the intensive summer season, show two clearly differentiated trends: (1) there is great potential for adaptation to an expanded and even more intensive mode of operation; (2) regardless of the great adaptive potential, the processes of denitrification, microbial dephosphatation, and the detoxification of xenobiotics can and need to be improved in order to reduce the risk of nitrogen-containing organics and toxic substances entering the Black Sea during the active summer season (high season).
The important question was “How does the biotechnological treatment system respond to major socio-economic changes in mass tourism, such as the COVID-19 epidemic, the settlement of large groups of migrants, intensive economic development after a reduction in the tourism and transport sectors, and others?” [69].
The results obtained and presented above demonstrate that the Ravda WWTP is a dynamic biotechnological system that responds sensitively to the listed factors. During the two study periods, significant technological and functional changes occur. Managing these functional changes requires a comprehensive approach to controlling the treatment processes.
In this specific case, the COD and BOD5 are reduced, and the treatment process ensures their maintenance within the maximum permissible limits according to the regulations for water discharge into water bodies. The efficiency of reducing the COD and BOD5 over the years (2018–2024), despite some minor fluctuations, remains high, at around 90%.
The coefficient K indicates that in the incoming water during November, following the active season in 2019, 2020, and 2021, there was a higher amount of hard-to-degrade pollutants. These years are associated with the COVID-19 pandemic. It is assumed that these non-degradable pollutants are mainly organic xenobiotics used for treatment and disinfection, such as antibiotics, steroids, detergents, and other disinfectants. It is also likely that there are increased amounts of microplastics and nanoplastics due to the use of more personal care and protection products. This is particularly evident in the dynamics of suspended solids. This trend is even more pronounced in the treated water at the outlet, where easily degradable organic matter has been removed, leaving mainly hard-to-degrade xenobiotics in the water. K was low in November after the summer seasonal load for 2018 and 2020, the years around the COVID-19 pandemic. Low K was also observed in 2023 and 2024, when there was an increased number of tourists during the season, leading to increased use of personal hygiene products, steroids, pharmaceuticals, and other xenobiotics [70]. The fluctuations of K at the outlet during the studied years were greater, indicating the instability of K, i.e., the uneven dynamics of the entry of non-degradable and hard-to-degrade substances from the watch list [70,71,72]. It is clear that innovative solutions should be sought in this direction, such as the integration of innovative modules for the detoxification of treated water or the stimulation of targeted development of microbial populations in the WWTP, which are more active in the biodegradation of xenobiotic organic pollutants during the treatment process, highly specialized biofilters, hybrid modules including plasma treatment, and others [73,74].
If we compare the elimination of biogenic elements such as carbon, nitrogen, and phosphorus from wastewater, it is evident that carbon-containing compounds, especially easily degradable organic matter, are effectively removed.
It is notable that the efficiency of nitrogen and phosphorus removal is lower, approximately between 40 and 70% for nitrogen and between 20 and 60% for phosphorus. During the COVID-19 years, the removal efficiency decreased, which is associated, on one hand, with the increased amount of hard-to-degrade washing agents, personal and communal disinfection, and hygiene products and, on the other hand, the higher water volume per person and relatively lower amount of degradable organic matter, complicating the processes of denitrification and microbial dephosphatation [70,75].
Nevertheless, the levels of total nitrogen and phosphorus in the effluent remain within the maximum permissible limits [58].
It is necessary to seek mechanisms to increase the rate of denitrification and microbial dephosphatation in the process of improving the efficiency of biogenic element elimination. These possibilities are clearly visible from the obtained results regarding the quantity of aerobic and anaerobic heterotrophs, denitrifying bacteria, and bacteria of the genera Pseudomonas and Acinetobacter. Denitrifying bacteria and bacteria of the genus Pseudomonas are directly responsible for denitrification, while the genera Pseudomonas and Acinetobacter are involved in microbial dephosphatation through the accumulation of polyphosphates in their microbial cells [42].
All the studied groups of microorganisms are present in higher quantities in November during the contraction of the treatment scheme and preparation for the reduced winter operating mode. This indicates that during the active season, they were in high quantities and highly active in the intensively working activated sludge. The lower quantity of the studied bacterial groups in April demonstrates a repeatedly confirmed characteristic of microbial populations in activated sludge: during adaptation to a more expanded and intensive operating mode, the microorganisms in the activated sludge first respond by increasing their enzymatic activities and overall metabolic activity, followed by an increase in their quantity [42,76]. This observed fact confirms that in April, the activated sludge (AS) has a large and highly reactive metabolic adaptive potential. It also confirms that in both April and November, the AS contains a sufficiently high quantity of target microorganisms, which, under optimal conditions, can increase the rate of denitrification coupled with the rate of microbial dephosphatation.
Another well-documented fact in the literature is that bacteria from the Pseudomonas and Acinetobacter groups are among the genera with the highest plasticity and adaptability for degrading toxic compounds. This adaptive potential enables the simultaneous increase in the rates of denitrification, microbial dephosphatation, and detoxification of toxic, hard-to-degrade xenobiotics [75].
The high fluctuations in nitrogen removal efficiency confirm the need for measures to improve the elimination of nitrogen-containing organic matter, which can be achieved by optimizing denitrification. During the summer months of the active tourist season, when the load of biogenic elements, including total nitrogen, is higher, this is accomplished by activating four SBRs, where denitrification is enhanced and better controlled [77].
The lower F/M ratio in 2019, 2020, and 2021 indicates an increased quantity of filamentous microorganisms compared to ordinary bacteria in the denitrification zone. This, in turn, is an indicator of either the starvation of the activated sludge (AS) or the presence of toxic pollutants, suggesting that these factors were present during the COVID-19 years. Filamentous bulking of the AS, as indicated by the SVI, is again observed in the denitrification zone. At higher COD levels in this zone, bulking can be avoided by increasing the F/M ratio. Elemental analysis confirms that there are no toxic concentrations of metals and metalloids that would threaten the treatment process and the quality of the treated water. This is essential for maintaining the health of marine ecosystems and ensuring the safety of recreational activities such as swimming, diving, and fishing. This contributes to the overall attractiveness and sustainability of high-quality tourism in the region.
The following processes can be noted as critical: denitrification, microbial dephosphatation, and the elimination of organic toxic compounds that remain in the treated water. Based on the discussion, the following measures can be proposed to increase the efficiency of the work of the Ravda WWTP that can be applied separately or simultaneously.
  • Expanding the technological scheme through the enhancement and better control of denitrification. This is planned and currently being implemented during the summer operating mode.
  • Increasing the rate of microbial dephosphatation and detoxification through targeted management of the activity and quantity of the microbial segment in the activated sludge (AS) of the genera Pseudomonas and Acinetobacter, as well as regulating the F/M ratio by maintaining an appropriate concentration of organic matter and the ratio of biogenic elements, carbon–nitrogen–phosphorus, optimal for the respective components of the overall treatment process.
  • Microscopic monitoring of the floccular structure of the activated sludge is suitable for tracking and controlling potential deformations resulting from inappropriate parameters of the treatment process.
  • The integration of a plasma module for the elimination of toxic pollutants and pathogens at the outlet is possible, along with other tested innovative modules such as specialized biofilters with zeolite as a carrier [78].
  • Long-term and comprehensive monitoring of the operation of WWTPs that treat water from seasonal tourism provides valuable information on the possibilities for maintaining sustainable water cycle functioning in regions where the main economic sector is mass tourism [79]
  • Innovations and the sustainability of water treatment processes in tourist facilities with high economic impact would ensure conditions for the sustainable functioning of water cycles, linked to sustainable water and environmental management in regions with intensive tourism [80].
However, some limitations of the study have to be noted as well. WWTP is unique in its design, and this case study can be used for the development of other coastal areas where tourism is essential for local economics, but this fact does not give us the opportunity for comparison. The data in this study focus on periods when some of the equipment is switching on and off and do not compare parameters in summer and winter. This is an area for future research.

5. Conclusions

The results confirm that the transition from summer to winter and winter to summer operating modes at the Ravda WWTP can be carried out relatively smoothly and satisfactorily. This is based on the great potential of the biotechnological system to respond to the technological expansion and biological adaptation of the activated sludge.
The implementation of innovative solutions and measures as mentioned in the discussion would increase the efficiency of the Ravda WWTP and reduce the risk of nitrogen, phosphorus, and toxic organics entering the Black Sea. These issues will be the focus of the team’s future efforts.

Author Contributions

Conceptualization, Y.T.; methodology, M.B. and V.L.; software, I.Y. and M.B.; validation, M.B., I.Y. and V.L.; investigation, M.B., I.Y. and V.L.; writing—original draft preparation, M.B., Y.T. and V.L.; writing—Y.T. review and editing, visualization, M.B. and I.Y.; project administration Y.T. and I.Y. All authors have read and agreed to the published version of the manuscript.

Funding

This research was funded by the Grant Project “Clean Technologies for Sustainable Environment–Water, Waste, Energy for a Circular Economy”, financed by the Bulgaria Programme “Research, Innovation and Digitalisation for Smart Transformation”: BG16RFPR002-1.014 and Project No.: 80-10-83/11.04.2024-Circular Solutions for the Removal of Micro- and Nanoplastics in the “Ravda” Wastewater Treatment Plant, funded by the Research Fund—Sofia University “St. Kliment Ohridski”.

Data Availability Statement

The data that are presented in this study are available on request from the corresponding author.

Acknowledgments

This research was supported by the Municipal enterprise for waste treatment of Burgas City and WWTP “Ravda”.

Conflicts of Interest

The authors declare no conflicts of interest.

References

  1. Pasciucco, F.; Pecorini, I.; Iannelli, R. Centralization of wastewater treatment in a tourist area: A comparative LCA considering the impact of seasonal changes. Sci. Total Environ. 2023, 897, 165390. [Google Scholar] [CrossRef] [PubMed]
  2. Lichtmannegger, T.; Hell, M.; Wehner, M.; Ebner, C.; Bockreis, A. Seasonal tourism’s impact on wastewater composition: Evaluating the potential of alternating activated adsorption in primary treatment. Sci. Total Environ. 2024, 926, 171869. [Google Scholar] [CrossRef] [PubMed]
  3. Franco, A.A.; Iglesias-Arroyo, D.; Egea-Corbacho, Á.; Martín-García, A.P.; Quiroga, J.M.; Coello, M.D. Influence of tourism on microplastic contamination at wastewater treatment plants in the coastal municipality of Chiclana de la Frontera. Sci. Total Environ. 2023, 900, 165573. [Google Scholar] [CrossRef] [PubMed]
  4. Gössling, S.; Hall, M.C. Tourism and Global Environmental Change; Taylor & Francis: Abingdon, UK, 2006. [Google Scholar]
  5. Cissé, G. Transitioning to Clean Water and Sanitation; MDPI—Multidisciplinary Digital Publishing Institute: Basel, Switzerland, 2021; p. 102. [Google Scholar]
  6. Geng, Y.; Maimaituerxun, M.; Zhang, H. Coupling coordination of water governance and tourism: Measurement and prediction. Discret. Dyn. Nat. Soc. 2020, 2020, 3683918. [Google Scholar] [CrossRef]
  7. Gössling, S.; Peeters, P.; Hall, C.M.; Ceron, J.P.; Dubois, G.; Scott, D. Tourism and water use: Supply, demand, and security. An international review. Tour. Manag. 2012, 33, 1–15. [Google Scholar] [CrossRef]
  8. Zorpas, A.A.; Coumi, C.; Drtil, M.; Voukalli, I. Municipal sewage sludge characteristics and waste water treatment plant effectiveness under warm climate conditions. Desalination Water Treat. 2011, 36, 319–333. [Google Scholar] [CrossRef]
  9. Ranieri, F.; D’Onghia, G.; Uricchio, A.F.; Cristina, R.A.; Lopopolo, L.; Ranieri, E. Sustainable tourism in the Tremiti Islands (South Italy). Sci. Rep. 2024, 14, 19021. [Google Scholar] [CrossRef]
  10. Gattringer, H.; Claret, A.; Radtke, M.; Kisser, J.; Zraunig, A.; Rodriguez-Roda, I.; Buttiglieri, G. Novel vertical ecosystem for sustainable water treatment and reuse in tourist resorts. Int. J. Sustain. Dev. Plan. 2016, 11, 263–274. [Google Scholar] [CrossRef]
  11. Siwek, J.P.; Biernacki, W. Effect of tourism-generated wastewater on biogenic ions concentrations in stream water in Tatra National Park (Poland). J. Prot. Mt. Areas Res. Manag. 2016, 8, 43–52. [Google Scholar] [CrossRef]
  12. Boller, M. Small wastewater treatment plants—A challenge to wastewater engineers. Water Sci. Technol. 1997, 35, 1–12. [Google Scholar] [CrossRef]
  13. Cullen, R.; Dakers, A.J.; McNicol, J.; Meyer-Hubbert, G.K.; Simmons, D.G.; Fairweather, J.R. Tourism, Water and Waste in Akaroa: Implications of Tourist Demand on Infrastructure; Lincoln University: Canterbury, New Zealand, 2003. [Google Scholar]
  14. Đurišić-Mladenović, N.; Živančev, J.; Antić, I.; Rakić, D.; Buljovčić, M.; Pajin, B.; Llorca, M.; Farre, M. Occurrence of contaminants of emerging concern in different water samples from the lower part of the Danube River Middle Basin—A review. Environ. Pollut. 2024, 363, 25128. [Google Scholar] [CrossRef] [PubMed]
  15. Cervantes-Cocom, G.; Chan-Ceh, C.G. Water management and environmental education as facilitators of sustainable tourism development in Valladolid, Yucatan. Tecnol. Cienc. Agua 2020, 11, 31–91. [Google Scholar] [CrossRef]
  16. Tomren, E. Development of a Wastewater Technology Selection Tool: An Assessment Method for Nutrient Management and Energy Efficiency in Remote Tourist Areas. Ph.D. Thesis, Murdoch University, Perth, Australia, 2008. [Google Scholar]
  17. Espigares, J.L.N.; Segura, J.A.M.; Torres, E.H. Water policy and tourism in Spain: A regional analysis. Rev. Port. Estud. Reg. 2009, 22, 47–61. [Google Scholar] [CrossRef]
  18. Yaw, F., Jr. Cleaner technologies for sustainable tourism: Caribbean case studies. J. Clean. Prod. 2005, 13, 117–134. [Google Scholar] [CrossRef]
  19. Di Nica, V.; Rizzi, C.; Finizio, A.; Ferraro, L.; Villa, S. Behavioural responses of juvenile Daphnia magna to two organophosphorus insecticides. J. Limnol. 2022, 81, 2015. [Google Scholar] [CrossRef]
  20. Zraunig, A.; Estelrich, M.; Gattringer, H.; Kisser, J.; Langergraber, G.; Radtke, M.; Rodriguez-Roda, I.; Buttiglieri, G. Long term decentralized greywater treatment for water reuse purposes in a tourist facility by vertical ecosystem. Ecol. Eng. 2019, 138, 138–147. [Google Scholar] [CrossRef]
  21. Pérez, D.M.G.; Martín, J.M.M.; Martínez, J.M.G.; Sáez-Fernández, F.J. An analysis of the cost of water supply linked to the tourism industry. An application to the case of the Island of Ibiza in Spain. Water 2020, 12, 2006. [Google Scholar] [CrossRef]
  22. Mycoo, M. Sustainable tourism using regulations, market mechanisms and green certification: A case study of Barbados. J. Sustain. Tour. 2006, 14, 489–511. [Google Scholar] [CrossRef]
  23. Moncheva, S.; Racheva, E.; Kamburska, L.; D’Hernoncourt, J. Environmental and management constraints on tourism in Varna Bay, Bulgarian Black Sea coast. Ecol. Soc. 2012, 17, 35. [Google Scholar] [CrossRef]
  24. Chave, P. The EU Water Framework Directive; IWA Publishing: London, UK, 2000. [Google Scholar]
  25. Reopanichkul, P.; Carter, R.W.; Worachananant, S.; Crossland, C.J. Wastewater discharge degrades coastal waters and reef communities in southern Thailand. Mar. Environ. Res. 2010, 69, 287–296. [Google Scholar] [CrossRef]
  26. Antakyalı, D.; Krampe, J.; Steinmetz, H. Practical application of wastewater reuse in tourist resorts. Water Sci. Technol. 2008, 57, 2051–2057. [Google Scholar] [CrossRef] [PubMed]
  27. Mill, G.A.; Theophilou, J.A. Effluent re-use in a tourist resort—Larnaca sewage treatment and irrigation project—Cyprus. Water Sci. Technol. 1995, 32, 115–124. [Google Scholar] [CrossRef]
  28. Luckert, A.; Aguado, D.; García-Bartual, R.; Lafita, C.; Montoya, T.; Frank, N. Odour mapping and air quality analysis of a wastewater treatment plant at a seaside tourist area. Environ. Monit. Assess. 2023, 195, 1013. [Google Scholar] [CrossRef] [PubMed]
  29. Erdogan, N.; Tosun, C. Environmental performance of tourism accommodations in the protected areas: Case of Goreme Historical National Park. Int. J. Hosp. Manag. 2009, 28, 406–414. [Google Scholar] [CrossRef]
  30. Calheiros, C.S.; Franco, A.R.; Bessa, V.S.; Rangel, A.O.; Castro, P.M. Microbial communities inhabiting a constructed wetland applied to tourism wastewater treatment. In Proceedings of the Microbiotec ‘11—Portuguese Society for Microbiology, Braga, Portugal, 1–3 December 2011. [Google Scholar]
  31. Fatta, D.; Arslan Alaton, I.; Gokcay, C.; Rusan, M.M.; Assobhei, O.; Mountadar, M.; Papadopoulos, A. Wastewater reuse: Problems and challenges in Cyprus, Turkey, Jordan and Morocco. Eur. Water 2005, 11, 63–69. [Google Scholar]
  32. Zorpas, A.A.; Voukkali, I.; Loizia, P. The impact of tourist sector in the waste management plans. Desalination Water Treat. 2015, 56, 1141–1149. [Google Scholar] [CrossRef]
  33. Raschke, N. Environmental impact assessment as a step to sustainable tourism development. WIT Trans. Ecol. Environ. 2024, 84, 303–313. [Google Scholar]
  34. Otterpohl, R.; Wendland, C.; Al-Baz, I. Efficient Management of Wastewater: Its Treatment and Reuse in Water-Scarce Countries; Springer: Berlin/Heidelberg, Germany, 2008. [Google Scholar]
  35. Staunstrup, J.K.; Hjalager, A.M.; Steffansen, R.N.; Sørensen, M.T. Water footprints and sewage management challenges in second home tourism. Environ. Plan. E Nat. Space 2023, 6, 113–131. [Google Scholar] [CrossRef]
  36. Smith, B.G.; Ley, D. Sustainable tourism and clean water project for two Guatemalan communities: A case study. Desalination 2009, 248, 225–232. [Google Scholar] [CrossRef]
  37. Kavanagh, L.J.; Keller, J. Engineered ecosystem for sustainable on-site wastewater treatment. Water Res. 2007, 41, 1823–1831. [Google Scholar] [CrossRef]
  38. Gaulke, L.S.; Weiyang, X.; Scanlon, A.; Henck, A.; Hinckley, T. Evaluation criteria for implementation of a sustainable sanitation and wastewater treatment system at Jiuzhaigou National Park, Sichuan Province, China. Environ. Manag. 2010, 45, 93–104. [Google Scholar] [CrossRef] [PubMed]
  39. Frone, S.M.; Frone, D.F. Sustainable tourism and water supply and sanitation development in Romania. J. Tour. Hosp. Manag. 2013, 1, 140–153. [Google Scholar]
  40. Mycoo, M. Sustainable Tourism, Climate Change and Sea Level Rise Adaptation Policies in Barbados. Nat. Resour. Forum 2014, 38, 47–57. [Google Scholar] [CrossRef]
  41. Farsari, I.; Prastacos, P. Sustainable Tourism Indicators: Pilot Estimation for the Municipality of Hersonissos. In Proceedings of the International Scientific Conference “Tourism on Islands and Specific Destinations”, University of the Aegean, Chios, Greece, 14–16 December 2000. [Google Scholar]
  42. Topalova, Y. Biological Control and Management of Water Treatment; SaySet-Eco: Sofia, Bulgaria, 2009; p. 315. [Google Scholar]
  43. Orhon, D.; Sekoulov, I.; Dulkadiroglu, H. Innovative technologies for wastewater treatment in coastal tourist areas. Water Sci. Technol. 2002, 46, 67–74. [Google Scholar] [CrossRef]
  44. Creo, C.; Fraboni, C. Awards for the sustainable management of coastal tourism destinations: The example of the Blue Flag program. J. Coast. Res. 2011, 61, 378–381. [Google Scholar] [CrossRef]
  45. Carić, H.; Mackelworth, P. Cruise tourism environmental impacts–The perspective from the Adriatic Sea. Ocean. Coast. Manag. 2014, 102, 350–363. [Google Scholar] [CrossRef]
  46. Keskin, F.; Demirak, A.; Özdemir, N.; Özkan, H.; Özkan, A.; Aslan, A. The Impact of COVID-19 on Water Consumption and Treatment Capacity in Tourism Area: Example of Bodrum. J. Int. Environ. Appl. Sci. 2022, 17, 156–164. [Google Scholar]
  47. UN and Partners Appeal for US$ 43.4 Million to Help Refugees from Ukraine in Bulgaria. 2023. Available online: https://www.unhcr.org/bg/16607-un-and-partners-appeal-for-us-43-4-million-to-help-refugees-from-ukraine-in-bulgaria.html (accessed on 16 November 2024).
  48. After One Year of the War in Ukraine, UNICEF Calls to Continue Support and Solidarity for Ukrainian Children in Bulgaria. 2023. Available online: https://www.unicef.org/bulgaria/en/press-releases/after-one-year-war-ukraine-unicef-calls-continue-support-and-solidarity-ukrainian (accessed on 16 November 2024).
  49. UNICEF Fact Sheet. Ukraine Refugee Response in Bulgaria. 2023. Available online: https://www.unicef.org/bulgaria/en/media/16326/file/UNICEF%20Bulgaria%20Factsheet%20September%202023.pdf (accessed on 16 November 2024).
  50. National Statistical Institute. Available online: https://infostat.nsi.bg/ (accessed on 8 October 2024).
  51. Valchev, D.; Ribarova, I.; Uzunov, B.; Stoyneva-Gärtner, M.; Lyubomirova, V. Reclamation potential of onsite wastewater post-treatment with microalgae: Chemical elements perspective. Processes 2023, 11, 1819. [Google Scholar] [CrossRef]
  52. Lyubomirova, V.; Mihaylova, V.; Djingova, R. Chemical characterization of Bulgarian bottled mineral waters. J. Food Compos. Anal. 2020, 93, 103595. [Google Scholar] [CrossRef]
  53. BDS EN 14702-1; Characterization of Sludges—Settling Properties. Part 1: Determination of Settleability. Determination of the Proportion of Sludge Volume and Sludge Volume Index. European Committee for Standardization: Brusseles, Belgium, 2006; p. 16.
  54. Rice, E.W.; Bridgewater, L.; American Public Health Association. Standard Methods for the Examination of Water and Wastewater; American Public Health Association: Washington, DC, USA; Volume 10.
  55. BDS EN ISO 5815-1:2019; Water Quality—Determination of Biochemical Oxygen Demand After n Days (BODn)—Part 1: Dilution and Seeding Method with Allylthiourea Addition. ISO: Geneva, Switzerland, 2019.
  56. BDS EN 25663:2000; Water Quality—Determination of Kjeldahl Nitrogen—Method After Mineralization with Selenium. ISO: Geneva, Switzerland, 2000.
  57. BDS EN ISO 6878:2005; Water Quality—Determination of Phosphorus—Ammonium Molybdate Spectrometric Method. ISO: Geneva, Switzerland, 2005.
  58. Kuznetzov, S.I.; Dubinina, G.A. Methods for Investigation of Waters Microorganisms; Academy of Sciences of the USSR: Moskow, Russia, 1989. [Google Scholar]
  59. Basak, S.; Shetty, P.H. Conventional Microbial Counting and Identification Techniques. In Techniques to Measure Food Safety and Quality; Khan, M.S., Shafiur Rahman, M., Eds.; Springer: Berlin/Heidelberg, Germany, 2021. [Google Scholar]
  60. Annual Report and Comparative Analysis of the State of the Water and Sewerage Sector in the Republic of Bulgaria for 2020. Available online: https://dker.bg/uploads/documents/vik/prot_215_21.pdf (accessed on 17 November 2024).
  61. Complex permit of Ravda WWTP issued by the Ministry of Environment and Water of the Republic of Bulgaria. Unpublished work.
  62. Colmenarejo, M.F.; Rubio, A.; Sanchez, E.; Vicente, J.; Garcia, M.G.; Borja, R. Evaluation of municipal wastewater treatment plants with different technologies at Las Rozas, Madrid (Spain). J. Environ. Manag. 2006, 81, 399–404. [Google Scholar] [CrossRef]
  63. Maciołek, P.; Szymański, K.; Janowska, B.; Włodarczyk-Makuła, M. Improving efficiency of nitrogen removal from municipal wastewater in modified A2O technological system–case study. Desalination Water Treat. 2021, 229, 116–133. [Google Scholar] [CrossRef]
  64. Bunce, J.T.; Ndam, E.; Ofiteru, I.D.; Moore, A.; Graham, D.W. A review of phosphorus removal technologies and their applicability to small-scale domestic wastewater treatment systems. Front. Environ. Sci. 2018, 6, 8. [Google Scholar] [CrossRef]
  65. Li, Y.; Bai, X.; Ding, R.; Lv, W.; Long, Y.; Wei, L.; Xiang, F.; Wang, R. Removal of phosphorus and ammonium from municipal wastewater treatment plant effluent by manganese ore in a simulated constructed wetland. Environ. Sci. Pollut. Res. 2021, 28, 41169–41180. [Google Scholar] [CrossRef] [PubMed]
  66. Regulation No H-4 of 14.09.2012 on the Characterisation of Surface Waters. Available online: https://legislation.apis.bg/doc/1003915/0 (accessed on 10 November 2024).
  67. Torfs, E.; Nopens, I.; Winkler, M.K.H.; Vanrolleghem, P.A.; Balemans, S.; Smets, I.Y. Settling Tests; IWA Publishing: London, UK, 2016. [Google Scholar]
  68. Dimkov, R.; Topalova, Y.; Schneider, I. Ecological Biotechnology. In Environmental Biotechnology; SscieSet Eco: Sofia, Bulgaria, 2017; p. 396. [Google Scholar]
  69. Wells, E.C.; Zarger, R.K.; Whiteford, L.M.; Mihelcic, J.R.; Koenig, E.S.; Cairns, M.R. The impacts of tourism development on perceptions and practices of sustainable wastewater management on the Placencia Peninsula, Belize. J. Clean. Prod. 2016, 111, 430–441. [Google Scholar] [CrossRef]
  70. Ibrahim, Y.; Yusof, Y. Towards sustainable environmental management through green tourism: Case study on Borneo rainforest lodge. Asian J. Tour. Res. 2017, 2, 123–143. [Google Scholar] [CrossRef]
  71. Gabarda Mallorquí, A.; Fraguell Sansbelló, R.M.; Pavón, D.; Ribas Palom, A. Tourist development and wastewater treatment in the Spanish Mediterranean coast: The Costa Brava case study. Int. J. Sustain. Dev. Plan. 2016, 11, 245–254. [Google Scholar] [CrossRef]
  72. Vo, V.; Tillett, R.L.; Papp, K.; Chang, C.L.; Harrington, A.; Moshi, M.; Oh, E.C.; Gerrity, D. Detection of the Omicron BA. 1 variant of SARS-CoV-2 in Wastewater from a Las Vegas Tourist area. JAMA Netw. Open 2023, 6, e230550. [Google Scholar] [CrossRef]
  73. Tsagarakis, K.P.; Mara, D.D.; Angelakis, A.N. Wastewater management in Greece: Experience and lessons for developing countries. Water Sci. Technol. 2001, 44, 163–172. [Google Scholar] [CrossRef]
  74. Sha, C.; Shen, S.; Zhang, J.; Zhou, C.; Lu, X.; Zhang, H. A Review of Strategies and Technologies for Sustainable Decentralized Wastewater Treatment. Water 2024, 16, 3003. [Google Scholar] [CrossRef]
  75. Frone, S.; Frone, D.F. Water supply and sanitation development as a requirement for sustainable tourism development in Romania. In Proceedings of the WSEAS Tourism and Economic Development, Drobeta Turnu Severin, Romania, 27–29 October 2011; pp. 464–469. [Google Scholar]
  76. Angelakis, A.N.; Bontoux, L. Wastewater reclamation and reuse in Eureau countries. Water Policy 2001, 3, 47–59. [Google Scholar] [CrossRef]
  77. Oarga-Mulec, A.; Jenssen, P.D.; Klemenčič, A.K.; Uršič, M.; Bulc, T.G. Zero-discharge solution for blackwater treatment at remote tourist facilities. J. Clean. Prod. 2017, 166, 798–805. [Google Scholar] [CrossRef]
  78. Vera-Puerto, I.; Valdés, H.; Correa, C.; Olave, J.; Pérez, V.; Arias, C.A. Variation of thе feeding/resting period in modified vertical treatment wetlands (depth, zeolite as medium) employed for treating rural domestic wastewater in tourist areas. Water Sci. Amp; Technol. 2023, 88, 1394–1403. [Google Scholar] [CrossRef] [PubMed]
  79. Pankow, N.; Krause, S.; Schaum, C. Resilience Adaptation Through Risk Analysis for Wastewater Treatment Plant Operators in the Context of the European Union Resilience Directive. Water 2024, 16, 3098. [Google Scholar] [CrossRef]
  80. Boragno, V.; Bruzzi, L.; Tarantini, M.; Verità, S. The role of EMAS for sustainable coastal tourism. In Proceedings of the 1st International Conference on the Management of Costal Recreational Resources–Beaches, Yacht Marinas and Coastal Ecotourism, Gozo, Malta, 25–27 October 2004; pp. 20–23. [Google Scholar]
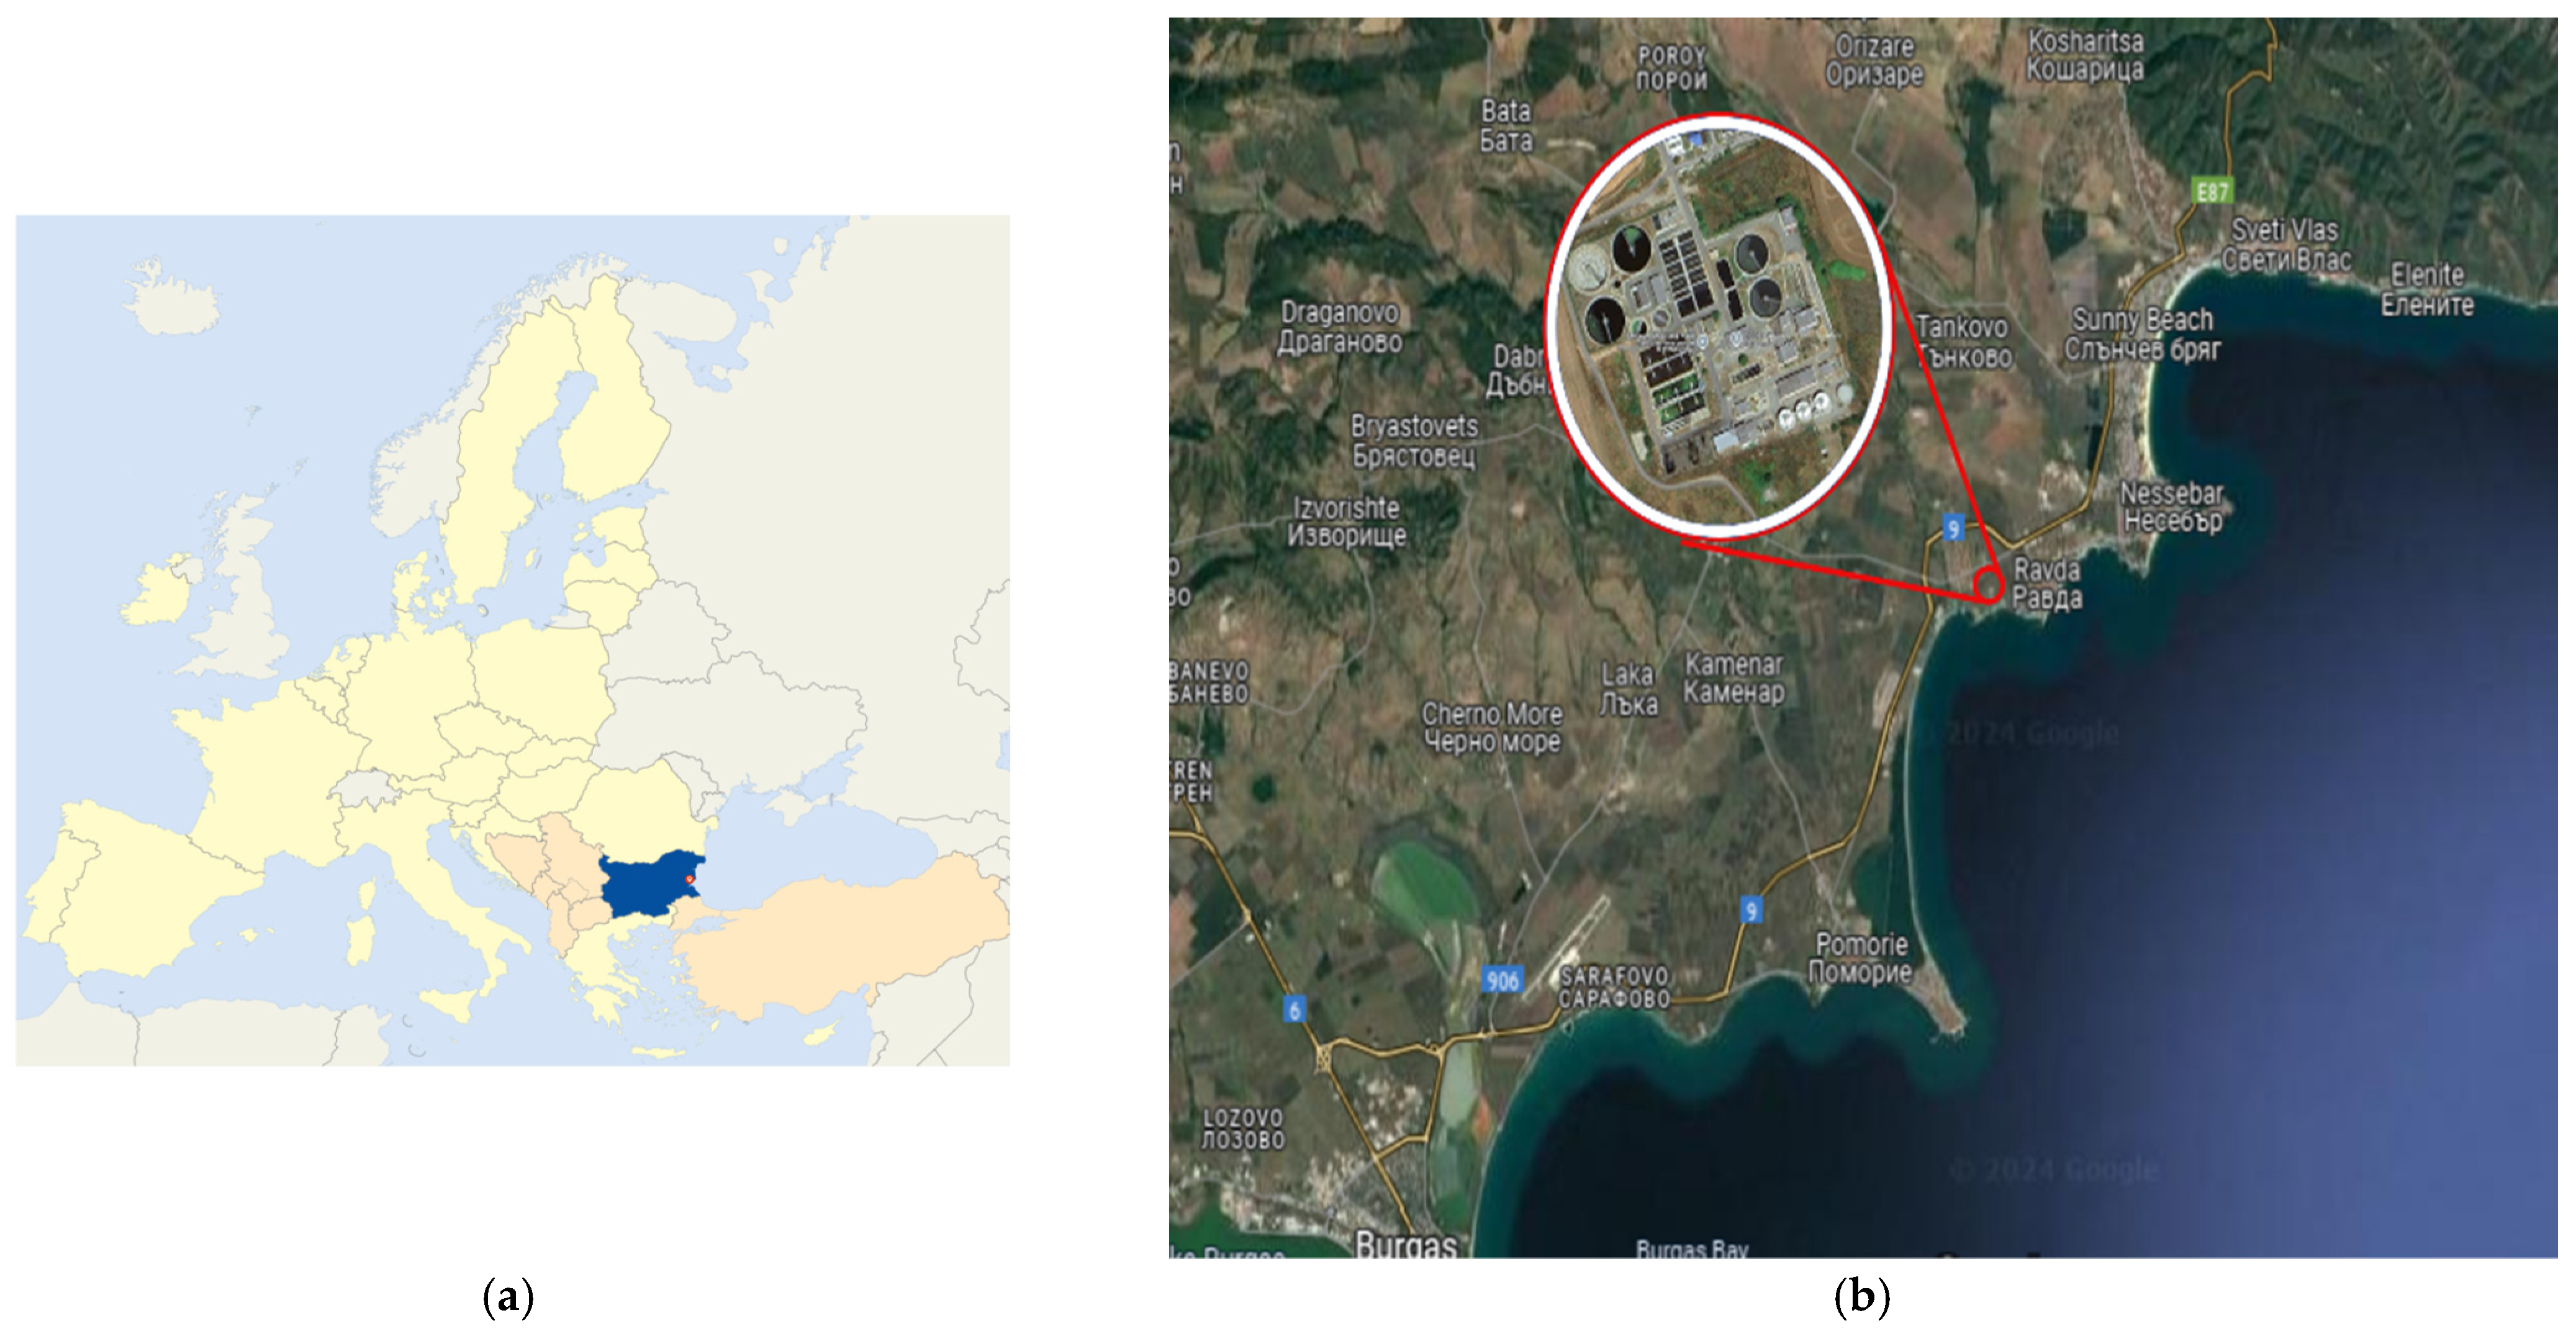
Figure 1. Location of Bulgaria (a) and Ravda WWTP (b).
Water 17 00007 g001
Figure 2. Simplified schema of WWTP in winter (left) and summer (right) with all its facilities.
Water 17 00007 g002
Figure 3. Water quantity per overnight (p = 0.001).
Water 17 00007 g003
Figure 4. COD (a) at inlet (p = 0.031), (b) at outlet (p = 0.005).
Water 17 00007 g004
Figure 5. BOD5 (a) at inlet (p = 0.012) (b) at outlet (p = 0.067).
Water 17 00007 g005
Figure 6. BOD5 to COD ratio—K: (a) at the station inlet (p = 0.008); (b) at the station outlet (p = 0.001).
Water 17 00007 g006
Figure 7. Total nitrogen (a) at inlet (p = 0.023); (b) at outlet (p = 0.067).
Water 17 00007 g007
Figure 8. Total phosphorus (a) at inlet (p = 0.001); (b) at outlet (p = 0.058).
Water 17 00007 g008
Figure 9. Removal effectiveness of COD (a) (p = 0.057) and BOD5 (b) (p = 0.084).
Water 17 00007 g009
Figure 10. Removal efficiency of TN (a) (p = 0.061) and TP (b) (p = 0.001).
Water 17 00007 g010
Figure 11. Content of suspended solids: (a) at the station inlet (p = 0.052); (b) at the station outlet (p = 0.053).
Water 17 00007 g011
Figure 12. Efficiency of suspended solids removal (p = 0.082) (a) and water temperature in bio-basins (p = 0.009) (b).
Water 17 00007 g012
Figure 13. F/M ratio (p = 0.071) (a) and volumetric load of the activated sludge/volumetric organic load (p = 0.046) (b).
Water 17 00007 g013
Figure 14. Sludge volume index for 30 min of settling time and optimal rates for normally operating activated sludge (p = 0.109).
Water 17 00007 g014
Figure 15. Mixed liquor suspended solids (p = 0.120).
Water 17 00007 g015
Figure 16. Images of activated sludge (Light microscope)/100×/from phosphorus release zone (1), denitrification zone (2), and nitrification zone (3) in 2023 (a) and 2024 (b).
Water 17 00007 g016
Figure 17. Dynamics of quantities of (a) aerobic heterotrophic bacteria and (b) anaerobic heterotrophic bacteria in the three zones in the WWTP for 2023 and 2024.
Water 17 00007 g017
Table 1. Conditions for the cultivation of functional and taxonomic groups of microorganisms.
Microbiological ParameterNutrient MediumManufacturerIncubation
Aerobic heterotrophs (AeH)Meat-peptone agar (MPA)HiMedia24 h, 28 °C
Anaerobic heterotrophs (AnH)Meat-peptone agar (MPA)HiMedia24 h, 28 °C
Denitrification bacteria (Dn)Giltai agarHiMedia7 days, 28 °C
Pseudomonas sp.GSPHiMedia24 h, 28 °C
Acinetobacter sp.SellersHiMedia24 h, 28 °C
Table 2. Concentrations of some macroelements (Na, K, Ca, Mg, P) in mg/L and some microelements (μg/L) in the wastewater samples.
El.Influent 2023Effluent 2023Influent 2024Effluent 2024El.Influent 2023Effluent 2023Influent 2024Effluent 2024
Na295 ± 9225 ± 7200 ± 4210 ± 5Li14.3 ± 0.412.7 ± 0.310.8 ± 0.310.1 ± 0.3
K19.7 ± 0.618.1 ± 0.511.7 ± 0.410.6 ± 0.3Mn196 ± 686 ± 3107 ± 31.7 ± 0.1
Ca135 ± 4105 ± 468 ± 264 ± 1Ni16.9 ± 0.514.7 ± 0.41.2 ± 0.11.3 ± 0.1
Mg38 ± 133 ± 128.9 ± 0.928.3 ± 0.8Rb8.0 ± 0.37.9 ± 0.26.6 ± 0.27.1 ± 0.2
Al142 ± 422.6 ± 0.719.0 ± 0.60.68 ± 0.02Sn0.15 ± 0.030.09 ± 0.010.18 ± 0.010.10 ± 0.01
As6.7 ± 0.23.4 ± 0.17.2 ± 0.24.6 ± 0.2Se9.7 ± 0.55.0 ± 0.28.1 ± 0.44.4 ± 0.2
Ba67 ± 27.3 ± 0.348 ± 223 ± 1Sr993 ± 40730 ± 36865 ± 39634 ± 28
Co1.32 ± 0.051.51 ± 0.040.69 ± 0.020.43 ± 0.02Ti383 ± 15316 ± 10339 ± 1245 ± 2
Cr2.1 ± 0.11.10 ± 0.0419.1 ± 0.619.8 ± 0.5V5.7 ± 0.24.9 ± 0.25.3 ± 0.36.6 ± 0.3
Cu8.6 ± 0.32.9 ± 0.12.1 ± 0.11.8 ± 0.1W3.1 ± 0.12.4 ± 0.110.0 ± 0.49.3 ± 0.4
Fe880 ± 26703 ± 21717 ± 22449 ± 13Zn18.1 ± 0.59.9 ± 0.310.1 ± 0.114.6 ± 0.3
Table 3. The quantity of denitrifying bacteria (p = 0.001) and bacteria from the genus Pseudomonas (p = 0.002) and genus Acinetobacter (p = 0.076).
Microbiological ParameterMonthPhosphorus Release BasinDenitrification BasinNitrification Basin
Denitrification BacteriaNovember 2023368,217 ± 581,840,149 ± 191,498,674 ± 252
April 20245833 ± 13897208 ± 9742460 ± 437
Pseudomonas sp.November 202346,802 ± 9730,855 ± 483345,358 ± 928
April 202418,264 ± 506917,857 ± 551917,103 ± 5913
Acinetobacter sp.November 2023464,147 ± 969423,792 ± 26,022814,324 ± 88,859
April 2024270,833 ± 4167572,078 ± 60,39016,468 ± 1984
Disclaimer/Publisher’s Note: The statements, opinions and data contained in all publications are solely those of the individual author(s) and contributor(s) and not of MDPI and/or the editor(s). MDPI and/or the editor(s) disclaim responsibility for any injury to people or property resulting from any ideas, methods, instructions or products referred to in the content.