Abstract
Accurate prediction of wave overtopping rates is essential for flood risk assessment along coral reef coastlines. This study quantifies the uncertainty sources affecting overtopping rates for vertical seawalls on reef flats, using ensemble simulations with a validated non-hydrostatic SWASH model. By generating extensive random wave sequences, we identify spectral resolution, wave spectral width, and wave groupiness as the dominant controls on the uncertainty. Statistical metrics, including the Coefficient of Variation () and Range Uncertainty Level (), demonstrate that overtopping rates exhibit substantial variability under randomized wave conditions, with exceeding 40% for low spectral resolutions (50–100 bins), while achieving statistical convergence ( around 20%) requires at least 700 frequency bins, far surpassing conventional standards. The , which describes the ratio of extreme to minimal overtopping rates, also decreases markedly as the number of frequency bins increases from 50 to 700. It is found that the overtopping rate follows a normal distribution with 700 frequency bins in wave generation. Simulations further demonstrate that overtopping rates increase by a factor of 2–4 as the JONSWAP spectrum peak enhancement factor () increases from 1 to 7. The wave groupiness factor () emerges as a predictor of overtopping variability, enabling a more efficient experimental design through reduction in groupiness-guided replication. These findings establish practical thresholds for experimental design and highlight the critical role of spectral parameters in hazard assessment.
1. Introduction
Coral (living organisms) reefs (natural or artificial structures similar to ridges) are abundant natural formations in oceanic environments, occupying only 1% of the ocean floor but supporting approximately 25% of marine life [1]. In addition to their ecological value, coral reefs protect about 71,000 km of global coastline [2]. The shallow reef flat that connects the steep fore reef and the reef island allows short wave energy to dissipate before reaching the shoreline, causing coral reefs to be considered natural breakwaters [2,3]. This protection is especially critical for low-lying reef islands, which are highly vulnerable to flooding and erosion. The loss of coral reefs can increase vulnerability and economic losses due to coastal hazards. Field measurements show that reef islands experience flooding from storms and swells [4,5]. This is in part due to the global degradation of coral reefs that has been observed in recent years, which exacerbates coastal flooding and storm surge impacts, with projected annual flood protection losses of 4 billion USD if current trends persist [6]. In addition, the formation mechanics of coral islands indicate that coral sands generated on the reef flat are transported and deposited in the back reef area by overtopping flows, resulting in island elevations typically lower than the runup of large waves [7,8]. Therefore, coastal flooding due to the overtopping of large waves is unavoidable for natural coral reef islands.
The existing literature mainly examines the physical dynamics of wave interactions with coral reefs. Short waves dissipate energy during breaking at the reef edge primarily as plunging breakers [9,10,11], while energy is transferred to low-frequency motions through breakpoint forcing, elevating nearshore water levels [12]. For short and smooth reef flats, low-frequency motions can excite resonance, amplifying the near-shore wave energy [13,14]. Theoretical work by Becker et al. [15] identified key parameters that govern dissipation and amplification effects. Field and mechanistic studies indicate that natural coral reefs alone may not suffice for land protection, necessitating artificial structures such as vertical seawalls, especially for critical infrastructure like airports [5,14,16,17,18].
Recent advances in machine learning (ML) have improved flood forecasting and stormwater management in coral reef environments. For example, Yao et al. [19] used neural networks to predict solitary wave runup over reefs, and Liu et al. [20] developed ML models for overtopping rates at seawalls on coral reefs. Although ML applications are common for continental coasts [21], their effectiveness in reef settings is limited by the scarce field data. Thus, numerical modeling and physical experiments remain the main tools for studying wave overtopping in coral reef environments.
The overtopping rate, or mean discharge per unit width, is crucial for seawall performance. Although continental coasts are well researched, coral reefs are not [22]. An overtopping formula for regular waves showed that overtopping decreases with longer reef flats Chen et al. [23], but inaccuracies arise as regular waves lack group structures and long waves. Liu et al. [22] noted that existing formulas fail in coral reef environments due to low-frequency wave prominence, and they developed a new one. The uncertainty of the overtopping rate is a known challenge in coastal engineering. The Eurotop manual suggests a 5% exceedance probability for design, but the causes of uncertainty are not fully understood. Williams et al. [24] used shallow-water models to show that overtopping rates vary greatly with the randomness of incoming waves. It was determined that a minimum of 32,768 frequency bins is necessary to discretize the spectrum for accurate reproduction of incoming waves. However, such a high level of spectral resolution proves impractical in physical experiments involving second-order corrections due to the significant computational expense required for time series reconstruction [25]. This necessitates further investigation into the uncertainty of overtopping and the determination of the minimal number of required frequency bins.
This paper examines uncertainty sources in overtopping rates along reef-fringed coasts by generating random incident wave sequences, focusing on wave randomness, spectral components, and spectral width. The main contributions are: (1) quantifying infragravity wave dominance and its role in overtopping; (2) ascertaining the minimal spectral resolution required for converged overtopping predictions, and determining the statistical distribution of overtopping rates; (3) identifying wave groupiness as a predictor, enabling efficient experimental design. The remainder of this paper is organized as follows. Section 2 details the numerical model, wave parameter estimation, physical model validation, and numerical experiment design. Section 3 presents results on cross-reef wave transformation, effects of spectral resolution and bandwidth, and the role of wave groupiness. Section 4 summarizes key conclusions and practical implications.
2. Methods
2.1. Numerical Model
The non-hydrostatic wave model SWASH [26] was employed to simulate wave transformation over coral reefs and overtopping at seawalls. The governing equations for SWASH are given as follows:
where x and z denote the horizontal and vertical coordinates, respectively, and t represents time. The variables and correspond to the horizontal and vertical velocity components. The hydrostatic and non-hydrostatic pressures are denoted by and , respectively. is the water density, and represents the turbulent stress term, which is modeled using the standard turbulence closure. At the bottom boundary, the turbulent shear stress is described by the quadratic friction law, with the drag coefficient determined according to Manning’s formula:
where n is the Manning roughness coefficient, is the total water depth, h is the still water depth, and is the free surface elevation relative to the still water level.
The model utilizes the Keller–Box scheme for non-hydrostatic pressure computation, enabling accurate simulation of wave dispersion relations with a limited number of vertical layers. With a single vertical layer, the dispersion error is less than 1% for and less than 3% for , where k is the wave number. Additionally, the model employs a second-order weakly reflective wavemaker boundary, based on weakly nonlinear wave theory, to account for incident (bound) infragravity waves and suppress re-reflection [27].
To address the limitations associated with a reduced number of vertical layers in simulating wave breaking, the model applies the following criterion to deactivate the non-hydrostatic pressure term when the wave front steepness exceeds a specified threshold, thereby initiating wave breaking:
where is an empirical coefficient representing the threshold steepness of the wave front at the breakpoint. In practice, is calibrated to reproduce observed breaking behavior and overtopping rates. Furthermore, the model employs a single-valued function to track the free surface elevation; thus, the wave roller is not explicitly represented. Nevertheless, previous studies indicate that the effects of surface rollers on radiation stress can be partially accounted for [28], and the model can yield accurate predictions of wave overtopping rates [29].
2.2. Estimation of Wave Parameters
The significant wave heights of short () and infragravity waves () are delineated as follows:
where is the spectral density, and is the spectral peak frequency.
In accordance with Liu et al. [18], we employ the Coefficient of Variation () as a statistical tool to quantify the dispersion of data points of the variable X in relation to its mean. An increased reflects more pronounced fluctuations in the data points with respect to the mean, thereby indicating a greater level of dispersion.
Here, the subscript i is the index of data points, and is the standard deviation.
Given that uncertainty in the sequence of the incident wave train may result in overtopping discharge variations by several magnitudes, the Range Uncertainty Level () is established to mitigate significant discrepancies arising from scale differences.
where the subscript “percent value” represents the cumulative frequency.
The normalized parameter is employed to quantitatively evaluate deviations in overtopping discharge related to various spectral peak factors. Using the spectral peak factor as a baseline, the Normalized Ensemble Averages () are articulated as follows:
The groupiness of the incident wave train causes differences in the breaking location, breaking wave height, and energy attenuation of each wave, thereby affecting overtopping discharge. Liu and Li [30] defined the concept of Wave Height History (), using period as a weight for wave height while considering both height and period, to describe changes in wave group structure. Its definition is as follows:
Here, denotes the time at nth zero-downcrossing point, while represents the wave height of the nth wave, determined through the application of the zero-downcrossing method on the short-wave surface.
The wave groupiness factor is defined as follows, which statistically measures the role of wave groups in spatiotemporal evolution.
2.3. Physical Model Experiment
To validate the SWASH model, a series of physical model experiments were conducted in the wave–current flume at the State Key Laboratory of Hydraulic Engineering Intelligent Construction and Operation, Tianjin University, China (see Figure 1). The flume is 35 m in length, 1 m in width, and 1 m in height. It is equipped with a positive absorption wavemaker capable of second-order correction for low-frequency waves.
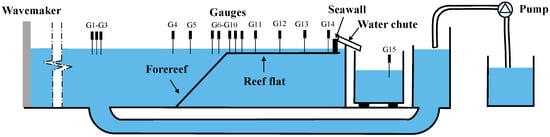
Figure 1.
Experimental setup of the wave–current flume, where G1–G15 are wave gauges.
An idealized reef model constructed using PVC was installed in the flume. The fore-reef slope was set to 1:5, the reef-flat length was m, and the reef height was 0.5 m. At the right end of the reef flat, a vertical seawall with a height of 10 cm was installed. A water chute (10 cm wide) directed overtopped water into a collection tank. To maintain a stable water level during each test, an additional tank and pump system were used to compensate for the overtopped water volume, ensuring water level fluctuations remained below 1 mm. A total of 15 wave gauges were placed along the flume to measure wave heights and overtopping rates. The first three gauges were positioned in the off-reef region to separate incident and reflected waves, following the method of Mansard and Funke [31]. The final gauge was used to measure the overtopping volume.
Three test cases were performed with the water depth on the reef flat set to m. The wave parameters for each case were: (1) cm, s; (2) cm, s; and (3) cm, s, where is the significant wave height of incident waves and is the peak wave period. The wave conditions were generated using a JONSWAP spectrum with a peak enhancement factor . For each test, the incident wave time series was generated to ensure that the repetition period of the wave sequence exceeded . The assessment of repeatability concerning local wave conditions at the seawall and overtopping rates demonstrated that the coefficients of variation for wave height, wave period, and overtopping rates were less than 1.1%, 2.5%, and 5.2%, respectively.
2.4. Validation of Numerical Model
The numerical flume established using SWASH was designed according to the physical model experiment. To prevent waves overtopping the vertical wall from interfering with the results, a 3 m sponge layer and a radiation boundary condition were applied at the outflow boundary behind the seawall. The horizontal grid size cm according to sensitive analysis, with one layer in the vertical direction. The Manning coefficient, referencing Suzuki et al. [29], was set at 0.012 s/m1/3. The wave gauge positions matched those in the physical model experiment.
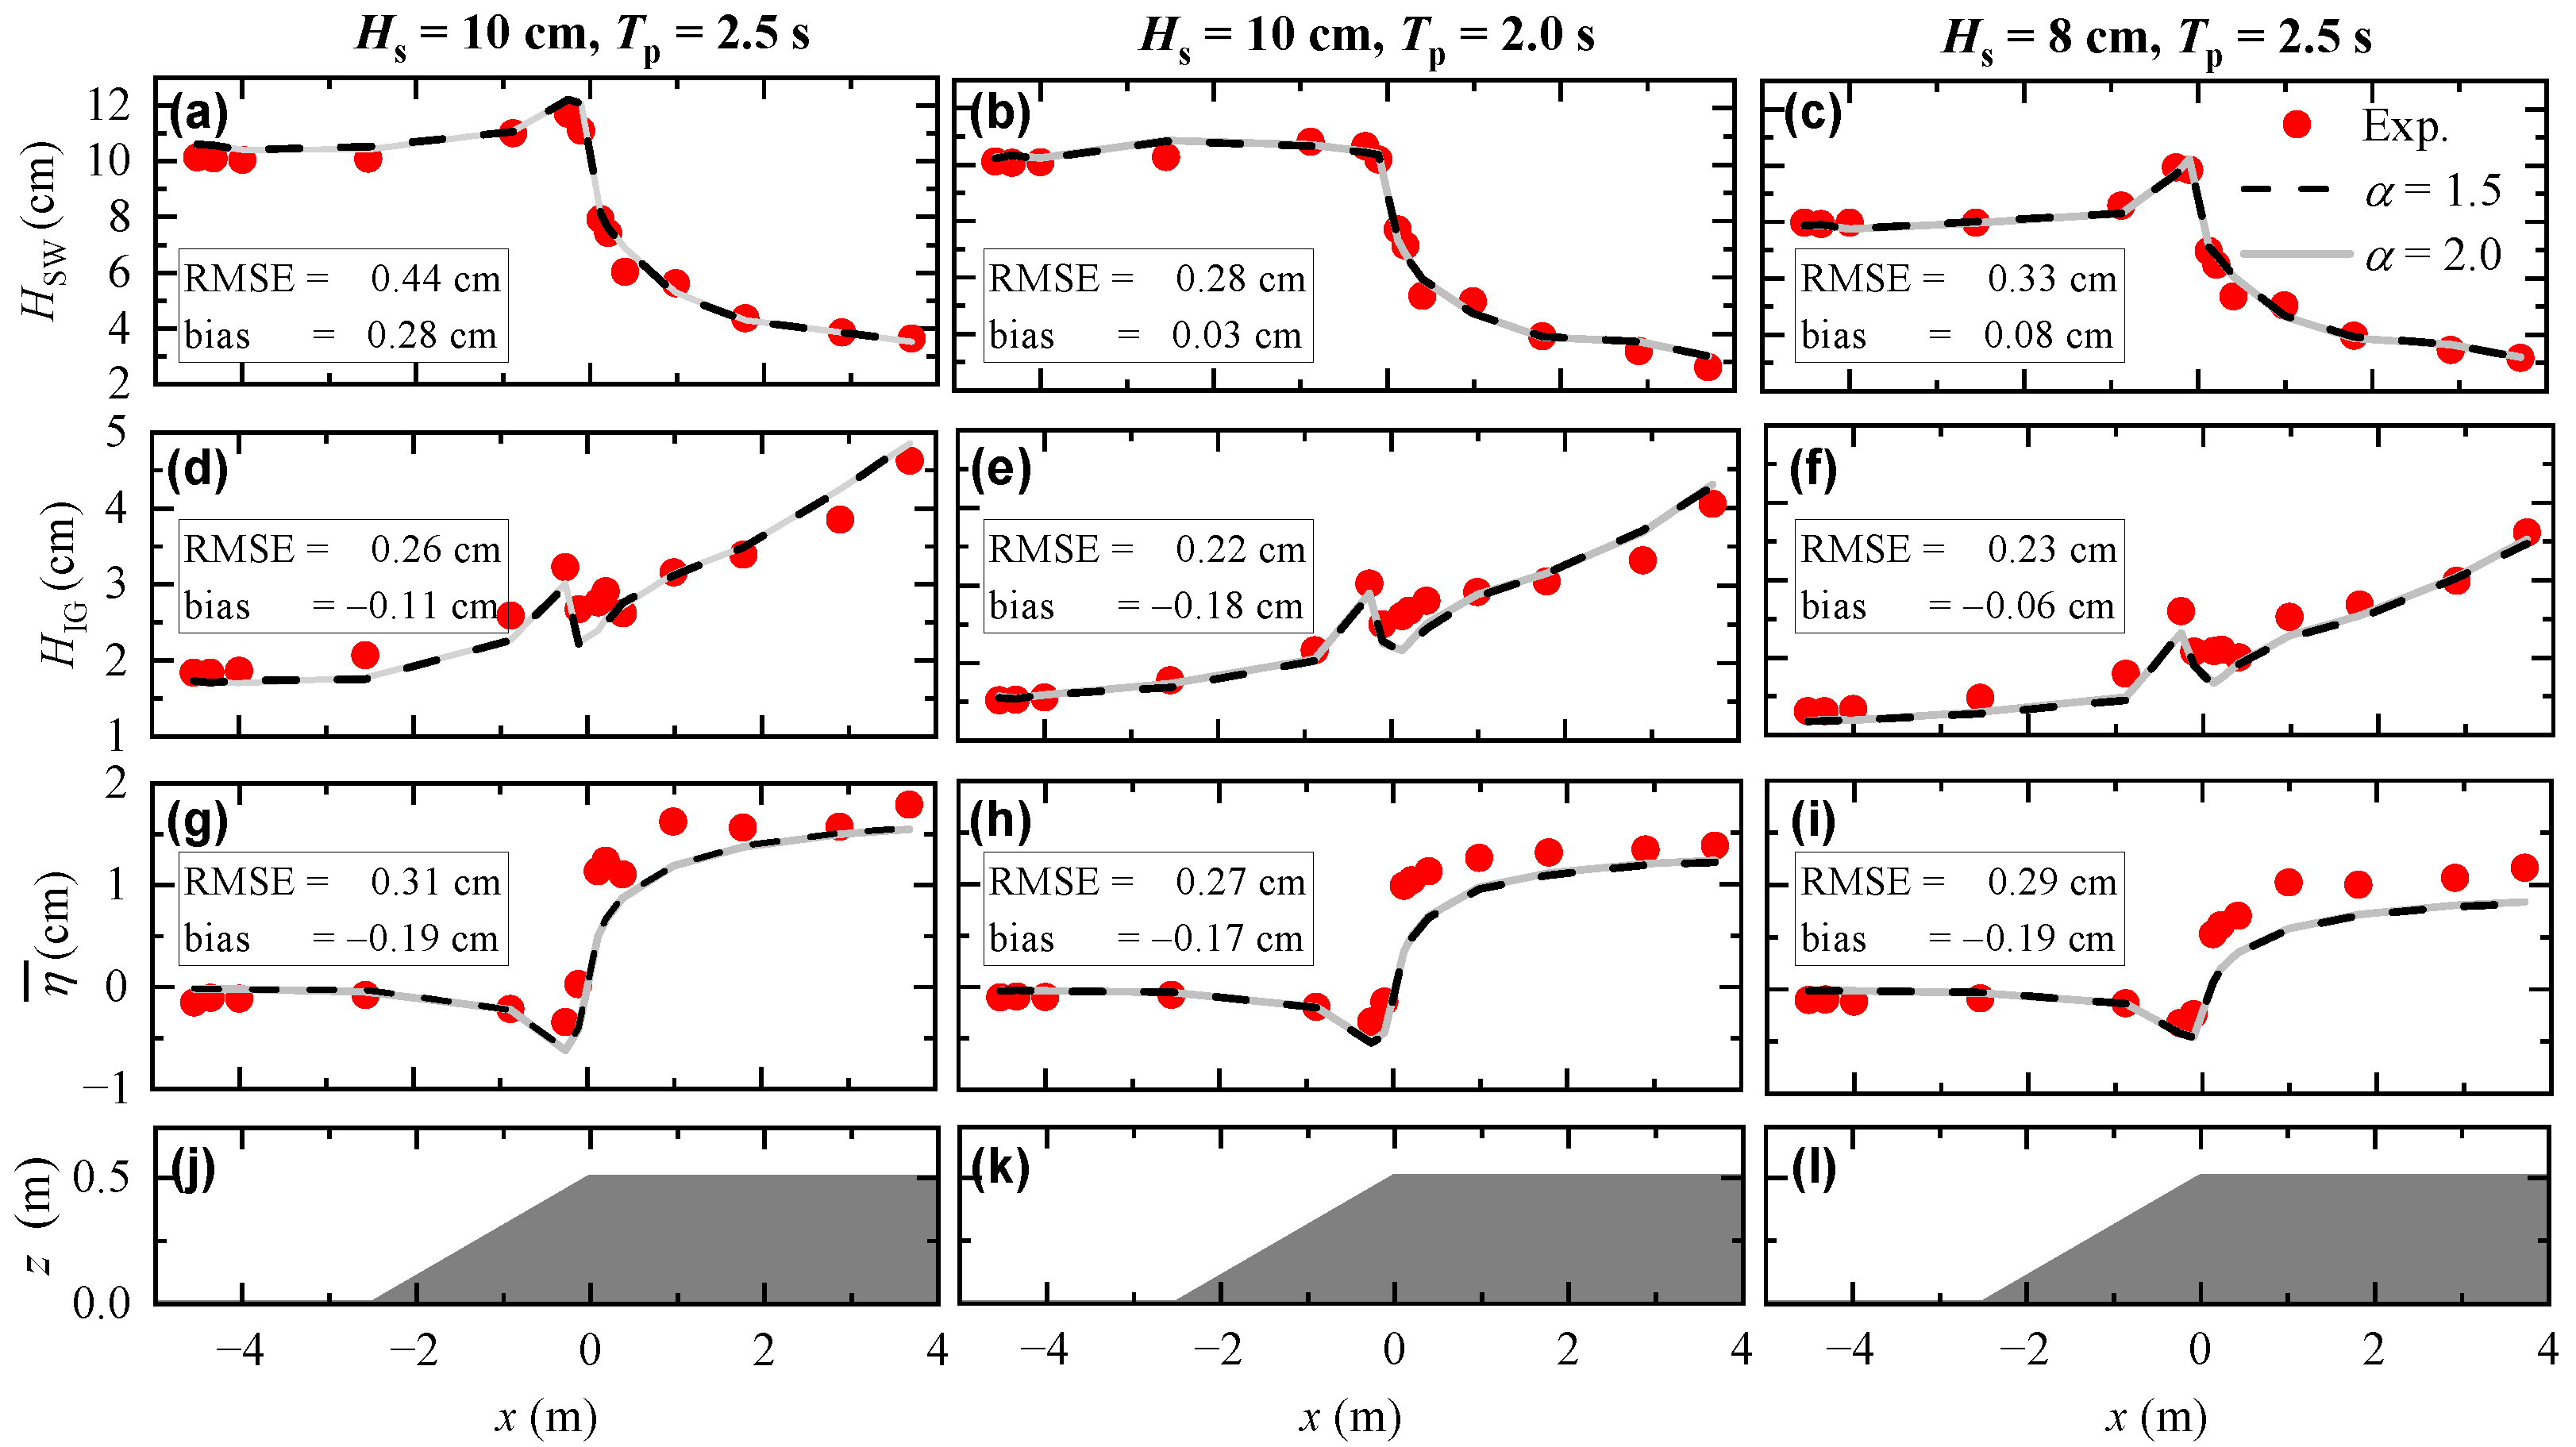
The critical wave breaking slope parameter (Equation (5)) was calibrated by comparing simulated and experimental results for short- and long-wave heights (, ), wave setup (), and overtopping rate (q) (see Figure 2 and Figure 3). Wave height and setup exhibited minimal sensitivity to , consistent with findings by Lashley et al. [32] with a steep forereef, likely due to rapid wave breaking induced by abrupt changes in bottom slope at the reef edge. In contrast, the overtopping rate q showed moderate sensitivity to . Specifically, led to underestimation of q, whereas yielded close agreement with experimental measurements. This sensitivity is likely be attributed to enhanced vertical particle acceleration effects at the seawall, which are more accurately represented with higher values. Accordingly, was adopted for all subsequent simulations. It should be emphasized that, despite the error in reproducing overtopping rates in the present simulation, the inherently sensitive nature of overtopping induces that deviations within an order of magnitude remain acceptable, even when employing more advanced and computational RANS models [29,33].
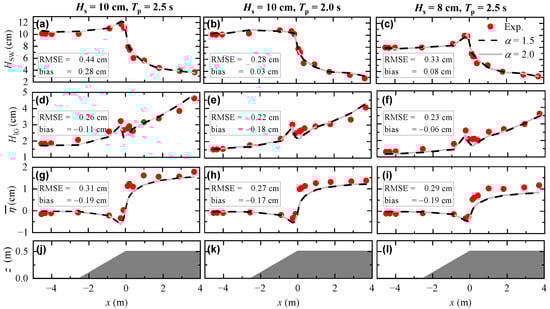
Figure 2.
Comparison of wave heights and setup from numerical simulations with various values and experimental data. (a–c) short-wave height (), (d–f) long-wave height (), (g–i) wave setup (), and (j–l) reef model. Root mean square error (RMSE) and bias are shown in each panel.
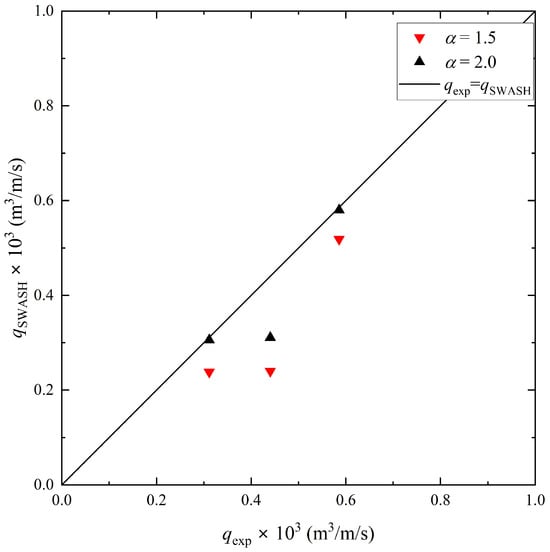
Figure 3.
Comparison of wave overtopping rate from numerical simulations with various values and experimental data.
2.5. Design of Numerical Experiment
Previous studies have highlighted the critical role of the number of frequency bins (M) in achieving statistical stability for wave runup and overtopping simulations [18,24]. While Liu et al. [18] recommended relatively low values for runup, Williams et al. [24] found that accurate overtopping predictions may require M on the order of . Such high spectral resolutions are computationally demanding and impractical for physical modeling, especially when second-order corrections are applied [25]. Therefore, this study aims to establish the minimum M necessary for reliable overtopping simulations by varying the number of bins. Additionally, the effect of spectral bandwidth is also assessed by adjusting the JONSWAP spectrum peak enhancement factor (). Surface roughness variation in the reef flat is not considered, as seawall design typically adopts the conservative assumption of a smooth reef flat.
The numerical experiments were designed to consider a storm wave condition with high wave steepness and a swell wave condition with a long wave period, as shown in Table 1. The reef topography was the same as in the physical model experiment, with a reef flat length of 4 m and a water depth of 4.5 cm. The wave conditions were generated using a JONSWAP spectrum with a peak enhancement factor ranging from 1 to 7. The number of frequency bins M varied from 50 to 900, with each test repeated 100 times by changing the initial random phases for each bin to ensure statistical reliability.

Table 1.
Parameters of the numerical experiment.
3. Results and Discussion
3.1. Cross-Reef Variation in Wave Height and Spectrum
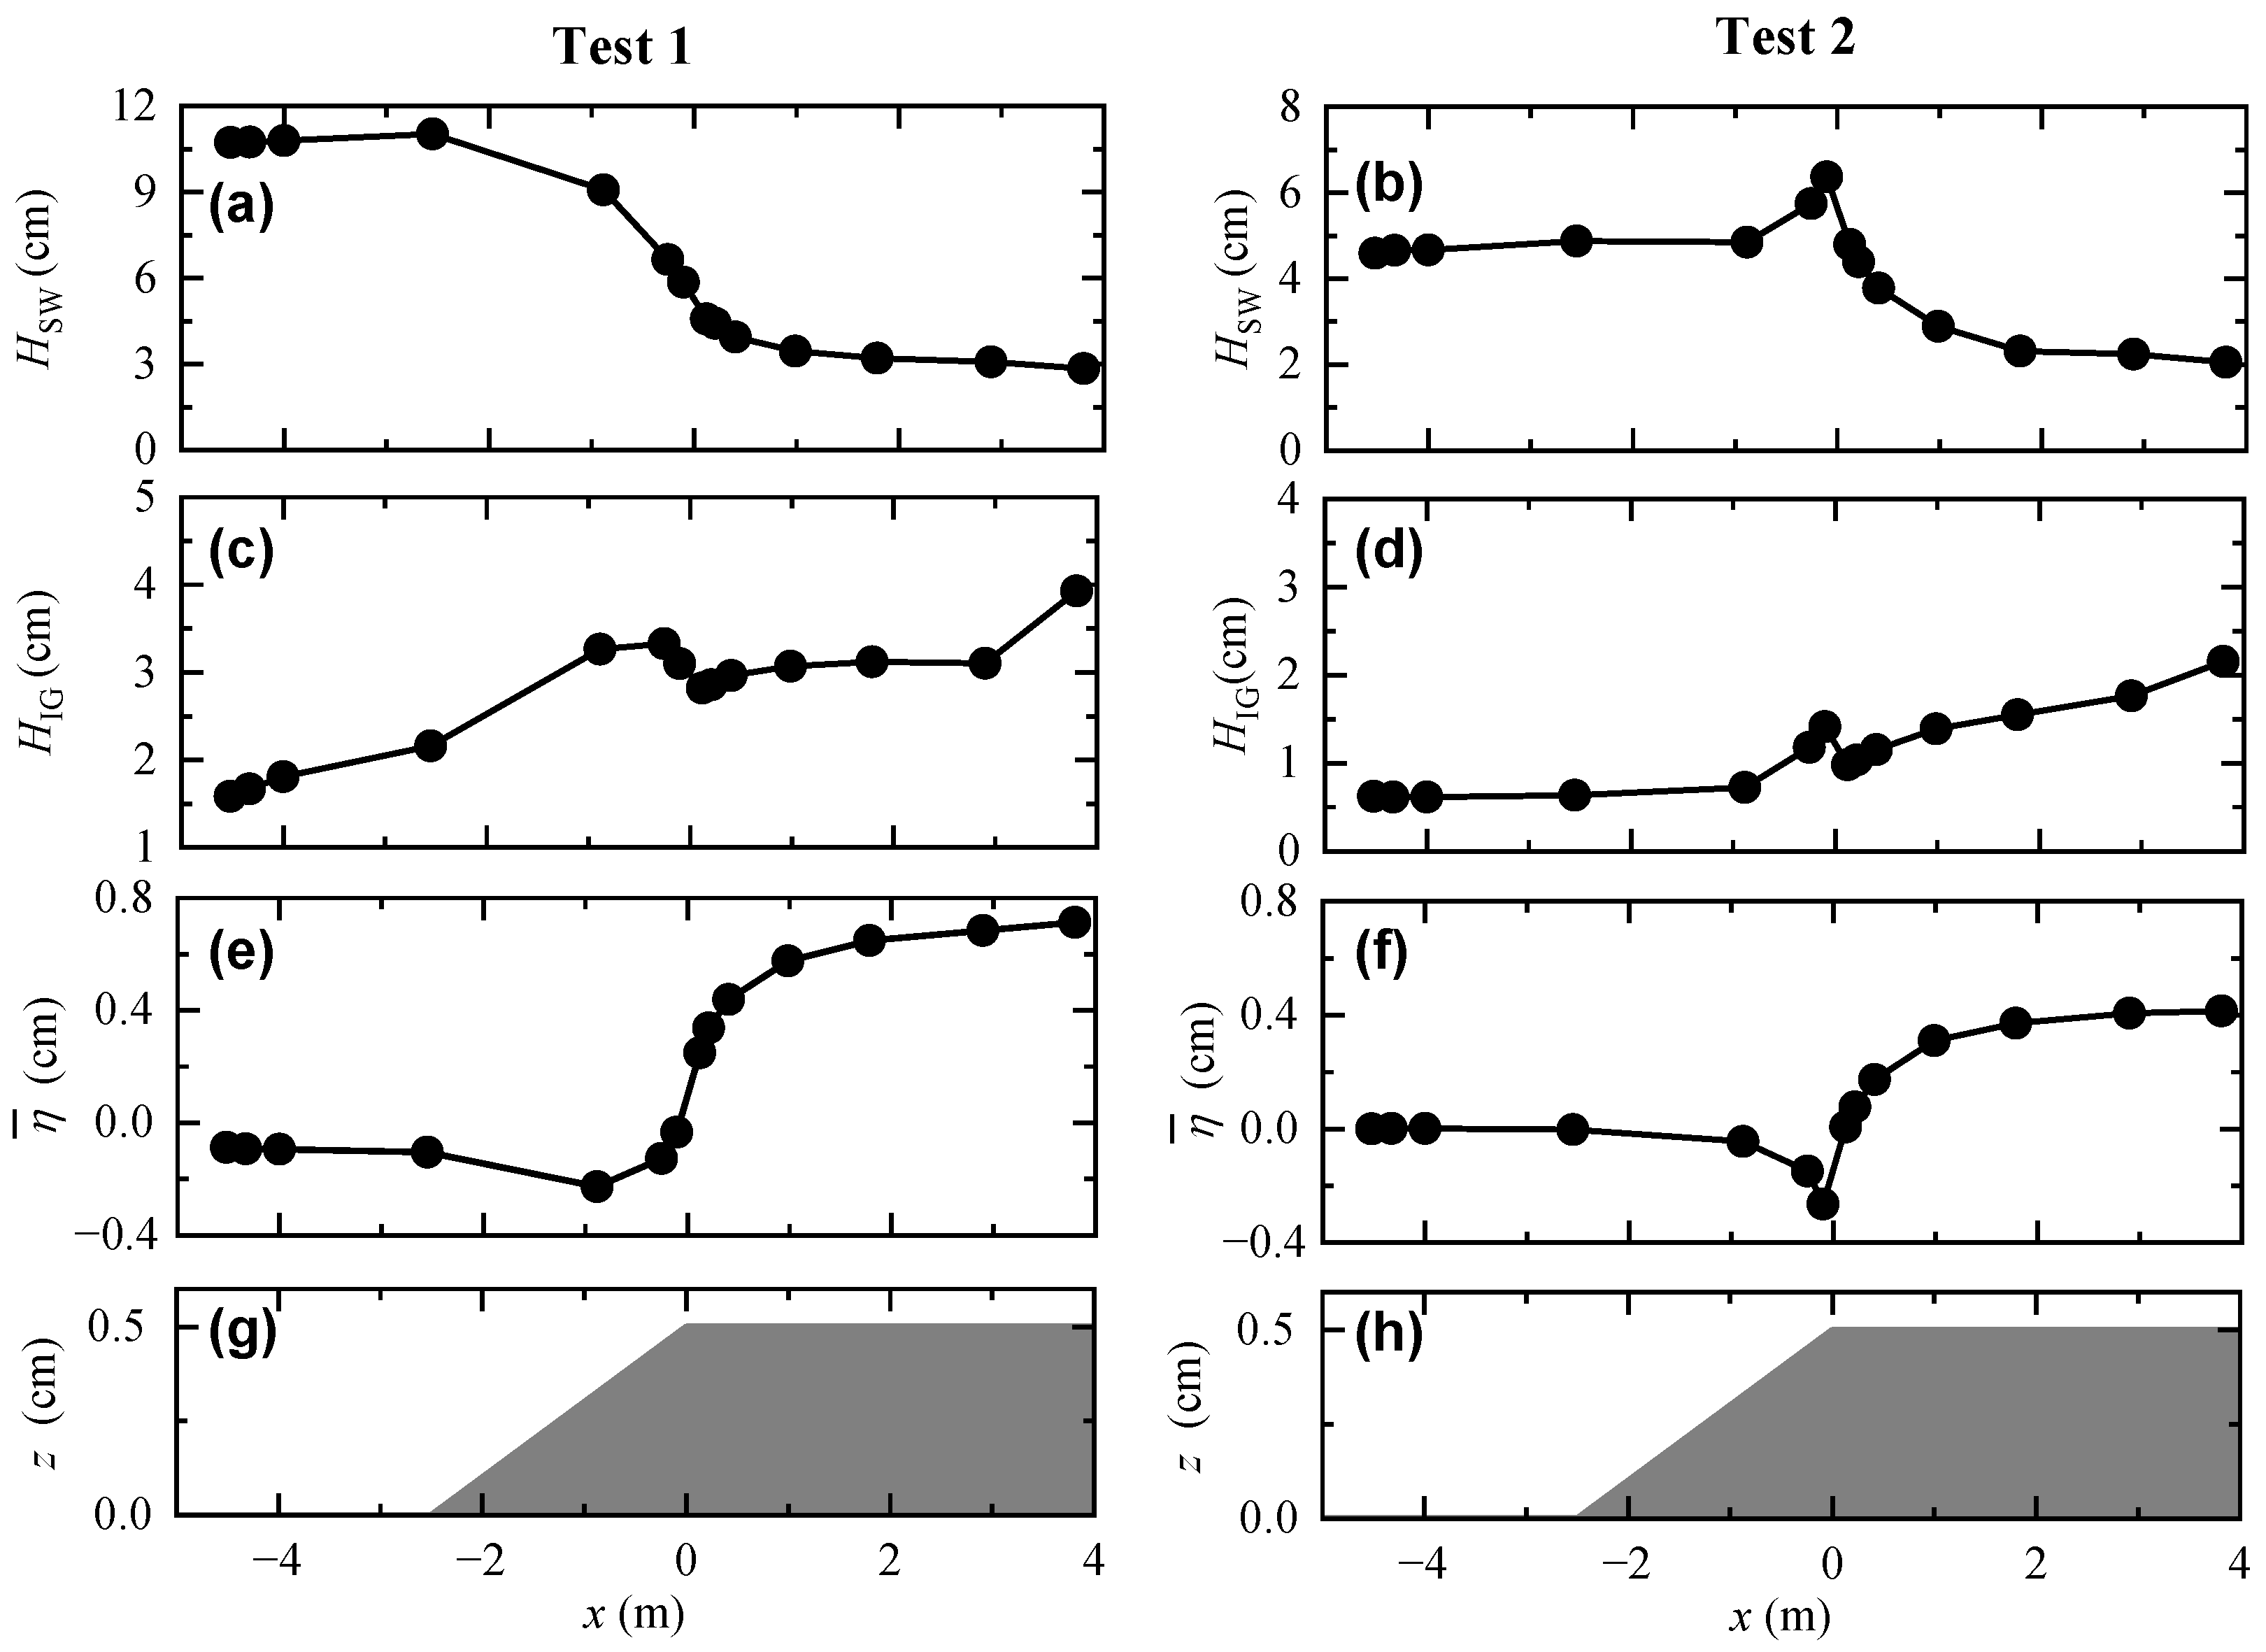
Figure 4 presents the cross-reef variation in wave heights and setup for both storm (Test 1) and swell (Test 2) conditions. The numerical results confirm substantial wave transformation over the forereef, in agreement with experimental observations. Notably, the storm case (Test 1) exhibits wave breaking in the off-reef region due to higher wave steepness, whereas in the swell case (Test 2), the breakpoint shifts shoreward onto the reef flat. After breaking, short-wave heights decrease sharply and then remain relatively constant across the reef flat in both scenarios. Despite identical still water depths, storm conditions produce markedly higher wave setup and greater post-breaking short and infragravity wave heights compared to swell conditions.

Figure 4.
Variation in (a,b) short-wave height, (c,d) infragravity-wave height, and (e,f) wave setup over the reef, where the reef topography is shown in (g,h).
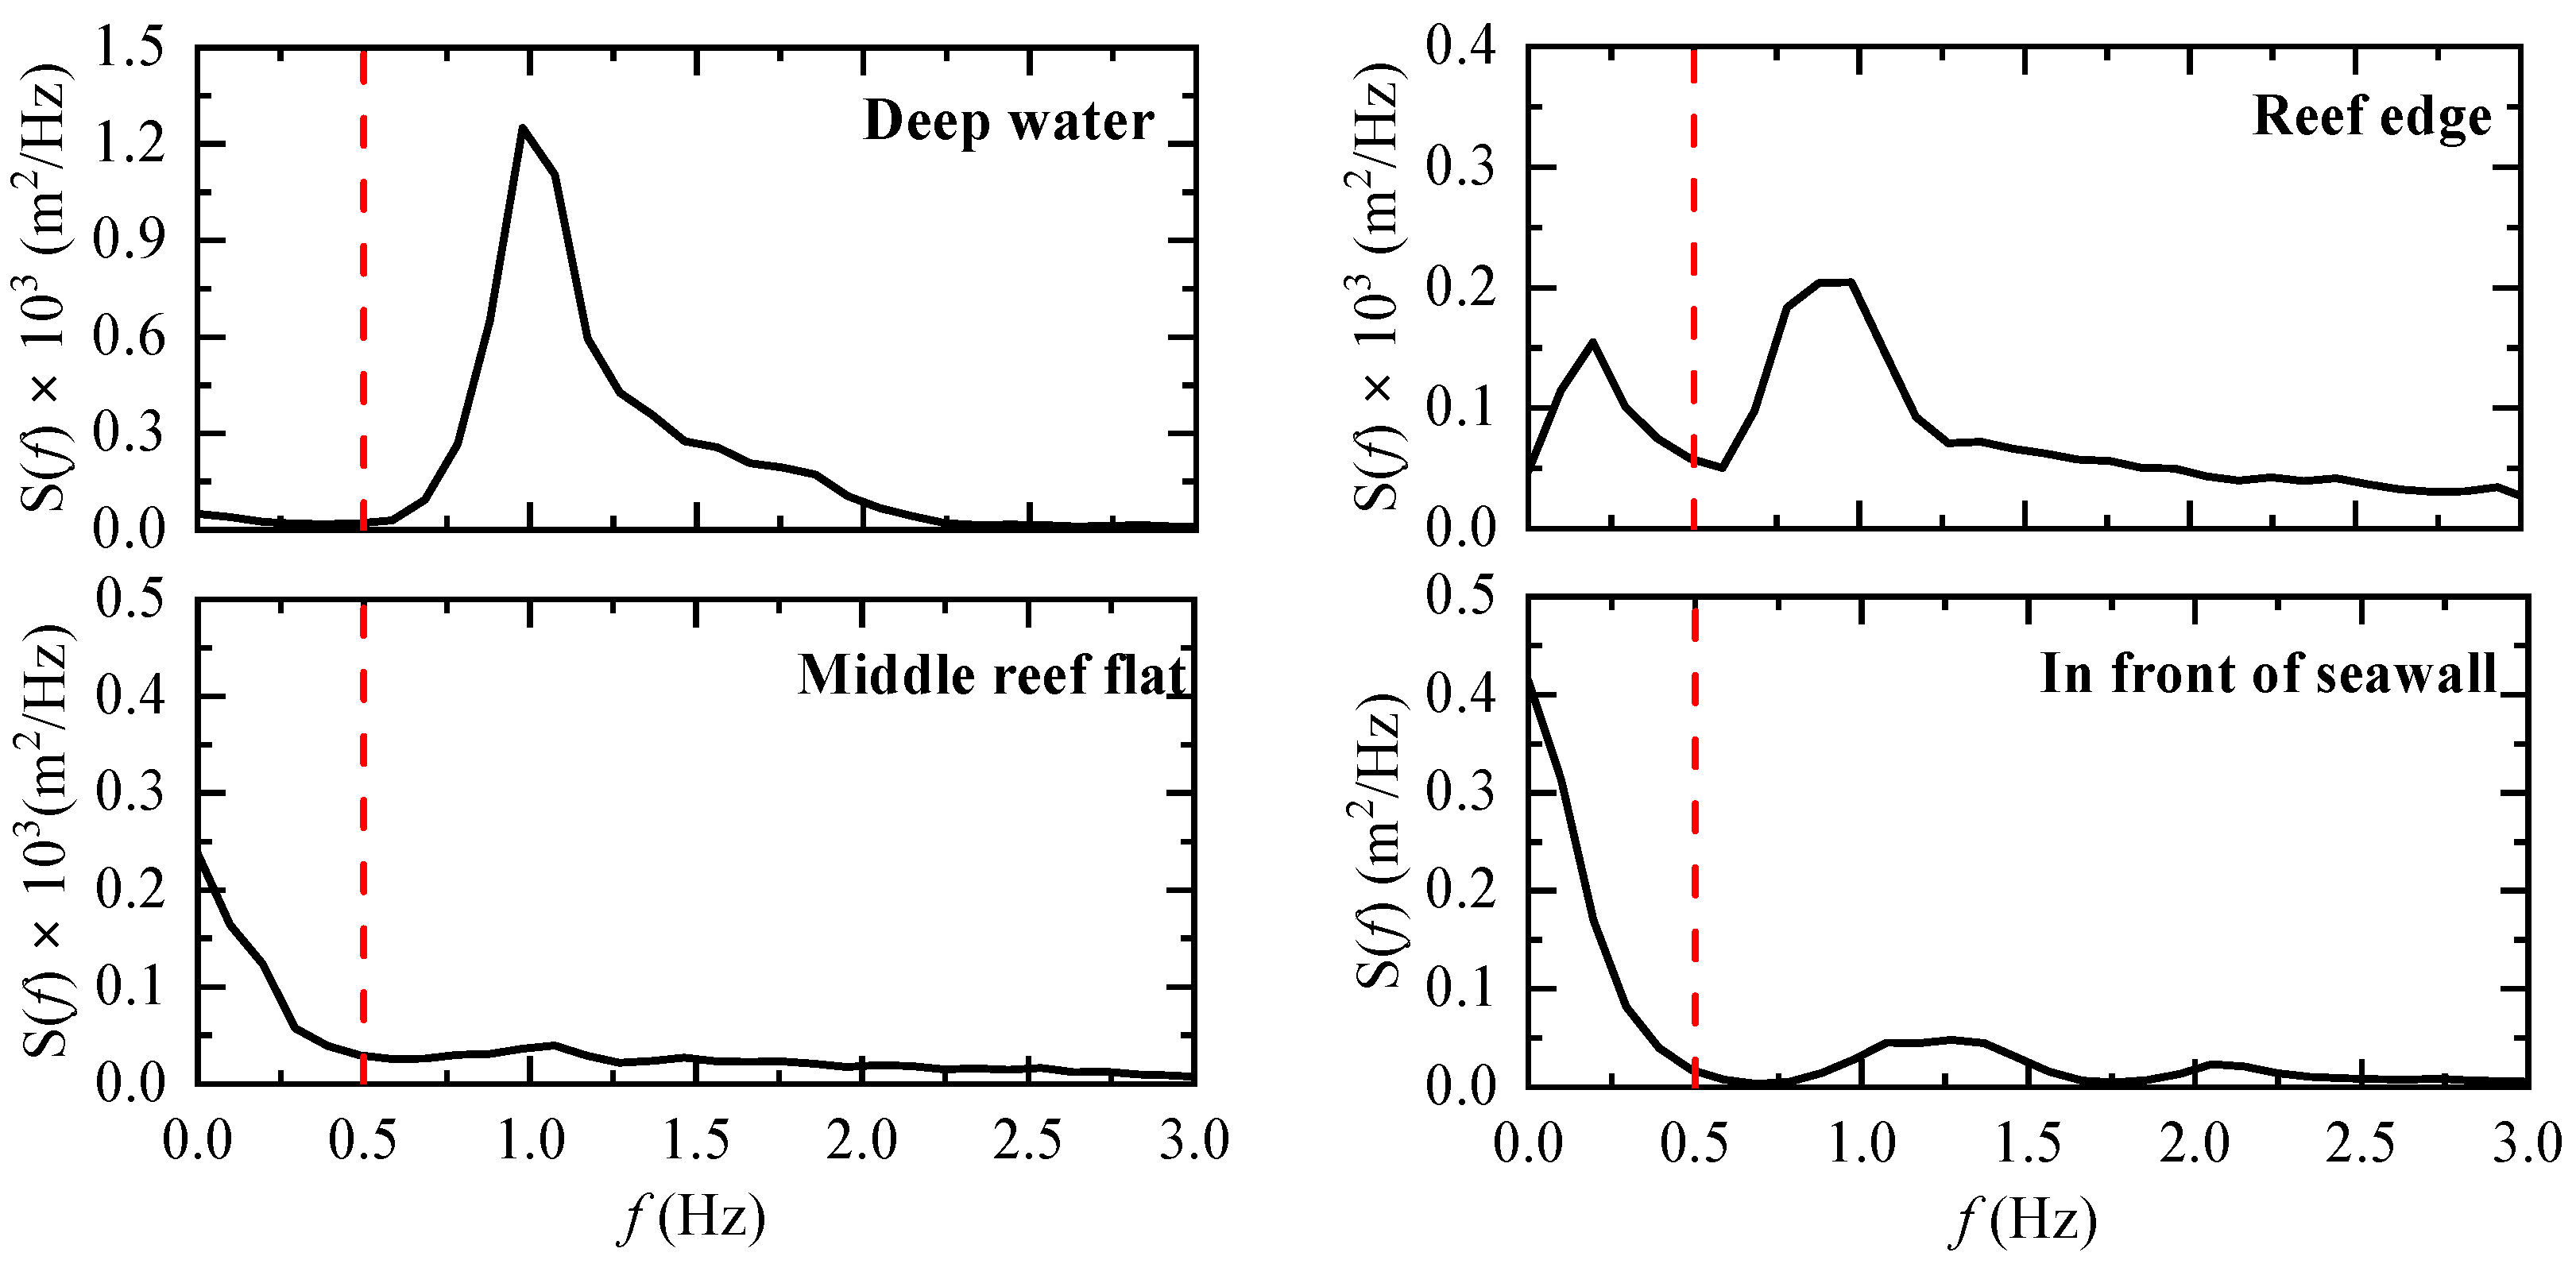
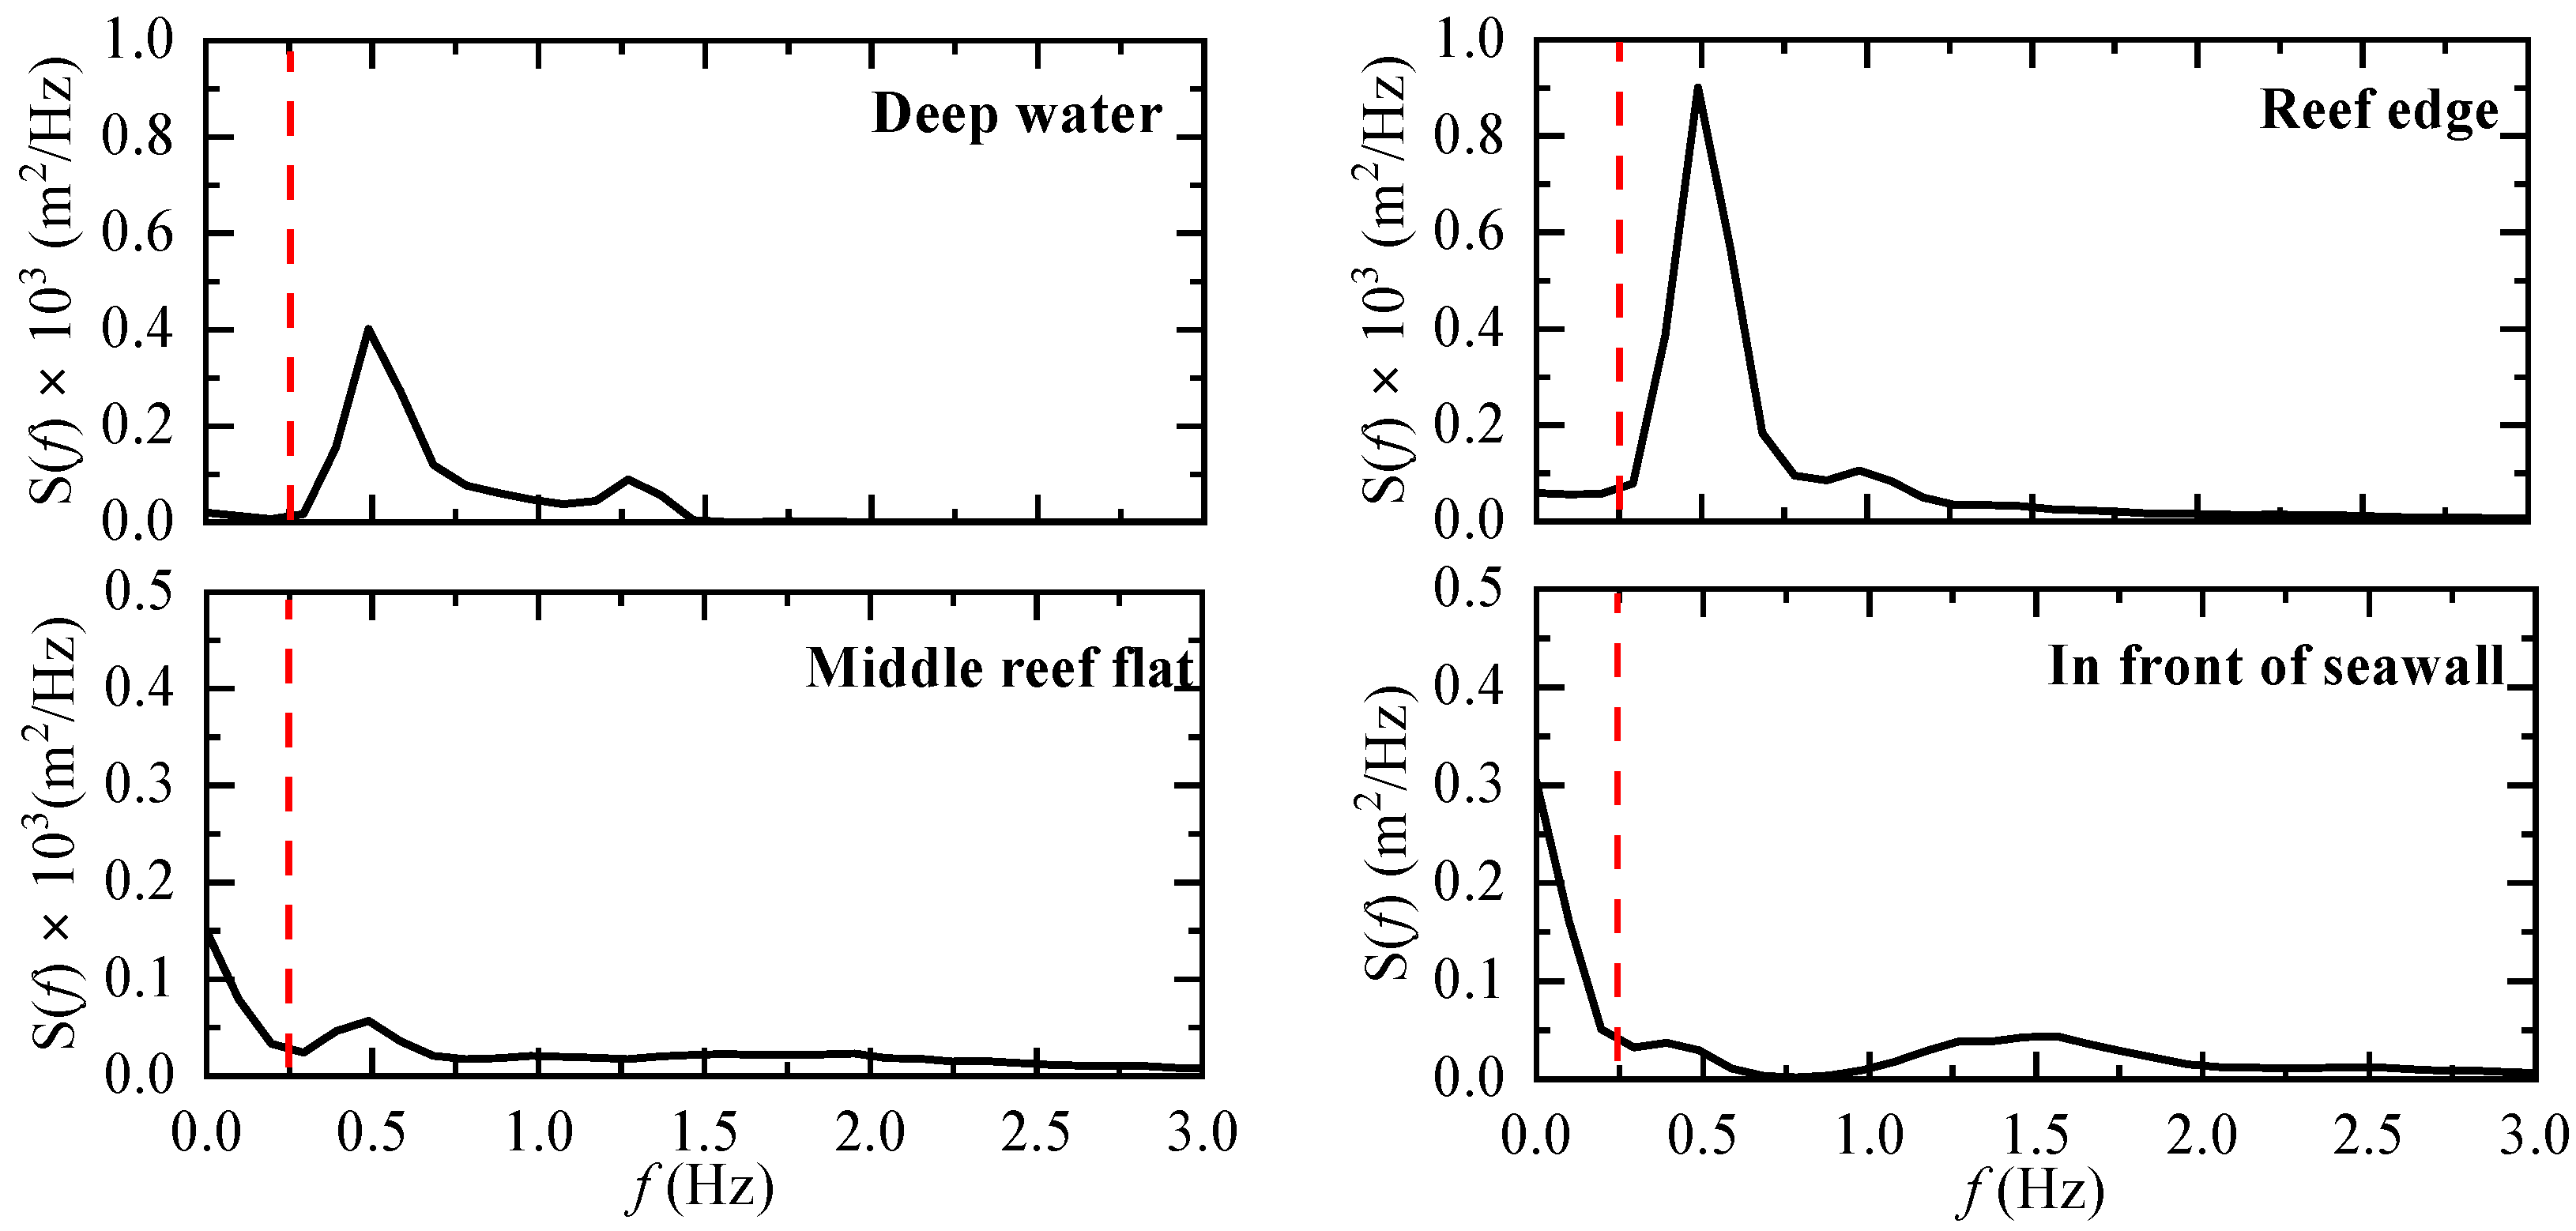
Figure 5 and Figure 6 depict the progression of the wave energy spectrum evolution across the reef profile under both storm and swell conditions, with vertical dashed lines marking the critical frequency that distinguishes short-wave from infragravity wave components. Off the reef, wave energy is concentrated at the peak frequencies of the short-wave spectrum. As waves move shoreward, there is a redistribution of energy across frequencies. Notably, there is an enhancement of energy within the infragravity and far-infragravity bands. This low-frequency energy originates primarily from nonlinear energy transfer during the process of short-wave breaking (i.e., the breakpoint forcing mechanism) and is further intensified by reef-flat resonance, where resonance amplitudes incrementally increase from the reef edge to the seawall. This spectral evolution pattern demonstrates that the wave field proximate to the seawall becomes predominantly comprised of infragravity waves, which are anticipated to contribute substantially to overtopping rates.
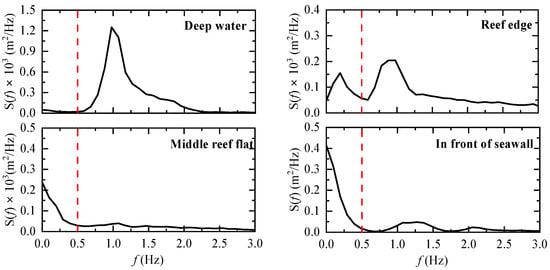
Figure 5.
Variation in wave spectrum across the reef for Test 1, where the vertical dashed lines indicate the critical frequency that separates short-wave and infragravity-wave components.
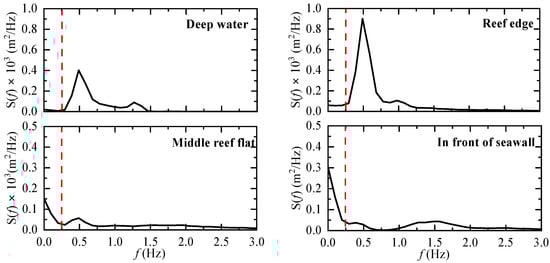
Figure 6.
Variation in wave spectrum across the reef for Test 2, where the vertical dashed lines indicate the critical frequency that separates short-wave and infragravity-wave components.
3.2. Effect of Number of Frequency Bins
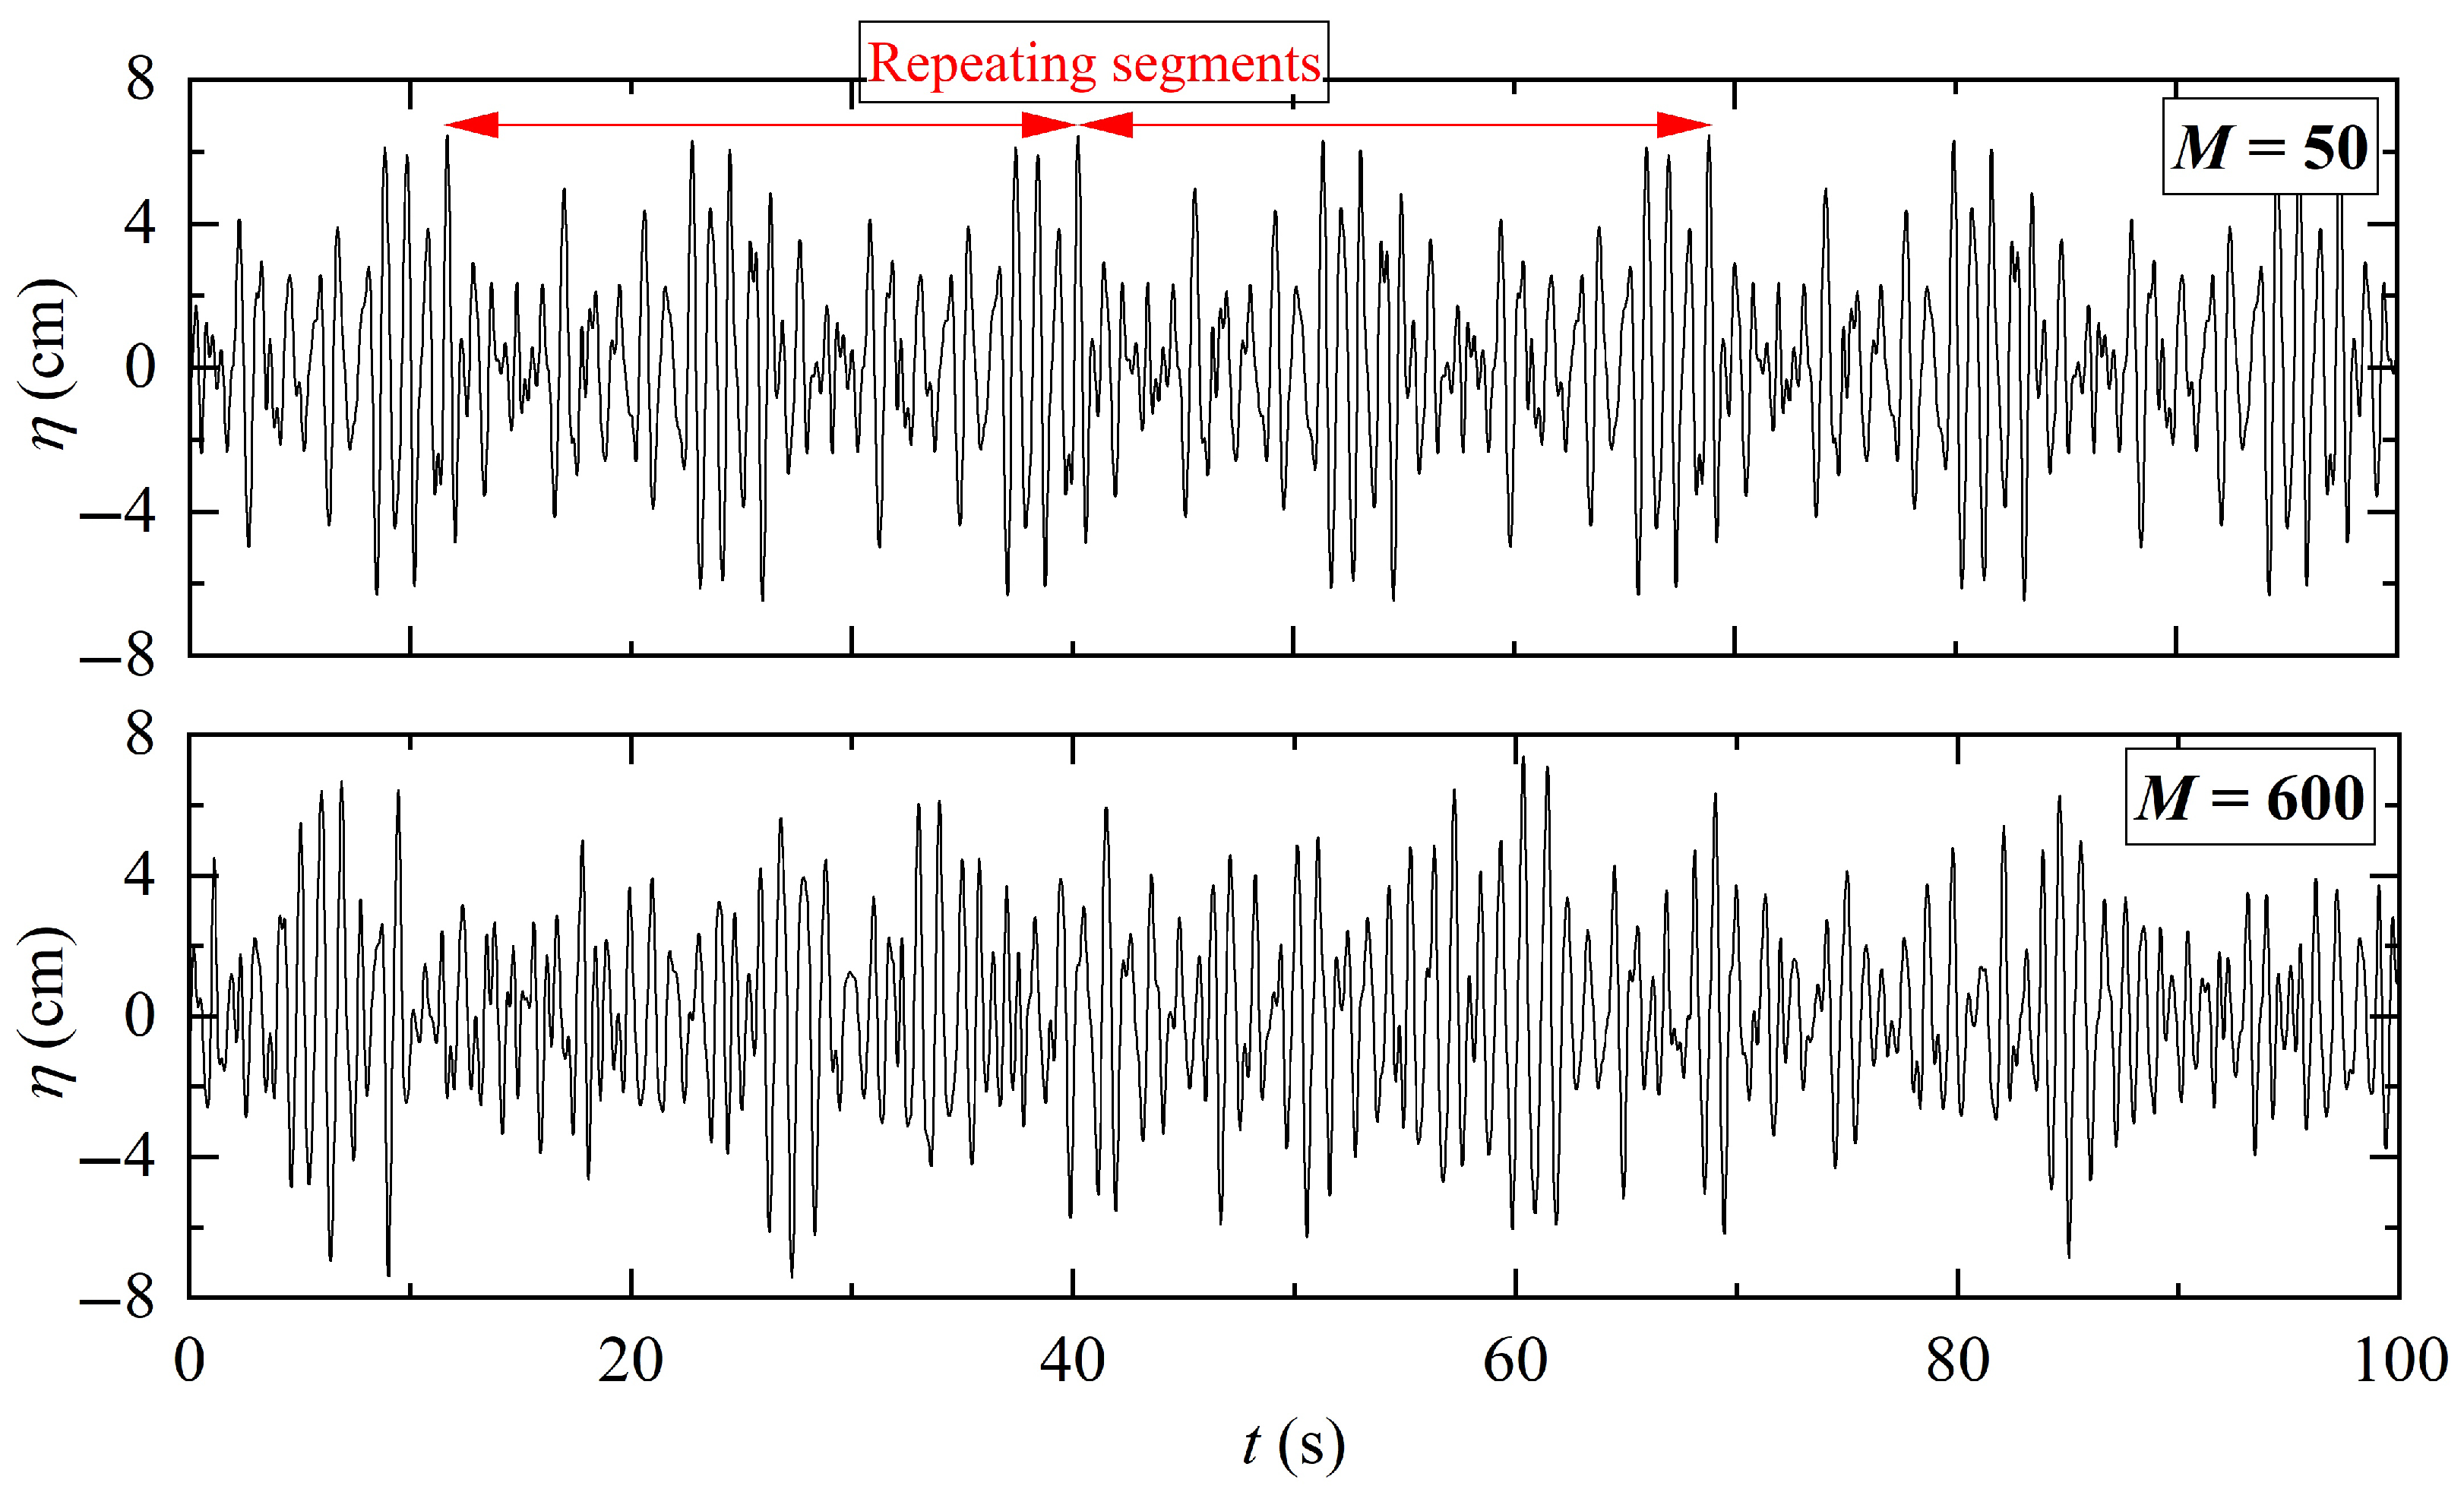
When generating waves through physical or numerical wavemakers, standard practice involves discretizing the continuous frequency spectrum into discrete frequency bins. Each bin represents an individual wave component, and their superposition produces the irregular wave train. However, a conflict arises between key requirements in the Chinese port engineering code, The Technical Code of Modeling Test for Port and Waterway Engineering (JTS/T 231-2021 [34]), issued by China’s Ministry of Transport, which requires the duration of the test ≥ 1000 waves for overtopping tests and a spectral resolution of 50 to 100 frequency bins for wave generation. However, this bin range is likely insufficient to generate 1000 non-repetitive waves. As demonstrated in Figure 7, using 50 frequency bins causes the wave time series to repeat approximately every ten waves. Consequently, a 1000-wave sequence contains numerous identical segments, invalidating the intended duration requirement. While wavemaker re-reflection introduces spurious effects on surface elevation, this constitutes a separate error source. As seen in Figure 7, increasing the number of bins to 600 significantly extends the repetition period. Therefore, this study will establish the minimum frequency bin count required to generate truly non-repetitive irregular wave sequences meeting the 1000-wave criterion for modeling overtopping.
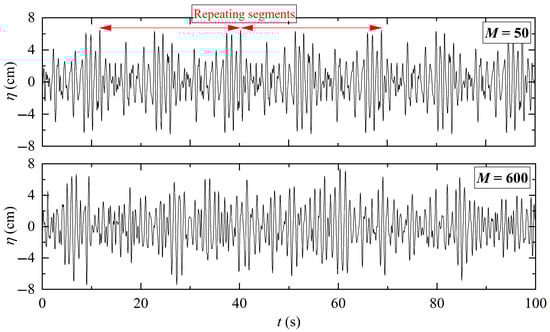
Figure 7.
Time series of water surface elevations of wave trains with different numbers of frequency bins.
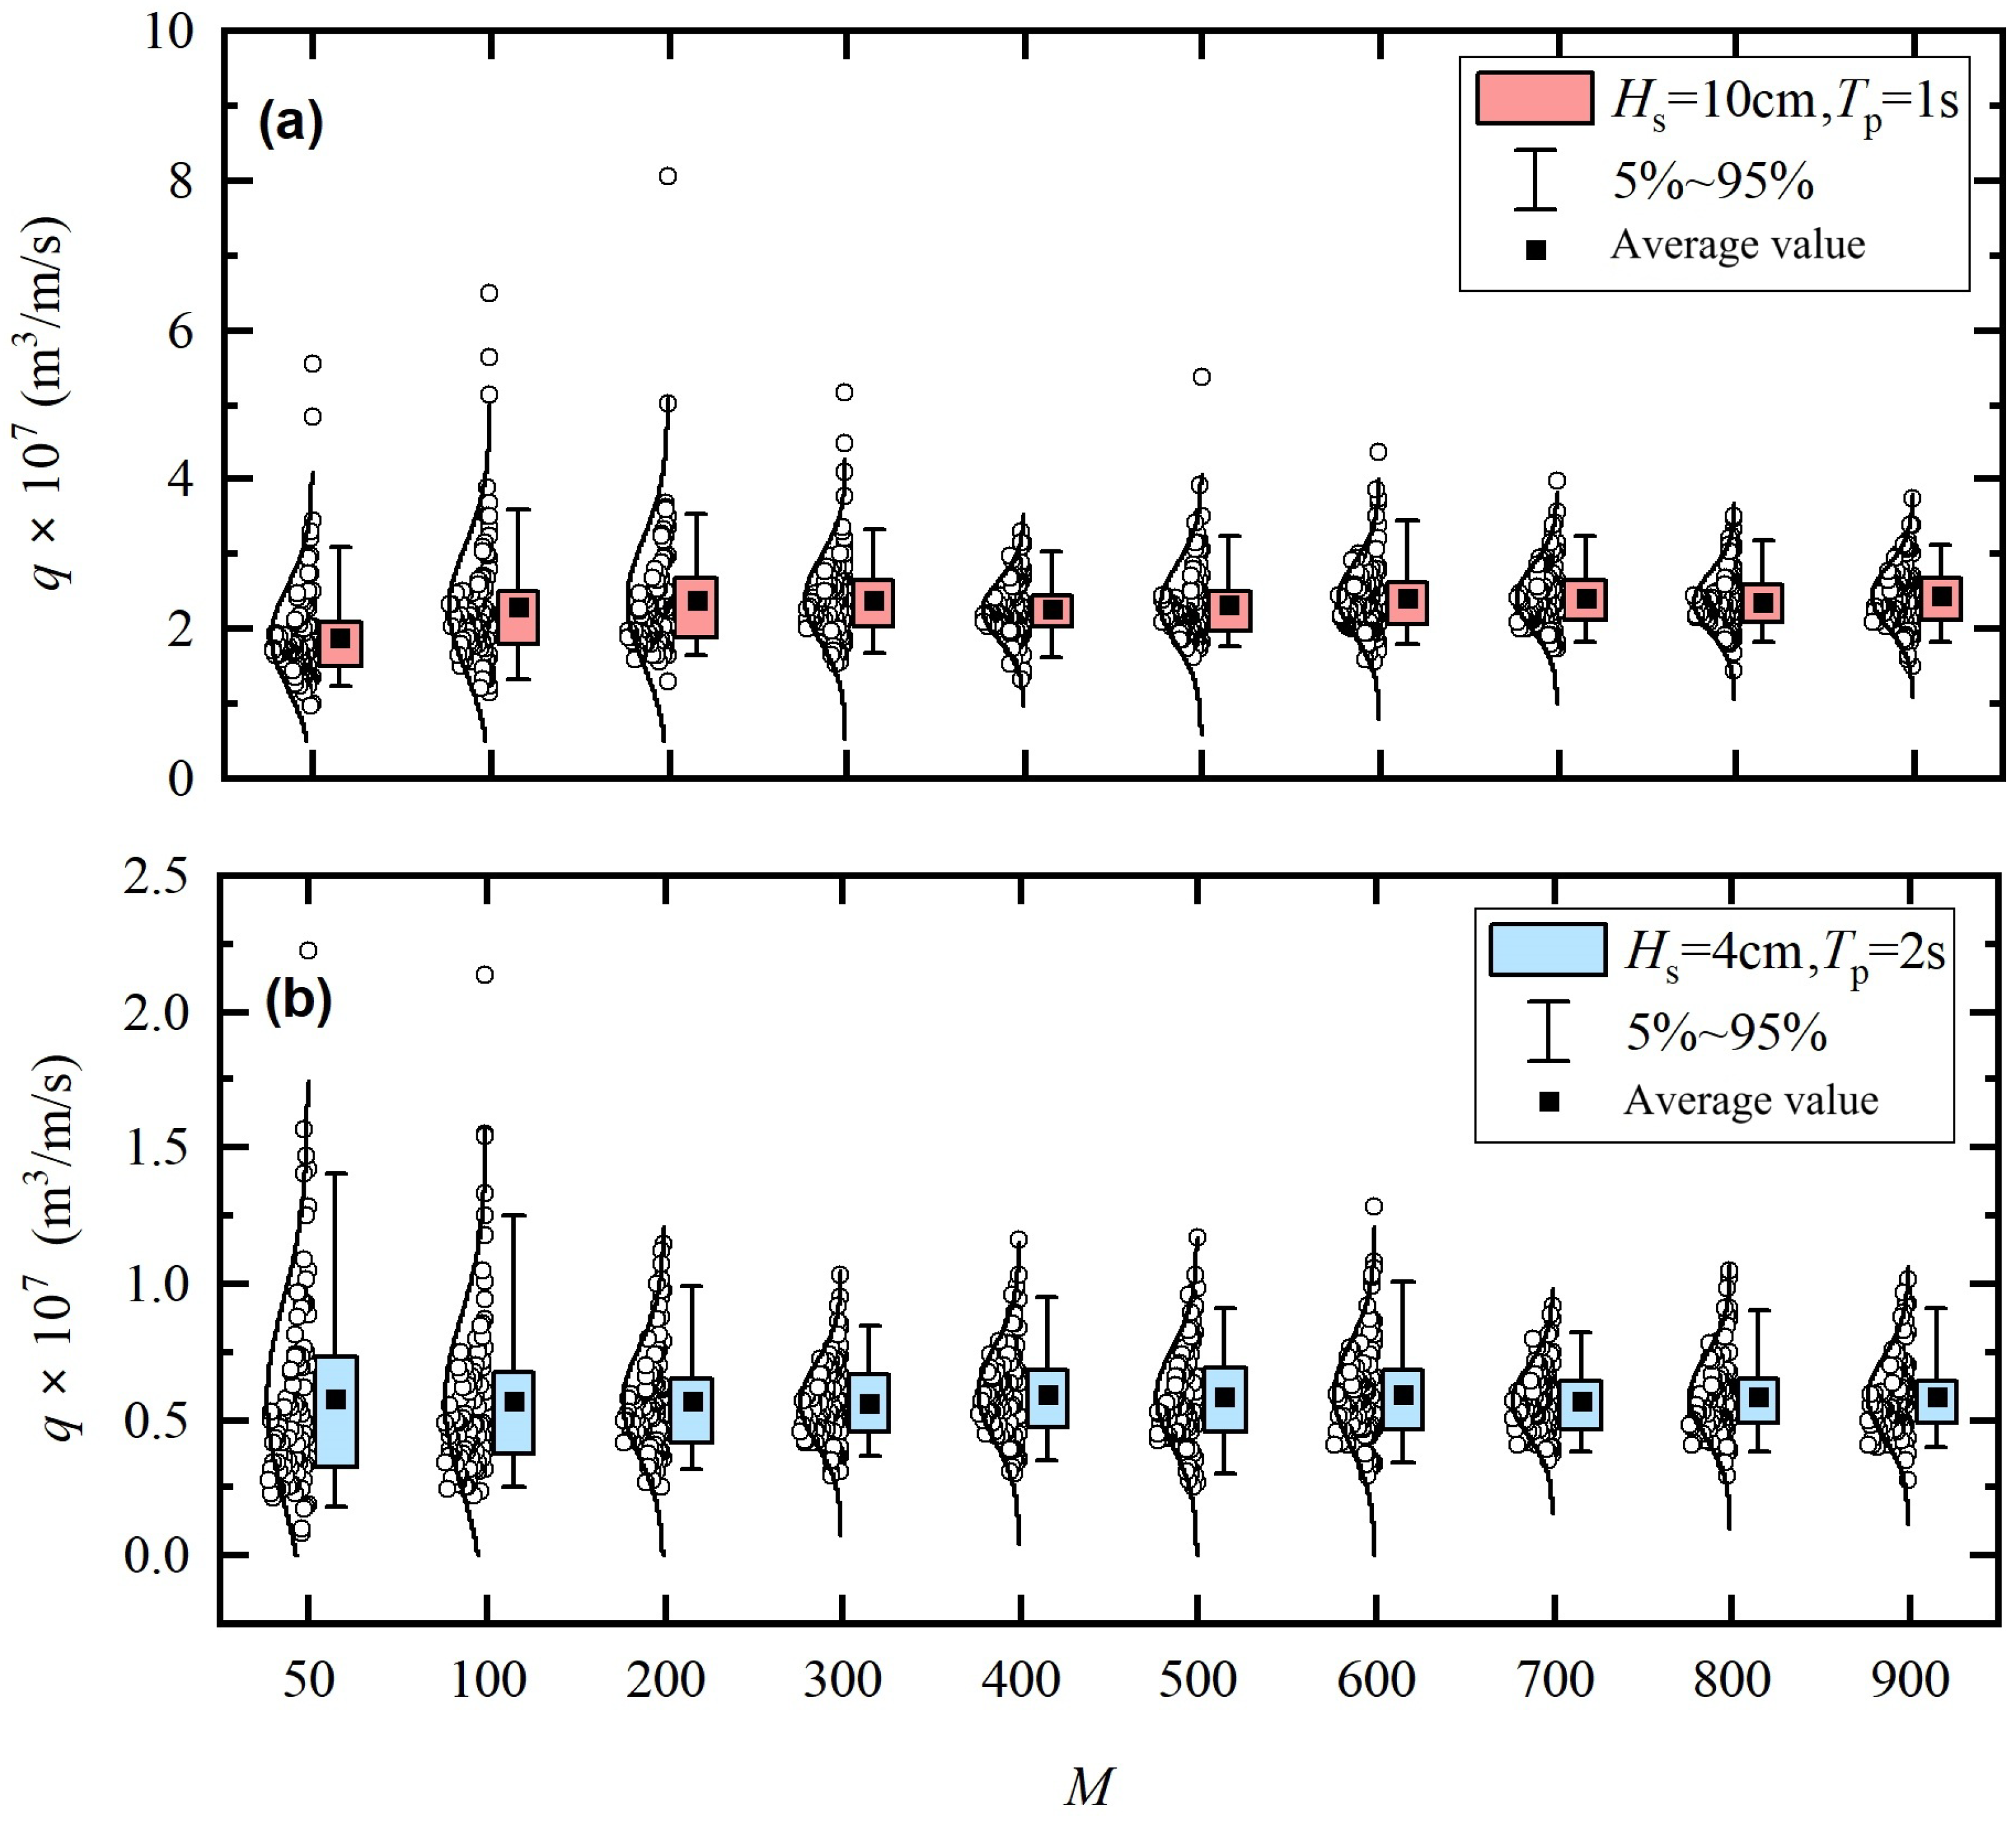
Figure 8 presents the statistical distribution of overtopping rates (q) for varying numbers of frequency bins (M), based on 100 phase-randomized simulations per M. Individual simulation results are shown as circles, with the mean and fitted normal distribution overlaid for each bin count. The analysis demonstrates that for storm conditions, low spectral resolutions ( and ) consistently underestimate q, corroborating the findings of Liu et al. [18] for wave runup. Both storm and swell scenarios exhibit broader q distributions and increased outlier frequency at low M, attributable to two factors: (1) insufficient bins lead to short wave sequence repetition periods, artificially suppressing overtopping rates; and (2) coarse spectral discretization induces non-physical wave groupiness. As M increases, the distribution of q narrows and aligns more closely with the normal distribution, indicating improved statistical reliability. Convergence is achieved at , where q statistics stabilize, consistent with the minimum threshold of recommended by Liu et al. [18] for wave runup simulations. Furthermore, Kolmogorov–Smirnov (K-S) tests confirm that the overtopping rate q follows a normal distribution at for both storm (Test 1: p-value = 0.29, test statistic = 0.096) and swell (Test 2: p-value = 0.71, test statistic = 0.068) conditions, with the null hypothesis not rejected at the 5% significance level. These results establish that adequate spectral resolution is essential for statistical convergence and reliable overtopping predictions.
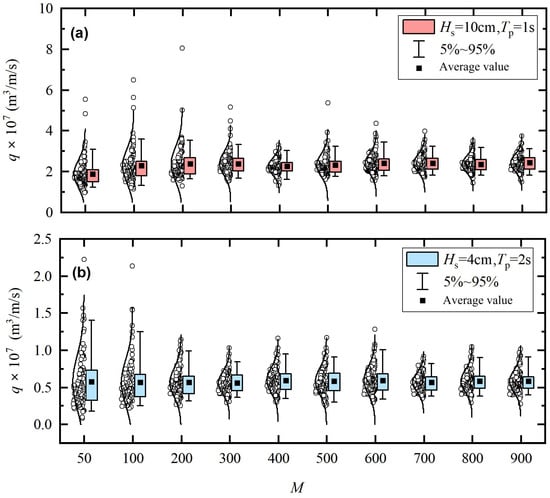
Figure 8.
Statistical distribution of overtopping rates under different numbers of spectral components, where the circles represent the overtopping rate of each simulation, and solid curves indicate fitted normal distribution. (a) Test 1 (storm condition), (b) Test 2 (swell condition).
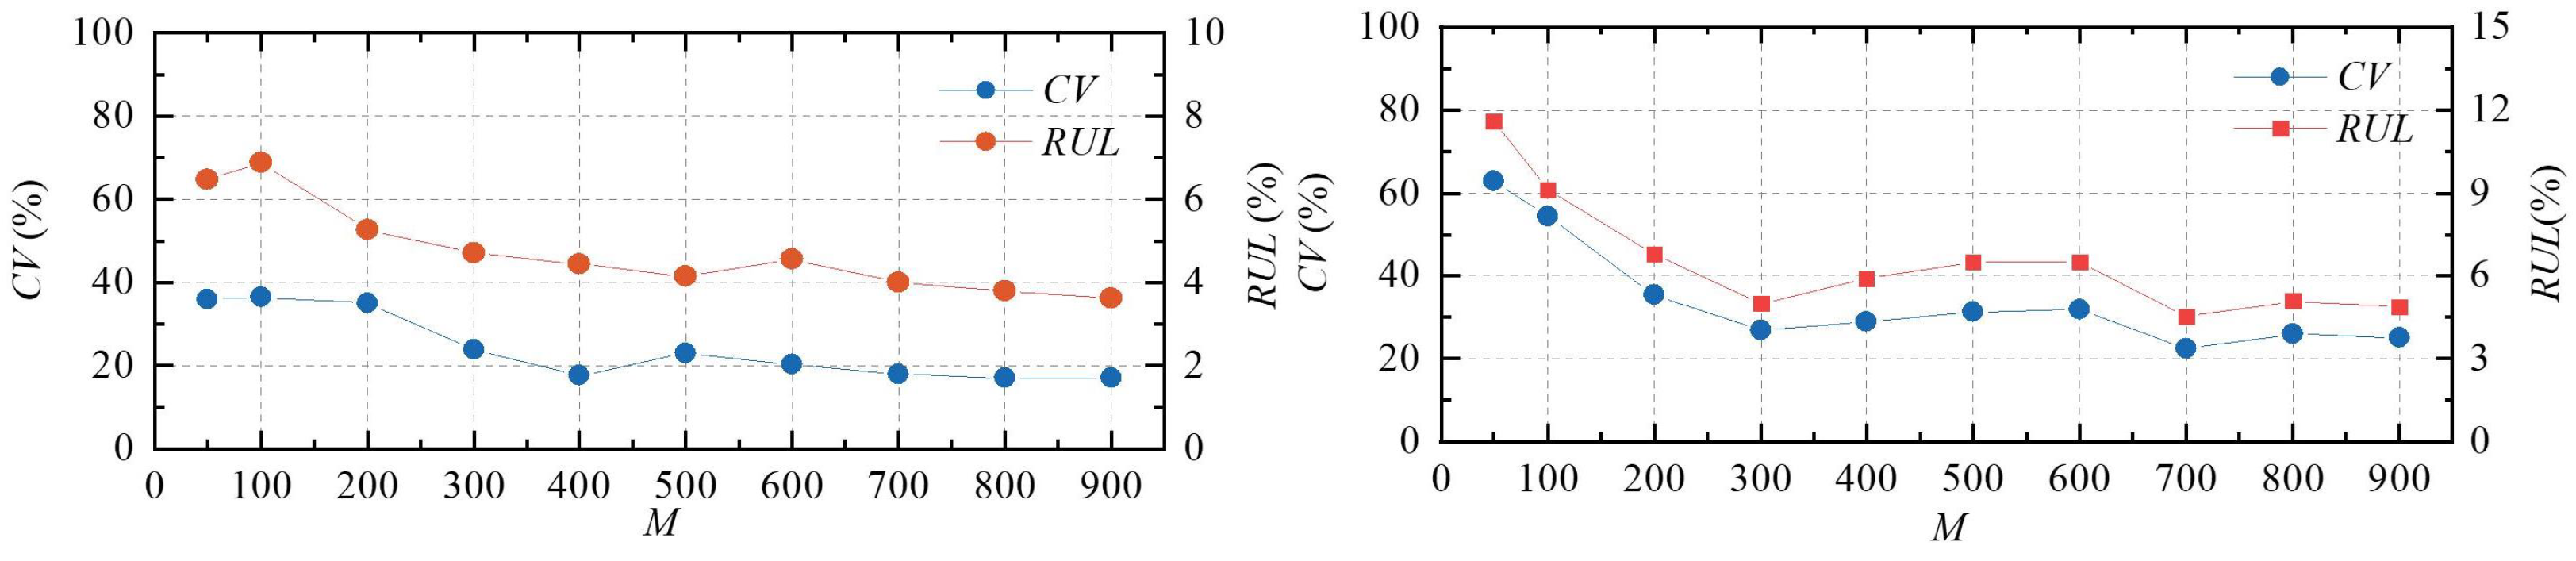
To clarify the impact of spectral resolution (M) on overtopping rate variability (q), we calculated two statistical indicators, i.e., the Coefficient of Variation () and the Range Uncertainty Level (). As shown in Figure 9, both and decrease markedly with increasing M, indicating improved consistency and reduced uncertainty in q as spectral resolution increases. Notably, both metrics stabilize when M exceeds 700, signifying statistical convergence. Therefore, for reliable overtopping experiments on vertical seawalls fronted by coral reefs, we recommend a minimum of 700 frequency bins—substantially higher than the conventional 50–100 bins typically used.
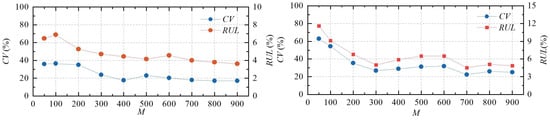
Figure 9.
Variation in and with M.
3.3. Effect of Spectral Width
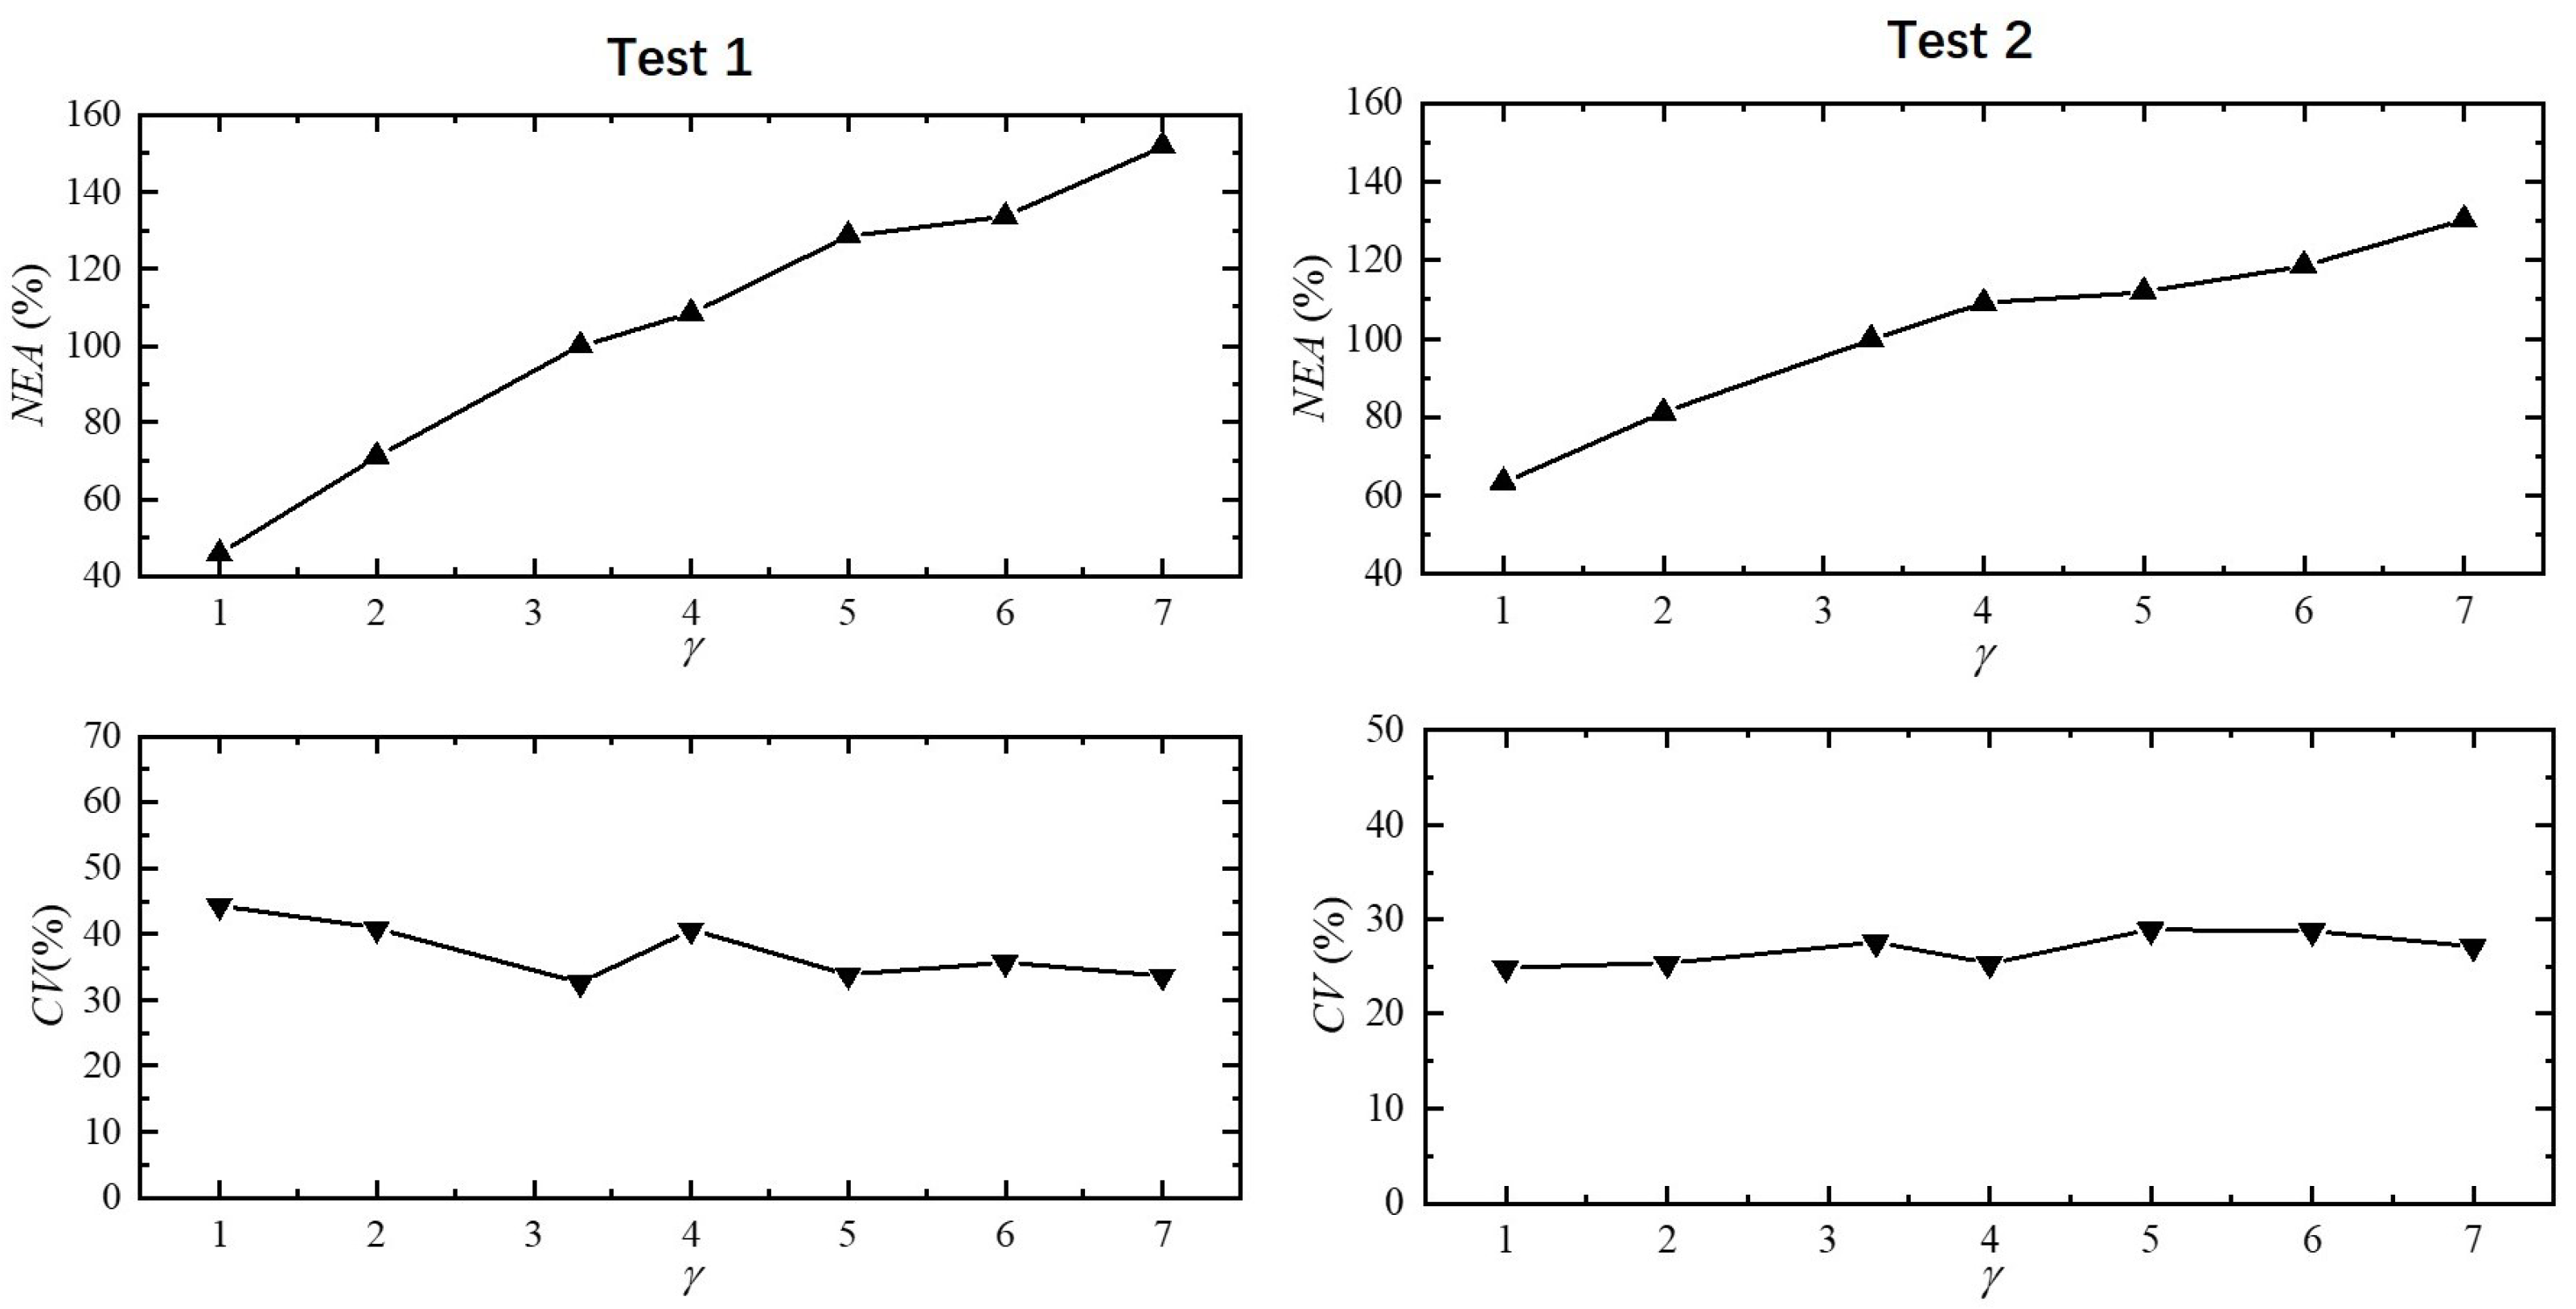
To elucidate the impact of spectral width on overtopping rates, we varied the JONSWAP spectrum peak enhancement factor () from 1 (broad storm spectra) to 7 (narrow swell spectra). As shown in Figure 10, increasing results in a narrower spectral bandwidth and a corresponding rise in the normalized ensemble average () of overtopping rate q. This trend demonstrates that spectra with higher peak enhancement, and thus reduced width, are more conducive to extreme overtopping events. Notably, this finding highlights that spectral bandwidth, rather than peak period alone, plays a decisive role in modulating overtopping magnitude by redistributing wave energy across frequencies. In contrast, the coefficient of variation () remains largely invariant with respect to , indicating that the statistical reliability of overtopping predictions is maintained across different unimodal JONSWAP spectra when an adequate number of frequency bins is employed.
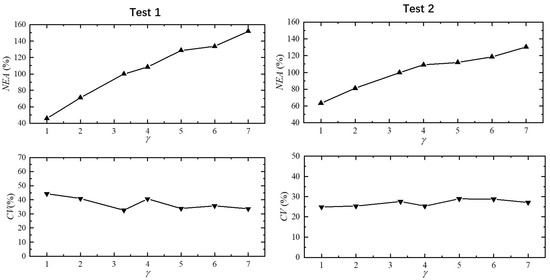
Figure 10.
Variation in and with the spectral peak enhancement factor .
3.4. Effect of Wave Groupiness Factor
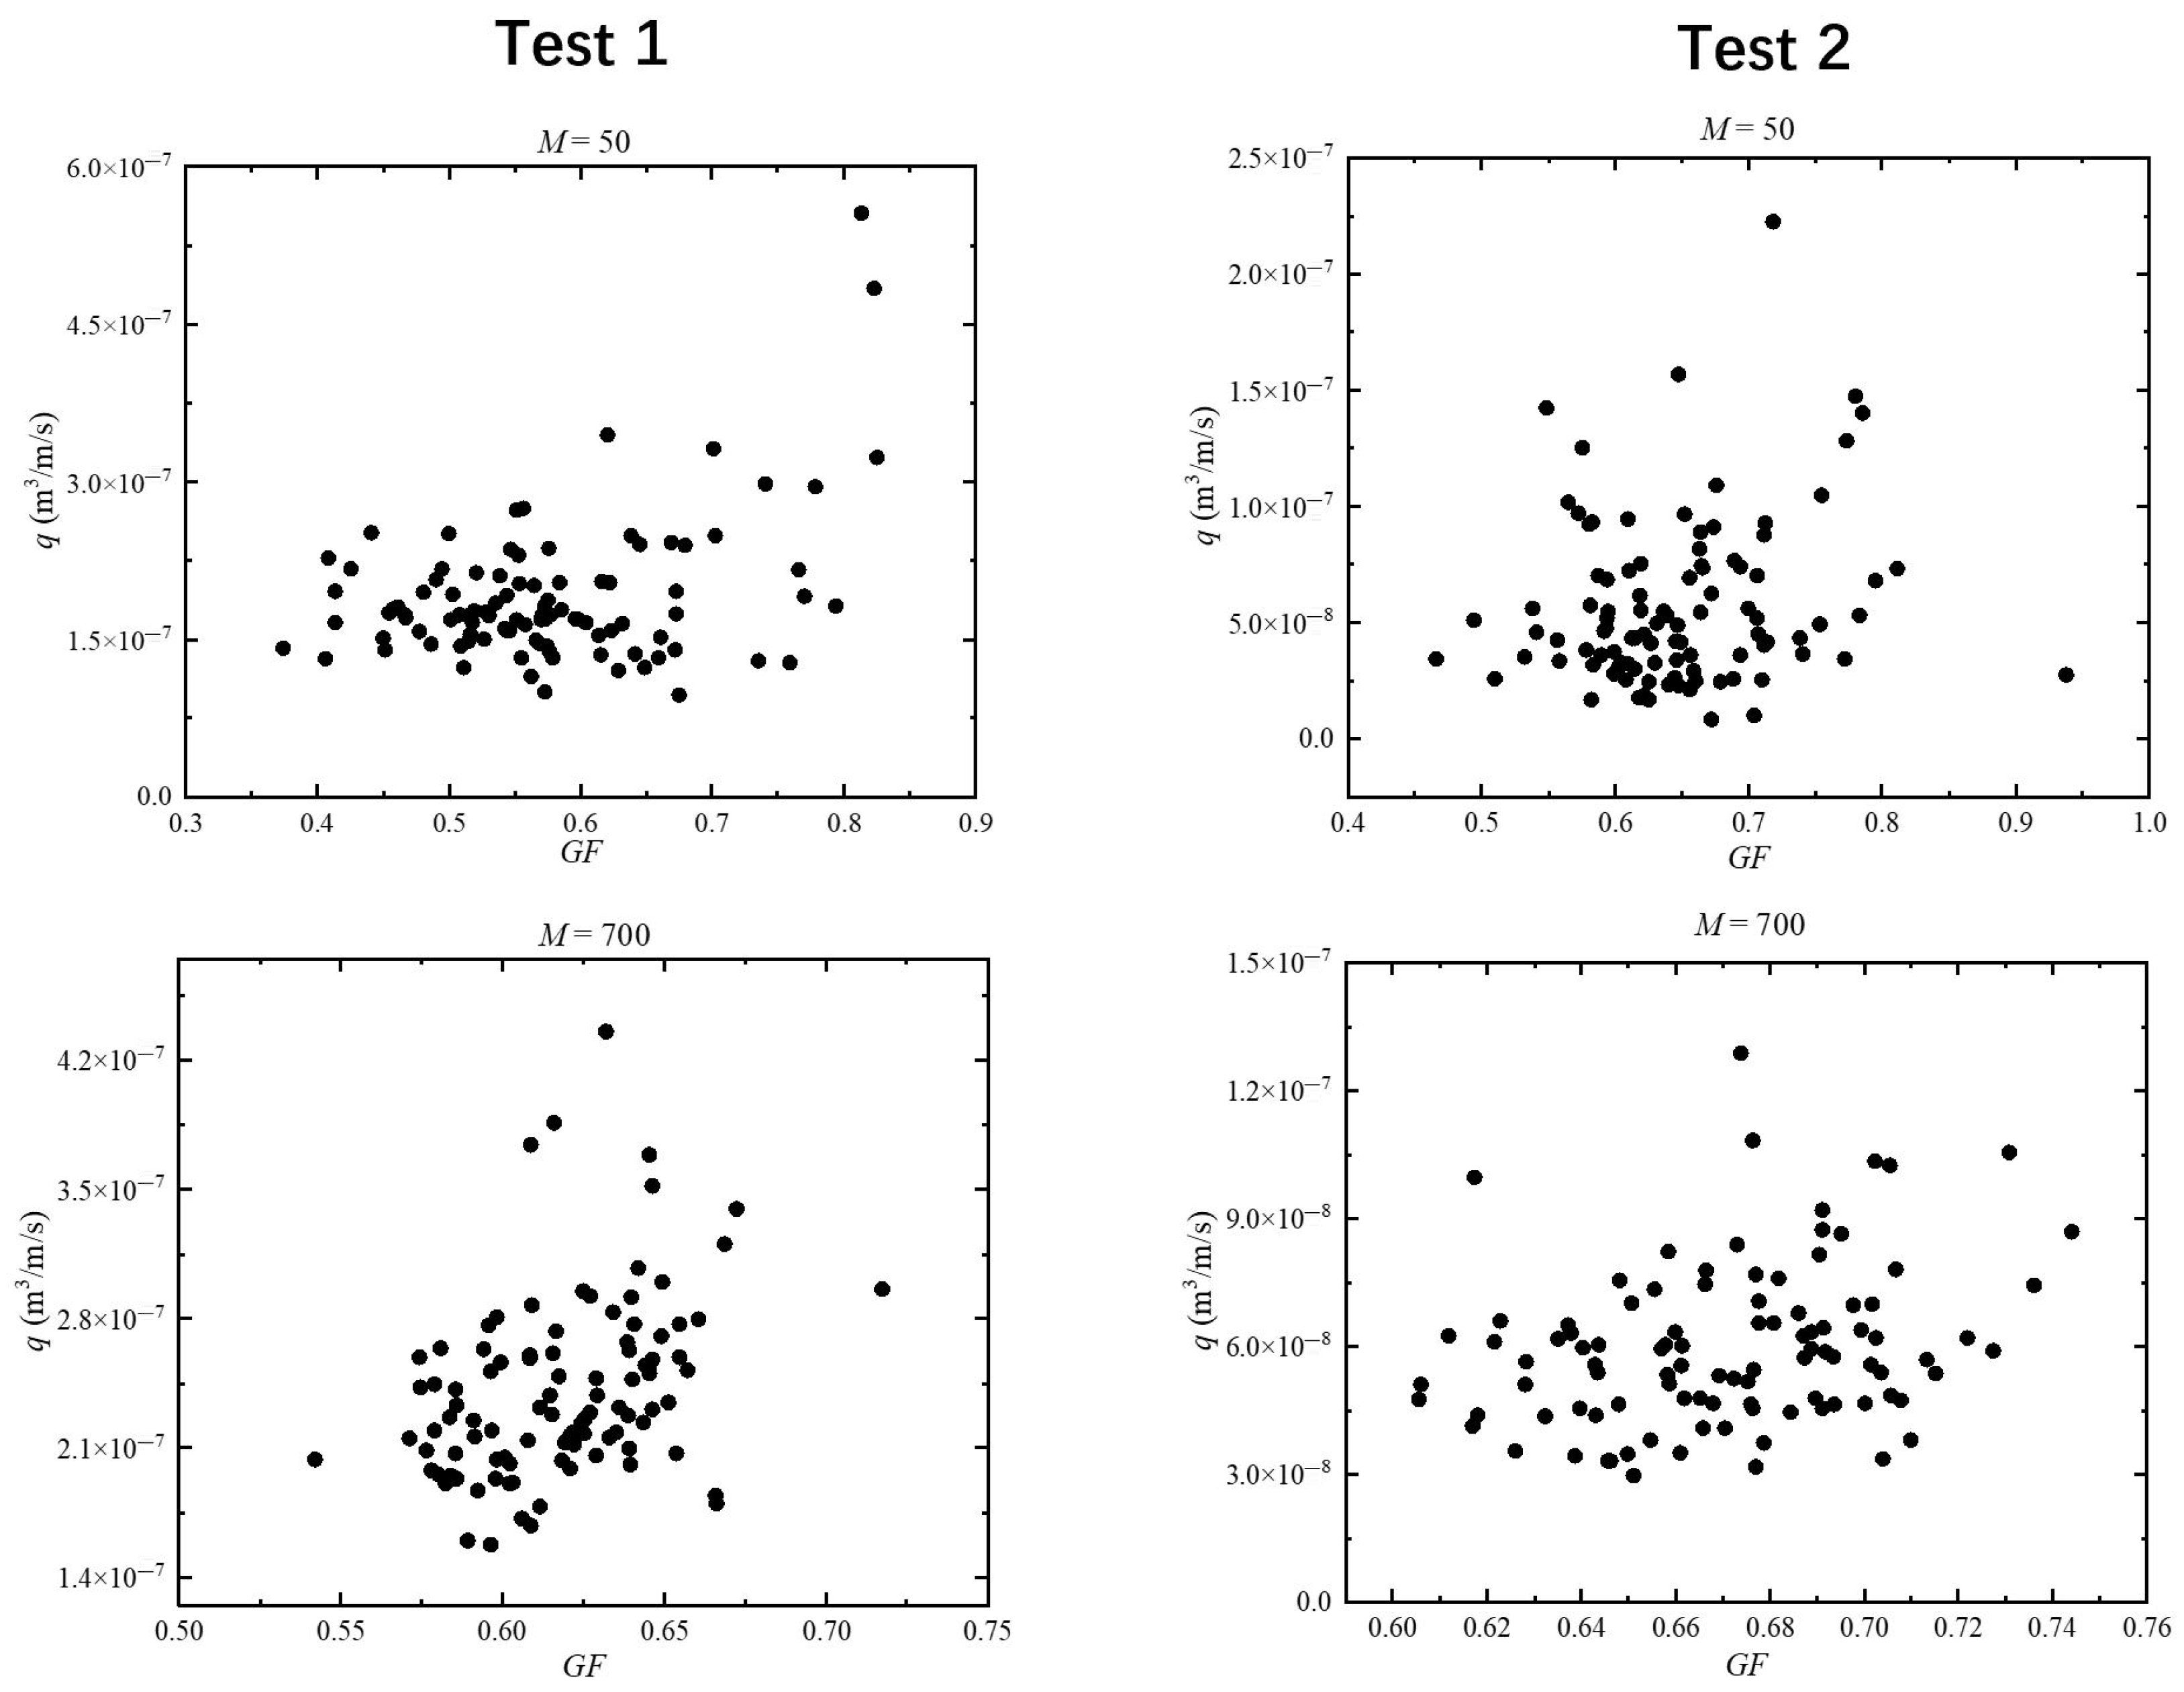
Figure 11 elucidates the dependence of overtopping rate q on the wave groupiness factor for different spectral resolutions (M frequency bins). At low spectral resolution (), the values span an unrealistically broad range (0.35–0.95), exceeding typical oceanic observations and indicating the presence of nonphysical wave train artifacts. This artificial variability obscures any systematic relationship between q and . Conversely, when M is increased to 700, the distribution contracts to physically plausible values, and a distinct positive correlation between q and emerges. This trend is consistent with the findings of Liu et al. [18], who reported a similar relationship between runup height and , thereby supporting the robustness of our simulation approach. From an experimental design perspective, these results suggest that incorporating site-specific information can substantially reduce the number of required repetitions to achieve reliable overtopping estimates, enhancing both efficiency and accuracy in hazard assessment.
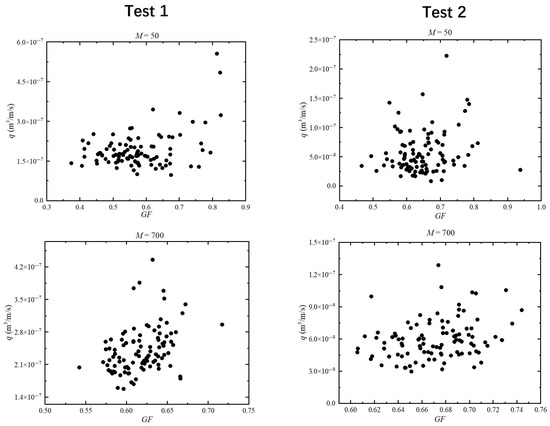
Figure 11.
Overtopping rate q vs. groupiness factor for different frequency bins M.
4. Conclusions
This study systematically quantified the uncertainty sources affecting wave overtopping rates (q) on vertical seawalls fronted by coral reefs through ensemble-based SWASH model simulations. A key finding is the dominant role of infragravity (IG) waves near the seawall, which substantially contribute to overtopping discharge. This distinguishes reef environments from typical continental coasts and underscores the limitations of conventional design formulae that neglect low-frequency wave components.
Our analysis critically examines spectral resolution requirements. We demonstrate that conventional spectral resolutions (e.g., 50–100 frequency bins, as per standards like JTS/T 231-2021) are insufficient for reliable overtopping predictions. Low bin counts induce artificial wave repetition within sequences, violating duration requirements and distorting overtopping statistics. Importantly, we show that at least 700 frequency bins are necessary to: (1) achieve statistical convergence in overtopping rates, (2) eliminate nonphysical wave groupiness artifacts, and (3) capture realistic ranges of the groupiness factor (). This resolves a fundamental conflict in current engineering practice between simulating sufficiently long wave sequences and achieving adequate spectral discretization.
Spectral characteristics significantly modulate both the mean and variability of overtopping. Narrower spectra (higher peak enhancement factor) lead to significantly higher overtopping rates, indicating that spectral bandwidth, not just peak period, controls the energy distribution critical to overtopping processes. Crucially, wave groupiness () emerges as a predictor of overtopping variability, with higher values directly correlating with increased discharge rates. This relationship enables more efficient hazard assessment, as site-specific information can reduce the number of required experimental replicates.
Furthermore, a technical finding is that, when spectral resolution is adequate (≥700 bins), the overtopping discharge q follows a normal distribution. This statistical characteristic provides a solid foundation for probabilistic analysis and experimental design. Therefore, it is suggested to leverage the normal distribution of q under adequate resolution to optimize experimental design, significantly reducing the number of replicate simulations or tests required for robust statistical characterization.
Author Contributions
Conceptualization, H.Z.; methodology, H.Z., B.L. and Y.G.; software, H.Z. and B.L.; formal analysis, H.Z. and B.L.; writing—original draft preparation, H.Z. and B.L.; writing—review and editing, Y.L. All authors have read and agreed to the published version of the manuscript.
Funding
This research was supported by (1) the Open Research Fund of Key Laboratory of Sediment Science and Northern River Training, the Ministry of Water Resources, China Institute of Water Resources and Hydropower Research, Grant NO. IWHR-SEDI-2023-05, and (2) Research Innovation Fund of Tianjin Research Institute for Water Transport Engineering, Grant No. TKS20240601.
Data Availability Statement
The raw data supporting the conclusions of this article will be made available by the authors upon request.
Conflicts of Interest
The authors declare no conflicts of interest.
References
- Cai, R.; Tan, H. Progress on the evolutionary characteristics and climatic causes for warming and marine heatwaves in the coastal china seas. Chin. J. Atmos. Sci. 2024, 48, 121–146. (In Chinese) [Google Scholar] [CrossRef]
- Ferrario, F.; Beck, M.W.; Storlazzi, C.D.; Micheli, F.; Shepard, C.C.; Airoldi, L. The effectiveness of coral reefs for coastal hazard risk reduction and adaptation. Nat. Commun. 2014, 5, 3794. [Google Scholar] [CrossRef] [PubMed]
- Costa, M.B.; Araújo, M.; Araújo, T.C.; Siegle, E. Influence of reef geometry on wave attenuation on a Brazilian coral reef. Geomorphology 2016, 253, 318–327. [Google Scholar] [CrossRef]
- Roeber, V.; Bricker, J. Destructive tsunami-like wave generated by surf beat over a coral reef during Typhoon Haiyan. Nat. Commun. 2015, 6, 7854. [Google Scholar] [CrossRef] [PubMed]
- Hoeke, R.; McInnes, K.; Kruger, J.; McNaught, R.; Hunter, J.; Smithers, S. Widespread inundation of Pacific islands triggered by distant-source wind-waves. Glob. Planet. Change 2013, 108, 128–138. [Google Scholar] [CrossRef]
- Beck, M.W.; Losada, I.J.; Menéndez, P.; Reguero, B.G.; Díaz-Simal, P.; Fernández, F. The global flood protection savings provided by coral reefs. Nat. Commun. 2018, 9, 2186. [Google Scholar] [CrossRef] [PubMed]
- Li, Y.; Zhang, C.; Chen, S.; Qi, H.; Dai, W.; Zhu, H.; Sui, T.; Zheng, J. Experimental investigation on cross-shore profile evolution of reef-fronted beach. Coast. Eng. 2025, 195, 104653. [Google Scholar] [CrossRef]
- Masselink, G.; McCall, R.; Beetham, E.; Kench, P.; Storlazzi, C. Role of Future Reef Growth on Morphological Response of Coral Reef Islands to Sea-Level Rise. JGR Earth Surf. 2021, 126, e2020JF005749. [Google Scholar] [CrossRef]
- Yao, Y.; Huang, Z.; Monismith, S.G.; Lo, E.Y.M. Characteristics of monochromatic waves breaking over fringing reefs. J. Coast. Res. 2013, 29, 94–104. [Google Scholar] [CrossRef]
- Franklin, G.L.; Torres-Freyermuth, A. On the runup parameterisation for reef-lined coasts. Ocean Model. 2021, 169, 101929. [Google Scholar] [CrossRef]
- Baldock, T.E.; Shabani, B.; Callaghan, D.P.; Hu, Z.; Mumby, P.J. Two-dimensional modelling of wave dynamics and wave forces on fringing coral reefs. Coast. Eng. 2020, 155, 103594. [Google Scholar] [CrossRef]
- Pomeroy, A.; Lowe, R.; Symonds, G.; Van Dongeren, A.; Moore, C. The dynamics of infragravity wave transformation over a fringing reef. J. Geophys. Res. 2012, 117, C11022. [Google Scholar] [CrossRef]
- Nwogu, O.; Demirbilek, Z. Infragravity wave motions and runup over shallow fringing reefs. J. Waterw. Port Coast. Ocean Eng. 2010, 136, 295–305. [Google Scholar] [CrossRef]
- Liu, Y.; Li, S.; Liao, Z.; Liu, K. Physical and numerical modeling of random wave transformation and overtopping on reef topography. Ocean Eng. 2021, 220, 108390. [Google Scholar] [CrossRef]
- Becker, J.M.; Merrifield, M.A.; Yoon, H. Infragravity waves on fringing reefs in the tropical Pacific: Dynamic setup. J. Geophys. Res. Oceans 2016, 121, 3010–3028. [Google Scholar] [CrossRef]
- Cheriton, O.; Storlazzi, C.; Rosenberger, K. Observations of wave transformation over a fringing coral reef and the importance of low-frequency waves and offshore water levels to runup, overwash, and coastal flooding. J. Geophys. Res. Oceans 2016, 121, 3121–3140. [Google Scholar] [CrossRef]
- Cheriton, O.M.; Storlazzi, C.D.; Rosenberger, K.J. In situ observations of wave transformation and infragravity bore development across reef flats of varying geomorphology. Front. Mar. Sci. 2020, 7, 351. [Google Scholar] [CrossRef]
- Liu, Y.; Liao, Z.; Fang, K.; Li, S. Uncertainty of wave runup prediction on coral reef-fringed coasts using SWASH model. Ocean Eng. 2021, 242, 110094. [Google Scholar] [CrossRef]
- Yao, Y.; Yang, X.; Lai, S.H.; Chin, R.J. Predicting tsunami-like solitary wave run-up over fringing reefs using the multi-layer perceptron neural network. Nat. Hazards 2021, 107, 601–616. [Google Scholar] [CrossRef]
- Liu, Y.; Li, S.; Zhao, X.; Hu, C.; Fan, Z.; Chen, S. Artificial neural network prediction of overtopping rate for impermeable vertical seawalls on coral reefs. J. Waterw. Port Coast. Ocean Eng. 2020, 146, 04020015. [Google Scholar] [CrossRef]
- Qin, Y.; Su, C.; Chu, D.; Zhang, J.; Song, J. A review of application of machine learning in storm surge problems. J. Mar. Sci. Eng 2023, 11, 1729. [Google Scholar] [CrossRef]
- Liu, Y.; Li, S.; Chen, S.; Hu, C.; Fan, Z.; Jin, R. Random wave overtopping of vertical seawalls on coral reefs. Appl. Ocean Res. 2020, 100, 102166. [Google Scholar] [CrossRef]
- Chen, S.; Zhang, C.; Wang, Z.; Zheng, J.; Chen, H. Experiment on wave overtopping of a vertical seawall on coral reefs in large wave flume. Chin. Sci. Bull. 2019, 64, 3049–3058. [Google Scholar] [CrossRef]
- Williams, H.E.; Briganti, R.; Pullen, T. The role of offshore boundary conditions in the uncertainty of numerical prediction of wave overtopping using non-linear shallow water equations. Coast. Eng. 2014, 89, 30–44. [Google Scholar] [CrossRef]
- Schäffer, H.A. Second-order wavemaker theory for irregular waves. Ocean Eng. 1996, 23, 47–88. [Google Scholar] [CrossRef]
- Zijlema, M.; Stelling, G.; Smit, P. SWASH: An operational public domain code for simulating wave fields and rapidly varied flows in coastal waters. Coast. Eng. 2011, 58, 992–1012. [Google Scholar] [CrossRef]
- Rijnsdorp, D.P.; Smit, P.B.; Zijlema, M. Non-hydrostatic modelling of infragravity waves under laboratory conditions. Coast. Eng. 2014, 85, 30–42. [Google Scholar] [CrossRef]
- Liu, Y.; Yao, Y.; Liao, Z.; Li, S.; Zhang, C.; Zou, Q. Fully nonlinear investigation on energy transfer between long waves and short-wave groups over a reef. Coast. Eng. 2023, 179, 104240. [Google Scholar] [CrossRef]
- Suzuki, T.; Altomare, C.; Veale, W.; Verwaest, T.; Trouw, K.; Troch, P.; Zijlema, M. Efficient and robust wave overtopping estimation for impermeable coastal structures in shallow foreshores using SWASH. Coast. Eng. 2017, 122, 108–123. [Google Scholar] [CrossRef]
- Liu, Y.; Li, S. Variation of wave groupiness across a fringing reef. J. Waterw. Port Coast. Ocean Eng. 2018, 144, 04018022. [Google Scholar] [CrossRef]
- Mansard, E.; Funke, E.R. The measurement of incident and reflected spectra using a least squares method. In Proceedings of the 17th International Conference on Coastal Engineering, Reston, VA, USA, March 1980; pp. 154–172. [Google Scholar]
- Lashley, C.H.; Roelvink, D.; Van Dongeren, A.; Buckley, M.L.; Lowe, R.J. Nonhydrostatic and surfbeat model predictions of extreme wave run-up in fringing reef environments. Coast. Eng. 2018, 137, 11–27. [Google Scholar] [CrossRef]
- Irías Mata, M.; Van Gent, M.R. Numerical modelling of wave overtopping discharges at rubble mound breakwaters using OpenFOAM®. Coast. Eng. 2023, 181, 104274. [Google Scholar] [CrossRef]
- JTS/T 231-2021; The Technical Code of Modeling Test for Port and Waterway Engineering. China Communications Press: Beijing, China, 2021.


Disclaimer/Publisher’s Note: The statements, opinions and data contained in all publications are solely those of the individual author(s) and contributor(s) and not of MDPI and/or the editor(s). MDPI and/or the editor(s) disclaim responsibility for any injury to people or property resulting from any ideas, methods, instructions or products referred to in the content. |
© 2025 by the authors. Licensee MDPI, Basel, Switzerland. This article is an open access article distributed under the terms and conditions of the Creative Commons Attribution (CC BY) license (https://creativecommons.org/licenses/by/4.0/).