Abstract
In shallow groundwater areas, the freeze–thaw process can easily exacerbate soil salinization. The variations and migrations of Na+, K+, Ca2+, Mg2+, Cl−, SO42−, and HCO3− at the depth of 0–100 cm under shallow groundwater depth (2.63–2.87 m) during the freeze–thaw period were analyzed. And a multi-index comprehensive evaluation method based on factor analysis was employed to investigate the soil salinization degree. The results show that K+, Mg2+, and HCO3− exhibited surface enrichment during the freeze–thaw period, while Na+, Cl−, and SO42− accumulated in the frozen layer during the freezing stage. However, there is no surface enrichment of Ca2+. During the freezing stage, Mg2+ and Cl− exhibited the strongest migration capabilities among cations and anions, respectively. During the thawing stage, K+ and HCO3− were the cation and anion with the highest ionic migration capabilities, respectively. Total salinity (TS), Cl−, SO42−, HCO3−, Na+, K+, Mg2+, and residual sodium carbonate (RSC) were identified as the dominant factors influencing the salinization degree during the freeze–thaw period. During the freezing stage, soil salt ions predominantly migrated from the unfrozen to the frozen layer, and the salinization degree in the frozen layer increased with the development of the frozen layer. In the thawing stage, soil salt ions migrated upward from the thawing front, and the salinization degree at the depth of 0–30 cm increased. This study provides insights for the prevention and control of soil salinization in arid regions.
1. Introduction
Seasonally frozen regions are predominantly distributed across arid and semi-arid zones in northwest and northern regions [1]. The dynamics of soil water and salt transport during freeze–thaw periods represent a critical focus in understanding the formation and regulation of soil salinization in cold-arid regions, with these processes directly influencing the sustainable development of agricultural productivity [2]. During freeze–thaw cycles, changes in soil moisture and solute migration not only induce vertical differentiation of water–salt and surface salt accumulation [3,4] but also alter soil physicochemical properties and microbial activity, posing significant threats to agricultural sustainability [5,6].
Current research on soil water–salt migration primarily employs sampling experiments and numerical simulations [7]. Zhao et al. [8] conducted indoor soil column experiments to compare the effects of sand mulching thickness on water–salt distribution in cultivated versus uncultivated soils under brackish water irrigation. Wang et al. [9] investigated coupled water–heat–salt migration in saline soils through soil column modeling. Jiang et al. [10] simulated soil water–salt distribution in Xinjiang’s Kaidu River irrigation district using the SWAT model, while Zhang et al. [11] combined numerical simulations with indoor evaporation tests to analyze water–salt dynamics in salinized soils. However, under multi-field coupling during freeze–thaw cycles, temperature gradient-driven moisture stage changes trigger convective ion transport within soil pores [12,13], complicating salt migration [14]. Salt migration is jointly regulated by temperature, soil texture [15,16,17], ion species [18], and groundwater depth [19,20,21,22]. Studies have demonstrated that during freezing stages, soil salts migrate with moisture toward the freezing front and accumulate in frozen layers. During thawing stages, intensive evaporation promotes surface salt aggregation [23], forming a distinctive dual-stage salinization [24]. Low-mineralization groundwater replenishes shallow soil moisture through capillary rise, whereas high-mineralization groundwater exacerbates salt accumulation during recharge [25]. Furthermore, significant differences exist in accumulation characteristics among ions with varying compositions [26]. Liu et al. [27] observed differential migration capabilities between Cl− and SO42− during freeze–thaw cycles, with pronounced salt accumulation and elevated sodium adsorption ratio (SAR) occurring at 2 m groundwater depth [28], thereby threatening agricultural productivity.
Traditional saline–alkali research predominantly relies on field surveys and sampling analyses [29]. Wu et al. [30] employed WET sensors for saline surveys in China’s Nanshan Taizi region. Korolyuk et al. [31] identified alternating short-term desalination and long-term salinization stages through freeze–thaw salt migration observations in depression soils. Yang et al. [32] conducted field sampling to study the saline distribution in Northeast China’s Songnen Plain. With technological advancements, Saysel et al. [33] and Hassani [34,35] developed data-driven models to represent saline processes across diverse geographic environments in agricultural watersheds. Ding et al. [36] achieved high-precision saline soil classification using Landsat (ETM+) imagery in China’s Weigan-Kuqa River Delta. Sahbeni et al. [37] integrated geostatistical data with regression analysis to construct predictive models for soil salinity in the Hungarian Plain. These studies have elucidated spatial patterns of soil salinization, providing theoretical foundations for monitoring and remediation [38].
Quantitative salinization indices include total salinity (TS), SAR, exchangeable sodium percentage (ESP), residual sodium carbonate (RSC), and pH [39]. However, discrepancies arise when using single indices to assess salinization degree, as complex salt compositions render unidimensional evaluations inadequate. Comprehensive assessments integrating correlated indices are essential for reliable conclusions. Principal component analysis (PCA), a multivariate statistical technique, reduces dimensionality by transforming original variables into uncorrelated principal components that retain essential information. While widely applied in multidisciplinary complex system evaluations due to its dimensionality reduction and information condensation capabilities [40], its application in saline characterization remains limited [41].
The major soil ion concentrations during the freeze–thaw period were monitored from 2023 to 2024, and the soil salinization degree was evaluated by factor analysis (embedded principal component analysis) to identify dominant influencing factors and provide theoretical foundations for soil environmental management at shallow groundwater areas in seasonal freeze–thaw regions.
2. Materials and Methods
2.1. Overview of the Study Area
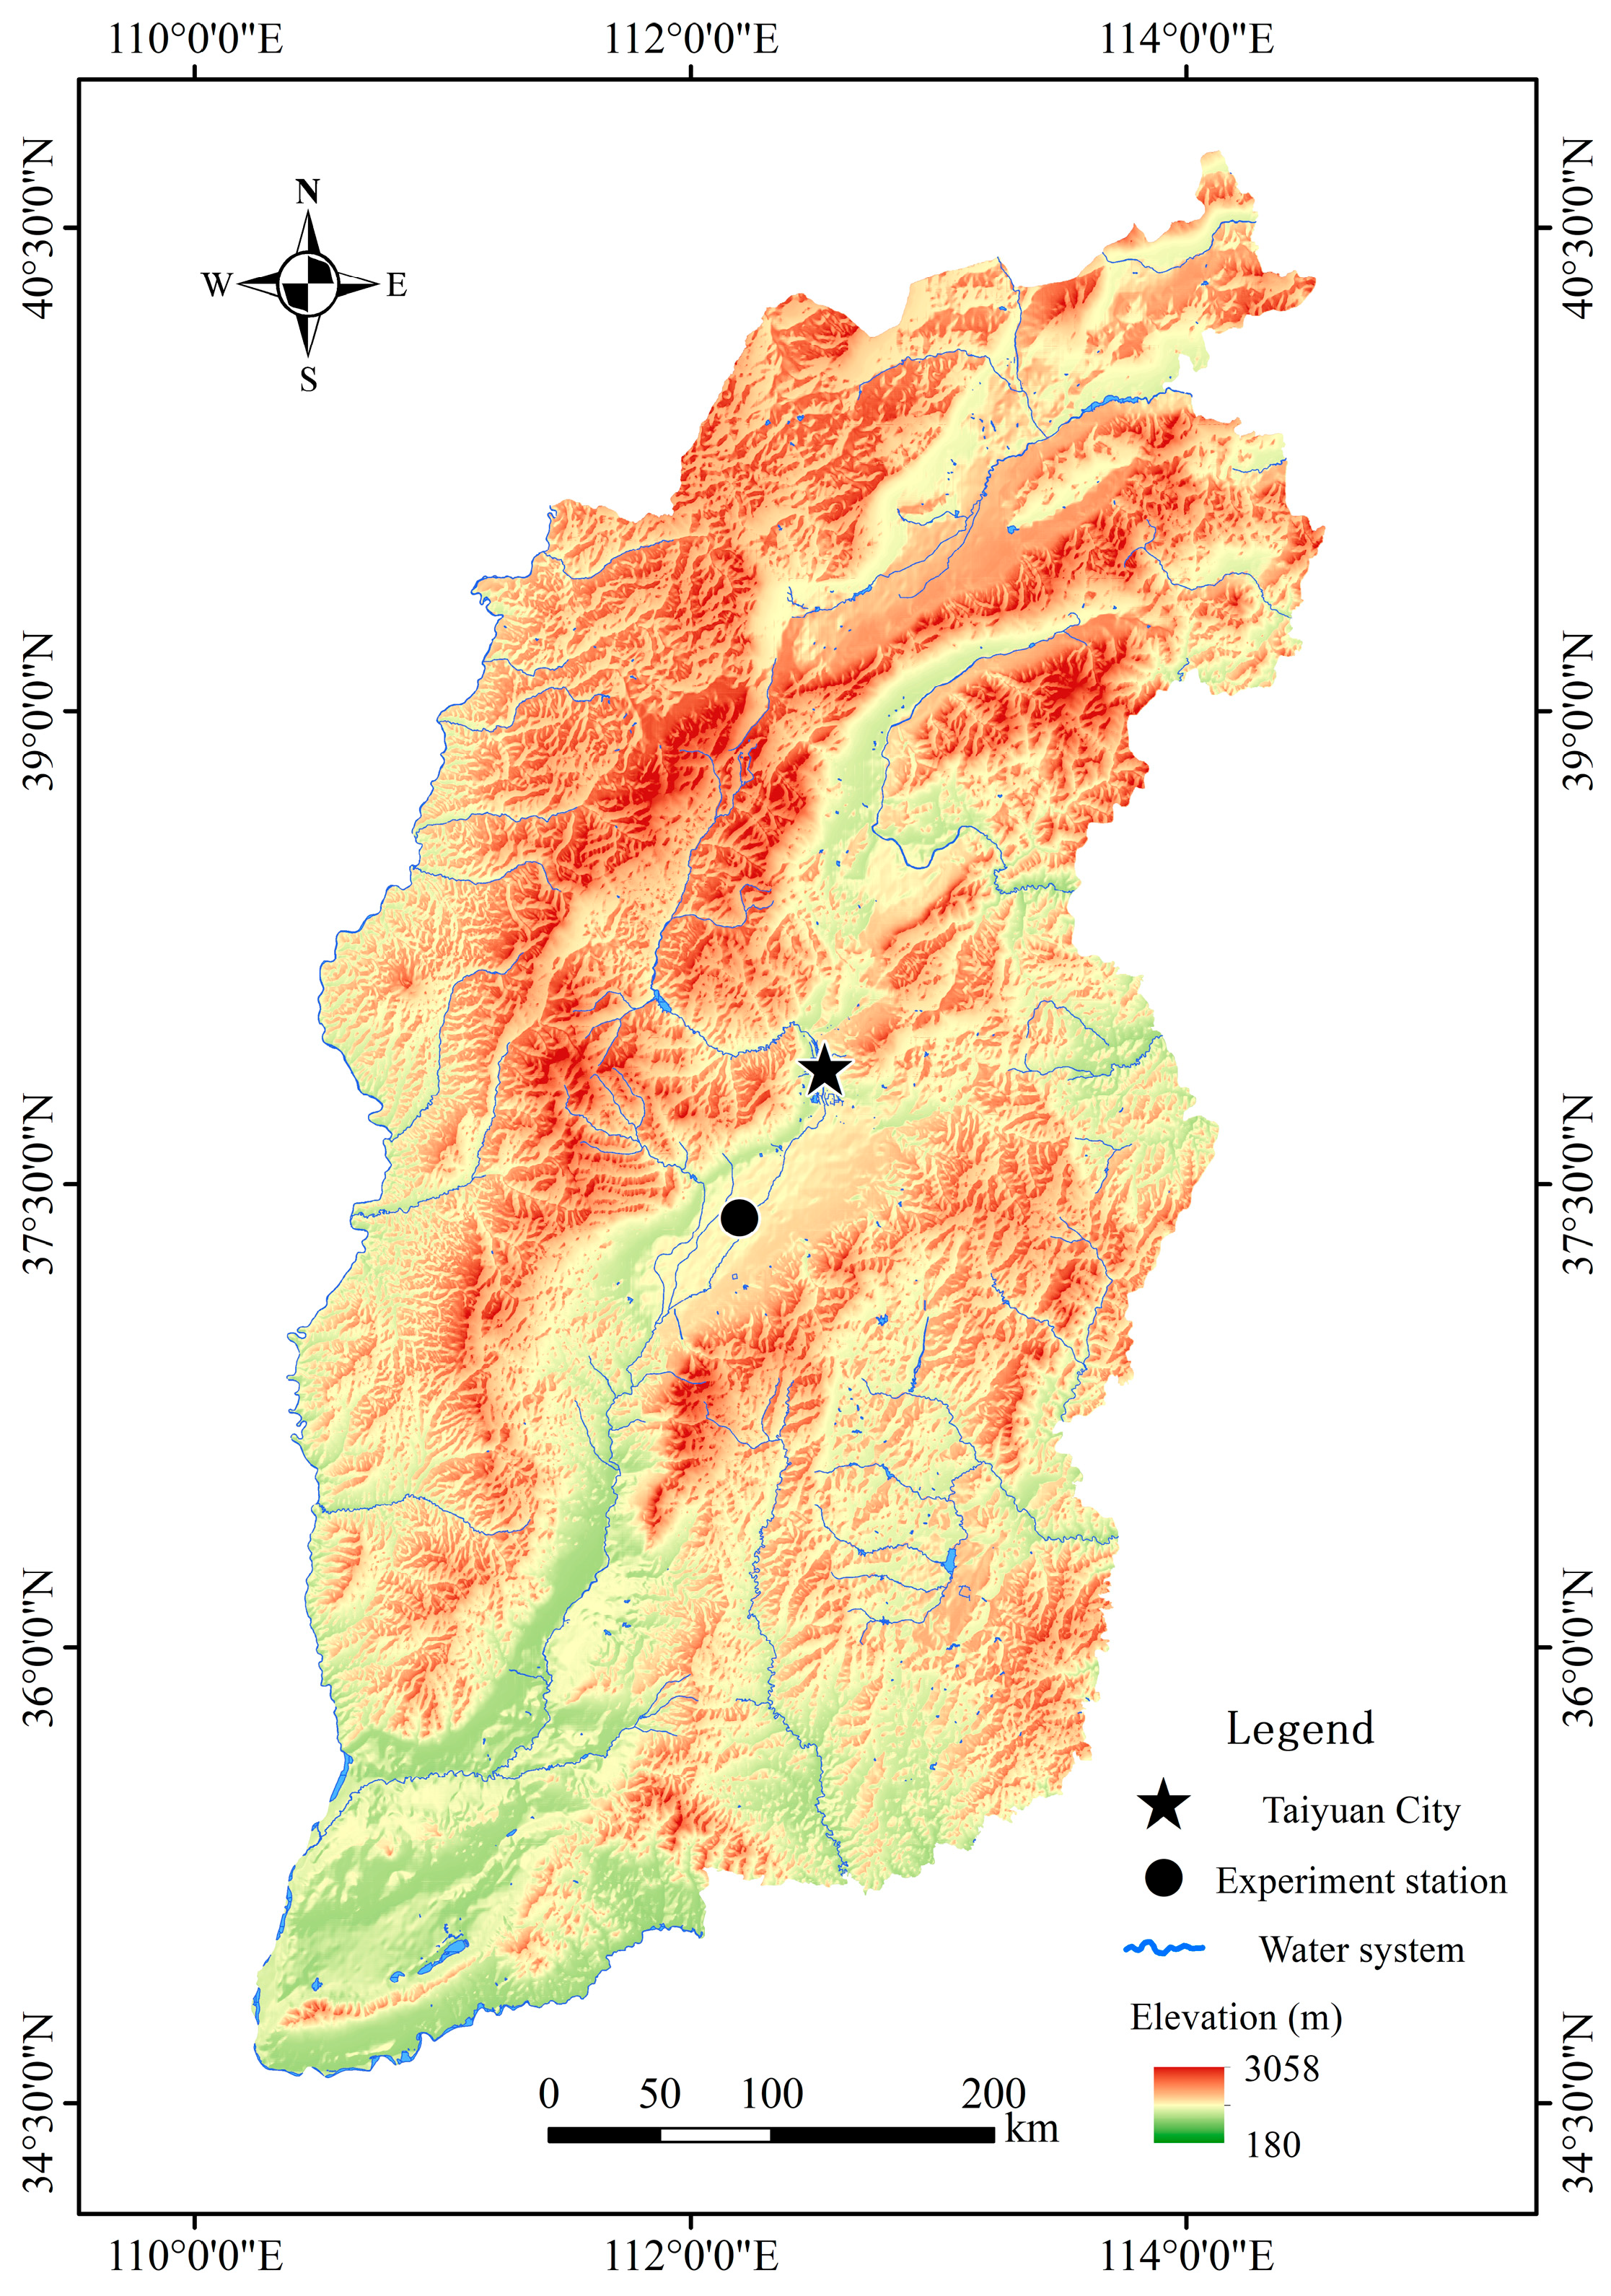
The experiment was conducted from November 2023 to March 2024 at the Scientific Research Service Center of Shanxi Fenhe River Irrigation Management Co., Ltd., located in Liu Hulan Town, Wenshui County, Lüliang City, Shanxi Province, China (37°23′27″ N, 112°11′51″ E; elevation: 749 m). The site lies within the Fenhe alluvial–proluvial plain of the Taiyuan Basin (Figure 1). The experimental area, cultivated with maize, experiences no irrigation during winter months. Groundwater levels fluctuated between 1.01 and 2.87 m below the surface. Regional climatic conditions include a multi-year average annual sunshine duration of 2551.9 h, mean annual air temperature of 10.1 °C, average ground temperature of 12.4 °C, mean wind speed of 2.0 m/s, multi-year average annual precipitation of 457 mm, mean relative humidity of 63%, and a frost-free period averaging 183 days.

Figure 1.
Location of experiment station.
2.2. Environmental Conditions
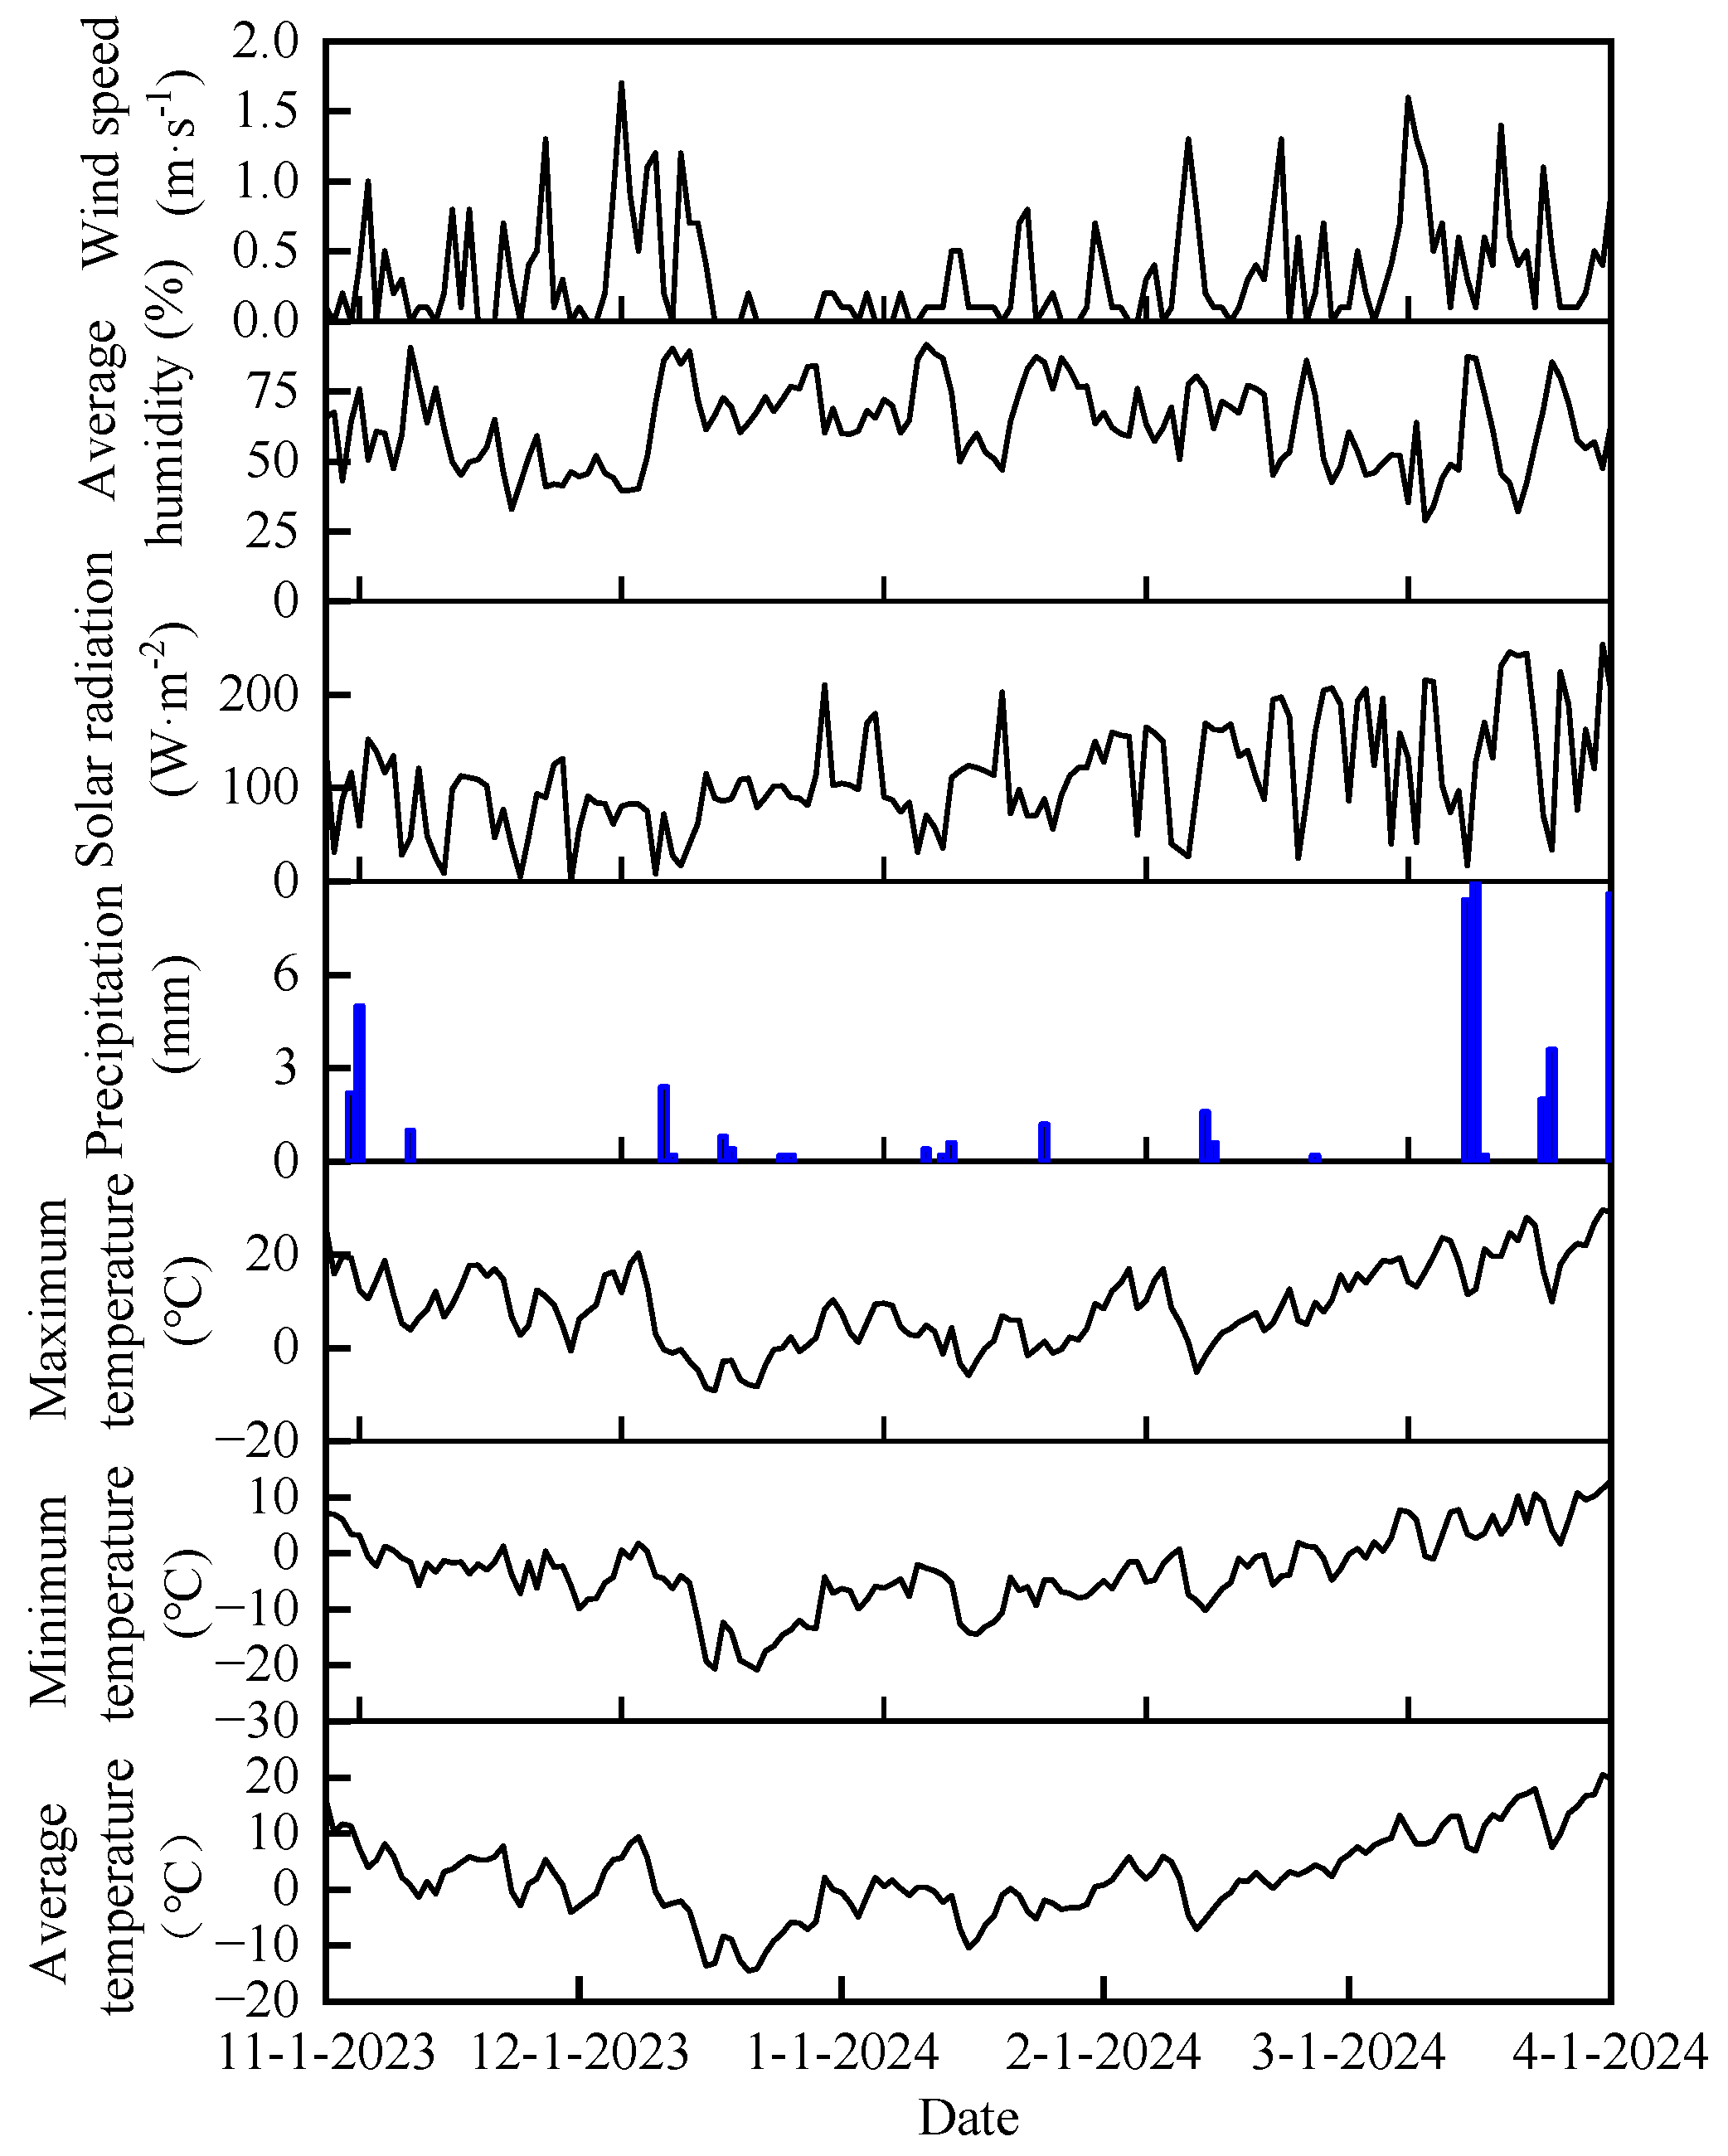
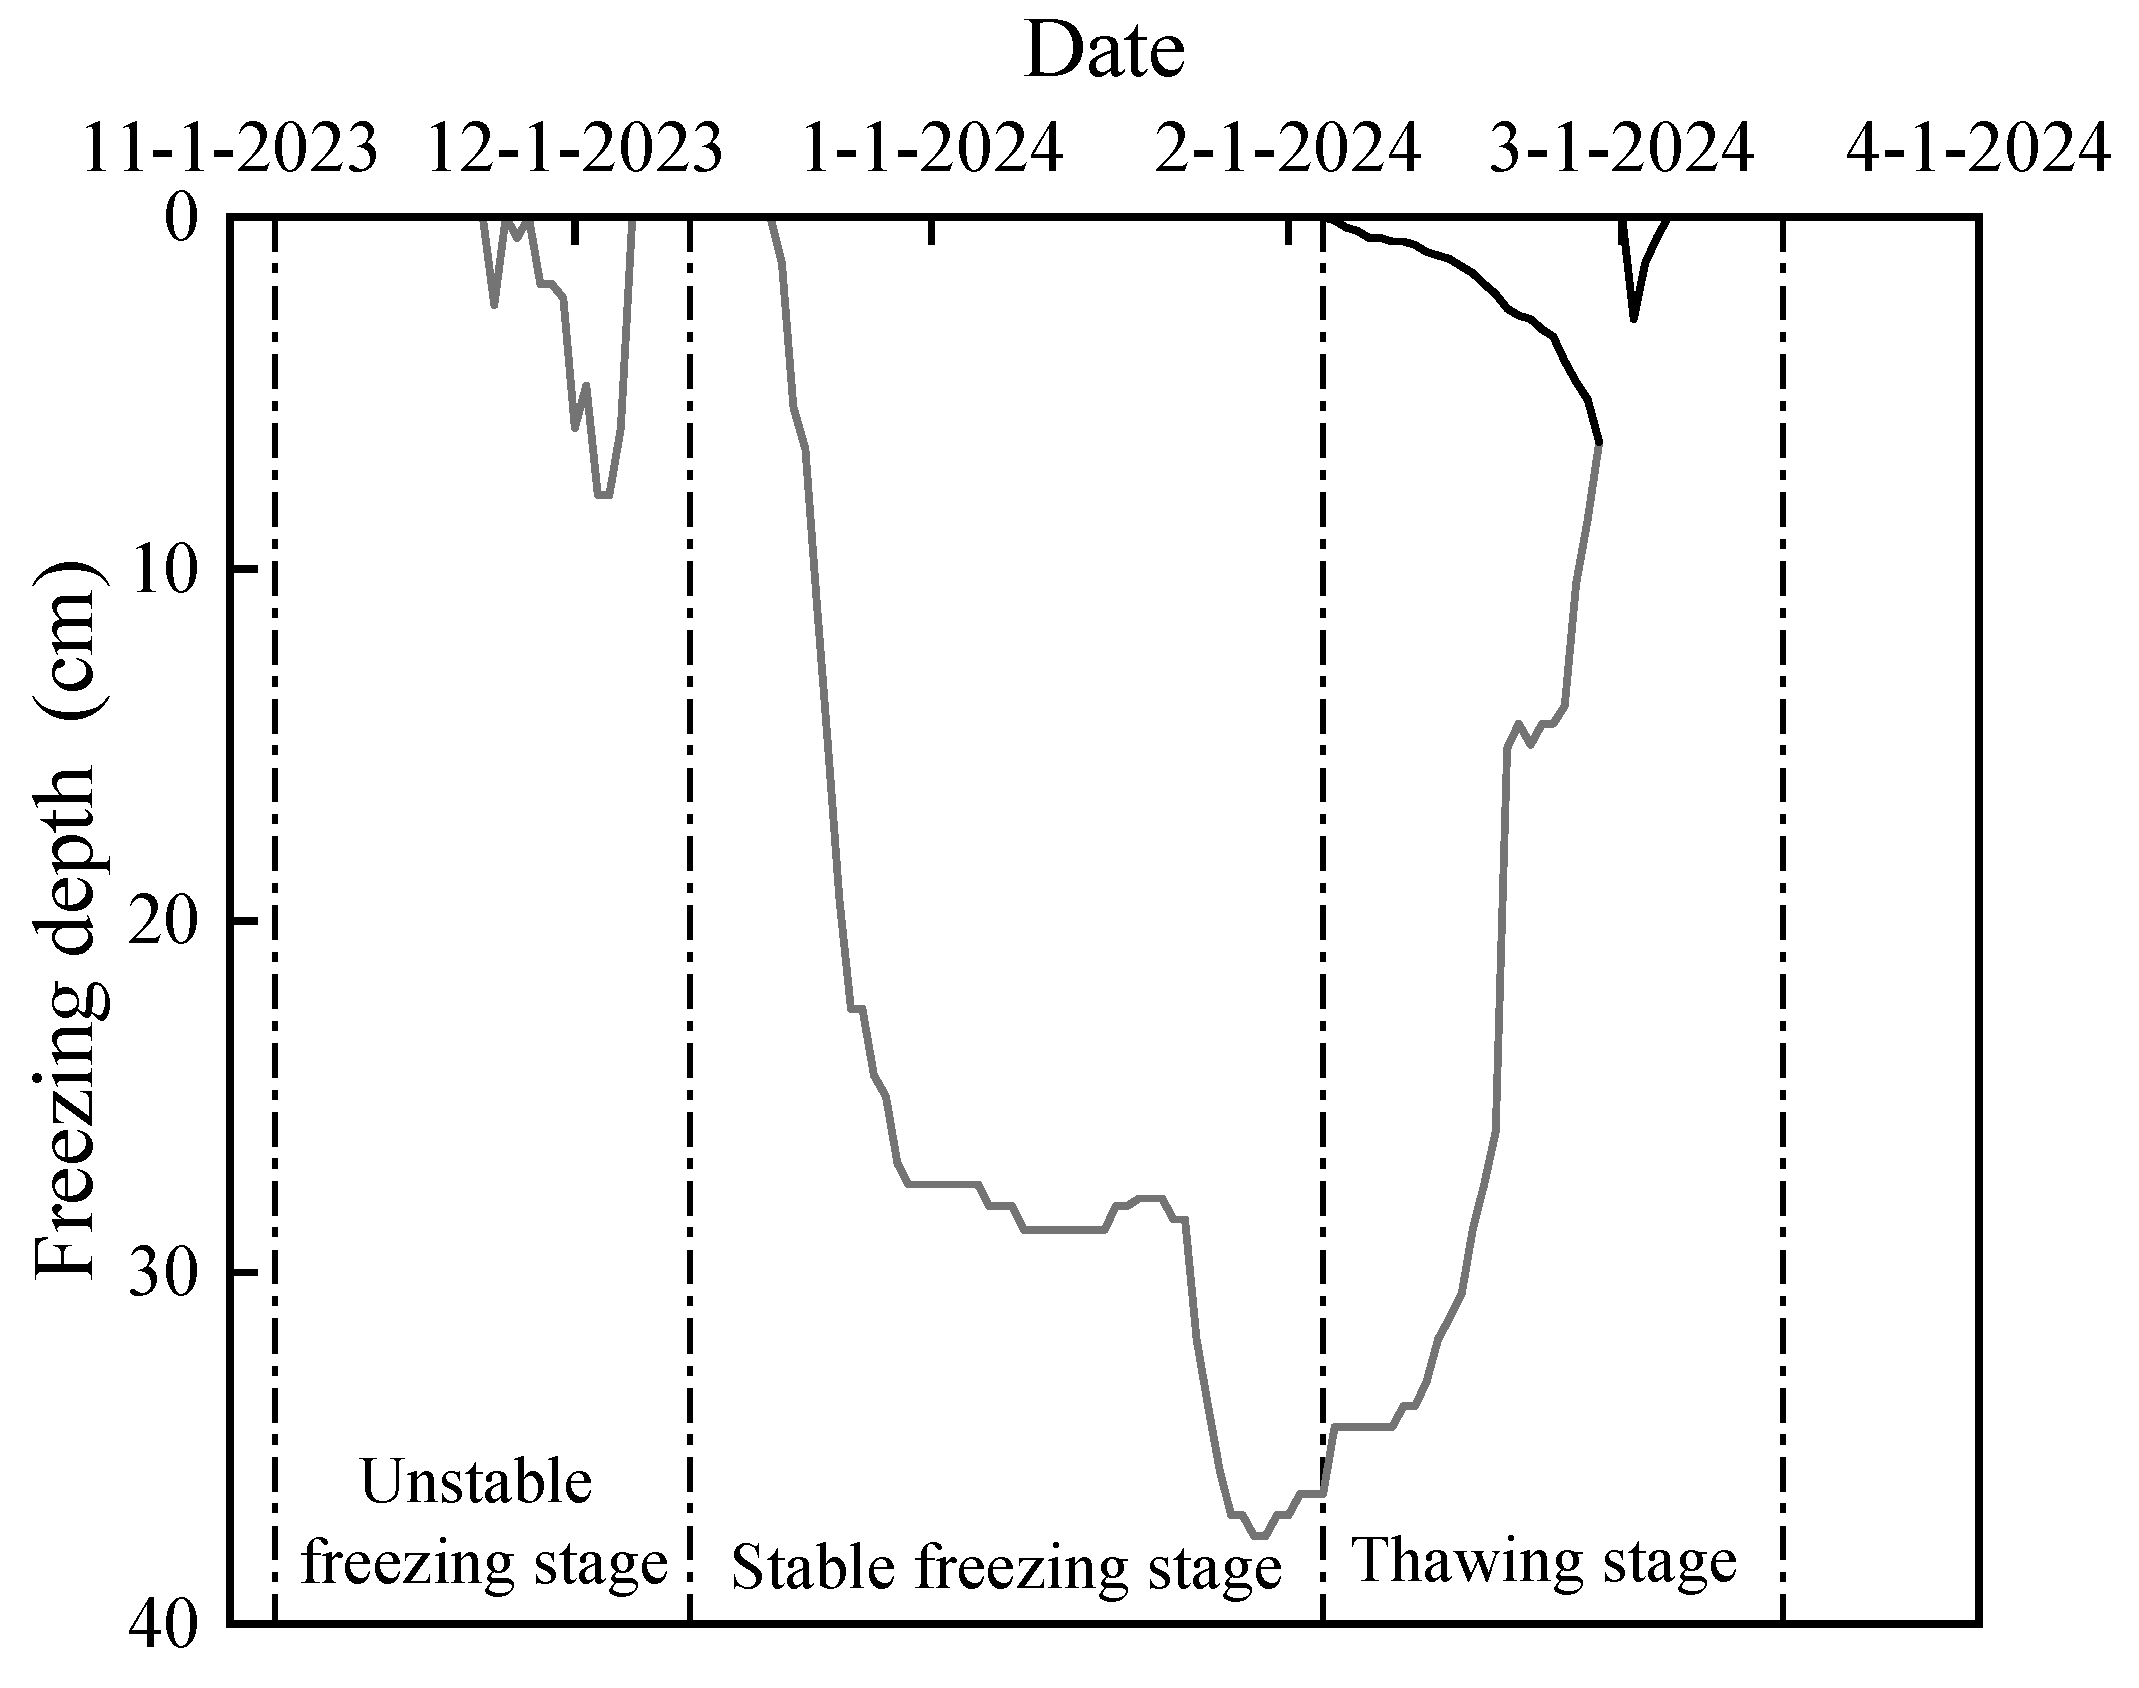
During the experimental period, the groundwater table depth ranged from 2.63 to 2.87 m, with variations in meteorological factors shown in Figure 2. Based on soil freeze–thaw characteristics, the freeze–thaw period was divided into three stages, such as the unstable freezing stage (5 November to 11 December 2023), the stable freezing stage (12 December 2023, to 4 February 2024), and the thawing stage (5 February to 15 March 2024), as shown in Figure 3. During the unstable freezing stage, air temperatures fluctuated below 0 °C, inducing repeated diurnal thawing and nocturnal freezing of surface soil, with a maximum freezing depth of 7.5 cm. In the stable freezing stage, the thickness of the frozen layer increased rapidly and steadily, with the maximum frozen depth of 37.5 cm on 29 January 2024. The thawing stage was characterized by bidirectional thawing of the frozen layer (simultaneous thawing from both the surface and subsurface), and the frozen layer was finally completely thawed on 4 March 2024.

Figure 2.
Changes in meteorological factors during the experimental period. Notes: Within solar radiation, “W” represents energy transferred or converted per unit time, measured in watts.

Figure 3.
Soil freezing and thawing process curve during freeze–thaw period.
2.3. Experiment Design
The soil temperature during the freeze–thaw period was monitored using pre-installed thermistors at 10:00 a.m. at the depths of 0, 5, 10, 15, 20, 25, 30, 40, 50, 60, 70, 80, 90, and 100 cm.
Due to the shallow groundwater and intense exchange between groundwater and soil water, soil samples were analyzed for the following ions: Na+, K+, Ca2+, Mg2+, Cl−, SO42−, and HCO3−. CO32− is excluded from analysis due to its concentration falling below the detection limit post-determination. Cations were quantified using atomic absorption spectrophotometry (Beijing Purkinje General TAS-990 model), while Cl− and SO42− were measured using ion chromatography (Thermo Scientific Aquion model). HCO3− was determined through acid–base indicator titration. Ten samples were conducted during the freeze–thaw period, as given in Table 1 (where Tk denotes the timing of the kth sampling). Soil samples were collected at 10 cm intervals from 0 to 100 cm, yielding 110 samples during the whole experimental period. The soil from 0 to 100 cm is classified as silt loam, with specific physical characteristics shown in Table 2.

Table 1.
Sampling program.
Table 2.
Soil properties.
2.4. Data Evaluation
The soil temperature at a given depth was calculated using the following formula:
where T represents soil profile temperature (°C), Rx represents the measured thermistor resistance (Ω), R25 denotes the thermistor resistance at 25 °C (Ω), and B is a constant, generally taken as 3950.
The soil ion storage per unit area within a specified depth was calculated as follows:
where Cl (l = Na+, K+, Ca2+, Mg2+, Cl−, SO42−, PO43−, HCO3−) represents the ion storage of each component (g/m2), dk denotes the thickness of the kth soil layer (m), ρk denotes the dry bulk density of the kth layer (kg/m3), and ck denotes the ion content in the kth layer (g/kg).
The sodium adsorption ratio (SAR), a critical index for assessing sodium hazard in soil alkalinization, was calculated as follows:
where Na+, Ca2+, and Mg2+ denote ionic concentrations (mmol·L−1).
The exchangeable sodium percentage (ESP), a key indicator for evaluating soil alkalinization severity, is traditionally derived from laboratory-measured exchangeable sodium (NaX) and cation exchange capacity (CEC). Due to methodological complexities, ESP was indirectly calculated using SAR and is calculated via the following formula [42]:
The residual sodium carbonate (RSC), an index for sodium hazard assessment, is calculated as follows:
where CO32−, HCO3−, Ca2+, and Mg2+ denote ionic concentrations (mmol·L−1).
3. Results and Discussion
3.1. Soil Temperature During Freeze–Thaw Period
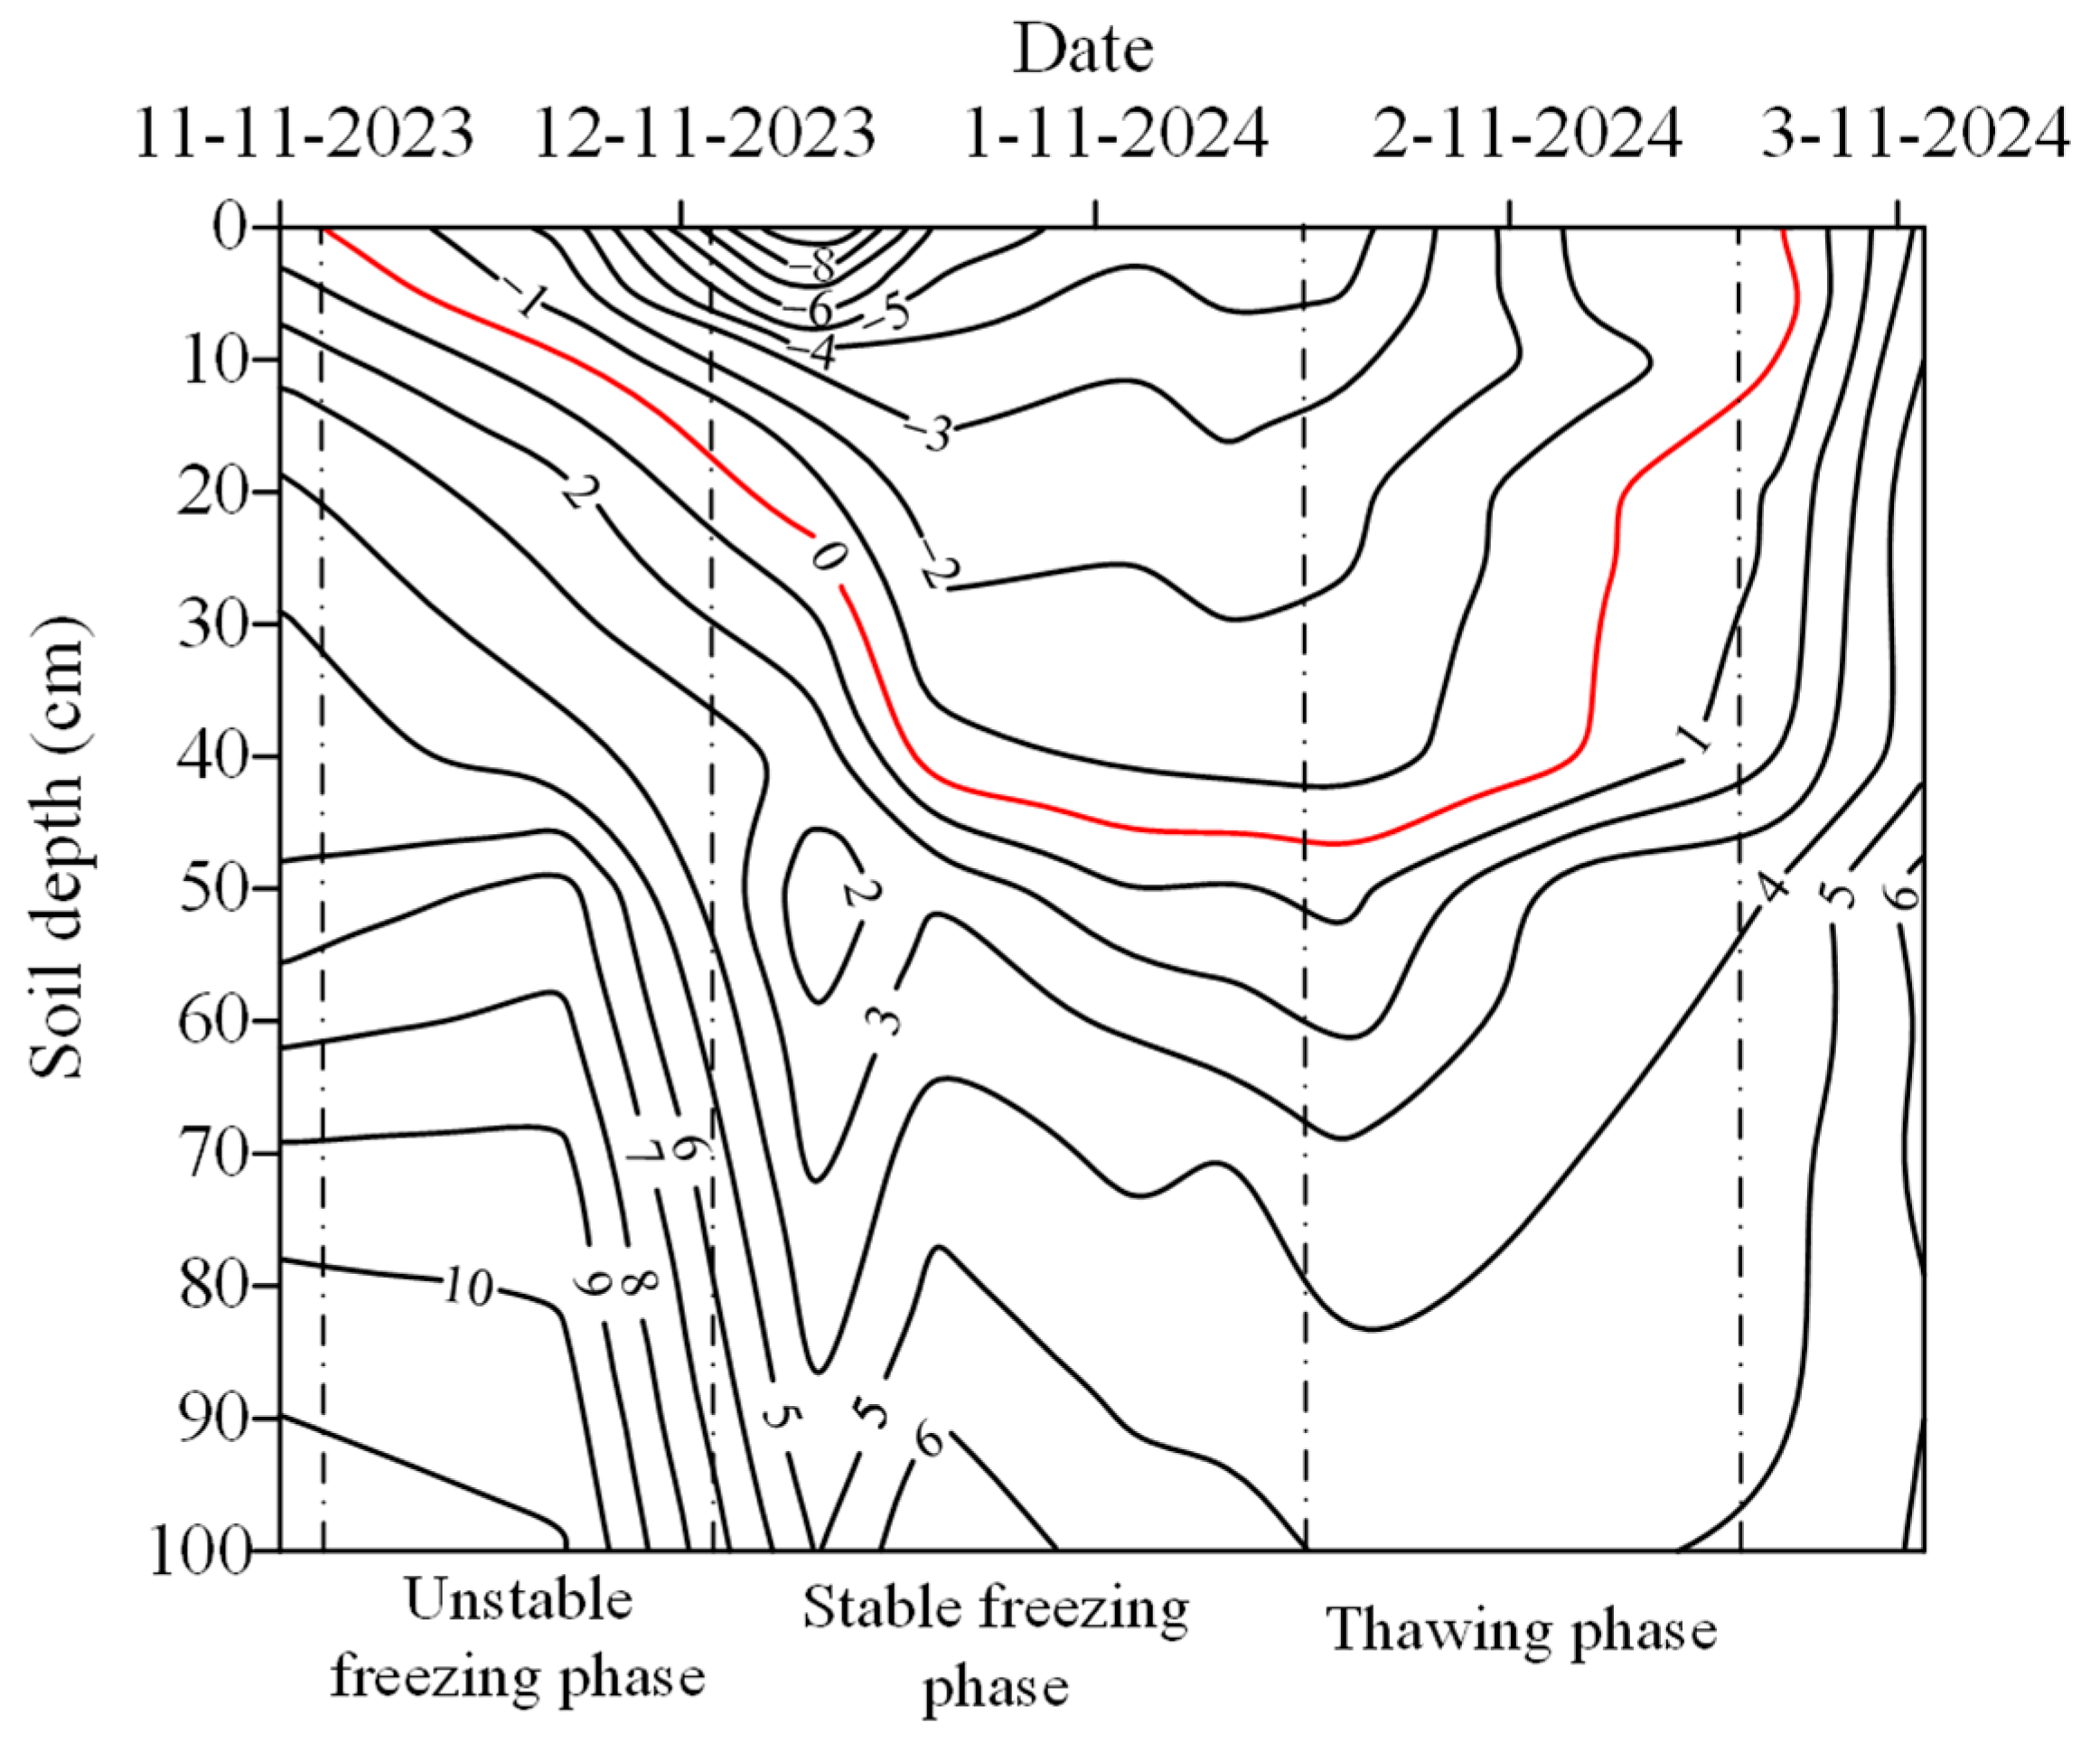
During the unstable freezing stage, the minimum temperature fluctuated around 0 °C. In the stable freezing stage, the soil underwent rapid downward freezing at a rate of 2.29 cm/d. A rapid temperature decline on 21 December 2023 resulted in an obvious soil temperature decline from 0 to 20 cm (2.9–8.6 °C reduction), and the soil temperature decreased about 1.7–3.1 °C at the depth of 20 to 40 cm. During the thawing stage, the daily average thawing rate reached 1.6 cm/d, and the frozen layer had completely thawed by 4 March 2024. The soil temperature variation during the freeze–thaw period shown in Figure 4.
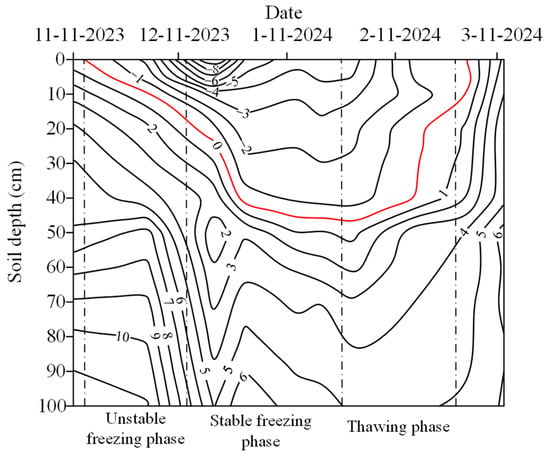
Figure 4.
Temperature variation in soil profile during monitoring period.
3.2. Variations in Soil Cations and Anion Content During Freeze–Thaw Period
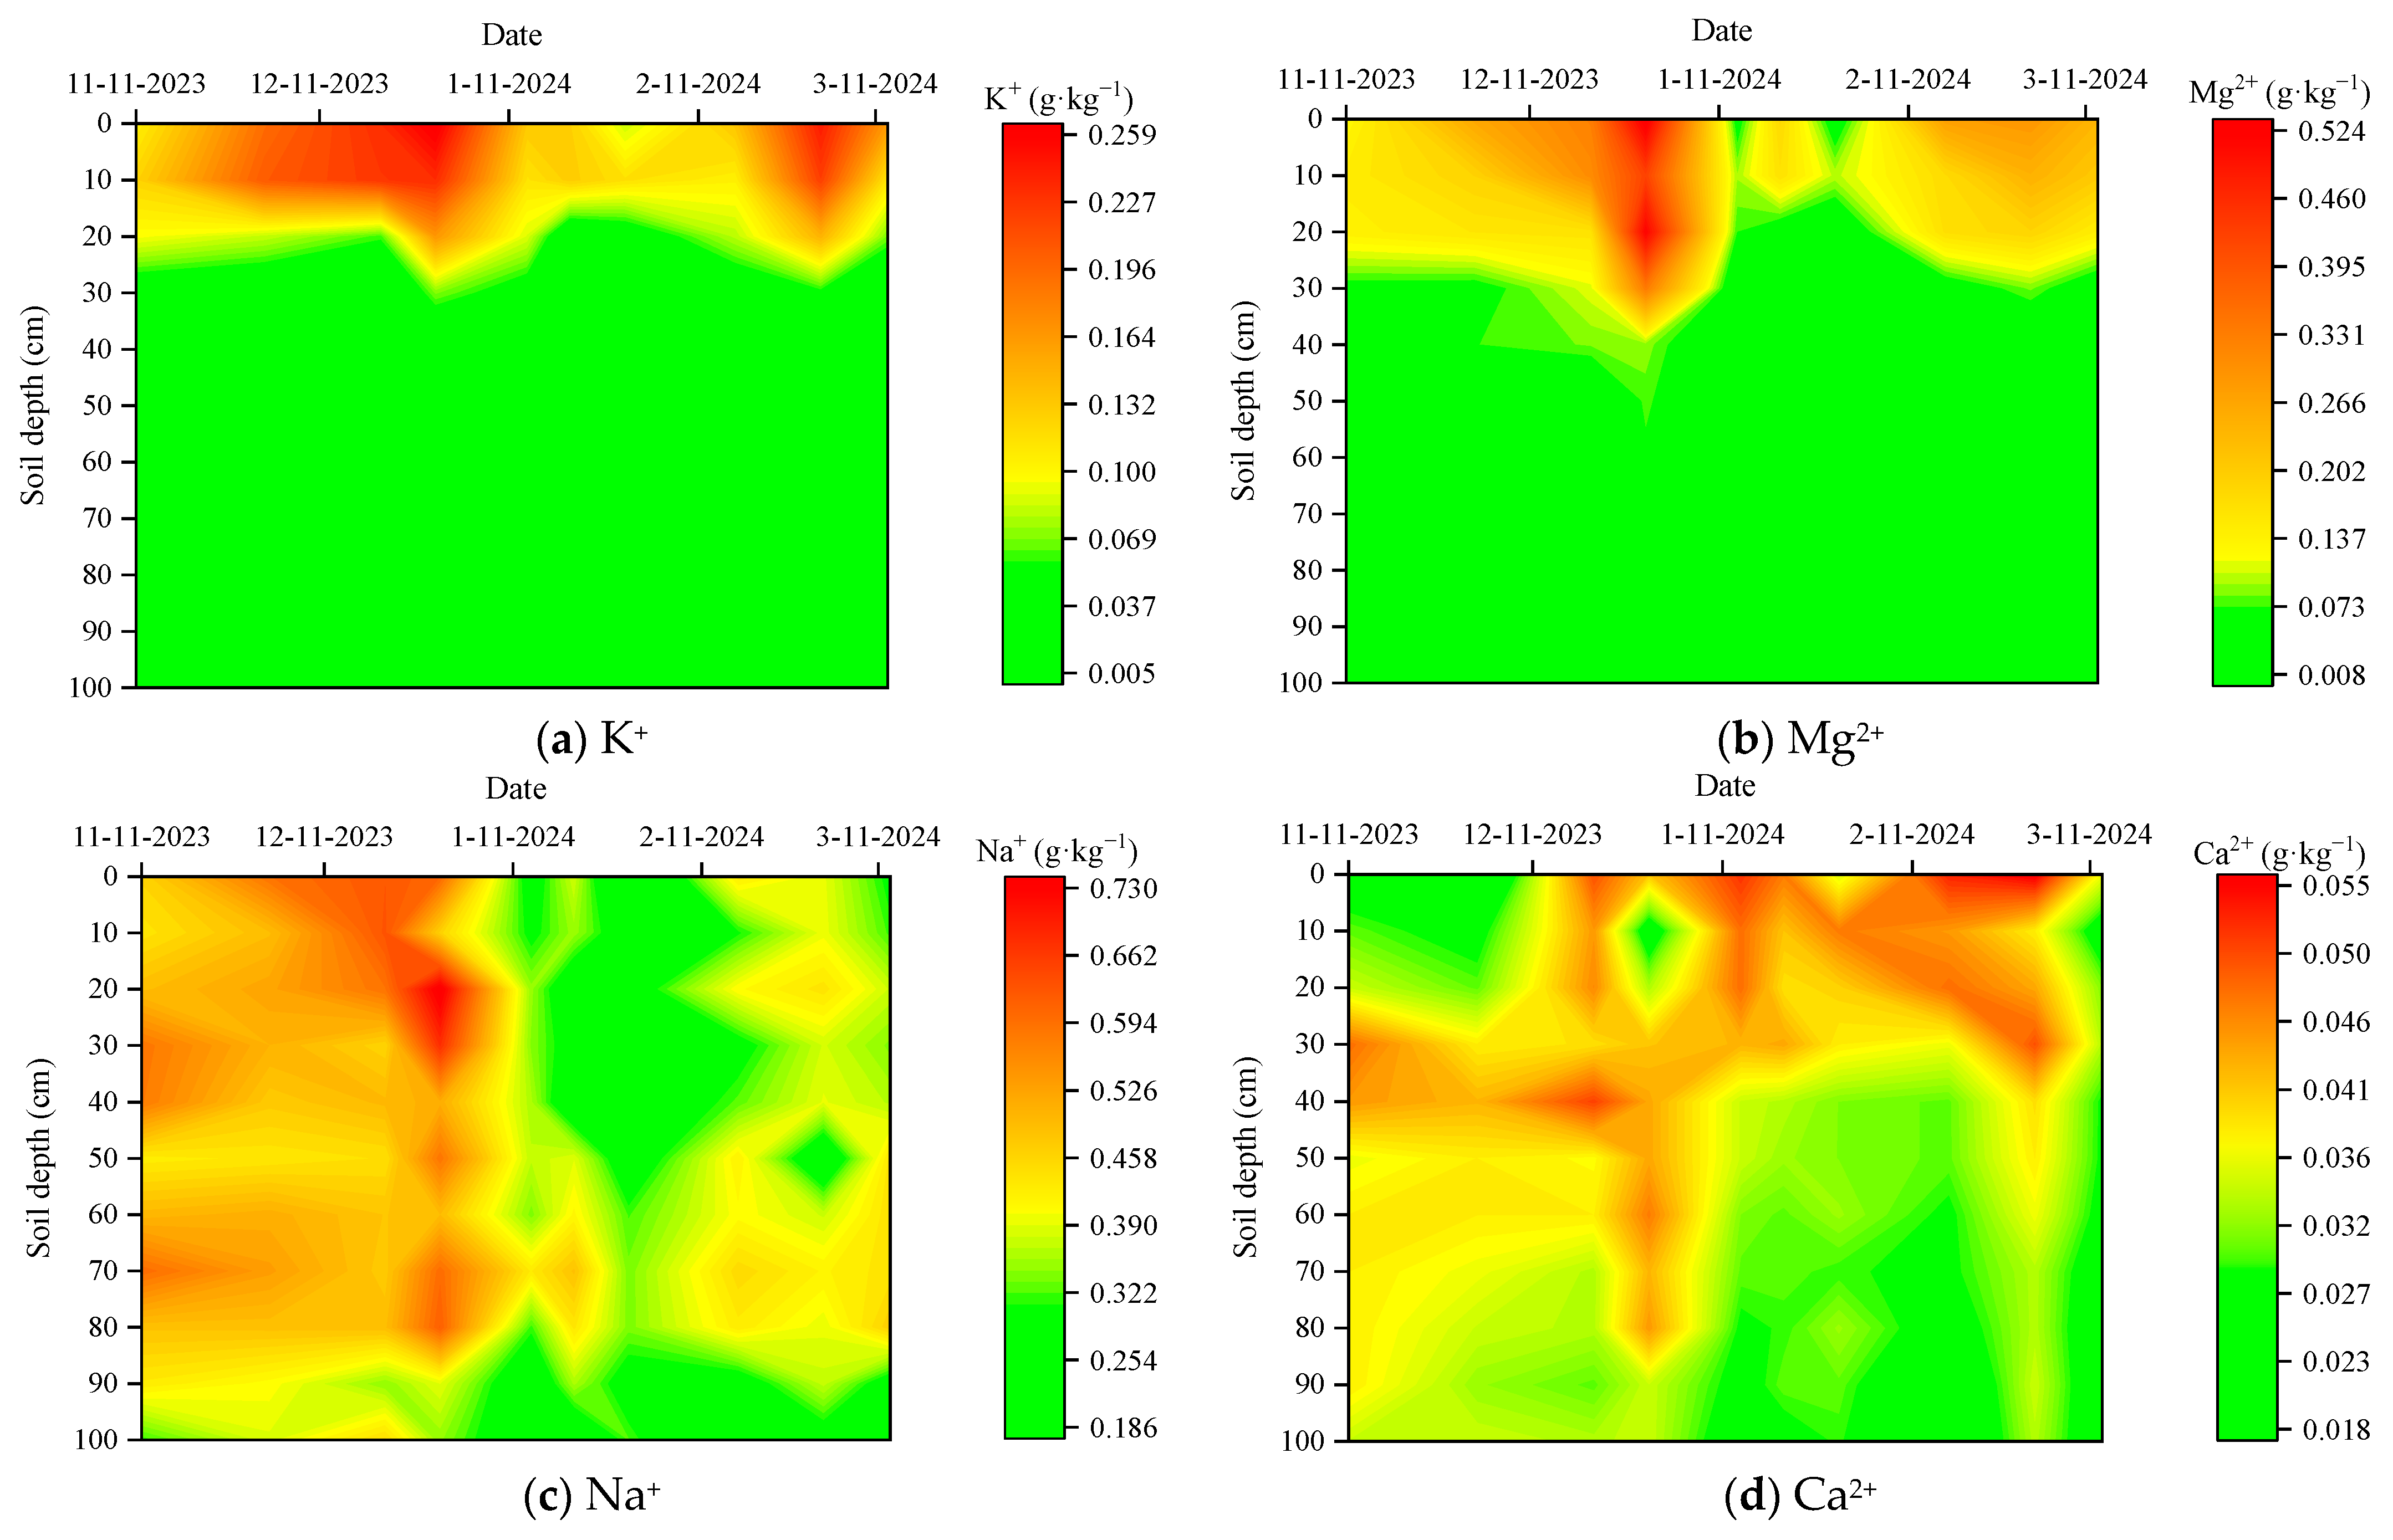
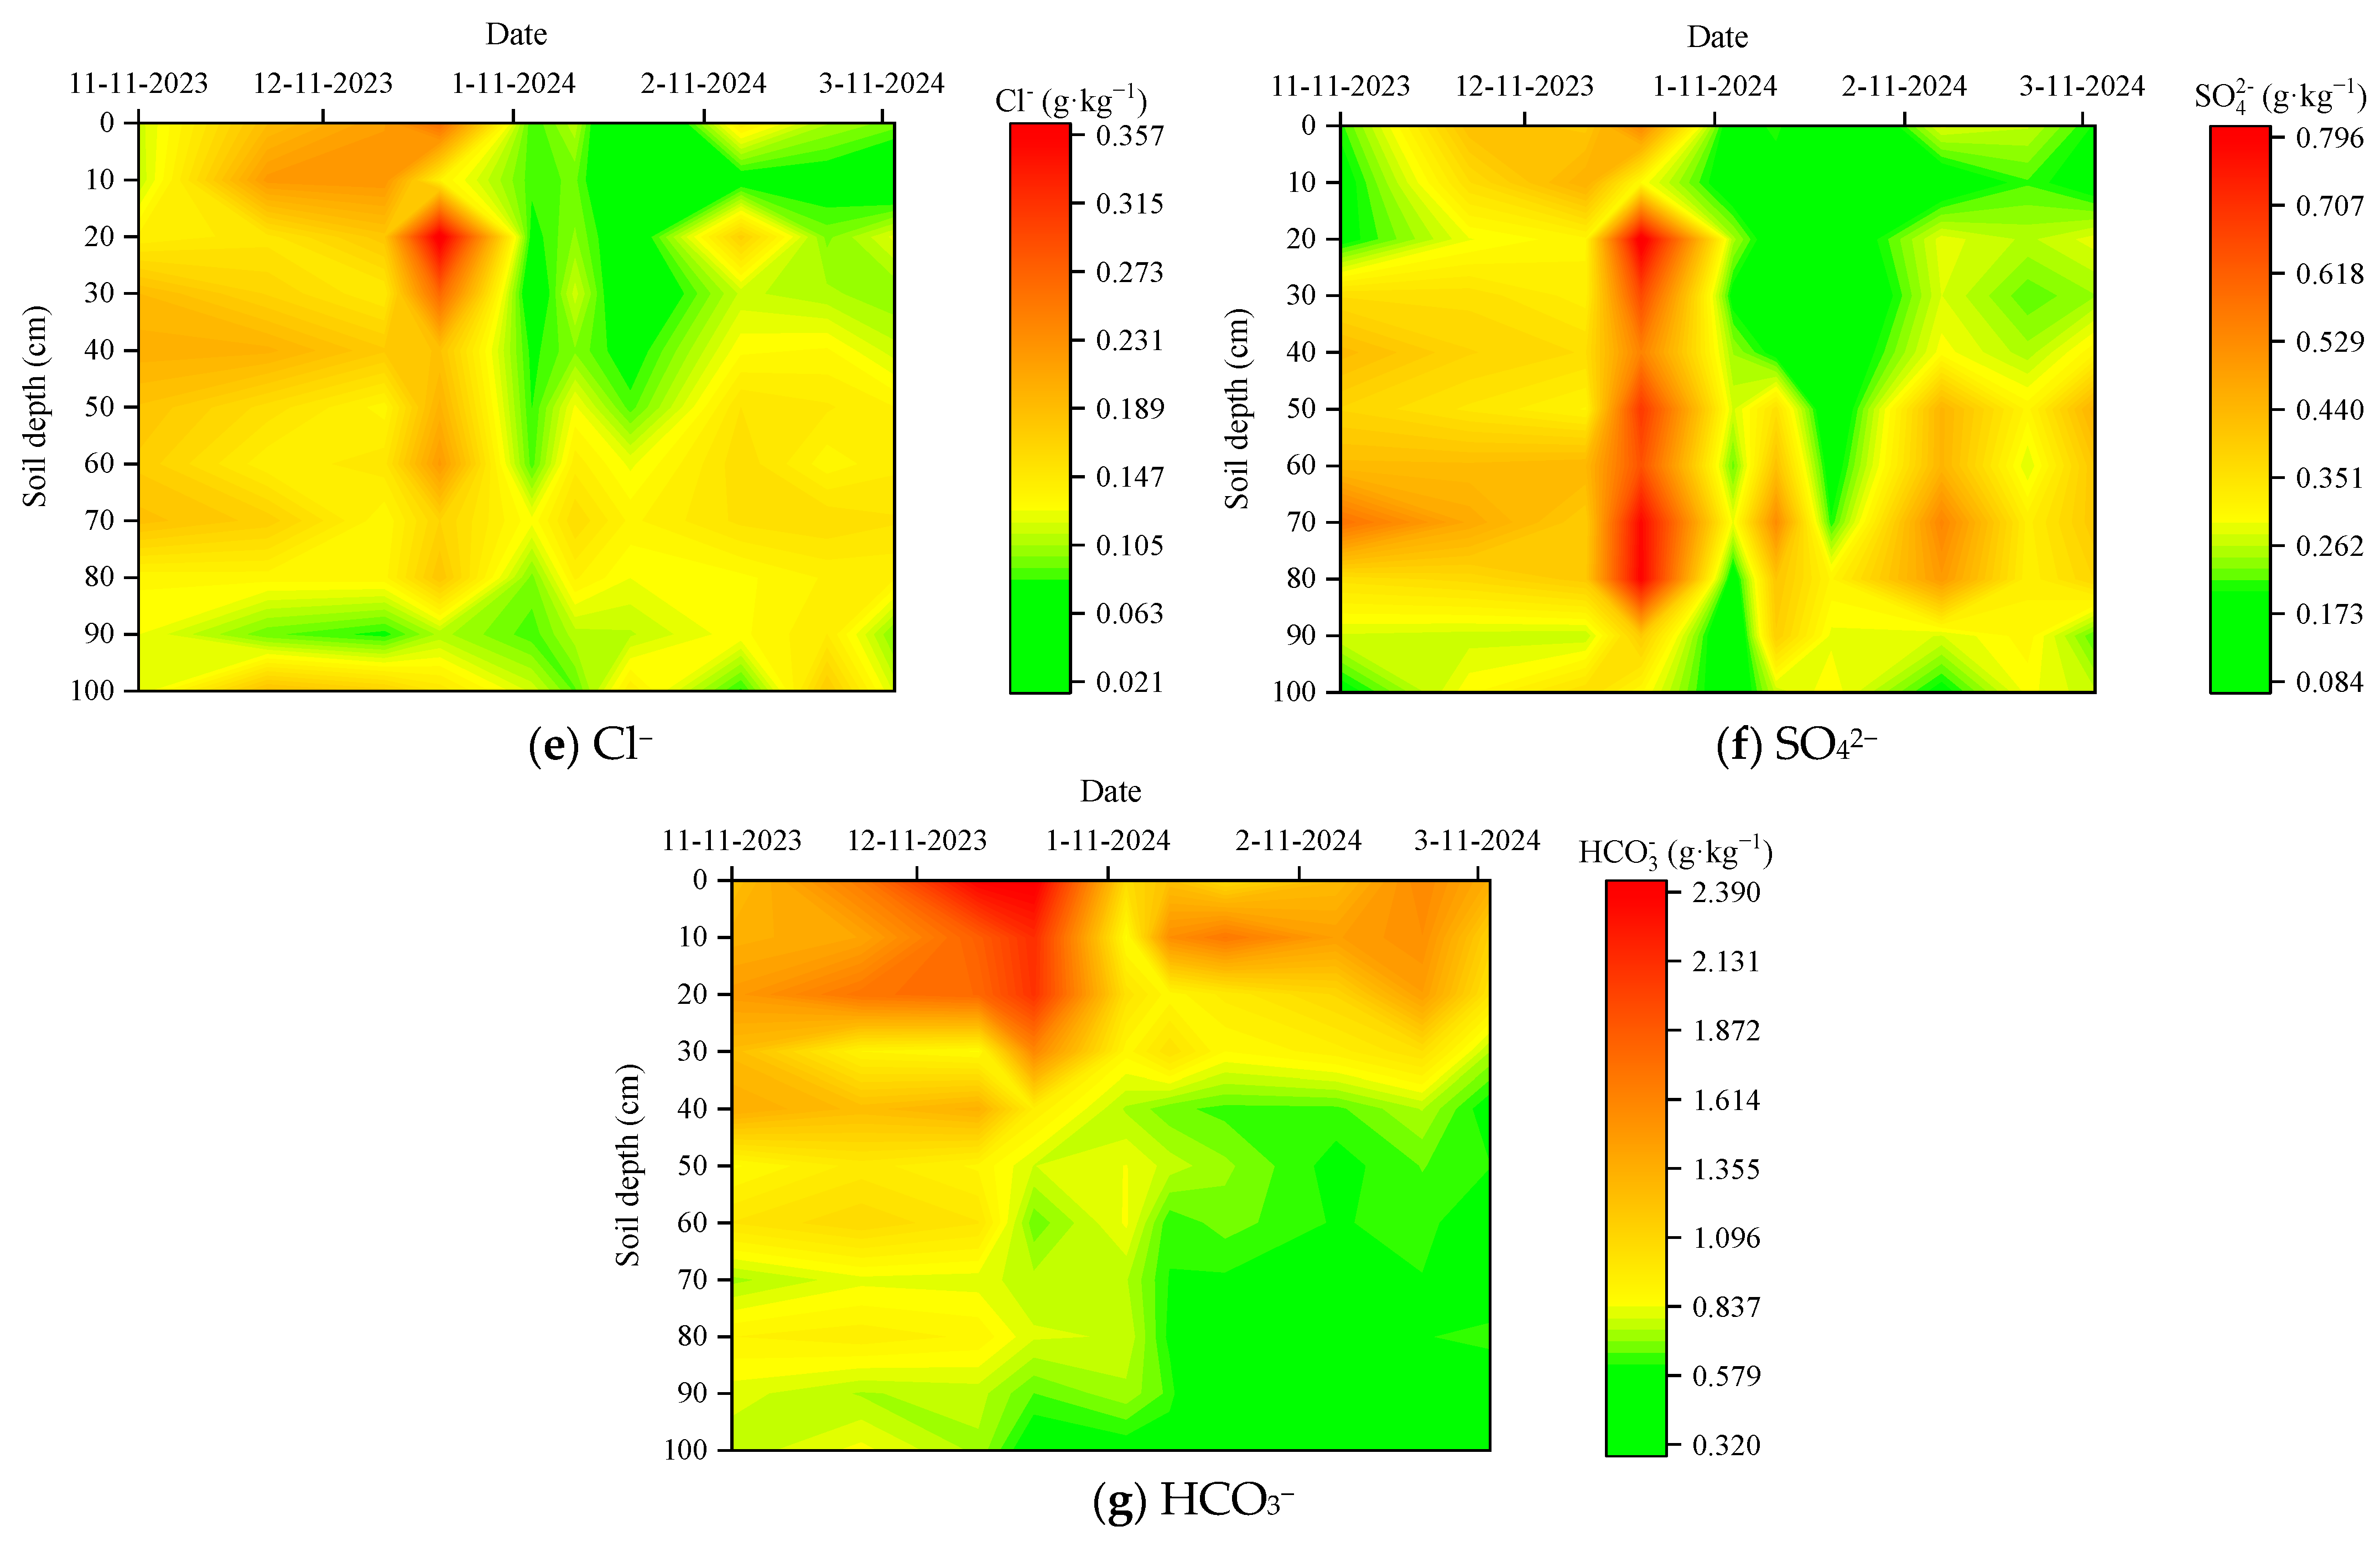
The variations in cations and anions during the freeze–thaw period are shown in Figure 5. Na+, Cl−, and SO42− were widely distributed at the depth of 0–100 cm, with concentrations of 0.19–0.73 g·kg−1, 0.02–0.36 g·kg−1, and 0.09–0.80 g·kg−1, respectively. Mg2+ and K+ were predominantly concentrated at the depth of 0–40 cm (0.02–0.52 g·kg−1 and 0.01–0.26 g·kg−1), which is attributed to the high organic matter content from residual maize roots post-harvest, which enhanced CEC and promoted the surface accumulation of Mg2+ and K+ [43]. Additionally, Mg2+, with its large ionic radius and positive charge, exhibited strong adsorption onto soil colloids in silt-rich layers [44], resulting in Mg2+ concentrations at the depth of 0–40 cm being approximately 7-fold higher than those at the depth of 40–100 cm (Figure 5a,b). HCO3− was primarily distributed at the depth of 0–60 cm (0.56–2.38 g·kg−1), while Ca2+ showed uniform but low concentrations (0.02–0.05 g·kg−1) throughout the entire profile.
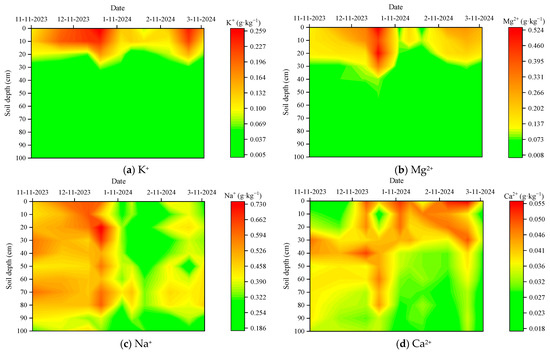

Figure 5.
Variations in major cations and anions during the freeze–thaw period.
During the unstable freezing stage, intense surface evaporation under arid conditions reduced the soil moisture content at the depth of 0–5 cm by 27.62%. Repeated freeze–thaw cycles at the depth of 0–7.5 cm due to temperature fluctuations drove significant cation accumulation: Na+, K+, and Mg2+ at the depth of 0–10 cm increased by 18.72%, 69.92%, and 97.71%, respectively, compared to pre-freezing levels, while Ca2+ decreased by 19.84%. Anions (HCO3−, Cl−, SO42−) migrated upward from deeper layers to 0–10 cm, increasing by 47.17%, 80.03%, and 100.51%, respectively.
On 12 December 2023, the frozen layer began downward development, and major ions continuously migrated toward the freezing front. By 30 December 2023, the depth of the frozen layer had stabilized at 27.5 cm, accompanied by a 15.44% increase in soil moisture content within the 0–30 cm layer. Ion concentrations in the frozen layer increased by 0.03–0.65 g·kg−1. Driven by water migration toward the freezing front, cations such as Na+, K+, and Mg2+ accumulated at the depth of 0–30 cm, increasing by 2.04–39.67%, 13.22–150.31%, and 76.49–464.13%, respectively. However, Ca2+ exhibited no accumulation in the frozen layer, with its average concentration decreasing by 19.82%, due to carbonate precipitation–dissolution equilibria under low-temperature conditions. Anions, including HCO3−, Cl−, and SO42−, also accumulated significantly at the depth of 0–30 cm, with increases of 15.90–69.97%, 36.70–137.02%, and 25.32–174.19%, respectively. This phenomenon arose from pore expansion during freezing and the formation of interconnected channels via ice lens formation. Such pore restructuring substantially enhanced the rates of capillary water rising, accelerating salt enrichment in the frozen layer. The freezing front developed rapidly downward and reached its maximum depth of 37.5 cm on 29 January 2024. Soil moisture at the depth of 0–40 cm decreased by 6.74%, and ion content decreased by 42.45–79.01% at the end of stable freezing stage.
During the thawing stage, rapid temperature increasing induced bidirectional thawing of the frozen layer, with meltwater partitioning into gravitational percolation downward and evaporative flux upward into the atmosphere. This process drove complex ion redistribution in the previously frozen soil, while unfrozen soil exhibited minimal ionic variation. During this stage, the water content increased by 5.90% on average at the depth of 0–40 cm, and the upward migration of water triggered the re-accumulation of soil salt ions within this layer. Cation (Na+, K+, Mg2+) concentrations surged by averages of 92.63%, 152.15%, and 383.24% at the depth of 0–5 cm, and 64.05%, 154.41%, and 254.83% at the depth of 5–40 cm, respectively. Anion (HCO3−, SO42−, Cl−) concentrations exhibited the same accumulation trends, with increases of 39.13%, 149.57%, and 286.18% at the depth of 0–5 cm and 27.05%, 77.35%, and 85.39% at 5–40 cm. However, Ca2+ concentrations displayed negligible variation at 0–40 cm. That is, ions mainly accumulated in the surface layer for the rapid surface warming and exacerbated soil salinization. The soil moisture content of the unfrozen layer (40–100 cm) remained stable, with most ions showing minor fluctuations (average variation: 1.10% to 18.83%). However, Cl− and SO42− displayed significantly higher variability (34.22% and 46.14%, respectively).
In a word, K+, Mg2+, and HCO3− exhibited surface enrichment during the freeze–thaw period, while Na+, Cl− and SO42− accumulated in the frozen layer during the freezing stage. However, there is no surface enrichment of Ca2+.
The coefficient of variation (Cv), defined as the ratio of the standard deviation to the mean, serves as a metric for assessing the relative dispersion of data, was calculated as follows:
where xi represents the i-th sample data, is the average value of the population, and n represents the total number of samples. When Cv < 10%, it indicates weak variability; when 10% ≤ Cv ≤ 100%, it denotes moderate variability; and when Cv > 100%, it signifies strong variability [45].
As detailed in Table 3, all measured cations and anions exhibited moderate variability (Cv: 21.78–98.15%) during the freeze–thaw period. With the exception of Ca2+, other ions displayed higher variability in the frozen layer (Cv: 21.78–98.15%) compared to the unfrozen layer (Cv: 10.90–67.89%). However, Ca2+ exhibited minimal variability (Cv: 11.75–21.38% in the frozen layer; 12.46–17.95% in the unfrozen layer), with no statistically significant differences observed between the frozen and unfrozen layers. Collectively, the Cv values for soil salt ions in the frozen layer were markedly higher than that in the unfrozen layer.
Table 3.
Table of variation coefficients of anions and cations.
3.3. Migration of Soil Salt Ions During Freeze–Thaw Period
3.3.1. Mass Proportion of Soil Ion
Three freeze–thaw stages—T1 (unstable freezing stage), T7 (stable freezing stage), and T10 (thawing stage)—were selected to analyze the migration capabilities of soil salt ions. The mass proportions of soil cations and anions from 0 to 100 cm are shown in Figure 6.
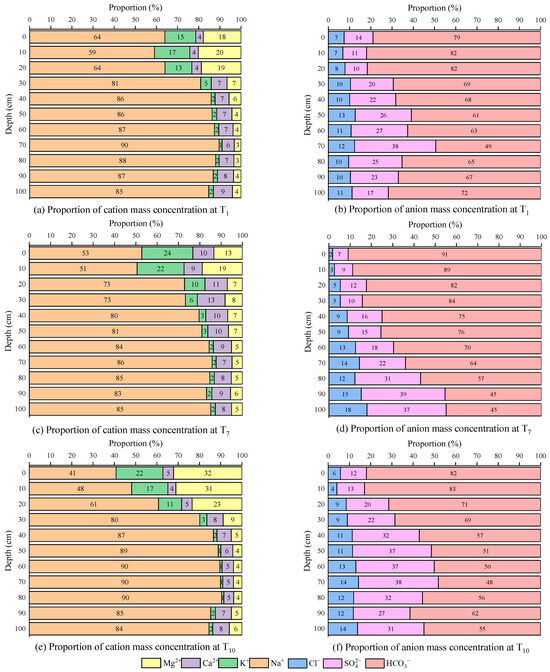
Figure 6.
Mass proportion of soil ion during the freeze–thaw period.
At the unstable freezing stage (T1), the cationic mass proportion at the depth of 0–20 cm followed the order Na+ > Mg2+ > K+ > Ca2+; these values accounted for 59.07–64.06%, 17.81–20.19%, 12.70–16.71%, and 3.56–4.48% of total cation content, respectively, while 20–100 cm followed the order Na+ > Ca2+ > Mg2+ > K+, with proportional ranges of 79.91–89.65%, 5.76–9.03%, 3.18–8.59%, and 1.40–5.00%. However, the proportion of soil anionic content at the depths of 0–100 cm followed the order HCO3− > SO42− > Cl−, these values accounting for 49.40–81.99%, 10.48–38.22%, and 6.87–12.66% of total anion content, respectively.
At the stable freezing stage (T7), when the freezing depth reached its maximum depth of 37.5 cm, the proportions of Na+, Mg2+, Cl−, and SO42− in the frozen layer decreased to 50.58–79.66%, 6.91–18.84%, 1.74–8.61%, and 7.30–16.40%, respectively. Conversely, the proportions of K+, Ca2+, and HCO3− increased to 3.10–23.97%, 8.59–13.00%, and 74.99–90.96%, respectively. In the unfrozen layer, cation proportions remained stable. For anions, HCO3− increased at the depth of 40–70 cm but decreased at the depth of 70–100 cm, while SO42− exhibited the opposite trend, the proportions of Cl− consistently increased.
At the thawing stage (T10), after complete thawing of the frozen layer, the ranking order of mass proportion for cations and anions reverted to the order before freezing. The proportions of Na+, K+, and Ca2+ decreased at the depth of 0–20 cm after soil thawing, while Mg2+ exhibited significant enrichment. For anions, HCO3− decreased while SO42− increased at the depth of 0–80 cm, and Cl− increased at the depth of 0–50 cm.
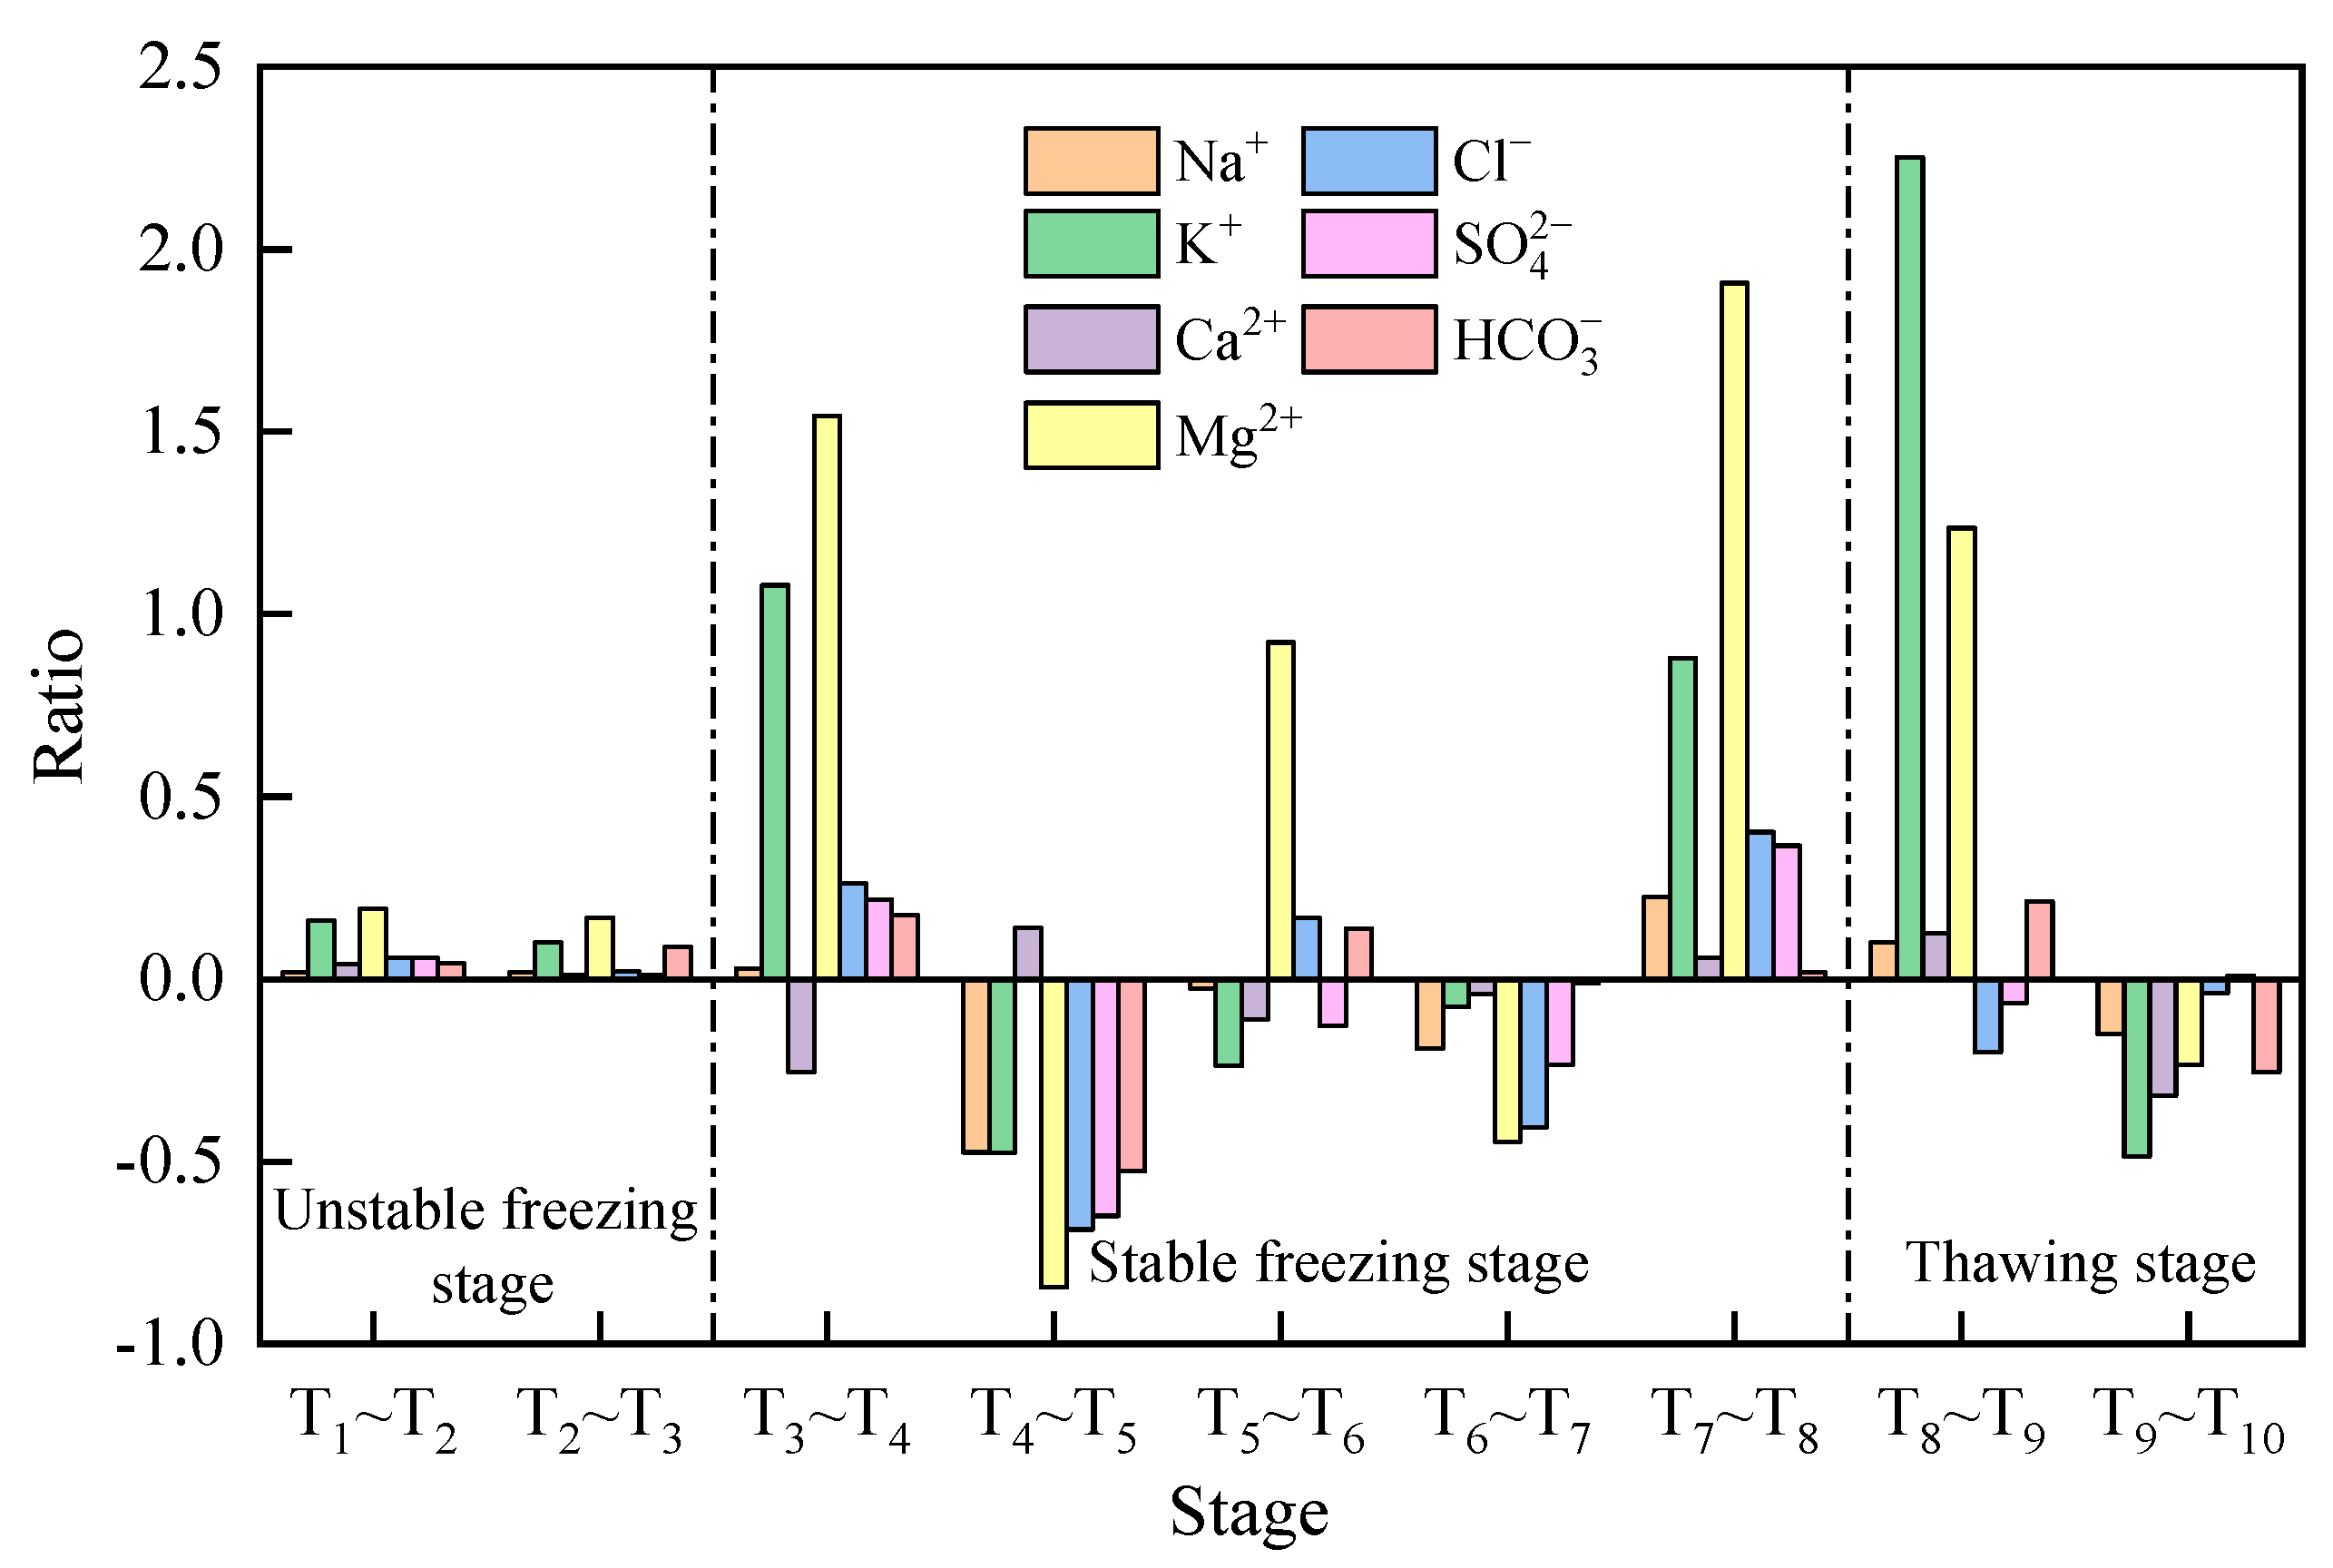
3.3.2. Mass Ratio of Anion and Cation Content Change Between Frozen and Unfrozen Layer
During the freeze–thaw period, anions and cations were redistributed, and the high-migration ions preferentially accumulated in shallow soil layers, while the low-migration ions tended to concentrate in deeper layer [23]. The mass ratio (MR) of anion and cation content change between the frozen and unfrozen layers was used to reflect the ion migration capability. When the ion concentrations were increased in the frozen layer, the MR was the ion increment of two adjacent sampling in the frozen layer divided by the ion storage in the unfrozen layer during the last sampling. When the ion concentrations were decreased in the frozen layer, the MR was the ion reduction divided by the ion storage of the last sampling in the frozen layer.
As shown in Figure 7, the MR is significantly the lowest in the unstable freezing stage and it correlated with migration capability; that is, a greater MR indicates stronger ionic migration capabilities. During the freezing stage, Mg2+ exhibited the strongest migration capability in cations. In the stable freezing stage, Cl− and HCO3− exhibited the strongest and weakest migration capability in anions, respectively. In the thawing stage, the cation with the strongest migration capability at depths of 0–40 cm was K+, with Mg2+ second strongest. And the anion with the strongest migration capability was HCO3−.
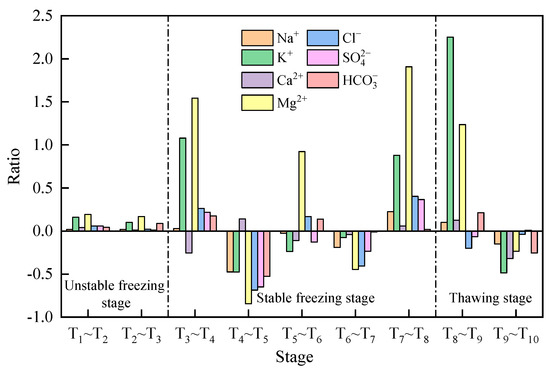
Figure 7.
Mass ratio of cation and anion change between frozen and unfrozen layer during the freeze–thaw period.
As shown in Figure 6, Na+ and HCO3− exhibited the highest proportional contributions among cations and anions, respectively, while the migration capabilities were weakest during the freeze–thaw period. Conversely, K+ and Mg2+, despite their relatively lower abundance, displayed superior migration capabilities. This demonstrates that soil ion migration capability is not governed by total ionic abundance, which are closely associated with physicochemical parameters, and differential selective adsorption and desorption kinetics of ions at solid–liquid–gas interfaces [46].
3.4. Analysis on Soil Salinization Degree During the Freeze–Thaw Period
The interactions and associations among salt ions in soil lead to the formation of alkaline compounds, which critically alter soil properties, induce alkalinization, and ultimately threaten agricultural productivity. Investigating the saline–alkali characteristics of soda saline–alkali soils—particularly their evolutionary patterns during the freeze–thaw period—is essential for elucidating regional hydro-saline transport mechanisms and developing effective remediation strategies.
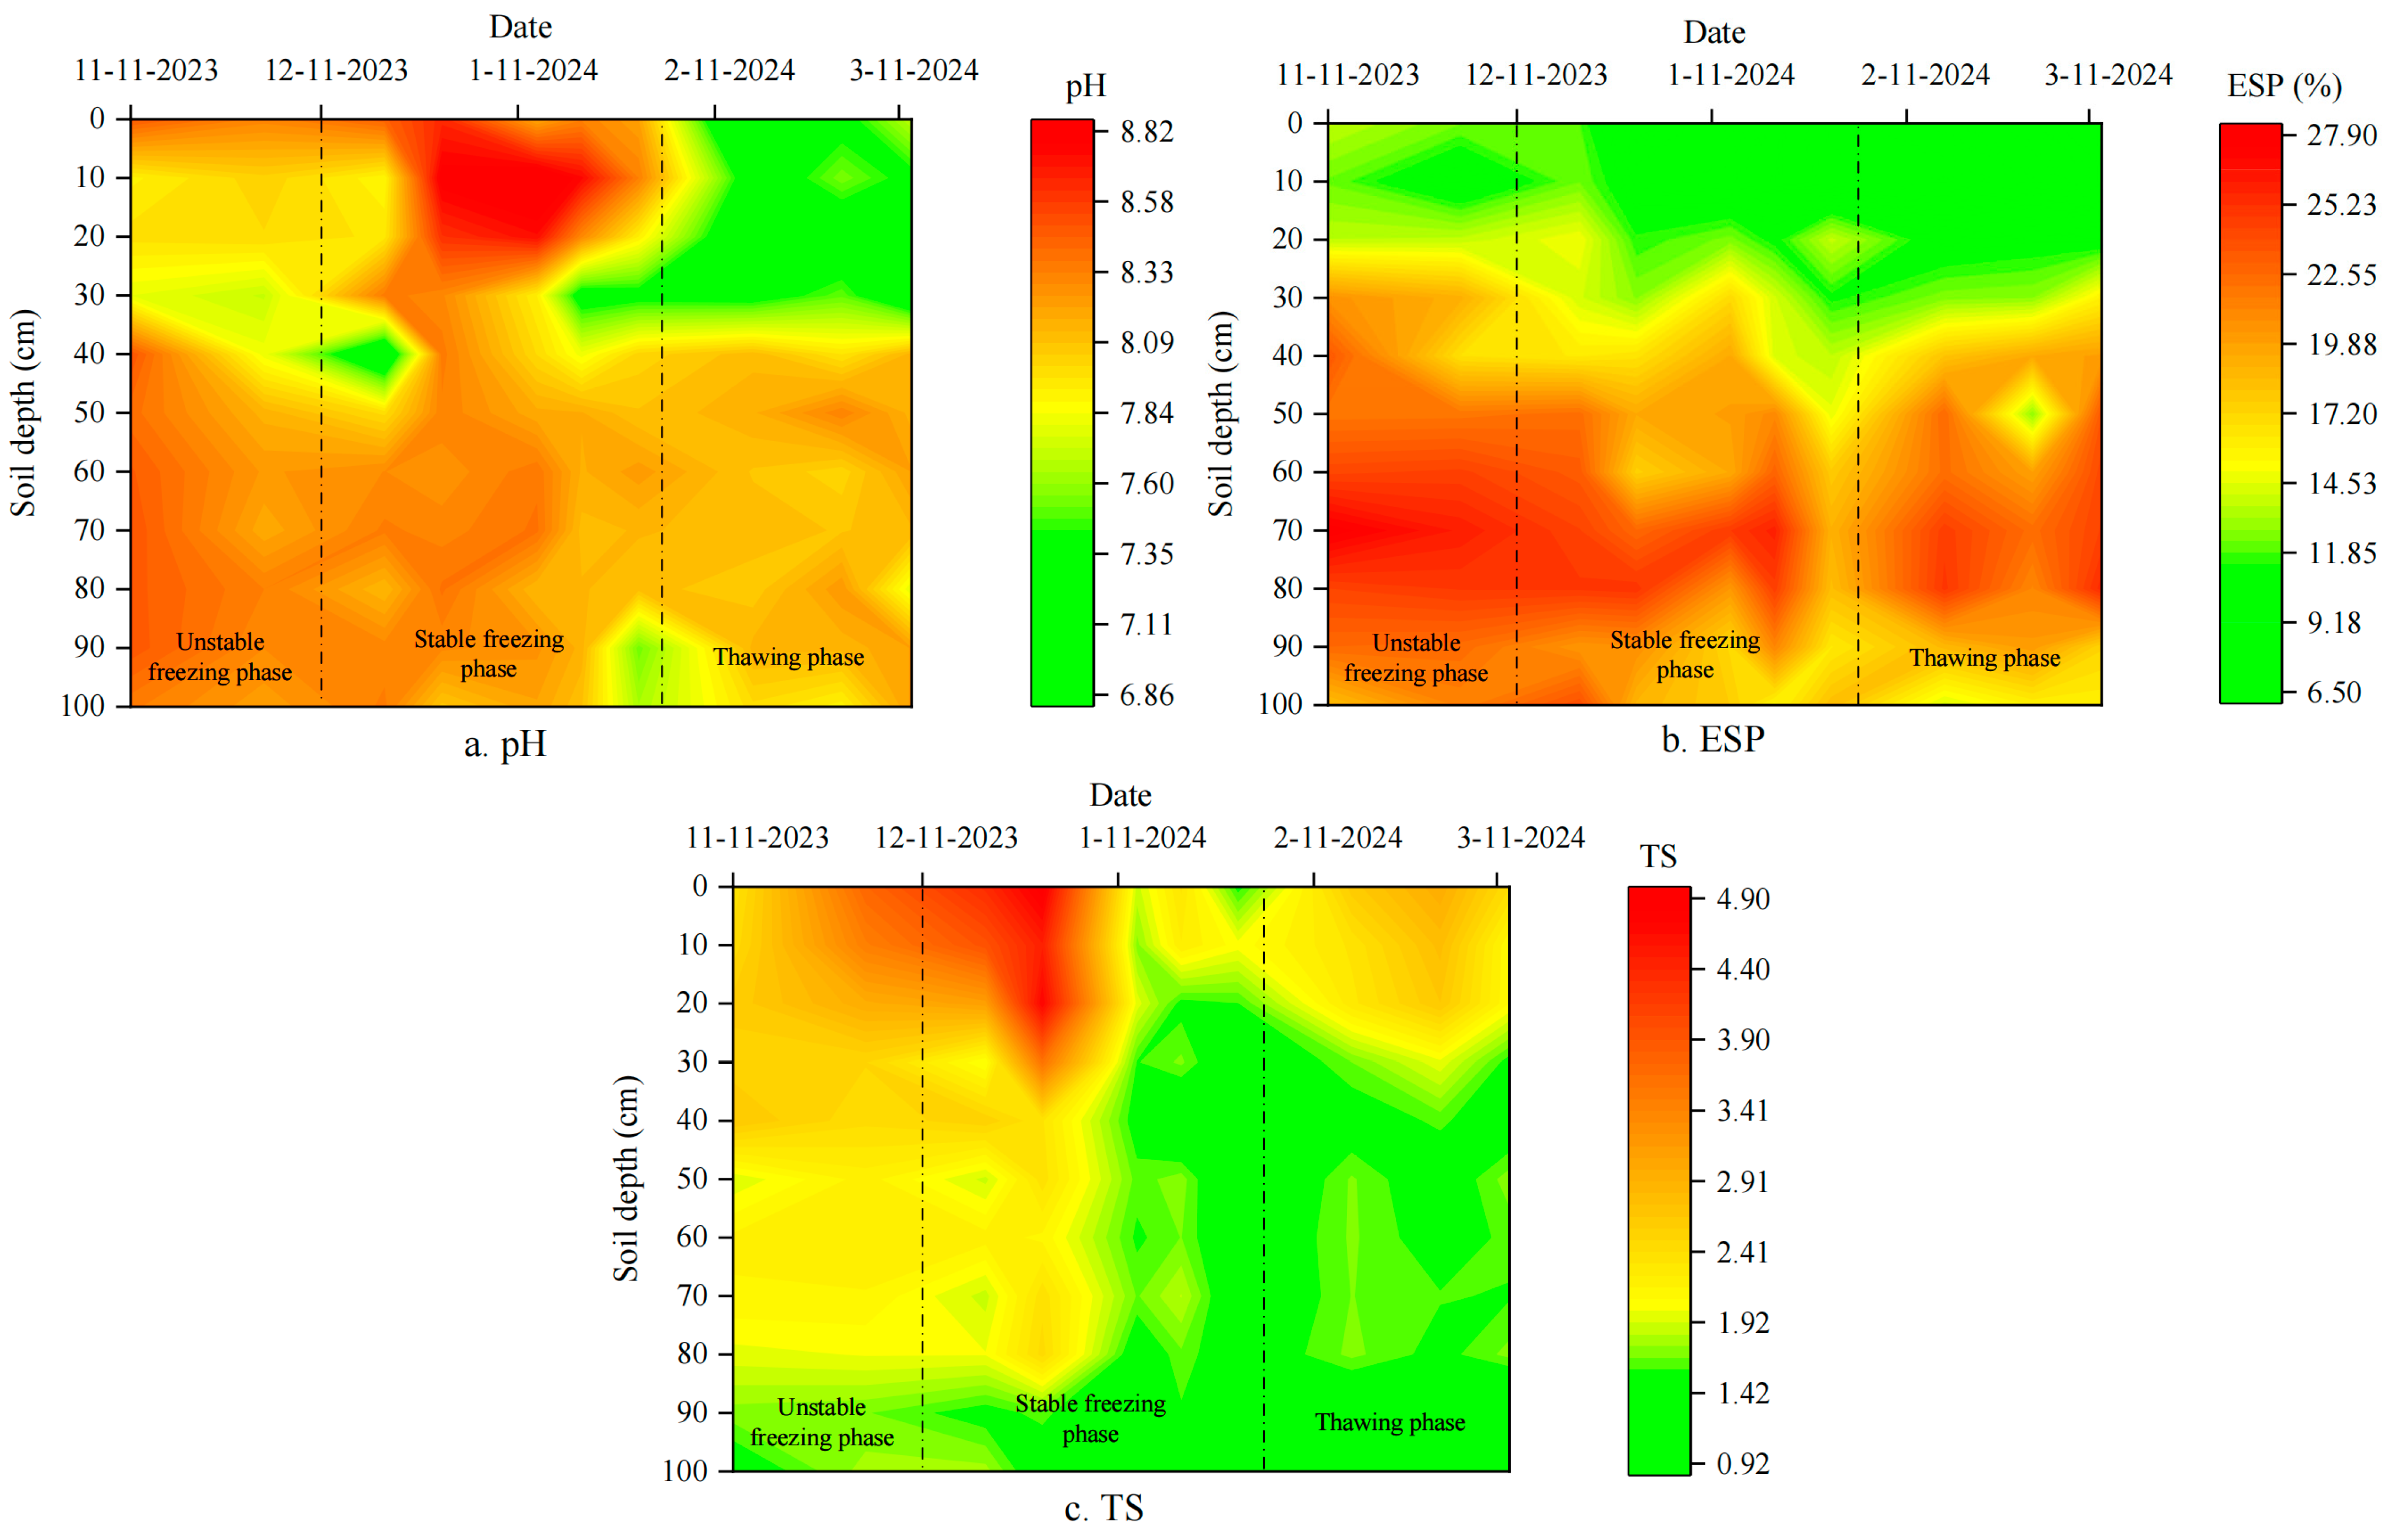
The variations in the soil pH, ESP, and TS at the depth of 0–100 cm during the freeze–thaw period are shown in Figure 8. The value of soil pH increased during the freezing stage and decreased during the thawing stage, ranging from 6.86 to 8.91, indicating a slightly alkaline condition overall. A decline in pH was observed at the depth of 0–40 cm beginning on 7 February 2024, which can be attributed to microbial activation during thawing under increasing temperatures. This temperature-driven microbial activity intensified nitrification processes, subsequently leading to soil acidification [47]. The variation in ESP during the freeze–thaw period exhibited distinct stratification: non-alkaline soils (ESP < 15%) were primarily distributed in the 0–30 cm layer, while alkaline soils (ESP > 15%) dominated the 30–100 cm layer, reaching 15.82–27.81% at the depth of 50–80cm. This phenomenon correlated with markedly low K+ and Mg2+ concentrations. The TS reached its maximum at the depth of 0–30 cm (mean TS: 2.56 g·kg−1, classified as moderate salinization), while the soil layer at the depth of 30–100 cm showed lower salinity levels (mean TS: 1.69 g·kg−1, mild salinization). These results demonstrated that shallow soils exhibit higher salinization but lower alkalinization compared to deeper soils.
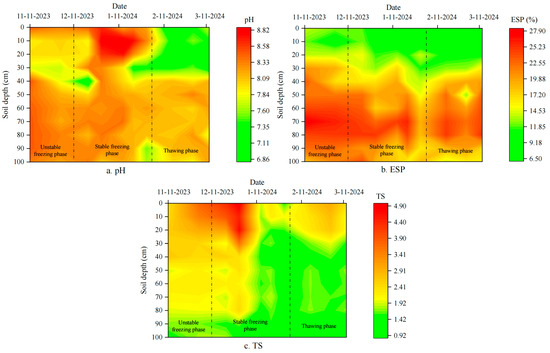
Figure 8.
Variations in soil pH, ESP, and TS during freeze–thaw period.
Notably, variations in the pH and TS suggest heightened saline–alkali risks in the tillage layer (0–30 cm), while the ESP was contrary to this trend. Therefore, an over-reliance on a single threshold index can reflect the single-dimensional characteristics of salinization degree, but it is difficult to comprehensively characterize the multi-factor coupling mechanism of the salinization process. A holistic assessment integrating all parameters is therefore imperative.
The Kaiser–Meyer–Olkin (KMO) and Bartlett’s tests were applied to assess the suitability of 11 indicators characterizing soil salinization degree, such as TS, Cl−, SO42−, HCO3−, Na+, K+, Mg2+, pH, SAR, ESP, and RSC. The value of KMO being 0.706, which was higher than the threshold value of 0.7, and a significance lower than 0.001 confirmed that the dataset was suitable for a factor analysis. A factor analysis combined with PCA was employed to evaluate the degree of salinization during the freeze–thaw period; that is, according to the score coefficient of each index in the common factor, the comprehensive score of each common factor and factor was calculated to evaluate the soil salinization.
The first three factors with eigenvalues exceeding 1 were retained for interpretation of the original indicators, and the component matrix was rotated using the Kaiser-normalized varimax method. The eigenvalues and contribution rates of the rotated common factors are presented in Table 4.
Table 4.
Eigenvalues (PCA).
The cumulative load percentage reached 87.27%, with all individual loads exceeding 0.4, indicating strong associations between the indicators and common factors. This confirms that these factors retain the majority of the information contained within the original 11 indicators. Notably, the standardized path coefficient for salinization was 1.42 times that of the alkalinization parameters, demonstrating that the standalone salinization process (PC2: eigenvalue = 3.434, variance contribution rate = 27.32%) was significantly better than the standalone alkalinization process (PC3: eigenvalue = 2.411, contribution rate = 19.18%) in explaining soil degradation. Due to complex interrelationships among indicators and high cross-factor loads, individual indicators are assigned to multiple common factors. The first common factor, F1, primarily includes seven indicators: TS, HCO3−, K+, Mg2+, SAR, ESP, and RSC. These indicators exhibit absolute factor loads exceeding 0.6, reflecting the dominant saline characteristics of the soil. This indicates that the principal saline compounds driving soil degradation during the freeze–thaw period are bicarbonate-dominated mixtures enriched with potassium or magnesium salts. The second common factor, F2, predominantly captures four indicators, TS, Cl−, SO42−, and Na+, which collectively represent secondary saline characteristics of the soil. Among these, Cl− exhibits the highest factor load (0.968), followed by SO42− (0.902). This indicates that secondary saline compounds contributing to soil salinization are sodium-dominated chloride and sulfate mixtures, building upon the primary saline characteristics identified in Factor F1. The third common factor, F3, primarily encompasses four indicators: pH, SAR, ESP, and RSC. These parameters serve as critical metrics for assessing soil alkalinization, thereby functioning as principal explanatory parameters for characterizing the degree of soil alkalinization. The factor degree coefficients for the common factor expressions F1, F2, and F3 are presented in Table 5.
Table 5.
Degree coefficients of common factors.
Based on the contribution rates of each common factor, the weights in the saline degree were calculated. The comprehensive soil salinization degree F is expressed as follows:
F = 0.467F1 + 0.313F2 + 0.220F3
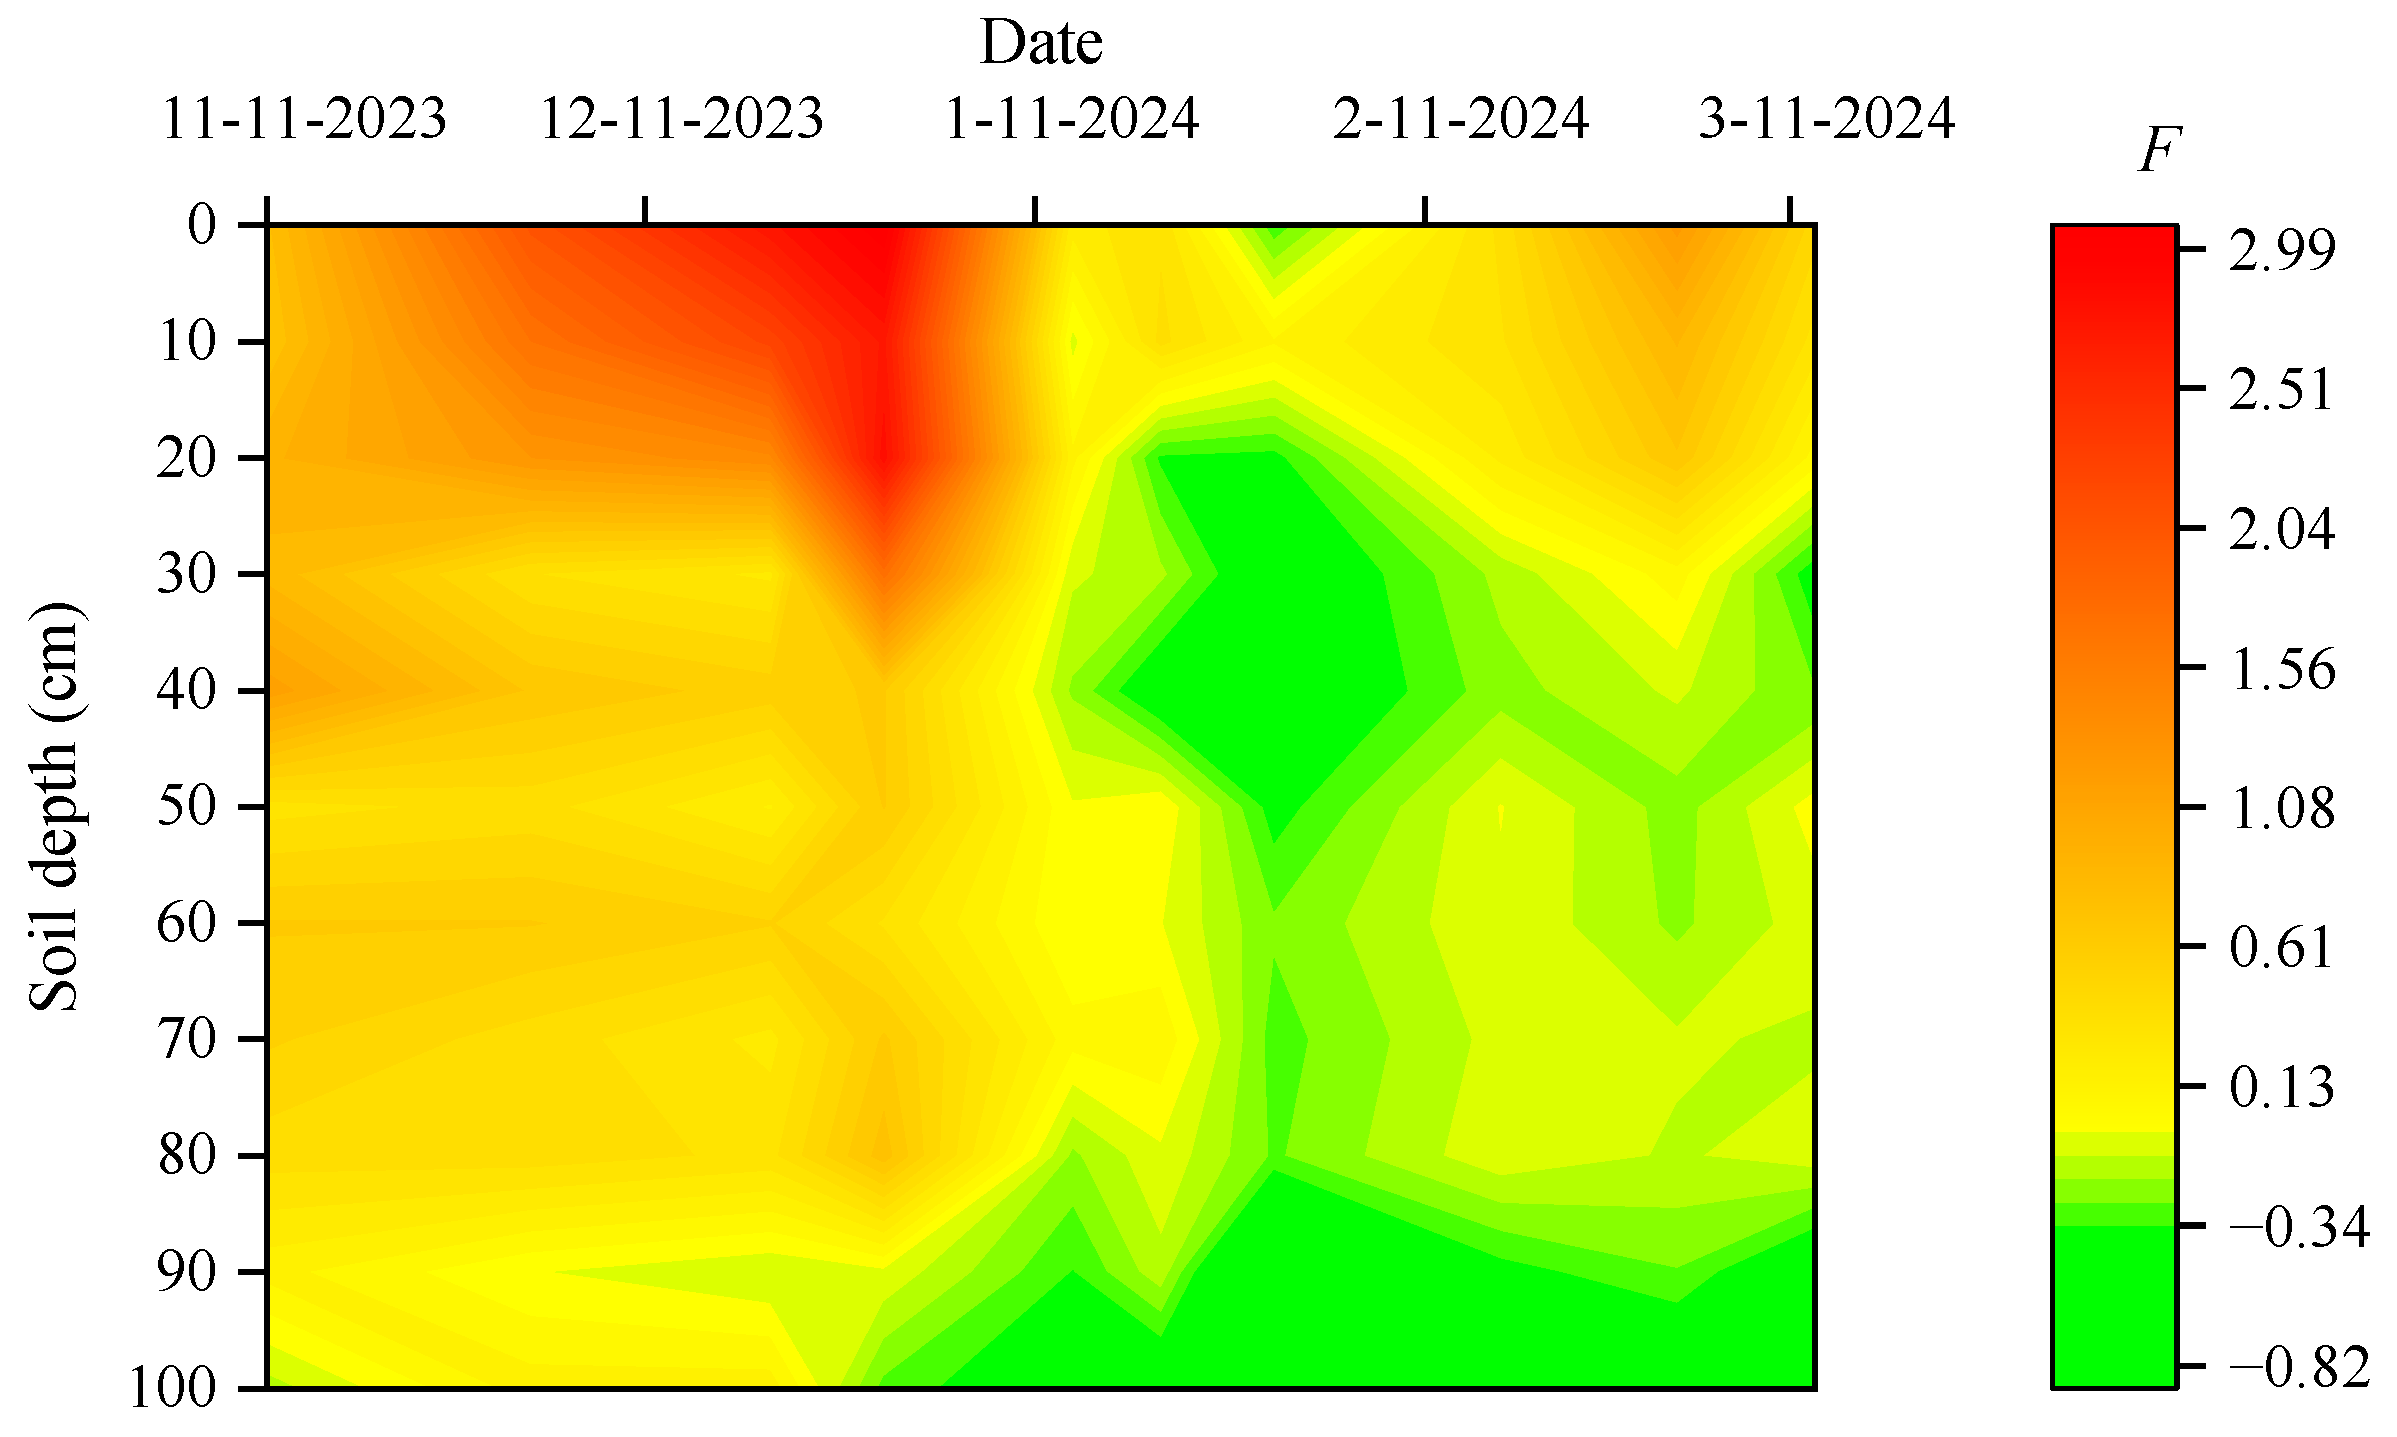
A positive value of F indicates soil salinization degree above the mean observed during the experimental period, while negative values correspond to either below-average salinization or the absence of salinization. The variation in F is shown in Figure 9.
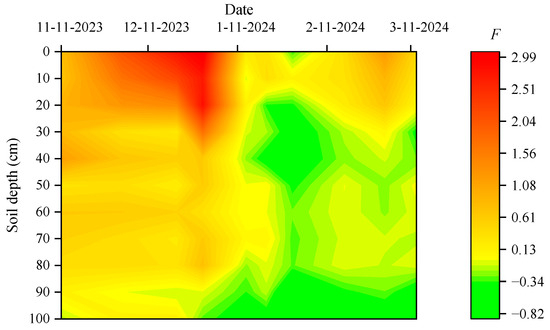
Figure 9.
Contour map of F during the freeze–thaw period.
During the unstable freezing stage, under the action of soil-water gradient, salt ions moved to the surface, and the value of F began to rise gradually. In the stable freezing stage, a pronounced soil-water potential gradient between frozen and unfrozen zones resulted in soil ion accumulation at the depth of 0–30 cm, and the mean value of F surged from 0.79 to 2.49, with an increase of 315%, reflected intensified salinization degree as the developing of freezing front. With the rapid thawing of the frozen layer, the value of F decreases rapidly. During the thawing stage, F varied from 0.21 to 0.71.
During the early freezing phase (11 November–30 December 2023), the average TS at the depth of 0–30 cm was 3.55 g·kg−1, which was higher than that in other periods, while the ESP was relatively low. In contrast, the soil at the depth of 30–100 cm exhibited a lower TS (0.94–2.45 g·kg−1), although the ESP was higher than the value of 0–30 cm. So, the soil salinization degree evaluation is complex, according to a single index, ESP or TS, cannot comprehensively and objectively evaluate the degree of soil salinization. Extracting covariant characteristics among indicators through dimensionality reduction, the F overcomes the partiality of a single index, it provides a more objective quantitative method for salinization degree assessment in freeze–thaw regions. In addition, based on the variation in salinization degree and the eigenvalues/contribution rates of common factors, TS exerted the dominant influence on F, highlighting its pivotal role influencing salinization dynamics.
4. Conclusions
K+, Mg2+, and HCO3− exhibited surface enrichment during the freeze–thaw period, while Na+, Cl− and SO42− accumulated in the frozen layer during the freezing stage. In contrast, there was no surface enrichment of Ca2+. During the freeze–thaw period, Ca2+ at the depth of 0–30 cm showed minimal variation, with CV values ranging from 11.75% to 21.38% in the frozen layer and from 12.46% to 17.95% in the unfrozen layer, while other soil salt ions exhibited significantly higher Cv values (21.78–98.15%) compared to the unfrozen layer (10.90–67.89%).
During the freezing stage, Mg2+ and Cl− exhibited the strongest migration capabilities among cations and anions, respectively. During the thawing stage, K+ and HCO3− were the cation and anion with the highest ionic migration capabilities, respectively. The content of ions in soil showed no synchronism with their migration capabilities.
The comprehensive salinization degree (F) overcomes the partiality of a single index due to extracting covariant characteristics among indicators through dimensionality reduction. In addition, it provides a more objective quantitative method for salinization degree assessment in freeze–thaw regions. TS, Cl−, SO42−, HCO3−, Na+, K+, Mg2+, and RSC were identified as the dominant factors influencing the salinization degree during the freeze–thaw period. At the freezing stage, soil salt ions mainly migrated from the unfrozen layer to the frozen layer. At the thawing stage, soil salt ions migrated upward from the thawing front, and the salinization degree of 0–30 cm showed a rising trend.
Author Contributions
Conceptualization, C.H.; methodology, C.H.; formal analysis, C.H. and Q.M.; investigation, R.Y.; resources, J.C.; data curation, L.C.; writing—original draft preparation, C.H.; writing—review and editing, J.C. and Q.M.; supervision, J.X. and H.L. All authors have read and agreed to the published version of the manuscript.
Funding
This research was funded by the National Natural Youth Science Foundation of China (Grant No. 41502243); the Natural Science Foundation of Shanxi Province, China (Grant No. 202203021221048); the Natural Science Youth Foundation of Shanxi Province, China (Grant No. 202203021212195); and the Water Conservancy Technology Research and Promotion Grant Project of Shanxi Province, China (Grant No. 2024GM14).
Data Availability Statement
The data that support the findings of this study are available upon reasonable request from the corresponding author.
Acknowledgments
The authors are grateful for the assistance with the research from the Scientific Research Service Center field station of Shanxi Fenhe River Irrigation Management Co., Ltd.
Conflicts of Interest
Author Hongwu Liu was employed by the company Shanxi Fenhe River Irrigation Management Co., Ltd. The remaining authors declare that the research was conducted in the absence of any commercial or financial relationships that could be construed as a potential conflict of interest.
References
- Ran, Y.; Li, X.; Cheng, G.; Zhang, T.; Wu, Q.; Jin, H.; Jin, R. Distribution of permafrost in China: An overview of existing permafrost maps. Permafr. Periglac. Process. 2012, 23, 322–333. [Google Scholar] [CrossRef]
- Bing, H.; Ma, W. Laboratory investigation of the freezing point of saline soil. Cold Reg. Sci. Technol. 2011, 67, 79–88. [Google Scholar] [CrossRef]
- Wu, T.; Li, H.; Lyu, H. Effect of freeze-thaw process on heat transfer and water migration between soil water and groundwater. J. Hydrol. 2023, 617, 128987. [Google Scholar] [CrossRef]
- Zhang, D.; Wang, S. Mechanism of freeze–thaw action in the process of soil salinization in northeast China. Environ. Geol. 2001, 41, 96–100. [Google Scholar] [CrossRef]
- Chen, L.; Li, C.; Feng, Q.; Wei, Y.; Zhao, Y.; Zhu, M.; Deo, R.C. Direct and indirect impacts of ionic components of saline water on irrigated soil chemical and microbial processes. Catena 2019, 172, 581–589. [Google Scholar] [CrossRef]
- Zhang, Z.; Feng, S.; Luo, J.; Hao, B.; Diao, F.; Li, X.; Jia, B.; Wang, L.; Bao, Z.; Guo, W. Evaluation of microbial assemblages in various saline-alkaline soils driven by soluble salt ion components. J. Agric. Food Chem. 2021, 69, 3390–3400. [Google Scholar] [CrossRef]
- Hou, R.J.; Li, T.X.; Fu, Q.; Liu, D.; Li, M.; Zhou, Z.Q.; Yan, J.W.; Zhang, S. Research on the distribution of soil water, heat, salt and their response mechanisms under freezing conditions. Soil Tillage Res. 2020, 196, 104486. [Google Scholar] [CrossRef]
- Zhao, T.H.; Chen, G.J.; Sun, Q. Effect of sand covering thickness on different tillage state soil water and salt transport law under brackish water irrigation. Appl. Ecol. Environ. Res. 2023, 21, 3319–3333. [Google Scholar] [CrossRef]
- Wang, X.; Li, C.; Shi, Y.; Zhang, Z.; Chi, Q.; Wang, P. Improvements in saline soil and the law of water-salt transport based on salt inhibition using MICP technology. Biogeotechnics 2024, 2, 100055. [Google Scholar] [CrossRef]
- Jiang, D.; Ao, C.; Bailey, R.T.; Zeng, W.; Huang, J. Simulation of water and salt transport in the Kaidu River Irrigation District using the modified SWAT-Salt. Agric. Water Manag. 2022, 272, 107845. [Google Scholar] [CrossRef]
- Zhang, X.; Shu, C.; Fujii, M.; Wu, Y.; Sun, D.A.; Ye, P.; Bao, Y. Numerical and experimental study on water-heat-salt transport patterns in shallow bare soil with varying salt contents under evaporative conditions: A comparative investigation. J. Hydrol. 2023, 621, 129564. [Google Scholar] [CrossRef]
- Bing, H.; He, P.; Zhang, Y. Cyclic freeze-thaw as a mechanism for water and salt migration in soil. Environ. Earth Sci. 2015, 74, 675–681. [Google Scholar] [CrossRef]
- Wan, X.; Gong, F.; Qu, M.; Qiu, E.; Zhong, C. Experimental study of the salt transfer in a cold sodium sulfate soil. KSCE J. Civ. Eng. 2019, 23, 1573–1585. [Google Scholar] [CrossRef]
- Lu, N. Generalized soil water retention equation for adsorption and capillarity. J. Geotech. Geoenviron. Eng. 2016, 142, 04016051. [Google Scholar] [CrossRef]
- Hosseini, P.; Bailey, R.T. Investigating the controlling factors on salinity in soil, groundwater, and river water in a semi-arid agricultural watershed using SWAT-Salt. Sci. Total Environ. 2022, 810, 152293. [Google Scholar] [CrossRef]
- Qin, Y.; Bai, Y.; Chen, G.; Liang, Y.; Li, X.; Wen, B.; Lu, X.; Li, X. The effects of soil freeze–thaw processes on water and salt migrations in the western Songnen Plain, China. Sci. Rep. 2021, 11, 3888. [Google Scholar] [CrossRef]
- Li, X.; Chang, S.X.; Salifu, K.F. Soil texture and layering effects on water and salt dynamics in the presence of a water table: A review. Environ. Rev. 2014, 22, 41–50. [Google Scholar] [CrossRef]
- Rudzianskaite, A.; Sukys, P. Effects of groundwater level fluctuation on its chemical composition in karst soils of Lithuania. Environ. Geol. 2008, 56, 289–297. [Google Scholar] [CrossRef]
- Nordio, G.; Fagherazzi, S. Salinity increases with water table elevation at the boundary between salt marsh and forest. J. Hydrol. 2022, 608, 127576. [Google Scholar] [CrossRef]
- Lyu, H.; Wu, T.; Su, X.; Wang, Y.; Wang, C.; Yuan, Z. Factors controlling the rise and fall of groundwater level during the freezing-thawing period in seasonal frozen regions. J. Hydrol. 2022, 606, 127442. [Google Scholar] [CrossRef]
- Cui, L.; Zhu, Y.; Zhao, T.; Ye, M.; Yang, J.; Wu, J. Evaluation of upward flow of groundwater to freezing soils and rational per-freezing water table depth in agricultural areas. J. Hydrol. 2020, 585, 124825. [Google Scholar] [CrossRef]
- Seeboonruang, U. Relationship between groundwater properties and soil salinity at the Lower Nam Kam River Basin in Thailand. Environ. Earth Sci. 2013, 69, 1803–1812. [Google Scholar] [CrossRef]
- Wan, H.; Bian, J.; Zhang, H.; Li, Y. Assessment of future climate change impacts on water-heat-salt migration in unsaturated frozen soil using CoupModel. Front. Environ. Sci. Eng. 2021, 15, 10. [Google Scholar] [CrossRef]
- Wang, M.; Zhu, Y.; Zhao, T.; Cui, L.; Mao, W.; Ye, M.; Wu, J.; Yang, J. Chemical characteristics of salt migration in frozen soils during the freezing-thawing period. J. Hydrol. 2022, 606, 127403. [Google Scholar] [CrossRef]
- Xue, J.; Huo, Z.; Wang, F.; Kang, S.; Huang, G. Untangling the effects of shallow groundwater and deficit irrigation on irrigation water productivity in arid region: New conceptual model. Sci. Total Environ. 2018, 619, 1170–1182. [Google Scholar] [CrossRef] [PubMed]
- Chhabra, R.; Chhabra, R. Nature and origin of salts, classification, area and distribution of salt-affected soils. In Salt-Affected Soils and Marginal Waters: Global Perspectives and Sustainable Management; Springer: Cham, Switzerland, 2021; pp. 1–47. [Google Scholar]
- Liu, Y.; Wu, J.; Zhao, H.; Li, C.; Mao, J.; Zhang, R.; Liu, J.; Zhao, Q. Ions transport in seasonal frozen farmland soil and its effect on soil salinization chemical properties. Agronomy 2023, 13, 660. [Google Scholar] [CrossRef]
- Guo, K.; Liu, X. Reclamation effect of freezing saline water irrigation on heavy saline-alkali soil in the Hetao Irrigation District of North China. Catena 2021, 204, 105420. [Google Scholar] [CrossRef]
- Shahid, S.A.; Zaman, M.; Heng, L. Introduction to soil salinity, sodicity and diagnostics techniques. In Guideline for Salinity Assessment, Mitigation and Adaptation Using Nuclear and Related Techniques; Springer: Cham, Switzerland, 2018; pp. 1–42. [Google Scholar]
- Wu, J.; Li, P.; Qian, H.; Fang, Y. Assessment of soil salinization based on a low-cost method and its influencing factors in a semi-arid agricultural area, northwest China. Environ. Earth Sci. 2014, 71, 3465–3475. [Google Scholar] [CrossRef]
- Korolyuk, T.V. Specific features of the dynamics of salts in salt-affected soils subjected to long-term seasonal freezing in the south Transbaikal region. Eurasian Soil Sci. 2014, 47, 339–352. [Google Scholar] [CrossRef]
- Yang, F.; An, F.; Ma, H.; Wang, Z.; Zhou, X.; Liu, Z. Variations on soil salinity and sodicity and its driving factors analysis under microtopography in different hydrological conditions. Water 2016, 8, 227. [Google Scholar] [CrossRef]
- Saysel, A.K.; Barlas, Y. A dynamic model of salinization on irrigated lands. Ecol. Model. 2001, 139, 177–199. [Google Scholar] [CrossRef]
- Hassani, A.; Azapagic, A.; Shokri, N. Predicting long-term dynamics of soil salinity and sodicity on a global scale. Proc. Natl. Acad. Sci. USA 2020, 117, 33017–33027. [Google Scholar] [CrossRef]
- Hassani, A.; Azapagic, A.; Shokri, N. Global predictions of primary soil salinization under changing climate in the 21st century. Nat. Commun. 2021, 12, 6663. [Google Scholar] [CrossRef]
- Ding, J.; Wu, M.; Tiyip, T. Study on soil salinization information in arid region using remote sensing technique. Agric. Sci. China 2011, 10, 404–411. [Google Scholar] [CrossRef]
- Sahbeni, G. A PLSR model to predict soil salinity using Sentinel-2 MSI data. Open Geosci. 2021, 13, 977–987. [Google Scholar] [CrossRef]
- Sahbeni, G.; Ngabire, M.; Musyimi, P.K.; Székely, B. Challenges and opportunities in remote sensing for soil salinization mapping and monitoring: A review. Remote Sens. 2023, 15, 2540. [Google Scholar] [CrossRef]
- Sentis, I. Soil salinization and land desertification. In Soil Degradation and Desertification in Mediterranean Environments; Geoforma Ediciones: Logroño, Spain, 1996; pp. 105–129. [Google Scholar]
- Abdi, H.; Williams, L.J. Principal component analysis. Wiley Interdiscip. Rev. Comput. Stat. 2010, 2, 433–459. [Google Scholar] [CrossRef]
- Singh, A. Soil salinization management for sustainable development: A review. J. Environ. Manag. 2021, 277, 111383. [Google Scholar] [CrossRef]
- Gazia, E.A.E.; Gendy, A.A.S.; El-Leithi, A.A.; Ramadan, S.A. The relationship between ESP and SAR at salt affected soils in the North Nile delta. J. Soil Sci. Agric. Eng. 2008, 33, 7713–7718. [Google Scholar] [CrossRef]
- Xie, K.; Cakmak, I.; Wang, S.; Zhang, F.; Guo, S. Synergistic and antagonistic interactions between potassium and magnesium in higher plants. Crop J. 2021, 9, 249–256. [Google Scholar] [CrossRef]
- Swift, R.S.; McLaren, R.G. Micronutrient adsorption by soils and soil colloids. In Interactions at the Soil Colloid—Soil Solution Interface; Springer: Dordrecht, The Netherlands, 1991; pp. 257–292. [Google Scholar]
- Abdi, H. Coefficient of variation. Encycl. Res. Des. 2010, 1, 169–171. [Google Scholar]
- Liu, G.; Wang, J.; Xue, W.; Zhao, J.; Wang, J.; Liu, X. Effect of the size of variable charge soil particles on cadmium accumulation and adsorption. J. Soils Sediments 2017, 17, 2810–2821. [Google Scholar] [CrossRef]
- Song, Y.; Zou, Y.; Wang, G.; Yu, X. Altered soil carbon and nitrogen cycles due to the freeze-thaw effect: A meta-analysis. Soil Biol. Biochem. 2017, 109, 35–49. [Google Scholar] [CrossRef]

Disclaimer/Publisher’s Note: The statements, opinions and data contained in all publications are solely those of the individual author(s) and contributor(s) and not of MDPI and/or the editor(s). MDPI and/or the editor(s) disclaim responsibility for any injury to people or property resulting from any ideas, methods, instructions or products referred to in the content. |
© 2025 by the authors. Licensee MDPI, Basel, Switzerland. This article is an open access article distributed under the terms and conditions of the Creative Commons Attribution (CC BY) license (https://creativecommons.org/licenses/by/4.0/).