Abstract
Conventional reports on wildfire damage focus on damage to built structures and life loss without capturing the long-term loss of many environmental benefits provided by natural capital. The assessment of the full cost of a wildfire event can be very challenging and time-consuming due to its broad range of impacts traversing decades. Two major wildfires, the 2021 Caldor Fire and 2022 Mosquito Fire, impacted rural communities and burned nearly 30 percent of the approximately 1 million acres of forests and private timber lands in the Upper American River Watershed (UARW) in California’s Sierra Nevada headwaters. The UARW provides a stock of natural capital that provides a flow of environmental benefits, or ecosystem goods and services, including California statewide water supply that was not recognized in the conventional reporting to properly inform decisions and investments for mitigation and recovery. Leveraging new tools available through the recent valuation of the UARW’s ecosystem goods and services, this study provides a first look at the magnitude of damage to the headwaters’ ecosystem from wildfires and, thus, informs proactive, adaptive management actions and post-disaster recovery and restoration. Using burn severity data and per-acre estimates of ecosystem goods and services, we estimate natural capital damage of over USD 14.8 billion across an optimistically estimated period of 20 years. Several recovery time horizons are used to evaluate the sensitivity of the analysis. These findings provide important benchmarks and a viable approach for all levels of government and private entities responsible for allocating resources, mitigating wildfire risks, and improving watershed health.
1. Introduction
A fire is a natural ecosystem system process. It provides dynamic ecological forces that have evolutionary consequences and are fundamentally shaped by human activities. There are two notable features of recent fire activities. First, many fires are planned by people as a management tool for maintaining fire-adapted systems. Second, land use and ongoing climate change are altering characteristics of individual fires and changing fire regimes, pushing them outside the historical range of variability in terms of frequency, size, seasonality, and severity [1,2]. Fires are diverse. Low-intensity fires have been used beneficially throughout human history for effective vegetation management and wildfire mitigation (e.g., prescribed fires or cultural burns) [3,4]. This study examines wildfires, which refer to any uncontrolled wildland fires spreading through vegetative fuels that threaten to destroy life, property, or resources and (1) are unattended by any person, (2) are attended by persons unable to prevent their unrestricted spread, or (3) are burning with such velocities or intensities that cannot be readily controlled with the ordinary tools available to private persons at the fire scenes [5,6].
These high-intensity wildfires damage natural capital assets, the environment, communities, and economies. In the past decade, California and much of the Western United States and Canada have been impacted by large wildfires. These uncontrolled high-intensity wildfires are now more frequent, resulting also from massive vegetation fuel accumulation after decades of mismanagement of forests and chronic deterioration of overall watershed health [1,7,8].
1.1. Study Area
The Upper American River Watershed (UARW) is located on the Sierra Nevada foothills in Northern California, east of the state capital, the City of Sacramento. The UARW includes the American River hydrologic watershed above Folsom Dam and a portion of the Cosumnes River hydrologic watershed within El Dorado County, for which resource management practices and responsibilities are jurisdictionally and managerially integrated. This watershed encompasses over 1.5 million acres of forests, grasslands, shrublands, wetlands, agricultural lands, open water, with a mixture of open spaces, and rural development including communities, cities, and towns. Each of these land cover types uniquely provides critical ecosystem goods and services (EGS), or simply environmental benefits, such as air quality, clean water supply, flood risk reduction, hydropower, recreation, timber, habitat for fish and wildlife, and more [9,10,11,12,13]. Like other assets, these working landscapes are a form of capital: natural capital. The natural capital in the UARW was estimated to be an asset of USD 1.6 trillion over 100 years based on a sustainable USD 14.8 billion flow of annual value [14]. When properly managed and conserved, the natural capital of these working and natural landscapes can provide these goods and services in near perpetuity.
In addition, the UARW is one of several major source watersheds that provide statewide water supplies for economic activities sustaining the fifth largest economy in the world. Its significance can be demonstrated by the state policy declaration in California’s Water Code Section 108.5, which recognizes source watersheds as integral components of the State’s water infrastructure. In addition, the California Water Plan developed by California Department of Water Resources (DWR) emphasizes the importance of source watersheds as the “natural backbone infrastructure” [15]. Figure 1 shows the complex nature of California’s major water systems and the geographic location of the UARW in Northern California. The health of the UARW can have long-lasting significant impacts in the watershed and beyond.
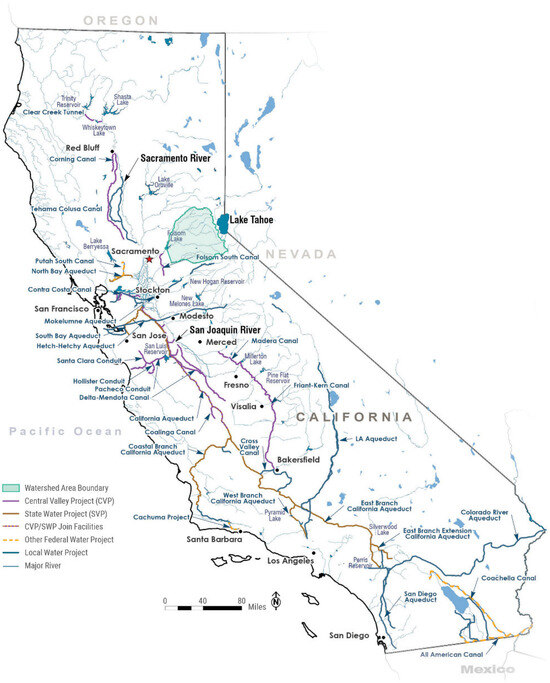
Figure 1.
Location of the Upper American River Watershed and major Californian water systems.
1.2. Costs of Wildfires
The interactions among fire regimes and ecology-, climate-, and human-driven changes are complex with compounded effects. Fire affects a broad range of above-ground ecological processes beyond the traditionally emphasized plant mortality and regeneration. Fire also sets ecological ground rules through soils in terms of the physical, chemical, and biological properties of soil [2]. The direct impacts of wildfires include community property damage and life loss, the disruptions of critical built and social infrastructure for community services and resource management (e.g., water, energy), a loss of ecosystem functions, and public health harms due to widespread smoke. The overall impacts of wildfires are farther reaching headwaters, like the UARW, where most wildfires occur and play a critical role in water supply, quality, timing, groundwater recharge, and other attributes of statewide if not national importance. High-intensity fires can create long-term ecosystem changes and a decrease in transpiration by removing vegetation, potentially increasing water yield and allowing snowpack on the ground for better infiltration. At the same time, they also severely impact the associated soil stabilization functions, and for a period of time after high-intensity fires, they leave hydrophobic pyrogenic organic matter layers, which increase runoff during storm events, causing additional subsequent disasters including flooding, erosion, debris flows, and landslides. These secondary disasters often create cascading and widespread effects on water quality and associated water treatment costs for community water supply, along with the long-term public health impacts that progress at a slower pace [16,17,18].
Conventionally reported damage due to major wildfires is generally focused on damage to built structures and loss of life. Official agencies such as emergency response (i.e., The California Department of Forestry and Fire Protection (CAL FIRE)) and the news media often miss damage to natural capital and EGS. This bias is also present in the systematic archive of wildfire damage in California based on fire suppression expenditure and post-fire damage inspection (DINS) data [19,20].
Accounting for the full cost of wildfires (and benefits of watershed health), including natural capital damage of wildfires, is essential for understanding the needed scale of investment in watershed health and watershed management. Many government agencies and organizations have begun to confront this challenge. A 2022 analysis by the U.S. Congressional Joint Economic Committee found that, “…wildfires in the United States cause between $394 billion and $893 billion dollars in damages annually, which is equivalent to between 2–4% of U.S. GDP” [21]. The analysis included a wide range of economic, social, and environmental impacts ranging from real estate values to damage to watersheds and aquifers. Accounting for a greater range of impacts led to a higher estimate of wildfire costs [21,22]. Many record-breaking wildfires (area and cost) contributed to the exploration of expanding the scope of impacts. Even with the expanded scope and estimated costs, it is recognized that many non-market economic values and consequences are not included [21].
The broad scope of impacts beyond physical properties and life loss, however, presents significant challenges in methodology and data availability. Therefore, many reports focus on economic activities that can be more readily quantified and monetized, for example, timber and tourism losses in rural areas [23]. Wildfires impact diverse landscapes. Most conventional coverage and many studies focus on urban impacts; such was the case after the devastating 2025 Palisades wildfire in Los Angeles, with economic damage assessments focusing on impacted industries and businesses [24] and the reduction in real estate values [25]. Sometimes, emergency response costs for fire suppression and associated economic losses are also included.
The California Air Resources Board (CARB) produces annual estimates of wildfire smoke emissions, which are used to estimate the social cost of wildfire emissions from the Mosquito and Caldor Fires. These values are incorporated into the total loss of EGS and the natural capital damage from the fires in this report.
Preventative measures and specific actions to improve watershed health and community resilience are advancing; however, immediate post-wildfire recovery needs result in the allocation of the vast majority of financial resources from federal, state, and local entities for disaster response and recovery in affected communities and for damaged infrastructure. For some time, there has been broad recognition of the repetitive cycle of post-wildfire recovery spending, post-fire plant growth, inadequate investment in watershed health but focusing on recovery of built capital would be only followed by more disasters of droughts, floods, landslides, and more wildfires [26]. In order to make long-term sustainable improvement to “get ahead of the curve”, the timely discussions and decision making for resource allocation, funding mechanisms, and distribution need to incorporate the long-lasting and far-reaching effects of recent fires and the likely future damage from reoccurring wildfires with the associated secondary disasters of floods, landslides, and droughts. This paper provides a tool to supplement the information in a quick, aggregated manner using EGS values that also allows for refinement and site-specific considerations.
Batker et al. [14] conducted the valuation of EGS provided by the UARW as a tool to support federal, state, and local governments, tribes, non-profit organizations, private sectors, and other interested parties to responsibly manage the watershed. The broad spectrum of EGS considered for the UARW allows for the appraisal of potential damage due to direct and indirect damages. Using the 2022 Mosquito and 2021 Caldor Fires in the UARW as an example, the wildfire damage to natural capital can be better assessed, enabling the subsequent decades of deliberate and systematic efforts required for healthy watershed recovery and management. This valuation provides insights into the financial value of efforts to prevent, respond to, and recover from wildfires, helping inform decision makers in funding allocations and actions for wildfire mitigation, emergency response, and post-fire recovery, including a preliminary level of characterization of damage from secondary disasters.
The analysis demonstrates a simple and effective way to estimate the loss of ecosystem services that can be used in benefit–cost, return on investment, and scenario analyses and policy development when examining wildfire mitigation, recovery, and restoration actions under multiple priorities.
The methodology presented here provides a roadmap for streamlined valuation customized to the form and availability of site-specific data. Often, wildfire damage estimates are needed quickly to ascertain the scale of financing needs for disaster recovery and response actions, such as replanting, to prevent subsequent damage from floods, erosion, and landslides, as well as long-term mitigation.
2. Methodology
Estimating the loss of EGS from a wildfire requires several steps. The first step in estimating wildfire damage to EGS is to assess the value of natural capital prior to the wildfire. Second, the extent and severity of the wildfire must be evaluated. Third, the extent and severity of the wildfire must be associated with the related losses in EGS. Once these losses are estimated, the loss relative to a baseline without the fire is considered to estimate the economic cost of EGS loss from the wildfire in the study area. The analysis applies three scenarios for landscape recovery to evaluate the sensitivity of the results.
For the UARW, Batker et al. [14] provides this information, including annual USD-per-acre EGS benefits for the seven generalized land cover types shown in Figure 2. This was developed based on 2019 land cover data from National Land Cover Database (NLCD), published by U.S. Geological Survey (USGS) prior to the Mosquito and Caldor Fires [27]. For illustrative purposes, the perimeters for 2022 Mosquito and 2021 Caldor Fires are outlined along with those of other historical major wildfires. Estimates and maps of the fire perimeters and burned areas were generated using the CAL FIRE Historic Fire Perimeters dataset [28]. It is worth noting that Caldor Fire’s perimeter extends into the Lake Tahoe Basin, becoming the second recorded wildfire to burn over the crest of the Sierra Nevada mountain range, following the devastating Dixie Fire that occurred in the Feather River watershed about 260 km north [28].
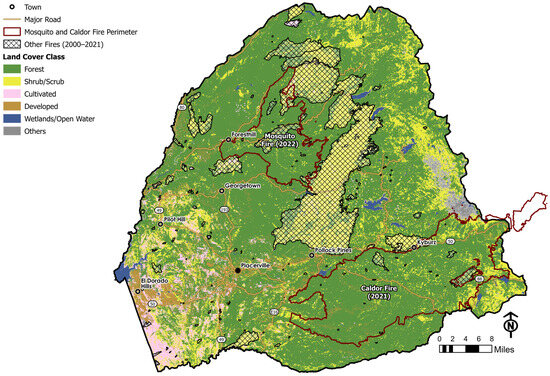
Figure 2.
Land cover classes in the UARW with burned areas of major wildfires.
Some NLCD land cover typers were combined for simplicity while maintaining proper representation of on-the-ground conditions for EGS valuation. For example, the category developed in this figure includes all four categories of developed land in the NLCD classification. In the valuation, only “Developed, Open Space” (one of the four developed categories) was considered for valuation, as higher-intensity developed land produces a much lower EGS value [14].
2.1. EGS Value Before the Mosquito and Caldor Fires
The acres present in the UARW as of 2019 for the seven land cover types are provided in Figure 3. Most of the UARW is forested, including the majority of national forests managed by U.S. Department of Agriculture, Forest Service (USFS), and some private timber lands. Much of the shrubland areas were formerly fully forested but experienced previous wildfires, such as the 2014 King Fire (the largest yellow-hashed area in Figure 2).
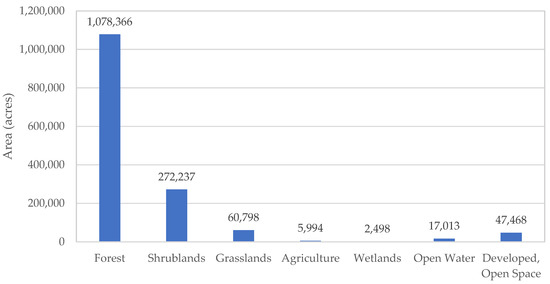
Figure 3.
Acreages of seven land cover types in the UARW as of 2019 before the 2022 Mosquito and 2021 Caldor Fires. Source: Batker et al. [14].
The pre-fire, per-acre EGS USD value estimates for each land cover category are summarized below in Table 1 based on values from a systematic approach to identifying, categorizing, and valuating 18 of 25 EGS on a watershed scale provided by the UARW [14].

Table 1.
Per-acre EGS value by land cover. Source: Batker et al. [14].
2.2. Impacted Areas of the Mosquito and Caldor Fires
Since 2000, over half a million acres have burned in the UARW based on fire perimeters provided by the California Department of Forestry and Fire Protection [28], which is about one-third (1/3) of the total watershed area. Most of the impacted working landscapes were burned by major wildfires, which are becoming more frequent and severe. Over half of the burned acreage occurred in the 2021 Caldor Fire (208,561 acres) and 2022 Mosquito Fire (77,178 acres). The impacted areas are primarily forests with rural communities in the wildland urban interface where human development and wildland vegetation meet or intermingle, posing significant risks, especially wildfire hazards, and requiring careful management and planning [29]. Wildfires burn with different intensities, measured by depth and severity of soil burn. Figure 4 shows the soil burn intensity of the Caldor and Mosquito Fires.
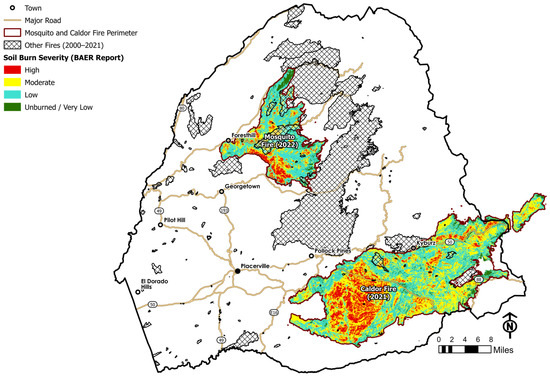
Figure 4.
Wildfire soil burn severity for the 2022 Mosquito and 2021 Caldor Fires, with historical fire perimeters of other wildfires in the UARW from 2000 to 2021.
The perimeter of the Caldor Fire covers an area of 208,561 acres, mostly in the UAWR but some in the Tahoe Basin. Of this total area, 207,627 acres were forest, shrublands, grasslands, wetlands, and open space. The perimeter of the Mosquito Fire covers an area of 76,916 acres with forests, shrublands, grasslands, wetlands, and open spaces. Forestland comprised the majority of the burn area: 88% of the Mosquito Fire burn area and 85% of the Caldor Fire burn area. Figure 5 shows the breakdown of the Caldor and Mosquito Fire burned areas in the UARW by land cover type. Figure 5 shows the summary of acreages damaged by land cover type.
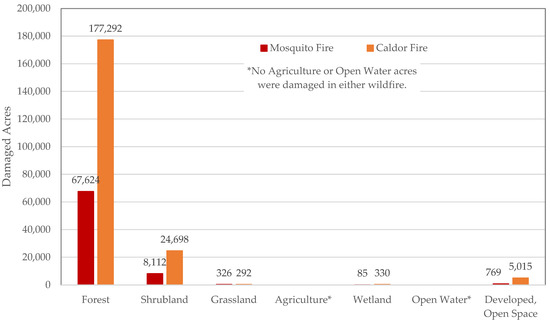
Figure 5.
Damaged acreages by Caldor and Mosquito Fires by land cover type.
2.3. EGS Value Affected by the Mosquito and Caldor Fires
This study provides a rough monetized value of natural capital damaged by wildfires. Agricultural land and open water have significant EGS values but were excluded from the following analysis because they were not significantly damaged by these wildfires. Developed areas (other than “developed, open space”) were also excluded because their pre-fire EGS value was not previously assessed [14]. This analysis focuses on land cover types with damaged EGS over a total area of 216,920 acres, less than the total burned area acreage (285,739 acres).
Applying the pre-fire, per-acre values of EGS (Table 1) to the EGS-impacted acreages in Caldor and Mosquito Fires by land cover type (Figure 3), the total pre-wildfire value of EGS is over USD 3.2 billion in annual benefits. The levels of impact on these annual benefits vary depending on how severe the wildfires were at the corresponding locations. Table 2 shows the value of EGS within the corresponding areas by land cover type if the wildfires had not occurred (referred to in this study as “undamaged”).
Table 2.
Undamaged value of EGS within the EGS-impacted areas of the Mosquito and Caldor Fires.
2.4. Assessing the Level of Natural Capital Damage from the Mosquito and Caldor Fires
The loss of EGS is subject to the level of damage in the underlying natural capital of the working landscape that provides these EGS. To estimate the economic loss from the Mosquito and Caldor Fires, post-fire soil burn severity maps generated by the Burned Area Emergency Response (BAER) Program were used to approximate the level of damage to underlying natural capital. The BAER Program is a joint effort between USFS and USGS to rapidly identify post-fire effects and determine whether a particular wildfire has created an unacceptable risk to human life and safety, property, and critical natural or cultural resources. The BAER team developed the post-fire soil burn severity to represent the effect of a fire on ground surface soil characteristics, including char depth, organic matter loss, altered color and structure, and reduced water infiltration. The classification of post-fire soil condition is based on fire-induced changes in physical and biological soil properties related to long-term ecosystem health [30,31].
BAER’s post-fire soil burn severity is classified based on the Burn Composite Index (BCI). BCI is a method commonly used to correlate remote sensing data with observed fire effects that require characterization of burn severity, and a sampling strategy that matches recorded field characteristics to sensor capabilities [30,32,33]. Table 3 summarizes the BCI and the range associated with each soil burn severity level: high, moderate, low, and unburned/very low.
Table 3.
Burn Composite Index for varying levels of post-fire soil burn severity.
The BAER data for the 2022 Mosquito and 2021 Caldor Fires [34] was overlapped with the referenced land cover data in Table 1 and Table 2 above to identify the land covers that were burned and to what degree. This analysis scales the EGS values produced by each land cover type by the BCI. Each BCI factor and the associated percentage reduction in EGS value are shown below in Table 4. The BCI value gives a range for each category of impact selected. For this study, the No Effect level in Table 3 was expanded to complete the range up to 0.5 (inclusive) and labeled as Unburned/Very Low in the remaining analysis.
Table 4.
Burn Composite Index and reduction in EGS.
This analysis applies the midpoint of the range to estimate impacts on EGS. Other assumptions could be made to adjust the percentage reduction in EGS relative to the BCI. The midpoint of the BCI range for each category was divided by three (the maximum soil burn severity) to provide a normalized scale of soil burn severity representing the corresponding percentage reduction in EGS value.
The percentage reductions in EGS from Table 4 are applied to the USD/acre/year values from Table 2 to estimate each land cover’s post-wildfire USD/acre/year value by soil burn severity. Table 5 shows the remaining EGS value by land cover type immediately after a wildfire event. The referenced pre-fire values in Table 1 are also listed for comparison.
Table 5.
Referenced pre-fire and first-year post-wildfire EGS value (USD/acre/year) by soil burn severity and land cover type.
Table 6 shows the areas of the Mosquito and Caldor Fires by soil burn severity for each impacted land cover type. The overall remaining value from EGS on these impacted land cover types can be assessed by multiplying the reduced USD-per-acre values in Table 5 with the corresponding acreages in Table 6.
Table 6.
Mosquito and Caldor Fires’ damaged areas (acres) by soil burn severity and land cover type.
2.5. Cumulative Damage from Annual Reduction in EGS Values
Damaged ecosystems take time to recover. The first-year, post-fire conditions shown in Table 5 extend over a recovery period, gradually increasing in value with ecological recovery and eventually returning to an undamaged state. The recovery period depends on the effective implementation, the timing and adequacy of wildfire mitigation, and post-fire restoration actions. In other words, wildfires cause long-term damage to natural capital and EGS flows. Bright et al. [32] provide a summary of the relevant literature on wildfires and recovery timelines. Most of the wildfires highlighted have vegetation recovery (based on satellite data) within 20 years. The base case for recovery in this analysis is 20 years. This is not full forest succession recovery. This assumption is conservative for calculating fire damage, which is greater for longer fire recovery temporal horizons. There are many factors that may prolong the recovery period and thus extend the accumulated damage from wildfires, including erosion, floods, droughts, invasive species, monoculture or mixed species replanting, thinning, and wildlife interactions, as well as a lack of funding for or availability of a skilled wildfire mitigation and restoration workforce. The pace of recovery from damage from the 2014 King Fire (the largest wildfire in the UARW before the Caldor Fire) was evidently slower. To evaluate the sensitivity of the assumption of a 20-year recovery timeline, we present two alternatives, both 30-year and 50-year recovery timelines.
The rate of recovery is also needed to estimate the cumulative damage to annual EGS values over time. Bright et al. [32] analyzed post-wildfire vegetation recovery for three different coniferous forest types in Western North America from 2000 to 2007 and developed projected recovery rates for different types of forest based on satellite image analyses. The methodology for processing satellite images was based on the concept of Normalized Burn Ratio (NBR), which is a spectral index used to identify burned areas and assess fire severity by analyzing the reflectance of near-infrared and shortwave infrared bands. NBR is correlated with the BCI, making it compatible for providing projected forest recovery rates used in this analysis [32]. Table 7 shows the vegetation recovery rates after 5, 10, and 13 years by forest type. The recovery rates for mixed conifers are most appropriate for the UARW, and these recovery rates are assumed to be applicable to all land cover types in this study.
Table 7.
Vegetation recovery rates by forest type. Source: Bright et al. [32].
2.6. Additional Social Costs of Carbon
In addition to the reduction in annual EGS discussed above, wildfires are significant sources of carbon dioxide equivalent (CO2e) emissions (emissions include carbon dioxide, methane, and nitrous oxide, but only carbon dioxide emissions were calculated here) because the forests and other working landscapes sequester and store carbon [35,36,37]. The carbon stock value in the UARW was estimated at USD 173 billion [14].
The smoke and CO2e emissions from wildfires in the UARW spread to nearby regions in the Central Valley, Tahoe Basin, Bay Area, neighboring State of Nevada, and beyond depending on weather conditions. The damage resulting from CO2e emissions alone results in an additional contribution to climate change with associated damage. The social cost of carbon (SC-CO2) is a measure of the long-term economic damage due to a ton of CO2e emissions, including climate change, health problems, agricultural losses, and other damage [38,39]. It is hard to measure the benefits of climate stability and air quality provided by the EGS in headwaters like the UARW because the beneficiary areas extend far beyond the watershed boundary, and some benefits such as climate stability are worldwide benefits.
The California Air Resources Board generates the annual estimates of greenhouse gas emissions from wildfires throughout the state. The estimates are made using the U.S. Forest Service (USFS) First-Order Fire Effects Model (FOFEM) using CAL FIRE data on wildfire perimeters, vegetation fuels, and fuel moisture. Based on these estimates, the Mosquito and Caldor Fires produced 2.0 and 9.9 million metric tons of CO2, respectively [35,36]. There have been many estimates and consistent advancements in the calculation of the SC-CO2. Rennert et al. [38] provide a recent and more comprehensive analysis of the SC-CO2 than previous studies and select a mean SC-CO2 of USD 185 per metric ton of CO2e emission (2020 USD). Adjusting for inflation to 2023 from when the study was conducted, the SC-CO2 is USD 218 per metric ton of CO2e emission. The total CO2 metric tons emitted from the Mosquito and Caldor Fires (11.9 million) multiplied by the SC-CO2 provides an estimate of the social costs from the loss of carbon stored in the impacted areas.
3. Results
The estimated annual values of the post-fire EGS in the first year after the wildfires are shown in Table 8. Compared to the undamaged values shown in Table 2, the remaining EGS are 39% and 48% of the undamaged values in the impacted working landscape in 2022 Mosquito and 2021 Caldor Fires, respectively.
Table 8.
Estimated first-year EGS value after Mosquito and Caldor Fires, rounded to the nearest thousand USD by soil burn severity and land cover.
The analysis applies the vegetation recovery rates for mixed conifer in Table 7 to the initial annual losses in EGS value in Table 8 to project the change in EGS losses during the assumed 20-year recovery period. Figure 6 shows the annual loss in EGS value each year following both wildfires, with a total non-discounted loss of USD 13.3 billion from 2021 to 2042. Figure 7 shows the cumulative EGS value losses from Mosquito and Caldor Fires discounted at 2.5%, which totals to over USD 12.1 billion in 20 years.
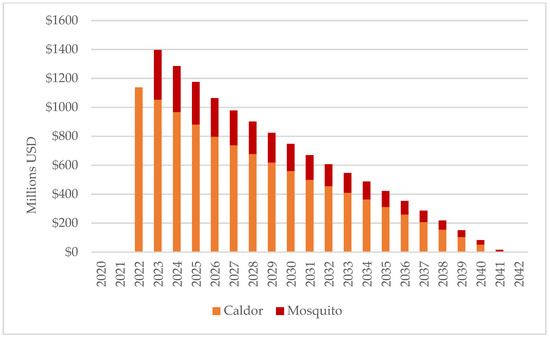
Figure 6.
Annual EGS loss from the Mosquito and Caldor Fires at a 0% discount rate and assumed 20 years of recovery period.
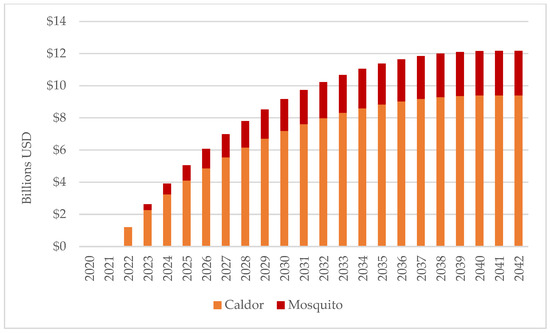
Figure 7.
Cumulative EGS value loss from the Mosquito and Caldor Fires at a 2.5% discount rate and assumed 20 years of recovery time.
To evaluate the sensitivity of the 20-year recovery timeline, Figure 8 shows three recovery timelines, i.e., 20-year, 30-year, and 50-year recovery times. These recovery timelines shown in Figure 8 indicate that the results are somewhat sensitive to the assumed period required for full recovery. The recovery rate from year 0 to 13 remains the same in all scenarios and gradually recovers from year 13 each year to full recovery. This means that extending the time horizon for recovery significantly increases the annual damage that occurs from EGS loss after year 13. Extending the recovery time horizon to 30 years increases the cumulative damage by 18%. Extending the recovery time horizon to 50 years increases the cumulative damage by 53%. Table 9 shows the recovery scenarios and the percentage change in the projected loss compared to the 20-year recovery rate.
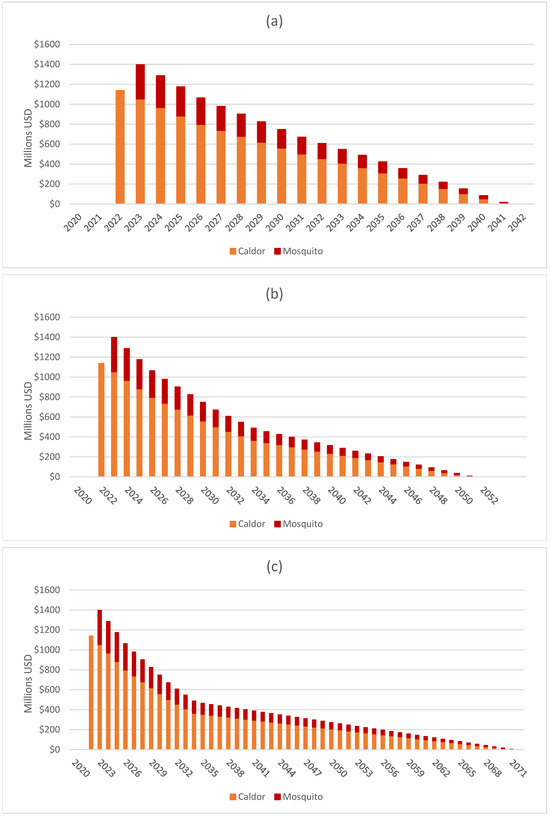
Figure 8.
Annual EGS value loss from the Mosquito and Caldor Fires at a 0% discount rate under multiple recovery timelines: (a) 20-year recovery timeline, (b) 30-year recovery time, and (c) 50-year recovery timeline.
Table 9.
Projected losses over multiple recovery scenarios.
The impact of the assumption is within an order of magnitude; thus, the assumption is conservative, but reasonable. Further research could examine longer time horizons and other areas of sensitivity including elevation, slope, aspect, vegetation cover, and rainfall using the existing literature and additional GIS data.
Table 10 shows the estimated social costs of carbon for both wildfires based on the CO2 emissions from the Mosquito and Caldor Fires reported by the California Air Resources Board [35,36].
Table 10.
The estimated social cost of carbon emissions during Mosquito and Caldor Fires.
Table 11 shows the damage from cumulative EGS loss in the assumed 20 years of recovery period and social costs of carbon due to the 2021 Caldor and 2022 Mosquito Fires. The combined natural capital damage from these two wildfires is over USD 14.8 billion. This is a conservative estimate since not all EGS were valued in the referenced studies [14], and the assumed 20 years of recovery may be optimistic.
Table 11.
Estimated natural capital damage from the Mosquito and Caldor Fires due to lost EGS and CO2 emissions.
4. Discussion
Wildfires are remarkably complex. Similarly to the complex nature of wildfire, the process and analysis for providing a more complete view of wildfire-incurred immediate, short-term, and long-term effects on natural, built, and social infrastructure are also complex. Immediate fire response and post-fire built capital mitigation measures have comprised the primary investments for wildfires and are critical but inadequate and insufficient considering the long-term value of forested watersheds. Using two recent major wildfires in the UARW, the 2022 Mosquito and 2021 Caldor Fires, this study provides an approach to valuing the cost of EGS loss and social costs associated with CO2e emission. Combining the natural capital costs, built capital costs, health impacts, and life loss information would enable a more complete risk assessment of wildfires and their secondary disasters and better insights into watershed investments. This inclusive approach could help alleviate the need for tedious, complex assessments of individual EGS damage. The information is valuable for public education and decision making at all levels of government for resource allocation, funding mechanisms, and implementation for improving long-term fire-adaptive community resilience and watershed health.
This study also highlights the long duration needed for post-fire forest succession. The assumed 20 years of recovery period is optimistic judging from the recovery of the last major wildfire in the UARW, the 2014 King Fire. Its burn area, without active restoration, is mostly composed of shrubland even after more than 10 years. Adequate and timely implementation of post-fire mitigation actions (e.g., replanting, thinning) could quicken the succession and reforestation process.
After this analysis was completed, USGS published the 2023 updates of the NLCD data [40]. Figure 9 shows the same information as in Figure 2, but with the 2023 data; it shows significant land cover changes due to wildfires between 2019 and 2023, with approximately 287,000 acres of forestlands reclassified predominantly as grasslands. This matches very closely to the 286,000 combined acres of the Mosquito and Caldor Fires (other fires also occurred during this period).
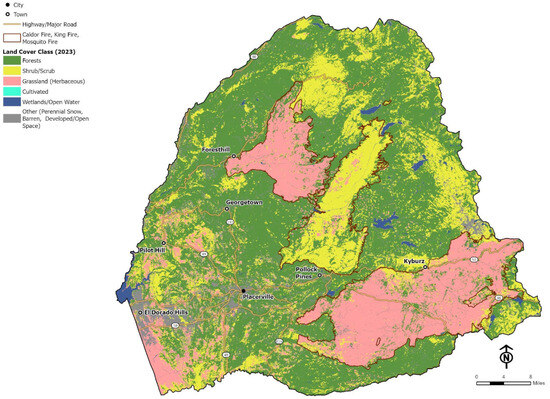
Figure 9.
Land cover types in the Upper American River Watershed in 2023, highlighting the change in land cover designations within the Mosquito and Caldor Fire perimeters since 2019.
Figure 9 provides strong evidence of the drastic changes in land covers due to wildfires, indicating that more analysis of EGS and post-fire values is needed. A better understanding of post-fire restoration actions and forest health recovery would improve the valuation results. Additional site-specific evaluation to improve the underlying valuation of certain EGS can be performed to better represent the costs of wildfire damage to natural assets. What is clear is that major wildfires significantly damage working landscapes in forested headwaters and reduce economic benefits to local downstream communities and to regional, statewide, and global beneficiaries. Understanding the economics of wildfires, including the value of damage, can help inform effective pre- and post-fire investment in these important landscapes. The significant damage estimated in this study provides strong incentive of continued, effective, and timely actions for improving watershed health and wildfire mitigation and recovery.
5. Conclusions
Conventional reports on wildfire damage focus on damage to built structures and life loss and, in some cases, impacts on short-term and long-term urban economic impacts and real estate values. When wildfires occur in headwaters and forests, the impacts on short-term and long-term EGS losses are often not researched or characterized. These ecosystem goods and services (e.g., water supply, water regulations, water quality, hydropower, air quality, recreation) contributed significantly to economic development and social wellbeing. The losses of ecosystem goods and services from wildfires impact their corresponding benefiting areas that are often far beyond the wildfire perimeter.
Wildfires are inherently complex; the assessment of the full cost of a wildfire event can be very challenging and time-consuming due to its broad range of impacts traversing decades. However, investments in wildfire mitigation and recovery cannot be properly considered without improving the completeness of total wildfire costs including the costs of natural asset damage in the watersheds like the UARW. The conservative estimate of the wildfire damage in the UARW from recent two major wildfires is over USD 14.8 billion across an optimistically estimated recovery period of 20 years. Failing to recognize the information gap in policy making and investment decisions may result in extension of the recovery period or irreversible loss of EGS.
Using the UARW as a case study, this study provides a first look at the magnitude of damage to the headwaters’ ecosystem from wildfires, using burn severity data produced by post-fire investigation and per-acre estimates of ecosystem goods and services from a recent study. This approach is relatively straightforward for a quick assessment to assist active decision-making process during and immediately afterward for recovery and restoration. The successful application in this study also highlights the importance of developing the valuation of the ecosystem goods and services provided by the watershed. With this foundational information, many other decision-support tools for resource management and investment strategies can be developed to better inform prudent policies and investment decisions.
Author Contributions
Conceptualization, D.B. and Y.-H.S.; data curation, J.S. and A.B.-P.; formal analysis, J.S.; investigation, Y.-H.S. and A.B.-P.; methodology, D.B.; project administration, Y.-H.S. and R.G.; supervision, D.B., Y.-H.S. and R.G.; visualization, Y.-H.S.; writing—original draft, J.S. and Y.-H.S.; writing—review and editing, D.B., Y.-H.S. and R.G. All authors have read and agreed to the published version of the manuscript.
Funding
The authors declare that this study received funding from El Dorado Water Agency.
Data Availability Statement
The original contributions presented in this study are included in the article. Further inquiries can be directed to the corresponding author.
Conflicts of Interest
Author Rebecca Guo is employed by El Dorado Water Agency (the study funder), which presents no conflicts of interest as a public resource management agency. The remaining authors declared that the research study was conducted in the absence of any commercial or financial relationships that could be construed as a potential conflict of interest. Authors David Batker, Jared Soares, and Aaron Batker-Pritzker were employed by Batker Consulting LLC, and author Yung-Hsin Sun was employed by Sunzi Consulting LLC. Both Batker Consulting LLC and Sunzi Consulting LLC were retained by El Dorado Water Agency for advancing watershed planning including the development of this study. Collectively, these authors declared that they received no financial compensation from any source for their corresponding contribution individually to this scientific work and manuscript. These authors further declared that their individual contribution to this work and manuscript were made independently without any requirements, guidance, or input by their corresponding employer for its business and operation purposes. The authors declare that this study received funding from El Dorado Water Agency. The funder had the following involvement with the study: project administration, research supervision, support in research scoping, data collection, coordination with entities and agencies, review of data and research outcome, and review and comments of study reports.
References
- Turco, M.; Abatzoglou, J.T.; Herrera, S.; Zhuang, Y.; Jerez, S.; Lucas, D.D.; AghaKouchak, A.; Cvijanovic, I. Anthropogenic climate change impacts exacerbate summer forest fires in California. Proc. Natl. Acad. Sci. USA 2023, 120, e2213815120. [Google Scholar] [CrossRef] [PubMed]
- McLauchlan, K.K.; Higuera, P.E.; Miesel, J.; Rogers, B.M.; Schweitzer, J.; Shuman, J.K.; Tepley, A.J.; Varner, J.M.; Veblen, T.T.; Adalsteinsson, S.A.; et al. Fire as a fundamental ecological process: Research advances and frontiers. J. Ecol. 2020, 108, 2047–2069. [Google Scholar] [CrossRef]
- Avitt, A. Tribal and Indigenous Fire Tradition. Available online: https://www.fs.usda.gov/about-agency/features/tribal-and-indigenous-fire-tradition (accessed on 20 March 2025).
- U.S. Department of Agriculture. Forest Service National Prescribed Fire Resource Mobilization Strategy; USDA Forest Service: Washington, DC, USA, 2023.
- California Government Code Title 5, Division 1, Part 1, Chapter 6.8 Moderate, High, and Very High Fire Hazard Severity Zones Section 51177(j). Available online: https://leginfo.legislature.ca.gov/faces/codes_displayText.xhtml?lawCode=GOV&division=1.&title=5.&part=1.&chapter=6.8.&article= (accessed on 1 June 2025).
- Public Resources Code Division 4, Part 2, Chapter 1 Prevention and Control of Forest Fires Section 4104. Available online: https://leginfo.legislature.ca.gov/faces/codes_displayText.xhtml?lawCode=PRC&division=4.&title=&part=2.&chapter=1.&article=1 (accessed on 1 June 2025).
- Greenspan, K.; Franklin, B. Headwaters and Wildfire in California; Public Policy Institute of California: San Francisco, CA, USA, 2025. [Google Scholar]
- California Office of Environmental Health Hazard Assessment. Indicators of Climate Change in California; California Environmental Protection Agency: Sacramento, CA, USA, 2022.
- de Groot, R.; Wilson, M.; Boumans, R. A typology for the classification, description and valuation of ecosystem functions, goods and services. Ecol. Econ. 2002, 41, 393–408. [Google Scholar] [CrossRef]
- Millennium Ecosystem Assessment. Ecosystems and Human Well-Being: Synthesis; Millennium Ecosystem Assessment; Island Press: Washington, DC, USA, 2005. [Google Scholar]
- Pascual, U.; Muradian, R.; Brander, L.; Gómez-Baggethun, E. The economics of valuing ecosystem services and biodiversity. In The Economics of Ecosystems and Biodiversity: Ecological and Economic Foundations; Routledge: Thames, UK, 2010; pp. 183–256. [Google Scholar]
- Costanza, R.; d’Arge, R.; de Groot, R.; Farber, S.; Grasso, M.; Hannon, B.; Limburg, K.; Naeem, S.; O’Neill, R.V.; Paruelo, J.; et al. The value of the world’s ecosystem services and natural capital. Nature 1997, 387, 253–260. [Google Scholar] [CrossRef]
- TEEB. The Economics of Ecosystems and Biodiversity: Mainstreaming the Economics of Nature: A Synthesis of the Approach, Conclusions and Recommendations of TEEB; The Economics of Ecosystems and Biodiversity: Geneva, Switzerland, 2010. [Google Scholar]
- Batker, D.; Soares, J.; Sun, Y.-H.; Batker-Pritzker, A.; Guo, R. Headwater Valuation as a Tool for Economic Development, Healthy Forest Management, and Water Resilience. Water 2024, 16, 2121. [Google Scholar] [CrossRef]
- California Department of Water Resources. California Water Plan Update 2023; California Department of Water Resources: Sacramento, CA, USA, 2023.
- Wang, D.; Guan, D.; Zhu, S.; Kinnon, M.M.; Geng, G.; Zhang, Q.; Zheng, H.; Lei, T.; Shao, S.; Gong, P.; et al. Economic footprint of California wildfires in 2018. Nat. Sustain. 2021, 4, 252–260. [Google Scholar] [CrossRef]
- Headwaters Economics. The Full Community Costs of Wildfire; Headwaters Economics: Bozeman, MT, USA, 2018. [Google Scholar]
- Troy, A.; Pusina, T.; Romsos, S.; Moghaddas, J.; Buchholz, T. The True Cost of Wildfire in the Western U.S.; Western Forestry Leadership Coalition: Lakewood, CO, USA, 2022. [Google Scholar]
- CAL FIRE. California Department of Forestry and Fire Protection Emergency Fund Fire Suppression Expenditures; California Department of Forestry and Fire Protection: Sacramento, CA, USA, 2024.
- CAL FIRE. Damage Inspection (DINS) Data; California Department of Forestry and Fire Protection: Sacramento, CA, USA, 2025.
- U.S. Congress Joint Economic Committee. Climate-Exacerbated Wildfires Cost the U.S. Between $394 to $893 Billion Each Year in Economic Costs and Damages; U.S. Congress Joint Economic Committee: Washington, DC, USA, 2023.
- Thomas, D.; Butry, D.; Gilbert, S.; Webb, D.; Fung, J. The Costs and Losses of Wildfires: A Literature Survey; U.S. Department of Commerce, National Institute of Standards and Technology: Gaithersburg, MD, USA, 2017. [Google Scholar]
- Diaz, J.M. Economic Impacts of Wildfire. South. Fire Exch. 2012, 498, 2012–2017. [Google Scholar]
- Horton, M.; Sedgwick, S.M.; Adams, J.; Wei, D.; Skyberg, M. Impact of 2025: Los Angeles Wildfires and Comparative Study; Los Angeles County Economic Development Corporation, Institute for Applied Economics: Los Angeles, CA, USA, 2025. [Google Scholar]
- Li, Z.; Yu, W. Economic Impact of the Los Angeles Wildfires; UCLA Anderson School of Management: Los Angeles, CA, USA, 2025. [Google Scholar]
- Smith, C.D.M. Innovative Drought and Flood Mitigation Projects; FEMA: Washington, DC, USA, 2017. [Google Scholar]
- Dewitz, J. National Land Cover Database (NLCD) 2019 Products: U.S. Geological Survey Data Release, version 2.0; U.S. Geological Survey: Reston, VA, USA, 2021. [Google Scholar] [CrossRef]
- CAL FIRE. California Fire Perimeters (1950+); CAL FIRE: St. Sacramento, CA, USA, 2023.
- Soares, J.; Batker, D.; Batker-Pritzker, A. Natural Capital Damages from the Mosquito and Caldor Fires; Batker Consulting, LLC: Parkland, WA, USA, 2025. [Google Scholar]
- Key, C.H.; Benson, N.C. Landscape Assessment (LA): Sampling and Analysis Methods. In FIREMON: Fire Effects Monitoring and Inventory System; General Technical Report; U.S. Department of Agriculture, Forest Service, Rocky Mountain Research Station: Fort Collins, CO, USA, 2006; Volume 164. [Google Scholar]
- Parsons, A.; Robichaud, P.R.; Lewis, S.A.; Napper, C.; Clark, J.T. Field Guide for Mapping Post-Fire Soil Burn Severity; U.S. Department of Agriculture, Forest Service: Fort Collins, CO, USA, 2010.
- Bright, B.C.; Hudak, A.T.; Kennedy, R.E.; Braaten, J.D.; Henareh Khalyani, A. Examining post-fire vegetation recovery with Landsat time series analysis in three western North American forest types. Fire Ecol. 2019, 15, 8. [Google Scholar] [CrossRef]
- Sikkink, P.G. Comparison of six fire severity classification methods using Montana and Washington wildland fires. In Proceedings of the Large Wildland Fires Conference, Missoula, MT, USA, 19–23 May 2014; Proceedings. USDA Forest Service: Missoula, MT, USA, 2015; Volume 73, pp. 213–226. [Google Scholar]
- United States Geological Survey Burn Area Emergency Response (BAER). BAER Imagery Support Data. Available online: https://burnseverity.cr.usgs.gov/baer/baer-imagery-support-data-download (accessed on 28 October 2024).
- CARB. Wildfire Emission Estimates for 2022; California Air Resources Board: Sacramento, CA, USA, 2023.
- CARB. Wildfire Emission Estimates for 2021; California Air Resources Board: Sacramento, CA, USA, 2022.
- Zheng, B.; Ciais, P.; Chevallier, F.; Yang, H.; Canadell, J.G.; Chen, Y.; van der Velde, I.R.; Aben, I.; Chuvieco, E.; Davis, S.J.; et al. Record-high CO2 emissions from boreal fires in 2021. Science 2023, 379, 912–917. [Google Scholar] [CrossRef] [PubMed]
- Rennert, K.; Errickson, F.; Prest, B.C.; Rennels, L.; Newell, R.G.; Pizer, W.; Kingdon, C.; Wingenroth, J.; Cooke, R.; Parthum, B.; et al. Comprehensive evidence implies a higher social cost of CO2. Nature 2022, 610, 687–692. [Google Scholar] [CrossRef] [PubMed]
- United States Government, Interagency Working Group on Social Cost of Greenhouse Gases. Technical Support Document—Technical Update of the Social Cost of Carbon for Regulatory Impact Analysis—Under Executive Order 12866; U.S. Environmental Protection Agency: Washington, DC, USA, 2013. [Google Scholar]
- U.S. Geological Survey (USGS). Annual NLCD Collection 1 Science Products: U.S. Geological Survey Data Release 2024; U.S. Geological Survey: Reston, VA, USA, 2024. [CrossRef]


Disclaimer/Publisher’s Note: The statements, opinions and data contained in all publications are solely those of the individual author(s) and contributor(s) and not of MDPI and/or the editor(s). MDPI and/or the editor(s) disclaim responsibility for any injury to people or property resulting from any ideas, methods, instructions or products referred to in the content. |
© 2025 by the authors. Licensee MDPI, Basel, Switzerland. This article is an open access article distributed under the terms and conditions of the Creative Commons Attribution (CC BY) license (https://creativecommons.org/licenses/by/4.0/).