Abstract
The existence of dissolved organic matter (DOM) in aquatic environments presents significant challenges to both the environment and public health. This study examines the adsorption efficacy of six organic adsorbents, such as three commercial (coconut shells [CS], palm kernel shells [PKS], and graphite [GR]) and three waste-based materials (plantain peels [PP], water hyacinth leaves [WHL], and corn cobs [CC]) for DOM removal. The waste-derived adsorbents were prepared using thermal and chemical activation techniques, while the commercial adsorbents were used in their standard forms. Adsorption experiments were conducted and analyzed using both kinetic and isotherm models to evaluate removal efficiency and underlying mechanisms. Kinetic modeling revealed that CS, PP, CC, and GR followed pseudo-second-order kinetics, PKS conformed to pseudo-first-order kinetics, and WHL exhibited intra-particle diffusion dominance. The Freundlich isotherm model effectively characterizes the adsorption equilibrium for every material, indicating the multilayer adsorption and heterogeneity of the adsorbent surfaces. Among all tested materials, GR showed the highest DOM removal efficiency (up to 96%) and excellent thermal stability, making it the most effective adsorbent overall. WHL also showed competitive performance, while CS emerged as the most economically viable option despite having slightly lower removal efficiency. Surface area alone does not guarantee adsorption efficiency. Pore accessibility (governed by size/distribution) and surface chemistry (functional group diversity) are equally critical. The findings suggest that both commercial and waste-derived adsorbents hold promise for sustainable and cost-effective water treatment applications. Integrating such materials could enhance the circular economy and offer scalable solutions for addressing water quality issues in developing regions.
1. Introduction
Surface water is essential for potable use, agriculture, industry, recreation, ecosystem vitality, and the comprehensive operation of the planet’s hydrological cycle [1]. Water pollutants can be categorized as organic contaminants, which encompass pharmaceuticals and colors, and inorganic pollutants, comprising heavy metals and ions such as fluoride [2]. Among water pollutants, dissolved organic matter (DOM) represents a complex and critically important category [3]. Elevated DOM concentrations in water bodies have broad environmental consequences. Notably, DOM can interact with heavy metals and other toxins, forming complexes that enhance pollutant mobility and bioavailability, thus increasing their toxic effects on aquatic organisms and potentially on human health when present in drinking water supplies [4]. Some fractions of DOM, especially those derived from anthropogenic or microplastic sources, have been shown to induce phytotoxicity, ecological disruption, and even facilitate the formation of carcinogenic disinfection by-products during water treatment processes [5]. Additionally, DOM can promote the spread and persistence of pollutants by modifying their chemical speciation and fate, further complicating environmental management efforts [6].
Recent international and national guidelines, including those from the World Health Organization (WHO), United States Environmental Protection Agency (US EPA), European Union, and Health Canada, generally do not specify strict numerical limits for DOM, usually measured as dissolved organic carbon (DOC) or total organic carbon (TOC) in drinking water [7]. In this study, measuring DOC in the potting soil extract allowed for a clear, standardized assessment of DOM concentration, facilitating the evaluation of adsorbent performance. WHO guidelines emphasize the minimization of DOM in drinking water systems to reduce both biofilm formation and DBP risks, but do not set a health-based maximum concentration for DOM or TOC. Actual concentrations of DOC in treated drinking water are highly variable but typically range from <0.5 to around 3.5 mg/L in many surface water systems, with lower values in groundwater sources. Aesthetic objectives, such as true color (≤15 TCU) and turbidity (≤1 NTU), indirectly address the effects of DOM, since high organic levels can increase both. In research and practice, levels above about 2–3 mg/L DOC or TOC are generally considered problematic for treatment efficiency and regulatory DBP compliance, prompting advanced treatment or enhanced removal [8].
Treating DOM in surface water is vital for protecting public health, ensuring effective water treatment, reducing environmental risks, and maintaining high water quality standards [9]. Current methods for DOM removal in water treatment include coagulation/flocculation, sedimentation, sand/anthracite filtration, advanced oxidation, granular or powdered activated carbon adsorption, and membrane processes like ultrafiltration, nanofiltration, and reverse osmosis for comprehensive removal [10,11]. Traditional methods, such as coagulation–flocculation and sedimentation, can remove high-molecular-weight DOM, but often require further treatment to achieve regulatory standards. Advanced oxidation processes (AOPs) offer greater efficiency for recalcitrant DOM fractions, but may be energy-intensive and generate potentially harmful by-products [12]. Adsorption stands out as a promising, cost-effective, and scalable approach, particularly when utilizing sustainable adsorbents derived from waste biomass, which not only reduce pollutant levels, but also advance circular economy principles [13,14]. The efficacy of the adsorption process predominantly depends on the characteristics of the adsorbent, such as its microporous structure, surface area, surface reactivity, and adsorption capacity, in addition to the operational parameters [15]. The utilization of sorption technology, mostly employing carbon-based adsorbents, has gained significant recognition among researchers for its cost-effectiveness, straightforward approach, and exceptional efficacy in eliminating contaminants from contaminated water [16,17].
Currently, manufacturing activated carbon for commercial use frequently relies on non-renewable and costly resources like petroleum and coal [18]. Activated carbon is commonly chosen for its strong attraction to contaminants in wastewater, primarily due to its large surface area, microporous structure, elevated adsorption capacity, and significant surface reactivity. Due to the exorbitant expense of activated carbon for commercial use, it is crucial to conduct research on synthesizing activated carbon from different agricultural waste sources [15]. A bio-adsorbent is a material obtained from biomass and employed for the purpose of adsorption [19]. These naturally occurring substances that can attract and hold onto other substances offer great potential since they are plentiful and affordable; have outstanding adsorption capabilities; are abundant, environmentally friendly, and renewable; and have the ability to specifically remove heavy metals [20].
Some materials that can be used as organic adsorbents include coconut shells (CS) [21], palm kernel shells (PKS) [22], plantain peels (PP) [23], water hyacinth (WH) [24], corn cobs (CC) [18], and graphite (GR)[25]. CS has a strong adsorption nature and a high strength, is easy to regenerate, and is economical and durable. There is a vast potential for using waste CS to produce activated carbon for treating low-/dilute-concentration heavy metal wastewater [26,27]. The PKS is an ideal precursor for producing carbon that is activated, due to its durability, high carbon concentration, and minimal ash content [28]. The adsorption capacities of PP provide a dual advantage of removing pollutants from wastewater and promoting trash reduction, recovery, and reuse [29]. The WH contains 37.95% holocellulose, which gives it the ability to serve as an effective adsorbent material [30]. CC can be a viable substitute for the production of activated carbon, owing to its renewable nature, widespread accessibility, cost-effectiveness as a precursor, and notable capacity to adsorb various organic contaminants [31,32,33]. The distinctive characteristics of coal-based GR, including its structural strength, chemical inertness, and elevated area of surface, position it as a promising option for creating effective adsorbents in wastewater treatment applications [34].
Several studies have analyzed the performance of CS, PKS, PP, WHL, CC, and GR as adsorbents for the removal of organic contaminants, such as dyes and pharmaceuticals, as well as inorganic contaminants, including heavy metals. For instance, Rahim et al. [27] investigated the removal of heavy metals using a carbonized, dehydrated CS adsorbent that was chemically processed using sodium hydroxide (NaOH). Their findings indicated that all of the enhanced adsorbents suggested increased Pb (II) adsorption capacities, with dehydrated coconut waste char (DCWC)—NaOH achieving the highest removal effectiveness of 96% (Q = 29.854 mg/g). Lua’s study [22] demonstrated that PKS oxidized with sulfuric acid to create PKS-Sulfo, within optimized conditions, achieved removal efficiencies of approximately 85% for Cr6+ and 77% for Pb2+. In a separate investigation, Neolaka et al. [23] evaluated the efficacy of an adsorbent derived from PP activated using lime juice, which produced 83.25% removal efficiency under optimum conditions. In Dhinesh et al.’s [14] study, the alkali-activated WHL had a maximum ammonium removal effectiveness of around 83% when created at a temperature of 500 °C, with a residence time of 60 min. Bo et al. [20] assessed the execution of solid remains from corn cobs that were degraded using oxalic acid and subsequently treated with polyethyleneimine (PEI) and catechol to create adsorbents. Their findings exhibited that the highest equilibrium adsorption capacity for Congo red (CR) dye was approximately 650 mg/g. Wang et al. developed a graphene nanosheet (GNS) adsorbent for the adsorption of methylene blue, achieving a remarkable removal efficiency of approximately 99.0% in just 20 min, with a maximum adsorption capacity of 1092.1 mg/g.
This work is, to our knowledge, the first to comprehensively evaluate the adsorption performance of six organic adsorbents, three commercial (coconut shells, palm kernel shells, graphite) and three waste-based (plantain peels, water hyacinth leaves, corn cobs), for removing dissolved organic matter (DOM) using potting soil extract as a test medium. While potting soil has been employed in membrane studies to simulate humic-rich water (e.g., Quilitzsch et al., 2016 [35]; Gronwald et al., 2020 [36]), its use in adsorption studies for DOM removal has not yet been explored. Moreover, although previous studies, such as Tolkou et al. (2024) [37], have compared fruit-peel-derived adsorbents for dye removal, there has been no systematic study comparing adsorbents across both commercial and biomass waste categories under unified experimental conditions for DOM. This work combines realistic water chemistry with a multi-criteria evaluation, encompassing material characterization, kinetic and isotherm modeling, thermal analysis, and cost assessment to identify effective, low-cost, and scalable adsorbent materials. Moreover, this study introduces a significant novelty by systematically identifying the dominant factors governing adsorbent performance through the direct comparison of six distinct materials. The integrated approach not only addresses a clear research gap, but also offers practical guidance for decentralized water treatment technologies in resource-constrained settings, making the study both novel and highly relevant to the global pursuit of sustainable water purification solutions.
This study aligns with several of the United Nations Sustainable Development Goals (SDGs), emphasizing its contribution to global sustainability efforts. Primarily, it supports SDG 6: Clean Water and Sanitation by advancing affordable and effective organic adsorbents for removing dissolved organic matter (DOM) from water, thereby improving water quality and public health. Additionally, the research promotes SDG 12: Responsible Consumption and Production through the valorization of abundant agricultural and biomass wastes into functional adsorbent materials, fostering waste reduction and circular economy principles. Furthermore, this work contributes to SDG 13: Climate Action by developing low-energy, environmentally friendly water purification methods that minimize the ecological footprint compared to conventional water treatment technologies. Integrating these SDGs highlights the broader impact and societal relevance of the study in addressing pressing water treatment challenges sustainably.
2. Materials and Methods
2.1. Coconut Shells, Palm Kernel Shells, Plantain Peels, Water Hyacinth Leaves, Corn Cobs, and Graphite Adsorbents
Coconut shells (CS), palm kernel shells (PKS), and graphite (GR) adsorbents were purchased from e-commerces (Nonogi and Global Langgeng Mandiri) site in Jakarta, Indonesia. CS (Cocos nucifera L.), PKS (Elaeis guineensis), and GR particles were then ground in a ball mill and strained through a mesh filter until they reached a powdered consistency, using a particle diameter of 45 micrometer. Sieving adsorbents to 325 mesh (45 μm) is conducted to achieve a uniform fine particle size.
Plantain peels (PP), water hyacinth leaves (WHL), and corn cobs (CC) were sourced from Depok City, West Java, Indonesia. At first, PP (Musa paradisiaca L.), WHL (Eichhornia crassipes), and CC (Zea mays L.) were cleansed using distilled water to minimize the presence of any remaining substances. Afterwards, PP, WHL, and CC, which were both clean and dry, were cut into pieces measuring 1–2 cm in size. PP, WHL, and CC were subjected to further drying in an oven at 85 °C for approximately 24 h until a stable weight was reached. These materials were subsequently pulverized using a grinder. After that, PP and CC biomass underwent pyrolysis in a muffle furnace at temperatures of 600 °C for a duration of 2 h, while WHL biomass was pyrolyzed at 450 °C for 2 h. Furthermore, the charcoal granules underwent chemical activation by being immersed in a solution of 0.1 M H3PO4, prepared by diluting 85% Merck H3PO4 at a 1:10 (w/v) ratio over 24 h. Phosphoric acid (H3PO4) at an 85% purity level and sodium hydroxide (NaOH) at a concentration of 30% were procured from Merck Jakarta, Indonesia. H3PO4 is an economically viable and sustainable development catalyst for the activation of chemicals. It can decompose lignocellulosic materials at low temperatures without causing much damage to the equipment used for activation [38]. The charcoals were rinsed with distilled water and filtered using Whatman No. 1 after the filtrates achieved a neutral pH, followed by drying at 110 °C for a period of 24 h. PP, WHL, and CC particles were strained through a mesh filter until they reached a powdered consistency with a particle diameter of 45 μm. A schematic of the adsorbents’ preparation (CS, PKS, PP, WHL, CC, and GR) has been illustrated in Figure 1.
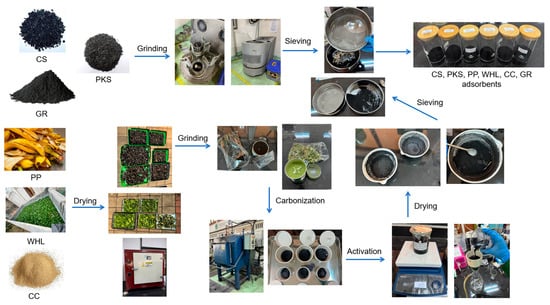
Figure 1.
Schematic depiction of the preparation processes for the adsorbents: CS, PKS, PP, WHL, CC, and GR.
2.2. Organic Material Extraction Solution from Potting Soil
The primary component of DOC in surface water consists of humic substances, accounting for 70 to 80%. Therefore, potting soil extract appears to be a suitable model system for studying surface water [35]. Synthetic model feed water based on extract of potting soil was utilized to assess the organic removal of mentioned charcoal. Extract potting soil is a mixture of 3.75 kg of Alitura Organics Premium Potting Soil, and it was further diluted with a warm tap water of 14.5 L at 60 °C and a 30% sodium hydroxide (NaOH) solution of 0.5 L. The entire mixture was left in a sealed/closed container overnight. This results in a concentration of NaOH in water of 0.35 N (1% NaOH solution) and a ratio of potting soil to extraction agent of 1:5. After the exposure time, the mixture or the liquid supernatant was filtered. Two filter bags were used (1st = 800 μm; 2nd = 100 μm) consecutively for this purpose [36]. The concentration of DOC in the feed solution was 19.76 mg/L, and UV 254 was 0.239 cm−1.
2.3. Analysis and Characterization
The total area and pore-size pattern of the CS, PKS, PP, WHL, CC, and GR adsorbents were determined using the Micromeritics ASAP 2020, employing nitrogen sorption at −196 °C. The sample underwent degassing at 200 °C for 4 h. The surface area was determined through Brunauer–Emmett–Teller (BET) method, while the Barrett–Joyner–Halenda (BJH) method was employed to assess micropores, mesopores, and macropores. BET analysis was conducted to ascertain total area (m2/g), pore width (nm), and overall volume of pores (cm3/g) of the adsorbents, utilizing Barrett–Joyner–Halenda (BJH) analysis. The morphological composition of activated carbons was analyzed using a microscope with scanning electrons (SEM, Zeiss Supra 40 VP, Oberkochen, Germany). The identification of functional groups in the activated carbons was accomplished using FTIR spectrum analyzer (Perkin-Elmer, Spectrum RX I, Shelton, CT, USA) with an operational band of 4000 cm−1–500 cm−1. An X-ray diffractometer (XRD, X’Pert PRO, PAnalytical, Malvern, UK) was employed to determine the crystal form of activated carbons. Thermogravimetric thermal analysis (TGA, Perkin Elmer STA 6000) was conducted at 30–1000 °C at a heating speed of 10 °C/m, utilizing N2 gas at a flow rate of 20 mL per min to assess the material’s mass loss and temperature stability. Thermogravimetric analysis and the corresponding TGA forms were utilized to evaluate the temperature stability of CS, PKS, PP, WHL, CC, and GR adsorbents.
2.4. Evaluation of Adsorption Study Performance
Batch studies were performed to examine the influence of several variables on organic substances removal, including duration of contact, dose of adsorbent, initial organic material extraction concentration, and temperatures. The detailed experiments are presented in Table 1. Kinetic studies involved a laboratory bottle containing adsorbent at 1 g/L and a fixed concentration of organic material extraction solution for varying contact times. To determine the impact of the dose of adsorbent on the process of adsorption, each 100 mL of organic material extraction solution was distributed into eight 250 mL flasks for 24 h with variations in adsorbent dosage. Isotherm studies explored the influence of the first amount of organic substances. The solutions were agitated for 24 h using a spinning shaker at 150 rpm and 25 °C. Temperature fluctuation was utilized to assess its impact on the adsorption process and to optimize the adsorption conditions. The solution was subsequently separated from the adsorbent utilizing 0.45 micron nitrate cellulose filters. The collected filtrate was later analyzed with a UV-Vis spectrophotometer (Shimadzu, Tokyo, Japan) at an intensity of 254 nm. The data from the ultraviolet–visible (UV-Vis) analysis was employed to determine the removal efficiency, and was graphically linked to the duration of contact, dose of adsorbent, the initial concentration, and temperature.

Table 1.
Experiment for performance assessment of adsorption studies.
The organic adsorption capacity of the adsorbents (CS, PKS, PP, WHL, CC, and GR adsorbents) was assessed applying Equation (1):
The components of the equation are delineated in this manner: denotes solution initial concentration (mg/L), signifies the concentration of the analytical substance at time t (mg/L), V indicates solution volume utilized (L) and m reflects mass of the adsorbent. Simultaneously, the efficacy of organic substance removal from samples of water was examined utilizing Equation (2):
where and denote the initial and remaining concentrations of organic substance (mg/L), respectively. The kinetic study examined the adsorption of organic substances utilizing both the pseudo-first-order (PFO) (Equation (3)) and pseudo-second-order (PSO) (Equation (4)) models [39].
where and denote the quantity of organic substance (mg/g) at a specific time t (min) and at the point of equilibrium, respectively. The constants (L/min) and (g/mg.min) represent the adsorption rates associated with the pseudo-first-order (PFO) and pseudo-second-order (PSO), respectively. t represents the duration of contact time measured (min).
Equilibrium experiments investigated the impact of the initial organic material extraction solution concentration. The data obtained from these experiments were analyzed utilizing the widely employed and straightforward Langmuir and Freundlich isotherm models [37,40]. Langmuir and Freundlich models are expressed quantitatively in Equations (5) and (6), respectively.
where denotes the adsorbate equilibrium concentrations within the solid/liquid phase (mg/g). denotes the peak adsorption capacity, representing the theoretical limit of a monolayer (mg/g). denotes the energy linked to the adsorption of organic substances, quantified in L/mg. is a constant correlated with adsorption capacity, while represents a constant corresponding to adsorption magnitude or surface heterogeneity.
The composite score is calculated to provide a single, quantitative value that reflects the overall performance of each adsorbent by combining several key parameters, each with its own weight based on importance.
- Parameter selection and weighting
Each relevant parameter is selected and assigned a weight (in percentage or decimal) reflecting its influence on adsorbent performance [27]:
- Surface Area: 10%
Surface area (10%) is included at a lower weight since only accessible surface areas (mainly mesopores) contribute to DOM adsorption; high microporosity does not always mean high DOM removal due to diffusion limitations.
- Mesopore Volume: 30%
Mesopore volume (30%) received the highest weight because mesopores (2–50 nm) enable efficient diffusion and adsorption of larger DOM molecules, which directly enhances adsorption capacity and kinetics.
- DOM Removal Efficiency: 30%
Removal efficiency (30%) also has a major share, as it reflects the true practical performance under application conditions and is a direct indicator of treatment efficacy.
- Initial Sorption Rate: 15%
Initial sorption rate (15%) is prioritized to account for operational efficiency, where rapid adsorption shortens treatment times.
- Thermal Stability: 10%
Thermal stability (10%) is essential for the potential regeneration and reuse of adsorbents, particularly in sustained or high-temperature applications.
- Cost: 5% (inversely weighted; lower cost is better)
Cost (5%) is assigned the smallest weight (inversely proportional), acknowledging the practical need for affordable solutions without sacrificing technical effectiveness.
- 2.
- Normalization
Each parameter value for all adsorbents is normalized to a 0–1 scale to ensure comparability.
For parameters where higher is better (e.g., efficiency, mesopore volume):
For parameters where lower is better (e.g., cost):
- 3.
- Weighted sum
Each normalized value is multiplied by its respective weight. All weighted values are then summed to obtain the composite score:
where i is each parameter.
- 4.
- Ranking
The composite scores are compared; the highest score indicates the best overall adsorbent.
3. Results and Discussion
3.1. Characteristics of Adsorbents
3.1.1. Brunauer–Emmett–Teller (BET) Analysis
According to Figure 2a, the N2 adsorption–desorption characteristics of CS, PKS, PP, and WHL follow type II, while CC follow type I, and GR follows type IV. Type II shows adsorption on mesoporous materials with a monolayer formation at low pressure and transitioning to a multilayer as pressure increases, approaching its saturation point. This type has one inflection point. This type can only be observed on adsorbents with micropores, nanopores, or solids with pore sizes >50 nm [41]. The type I characteristic is marked by the presence of a horizontal line on the graph, which persists at high-pressure gas, and can be explained as the Langmuir equation [42]. Type IV describes the behavior or properties of specific mesoporous materials that show pore condensation that takes place within desorption and adsorption branches. This type exhibits two inflection points [43]. In graphite, when the relative pressure is below 0.1, minimal nitrogen is adsorbed, signifying the presence of just a small amount of micropores. At a relative pressure of around 0.5–0.6, there is a notable increase in adsorption capacity, exhibiting a type IV adsorption isotherm. A discernible hysteresis loop signifies the presence of mesopores. The quantity of nitrogen absorbed by CC was the highest compared to other adsorbents (max. 142 cm3 g−1 STP), followed by CS with max. 103 cm3 g−1 STP, followed by PP (max. 69 cm3 g−1 STP), the next is WHL and GR (max. 38 cm3 g−1 STP), and the lowest quantity of nitrogen absorbed by PKS (max. 20 cm3 g−1 STP).
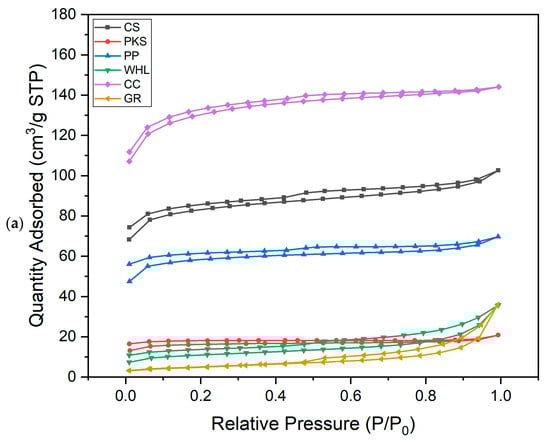
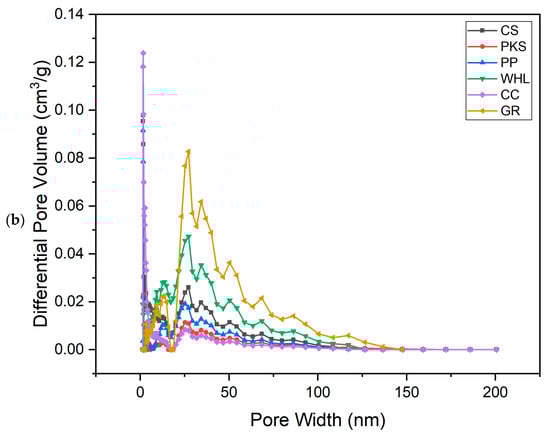
Figure 2.
N2 adsorption–desorption isotherm (a) and adsorption pore width distribution (b) for six adsorbents.
The summarized data for total pore volumes, BET surface areas, and micropore volumes of the adsorbents can be found in Table 2. Analyzing the pore size distribution presented in Figure 2b, it is evident that the pores of CS, PKS, PP, and CC are predominantly found within the range of 1.5–2 nm, indicating a concentration of smaller mesopores. In contrast, the majority of the pores in WHL fall within the range of 18–35 nm. For GR, the pore size is 20–30 nm. From Figure 2b, it can be seen that GR has the largest number of mesopores (max. 0.083 cm3/g), followed by WHL with max. 0.049 cm3/g, followed by CS (max. 0.028 cm3/g), then by PP (0.020 cm3/g), then by PKS (max. 0.010 cm3/g), and the lowest amount of mesopores is possessed by CC (max. 0.018 cm3/g).
Table 2.
Physical properties of CS, PKS, PP, WHL, CC, and GR adsorbents.
3.1.2. Scanning Electron Microscopy (SEM) and Energy-Dispersive X-Ray Spectroscopy (EDS) Analysis
The SEM images of CS, PKS, PP, WHL, CC, and GR, both prior to and subsequent to the adsorption procedure, were captured and depicted in Figure 3. The adsorbents (Figure 3 before adsorption) demonstrated an extremely heterogeneous and uneven porous structure that facilitates the adsorption of organic substances. Figure 3, showing SEM images after adsorption, reveals an enlarged surface and pores covered by organic substances. Furthermore, the SEM images of PKS and PP reveal a purer and finer surface with a less porous structure in comparison to CS, WHL, CC, and GR. This might indicate a diminished adsorption capacity, owing to the decreased availability of active sites of adsorption for DOM binding [37].
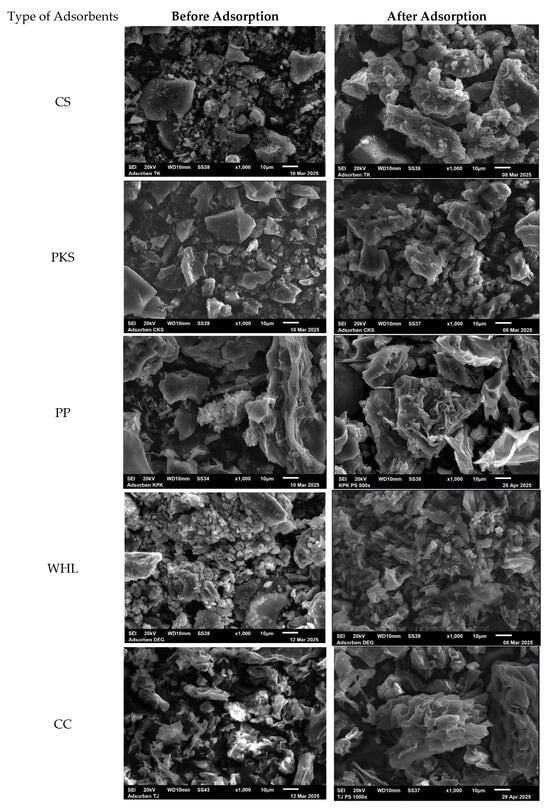
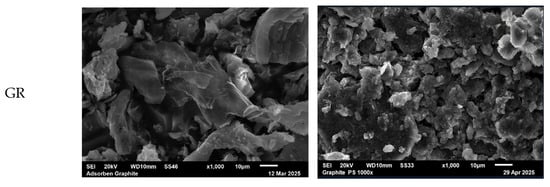
Figure 3.
SEM images of CS, PKS, PP, WHL, CC, and GR before organic adsorption and after organic adsorption with magnification .
Furthermore, adsorbent EDS analysis is conducted both before and during the process of DOM adsorption, with the findings presented in Table 3. Post-adsorption EDS analysis was conducted to ascertain any alterations in the elemental composition of the material surfaces, which may be actively involved in DOM removal. The data indicates that C and O elements were detected on the surfaces of CS, PKS, PP, WHL, CC, and GR at the following levels, respectively: 89.92 and 10.08%; 82.79 and 15.81%; 60.92 and 23.66%; 58.02 and 22.26%; 72.29 and 24.24%; and 79.59 and 17.92%. This confirms the heterogeneous distribution of these components across the surfaces examined. Following the adsorption process, a reduced percentage of carbon content is noted for CS, PKS, and GR, whereas an increased percentage of carbon content is recorded for PP, WHL, and CC. For CS, the appearance of Al and Ca is observed, while for WHL, the appearance of P and Ca is observed, and for GR, the appearance of Al, S, K, and Fe is identified, which may be associated with the processes of DOM removal and bindings.
Table 3.
Adsorbents’ chemical composition prior to and subsequent to DOM adsorption.
3.1.3. Analysis of Fourier Transform Infrared (FTIR)
The FTIR spectra of CS, PKS, PP, WHL, CC, and GR, both before and after the adsorption of organic substance, within the band 4000–400 cm−1, were analyzed and contrasted to elucidate the probable interactions between adsorbent and DOM. The compared spectra are presented in detail in Figure 4. The findings indicated the distinctive vibration of CS (Figure 4a) at 3458, 1637, 1406, 1287, 783, and 732 cm−1 might be attributed to the -OH hydroxyl compound, the double and triple bond of amides and carboxylates functional group, aliphatic nitro compounds, methyne (>CH-) skeletal C-C vibrations, and aliphatic chloro-compounds C-Cl stretch. The FTIR spectra of PKS, PP, and CC (Figure 4a) exhibit the characteristic bands at 3452, 3458, and 3472 cm−1, respectively (hydrogen bond, hydroxy group, H-bonded OH stretch, dimeric OH stretch, and secondary amino heterocyclic amine >N-H stretch) and 1638 cm−1 (amide, alkenyl C=C stretch, primary amine NH bend, and open-chain amino (-C=N-)). The bands at 3449, 1638, and 1074 cm−1 for WHL (Figure 4a) correspond to −OH hydroxyl compound, aromatic secondary amine >N-H stretch, amide, aromatic C-H in-plane bend, alkyl-substituted ether C-O stretch, phosphate ion, and silicate ion. The peak of graphite at 3448. 1638, 1032, 799, and 538 cm−1 is characteristic for the stretching vibrations of H-bonded OH stretch, secondary amino heterocyclic amine >N-H stretch, amide, alkenyl C=C stretch, methylene (>CH2) cyclohexane ring vibrations, aromatic C-H out-of-plane bend, primary amine CN stretch, and aliphatic phosphates (P-O-C stretch).
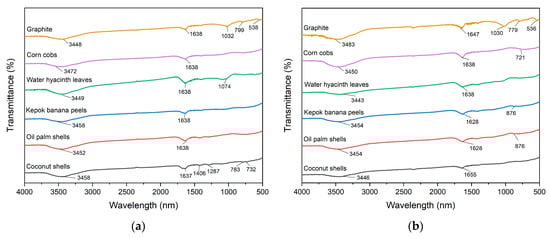
Figure 4.
FTIR spectra of CS, PKS, PP, WHL, CC, and GR adsorbents before (a) and after (b) DOM adsorption.
Figure 4b illustrates that several bands presented changes before and after adsorption of organic substances for CS, PKS, PP, WHL, CC, and GR. For CS, there are changes in the peak at 3458 cm−1 to 3446 (O-H stretch), indicating hydrogen bonding or deprotonation during adsorption and 1637 cm−1 to 1655 cm−1, suggesting carbonyl group involvement (organic substances–carboxylate interactions) [44]. For PKS and PP, there are changes in the peak at 3452 cm−1 to 3454 cm−1 (O-H stretch) and 1638 cm−1 to 1628 cm−1 (C=O), indicating interactions with hydroxyl and carboxyl groups [45]. For WHL, there is a change in the peak at 3449 cm−1 to 3443 cm−1 (O-H peak) and 1074 cm−1 (C-O peak) disappears, indicating hydroxyl group involvement and possible ester bond cleavage [46]. For CC, there is a change in the peak at 3472 cm−1 to 3450 cm−1 (O-H stretch) and a new peak at 721 cm−1 (metal-oxygen bonds), confirming ligand exchange. For GR, there are changes in the peak at 3448 cm−1 to 3483 cm−1 (O-H/N-H stretching), 1638 cm−1 to 1647 cm−1 (C=O stretching), 1032 cm−1 to 1030 cm−1 (C-O stretching), 799 cm−1 to 779 cm−1, and 538 cm−1 to 536 cm−1 (skeletal vibration of GR lattice). The absence of significant peak shifts or new bands in the FTIR spectrum after adsorption indicates that graphite’s surface functional groups are not chemically altered during the adsorption process. Furthermore, several other peaks that emerged after adsorption are indicative of the structural characteristics of the organic substances, especially seen on CS, at wavelengths of 1406, 1287, 783, and 732 cm−1. In addition, at 876 cm−1 for PKS and PP and 721 cm−1 for CC, there is evidence of bond formation between PKS, PP, CC and DOM molecules [47]. In conclusion, the hydroxyl (O-H), carbonyl (C=O), and saturated aliphatic functional groups (C-O) are likely to be significant in the adsorption of DOM on the surfaces of the adsorbents.
3.1.4. Analysis of X-Ray Diffraction (XRD)
Figure 5 shows a diffractogram produced from the XRD analysis, which represents the relationship between the two angles and the amount of scattering intensity. According to Figure 5, the two theta peaks of CS, PKS, WHL, and GR were seen at 27° and 29°, 30°, 26°, 28°, 30°, 32°, 35°, and 29°, respectively, which are associated with the presence of SiO2 (silica) in the CS [48], crystalline cellulose structure in the PKS [49] and WHL [50], and characteristic of the GR’s hexagonal crystal structure, indicative of a highly ordered layered structure of GR [51]. The XRD pattern of PP and CC showed broad, pump-like peaks instead of sharp, well-defined ones. This broad peak pattern suggests a low degree of crystallinity or an amorphous structure in the PP and CC materials. A broad peak was observed in the 2θ range of 18–32°, which is characteristic of amorphous silica structures [52].
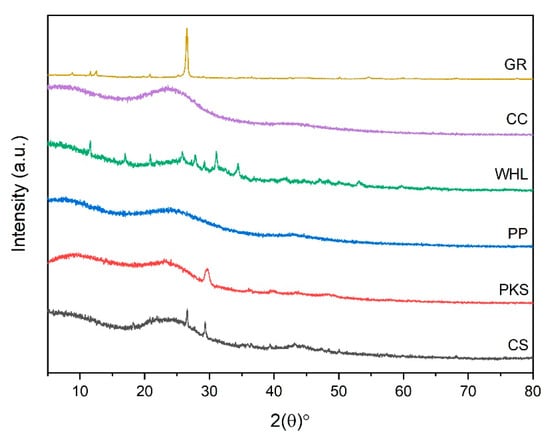
Figure 5.
Diffractogram of CS, PKS, PP, WHL, CC, and GR adsorbents.
3.1.5. Thermal Gravimetric Analysis (TGA)
The TGA and differential scanning calorimetry (DSC) curves (Figure 6) offer detailed insights into the thermal properties and stability of six adsorbents: CS, PKS, PP, WHL, CC, and GR. From the TGA curve (see Figure 6a), it is observed that all adsorbents experience an initial minor mass loss below 150 °C, primarily due to the evaporation of physically adsorbed water and volatile substances. The most substantial mass loss for the organic adsorbents (CS, PKS, PP, WHL, CC) occurs between 200 °C and 600 °C, corresponding to the decomposition of hemicellulose, cellulose, and lignin, the primary constituents of lignocellulosic materials. This is reflected by a steep decline in the relative mass, indicating rapid thermal degradation. In contrast, GR demonstrates exceptional thermal stability, maintaining most of its mass even at temperatures up to 1000 °C, which is indicative of its high resistance to thermal decomposition and suitability for repeated use in high-temperature applications [53].
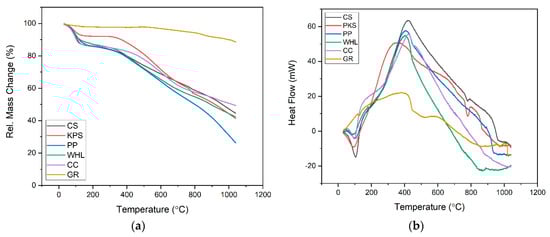
Figure 6.
TGA diagram: mass change (a) and heat flow (b) of CS, PKS, PP, WHL, CC, and GR.
The DSC curve (see Figure 6b) further elucidates the thermal events occurring within these materials. All adsorbents show small endothermic peaks below 150 °C, attributed to moisture loss. The organic adsorbents exhibit strong exothermic peaks between 200 °C and 600 °C, which align with the decomposition of their organic constituents [54]. The intensity and position of these peaks vary, reflecting differences in composition and structural stability; for example, CS and PKS display pronounced exothermic peaks around 350–400 °C, indicating significant energy release during decomposition, while PP and WHL decompose at slightly lower temperatures, suggesting lower thermal stability [55]. Graphite, on the other hand, shows only broad and low-intensity peaks, confirming its minimal decomposition and high thermal resilience.
In summary, the combined analysis of TGA and DSC curves reveals that graphite (GR) is the most thermally stable adsorbent, retaining the highest residual mass and exhibiting minimal thermal events, making it ideal for applications requiring high stability and reusability. CS and PKS offer moderate thermal stability, suitable for single or low-temperature cycles, while PP, WHL, and CC are less stable and best used in applications where thermal regeneration is not required [56]. These findings are consistent with literature reports on the thermal behavior of lignocellulosic and carbon-based adsorbents, underscoring the importance of thermal stability in adsorbent selection for water treatment and environmental applications [57].
3.2. Adsorption Kinetics
Figure 7 illustrates the influence of contact duration on the adsorption of DOM onto CS, PKS, PP, WHL, CC, and GR. The effect was analyzed over 2 to 4320 min (72 h). In nearly all instances, the 1440 min (24 h) of reaction was identified as the optimum contact time for subsequent batch studies, showing that equilibrium was attained, which suggests slow distribution and surface adsorption. This slow adsorption process may be attributed to the following [58]: (1) the adsorbate may encounter difficulty when infiltrating the interior structure of the adsorbent, (2) as readily available sites become occupied, the process of adsorption to the remaining sites becomes increasingly challenging and requires more time, and (3) weak interactions may exist between the adsorbent and the target pollutant.
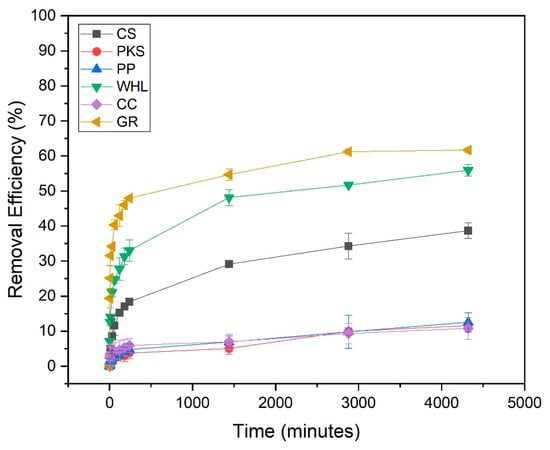
Figure 7.
Influence of contact time on the removal of DOM with CS, PKS, PP, WHL, CC, and GR; C0 19 mg/L DOC, dosage 1.0 g/L, T = 25 °C, and contact time 72 h (4320 min).
From Figure 7, GR adsorbent has the highest DOM removal efficiency (62%) compared to other adsorbents. This can be proven from the XRD results of GR in Figure 5, which states that the characteristics of the GR’s hexagonal crystal structure indicate a highly ordered layered structure of GR. GR exhibits a considerably greater certain surface area and a more advanced pore structure than most natural adsorbents. The stratified configuration provides a significant surface area for adsorption [59]. The carbonaceous composition of GR facilitates robust interactions with organic contaminants via mechanisms such as π-π interactions. This is exceptionally efficient for adsorbing aromatic chemicals and other organic substances. Natural adsorbents frequently exhibit an absence of this particular chemical affinity [60].
GR has a uniform and non-porous carbon structure [60]. Natural adsorbents may possess varying compositions and contaminants that might disrupt adsorption operations. Modified graphite has exhibited significant adsorption capabilities for several organic molecules. Xin et al.’s (2024) investigation showed that optimized GR attained a removal rate of 85% for dyes and organic substances [34]. While natural adsorbents like CS, PP, and CC can be effective for certain applications, their adsorption capabilities are often inferior to those of graphite based materials. For instance, CC-based activated carbon showed lower adsorption capacity for methane compared to optimized GR-based adsorbents [61].
From data obtained (see Figure 7), the adsorption rate of WHL is positioned subsequent to that of GR. This can be proven from the FTIR results of WHL (see Figure 4), which show that WHL contain hydroxyl (-OH), carboxyl (-COOH), and carbonyl (C=O) from cellulose, lignin, and hemicellulose. These groups form strong interactions (e.g., hydrogen bonding, electrostatic attraction) with DOM [62].
Adsorption kinetics are employed for explaining the adsorption rate and the mechanisms driving the entire process. The pseudo-first-order (PFO) (Figure 8), pseudo-second-order (PSO) (Figure 9), and intra-particle diffusion (Figure 10) were employed to examine the adsorption kinetics of DOM on CS, PKS, PP, WHL, CC, and GR adsorbents. The parameters of the kinetics derived from these three models are displayed in Table 4. The coefficient of correlation (R2 > 0.97) demonstrates that CS, PP, CC, and GR were found to align more closely with pseudo-second-order (PSO), indicating that the adsorption of DOM on the adsorbents occurs via chemisorption [63,64]. In the PSO model, the sorption rate (h) of GR (0.22 mg/g/min) was the fastest among all adsorbents.
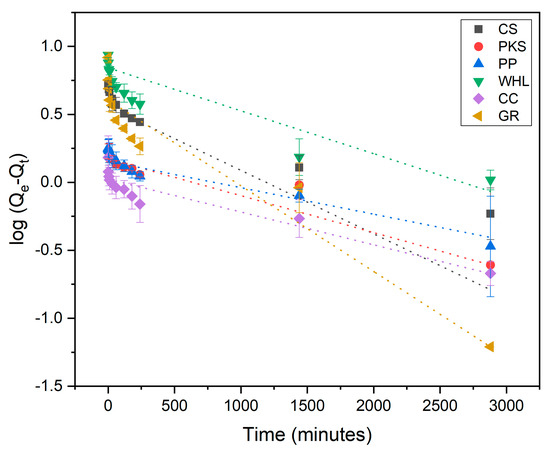
Figure 8.
Adsorption kinetics modeled using the pseudo-first-order (PFO) model; C0 19 mg/L DOC, dosage 1.0 g/L, T = 25 °C, and contact time 48 h (2880 min).
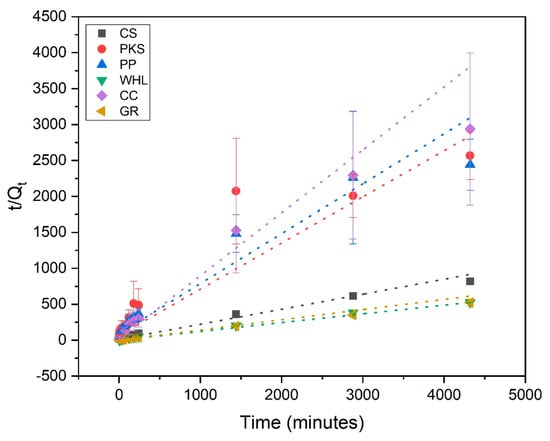
Figure 9.
Adsorption kinetics modeled using the pseudo-second-order (PSO) model; C0 19 mg/L DOC, dosage 1.0 g/L, T = 25 °C, and contact time 72 h (4320 min).
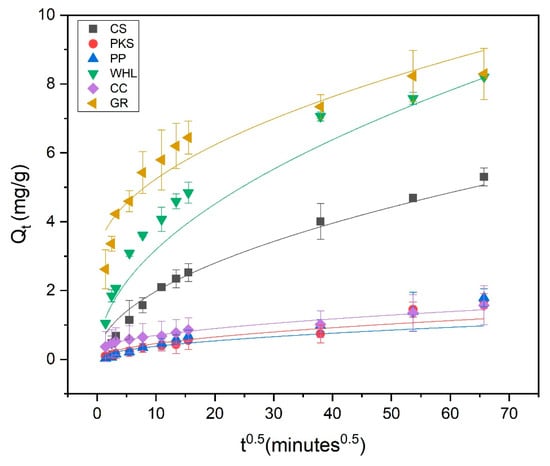
Figure 10.
Adsorption kinetics modeled using the intra-particle diffusion model; C0 19 mg/L DOC, dosage 1.0 g/L, T = 25 °C, and contact time 72 h (4320 min).
Table 4.
Parameters of kinetic regarding the adsorption of DOM.
Furthermore, adsorption kinetics of DOM on PKS conform to the pseudo-first-order (PFO), exhibiting an R2 value of 0.92, suggesting that the rate of adsorption is influenced by the diffusion of adsorbate molecules towards the surface or pores of the adsorbent. This is characteristic of physical adsorption (physisorption) rather than chemical bonding. Weak intermolecular forces (e.g., van der Waals) drive the process, as opposed to the stronger covalent/ionic interactions seen in chemisorption (which typically follow pseudo-second-order models) [65].
The adsorption of DOM onto the WHL demonstrated strong adherence to the intra-particle diffusion model, as indicated by the R2 value, i.e., 1.00, indicating a multi-stage adsorption mechanism where pore structure and diffusion kinetics govern the process. Adsorption occurs in three distinct stages: (1) external mass transfer: adsorbate diffuses through the boundary layer to the adsorbent surface, (2) macropore diffusion: molecules migrate into larger pores (meso-/macropores), and (3) micropore diffusion/equilibrium: slow diffusion into micropores or final equilibrium [66]. From Table 4, it can be seen that the C value for water hyacinth leaves was 0, suggesting that WHL have pure intra-particle diffusion control. In the concept of intra-particle diffusion, the initial line signifies diffusion via the film encasing the adsorbent, whereas the subsequent line represents diffusion within the liquid occupying the pores or along the pore walls [37]. The linear plot originating from the origin indicated that the rate-limiting phase was intra-particle diffusion for the DOM component [63]. The porous structure of the adsorbents was presumed to be the factor limiting the rate.
3.3. Adsorption Isotherms
Adsorption isotherms can be determined by altering the dosage of adsorbent while maintaining an adsorbate initial concentration constant, or by adjusting adsorbate initial concentration while maintaining the dosage of adsorbent constant [67]. Variations in adsorbent dosage were performed to examine the potential of CS, PKS, PP, WHL, CC, and GR for the efficient removal of DOM in organic material extraction solutions. The studies utilized initial concentration of 19 mg/L DOC for the organic material extraction solution, with a pH of 7.0, temperature of 25 °C, and contact period of 24 h, incorporating varying dosages of adsorbents ranging from 0.5 to 7.0 g/L. Figure 10 illustrates that GR exhibits the best effectiveness in DOM removal (7.0 g/L; 96%) relative to other adsorbents. GR possesses a unique structure with an extensive surface area and a significant volume of mesopores, which contributes significantly to its adsorption capacity [68]. This can be proven from the graph in Figure 2b, which illustrates that GR has the largest number of mesopores compared to the other five adsorbents. This structure allows for more effective interaction with organic pollutants, providing more sites for adsorption to occur.
Figure 2b illustrates the number of mesopores on the six adsorbents in order: GR > WHL > CS > PP > PKS > CC. Figure 10 illustrates that CC exhibits the lowest removal efficiency, because it has the smallest number of mesopores (see Figure 2b), even though CC has the largest number of micropores (see Figure 2b) and surface area (420.3255 m2/g, see Table 1) compared to the other five adsorbents. This is due to micropores (≤2 nm), which can provide a high surface area but are inaccessible to larger organic molecules. Their narrow size restricts diffusion and traps only small adsorbates. Mesopores (2–50 nm) act as transport channels, enabling larger molecules to reach adsorption sites. Their absence in CC limits mass transfer [69]. The research conducted by [70], which used carbonized corn cob (CCC) and commercial activated carbon (CAC), showed that corn cob’s pore structure (e.g., 98.5% micropores in CCC vs. 25.26% in CAC) creates a “bottleneck” for organic pollutants. Without mesopores, molecules cannot diffuse efficiently to micropores, rendering much of the surface area unusable.
The DOM adsorption for CS, PKS, PP, WHL, CC, and GR increased until the best adsorbent dosage was attained (see Figure 11), likely due to the adsorbent’s enhanced surface area and the availability of additional sites for adsorption. The decrease in organic absorption was negligible beyond the best adsorbent dosage, likely due to the formation of adsorbent aggregates that reduced the surface area that was accessible and obstructed certain organic adsorption sites [23].
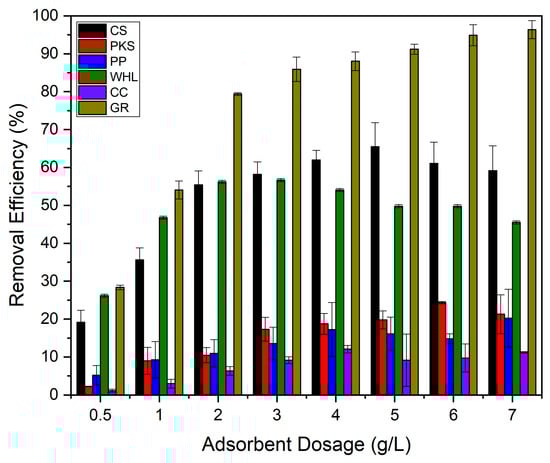
Figure 11.
Influence of adsorbents’ dosage on DOM removal with CS, PKS, PP, WHL, CC, and GR: C0 19 mg/L DOC, dosage 0.5–7.0 g/L, T = 25 °C, and contact time 24 h.
The influence of the initial concentration of the organic material extraction solution on the adsorption efficiency of CS, PKS, PP, WHL, CC, and GR was examined by varying the initial concentrations of organic substances to 11, 13, 15, 19, and 34 mg/L DOC, while sustaining a pH of 7.0 and an adsorbent dosage of 1.0 g/L for each organic material extraction solution and adsorbent. The data (Figure 12) indicated that the used adsorbent achieves optimal removal efficiency, which fluctuates with changes in the initial concentration. In particular, the best removal efficiency of coconut shells, PKS, PP, WHL, CC, and GR were 42%, 6%, 6%, 39%, 7%, and 62%, respectively, attained at initial concentrations of 13 mg L−1, 19 mg L−1, 19 mg L−1, 15 mg L−1, 19 mg L−1, and 11 mg L−1 DOC.
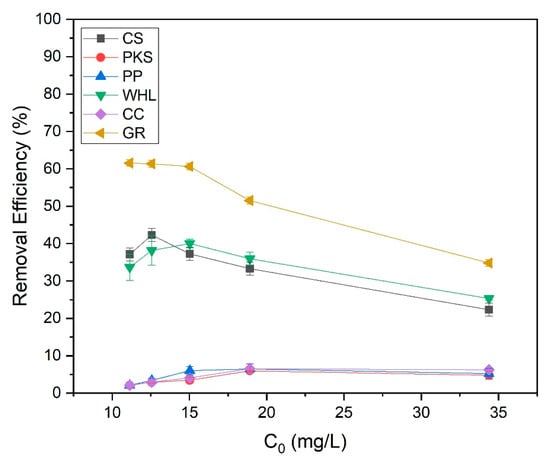
Figure 12.
Effect of initial organic substance concentration onto CS, PKS, PP, WHL, CC, and GR adsorbents; C0 19 mg/L DOC, dosage 1.0 g/L, T = 25 °C, and contact time 24 h.
The surface functional groups on CS, such as hydroxyl (O-H) and carboxyl groups, facilitate strong interactions with organic compounds at lower concentrations [71]. CS and GR have the highest removal efficiency at low initial concentrations (13 and 11 mg/L DOC). CS have a high microporous (<2 nm) surface area (see Figure 2b). These micropores provide abundant binding sites for small organic molecules at low concentrations. This is also proven by the results of FTIR testing of CS (Figure 4), which contain hydroxyl (-OH), carboxyl (-COOH), and carbonyl (C=O) on the biochar surface, enabling hydrogen bonding and electrostatic interactions with polar organics [72]. GR features a layered structure with interlayer spaces (3.35 Å) and basal planes that adsorb non-polar organics via π-π dispersion forces and hydrophobic interactions. At low concentrations, organic molecules diffuse easily into GR’s interlayers and adsorb without pore blockage [73]. At low concentrations, fewer molecules compete for active sites, maximizing adsorption efficiency.
WHL produced the best removal efficacy at a moderate initial concentration of 15 mg L−1 DOC. At 15 mg/L DOC, there is likely an optimal balance between the quantity of accessible adsorption sites on the adsorbents and organic substance concentration. For WHL, the plant’s cellular structure and functional groups on the surface interact optimally with organic compounds at this concentration [74]. At high initial concentrations (19 mg/L), the adsorption efficiencies of PKS, PP, and CC reached their maximum efficiencies. Compared to synthetic adsorbents, these materials may have a smaller surface area, restricting their adsorption capacity. The diverse functional groups on these adsorbents can lead to inconsistent binding affinities across different solution concentrations [75]. The adsorption efficacy of these bio-based materials can be significantly affected by changes in solution pH. From the test results (see Figure 13), it was obtained that the solution pH for the PP was basic (8.07–8.36), while the solution pH for the CC was acidic (5.62–6.71). pH affects protonation/deprotonation of functional groups on biosorbent surfaces [76]. At low pH, H+ ions contend with metal ions for sites of adsorption [77].
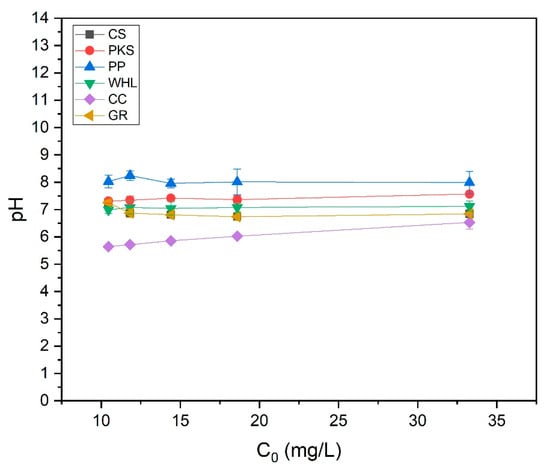
Figure 13.
pH of organic material extraction solutions using onto CS, PKS, PP, WHL, CC, and GR adsorbents with variations in initial concentration: 10, 12, 14, 19, and 33 mg/L DOC; dosage 1.0 g/L; T = 25 °C; contact time 24 h.
Figure 12 illustrates that at low concentrations, the adsorption efficiencies for PKS, PP, and CC were reduced due to the following [78]: (1) the gradient concentration between solution and the surface of adsorbent is not strong enough to promote effective mass transfer, and (2) many adsorbent active sites stay unoccupied, leading to lower overall efficiency. At high concentrations, efficiency decreased because of the following: (1) as concentration rises, accessible binding sites become saturated, limiting further adsorption, (2) multiple adsorbate molecules compete for the same binding sites, reducing overall efficiency. In addition, as illustrated in Figure 2b, the number of mesopores of PKS, PP, and CC is smaller compared to CS, WHL, and GR. Mesopores act as transport pathways to micropores. Smaller mesopore volumes reduce accessibility to high-energy adsorption sites in micropores, significantly lowering capacity. This is in accordance with research conducted by [79], which investigated the liquid-phase adsorption of phenol, iodine, and tannic acid onto commercial granular charcoal and charcoal fabric, focusing on the effects of mesopore volume and adsorbate size on adsorption capacity. From the results of this research, it was found that mesopores shorten diffusion paths to micropores. Without sufficient mesopores, adsorption equilibrium takes longer to achieve. Adsorbents with higher mesopore volume show double the adsorption capacity compared to low-mesopore materials [80].
This study utilized the Langmuir and Freundlich isotherm models to evaluate the equilibrium adsorption data of DOM onto CS, PKS, PP, WHL, CC, and GR adsorbents under optimal conditions. The experimental data were fitted to the models, with the resulting linear plots displayed in Figure 14, whereas Table 5 encapsulates the corresponding equilibrium constants and coefficients. The results indicate that the adsorption of DOM by CS, PKS, PP, WHL, CC, and GR align more closely with the Freundlich model, as seen by the determination coefficient (R2) values. The Freundlich adsorption isotherm is applicable to heterogeneous surfaces, with a high value of n signifying a robust interaction between the adsorbent surface and organic substances [81]. This finding is consistent with the assertion that biomass is a heterogeneous substance [82]. The Freundlich isotherm model assesses the favorability, unfavorability, or irreversible nature of adsorption by analyzing the n parameter. n quantifies the heterogeneity of adsorption sites and the energy distribution across the adsorbent surface. A higher value of n (n > 1) for CS, WHL, and GR indicates favorable adsorption and a heterogeneous surface with high-energy sites filling first, whereas n < 1 for PKS, PP, and CC suggests unfavorable adsorption, often linked to competitive effects (water molecules blocking sites at low concentrations) [83].
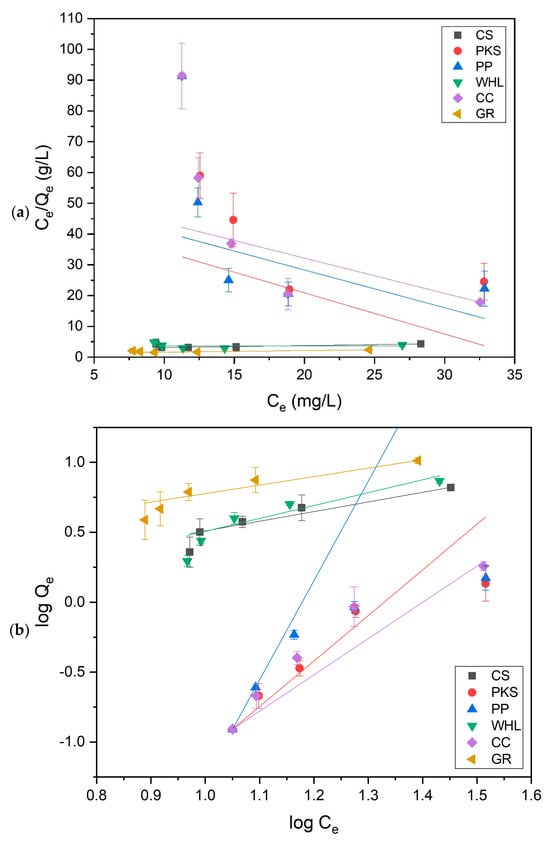
Figure 14.
Langmuir (a) and Freundlich (b) isotherm model on adsorption of organic substances onto CS, PKS, PP, WHL, CC, and GR.
Table 5.
Parameters of isotherms for the DOM adsorption.
The Freundlich constant (KF) reflects adsorption capacity [84]. The data in Table 5 exhibit that GR’s high KF arises from its inherently large surface area, tunable surface chemistry, and strong adsorbate-specific interactions (π–π stacking, electrostatic forces). These properties make it superior to many conventional adsorbents for organic and ionic contaminants. This is also evidenced from the results of the betting of the BET in Figure 2b, which indicates that GR possesses the greatest quantity of mesopores in comparison to the other five adsorbents. In addition, from the results of the XRD test (see Figure 5), the hexagonal GR structure indicates a highly ordered layered GR structure.
3.4. Thermodynamics
Figure 15 demonstrates that the DOM removal efficiency of CS, PKS, WHL, and GR escalated with rising temperature, while the DOM removal efficiency of PP and CC decreased with increasing temperature. The active sites in the CS, PKS, WHL, and GR that bind DOM exhibited an increase with rising temperature. Higher temperatures typically improve biosorption by increasing the surface activity and kinetic energy of the solute [85]. The adsorption efficiency increases with temperature for these adsorbents due to endothermic adsorption mechanisms and enhanced molecular interactions. The research conducted by [86] using activated coconut shells (ACS) to eliminate MB, exhibiting that methylene blue (MB) adsorption capacity rises from 20 °C to 60 °C. The study conducted by [87] using new carbon/CNT composites to remove a cationic dye, rhodamine B (RhB), from dye-contaminated wastewater, showed that rhodamine B (RhB) removal increases from 71% at 20 °C to 85% at 60 °C. Elevated temperatures increase the kinetic energy of adsorbate molecules, improving diffusion rates into adsorbent pores and collision frequency with active sites on CS, PKS, WHL, and GR.
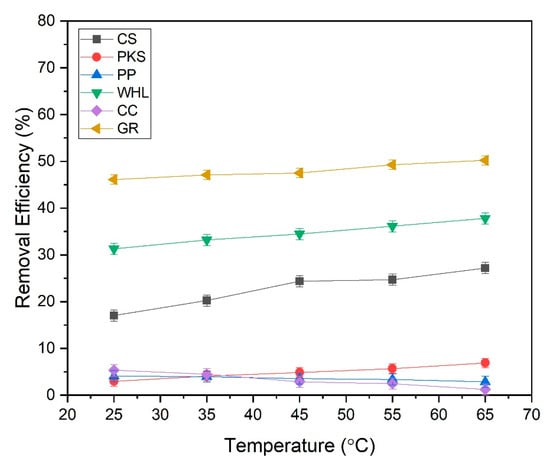
Figure 15.
Effect of temperature on the percentage removal of the studied DOM onto CS, PKS, PP, WHL, CC, and graphite with variations in temperatures: 25, 35, 45, 55, and 65 °C; C0 19 mg/L DOC; dosage 1.0 g/L; contact time 3 h (180 min).
However, a different thing happened in PP and CC; the efficiency of DOM removal decreased with increasing temperature. The reduction in adsorption efficacy as temperature rises in PP and CC can be attributed mainly to the exothermic characteristics of adsorption and the behavior of molecules. Most adsorption processes involving organic adsorbents release heat, making them thermodynamically favorable at lower temperatures [88]. This aligns with research conducted by [89] using banana peels to remove lead (Pb2+) from a water-based solution through batch experiments. The findings indicate that the percentage of Pb2+ elimination and uptake capacity rose from 73.84% to 87.94% as the adsorption temperature decreased from 60 °C to 25 °C. The decrease in adsorption capacity of adsorbents as temperature increases indicates an exothermic adsorption reaction. Many studies have indicated that the use of biosorption processes are exothermic, implying that adsorption capacity diminishes with rising temperatures. Higher temperatures result in the reduction of active adsorption sites on the bioadsorbent, causing them to migrate from the surface into the solution.
3.5. Economic Evaluation of CS, PKS, PP, WHL, CC, and GR
The estimation of adsorbent costs for DOM adsorption is critical, as it affects their usability and feasibility in water and wastewater treatment. The price of the adsorbent significantly affects the overall cost of the adsorption reaction for DOM elimination. The estimation of the adsorbent’s cost was conducted utilizing the methods applied by [27]. The projected cost breakdown for the production of 1 kg of CS, PKS, PP, WHL, CC, and GR adsorbents is presented in Table 6. The estimations encompassed the expenses associated with the chemicals utilized (e.g., H3PO4), along with the costs related to drying, grinding, and carbonizing processes. The prices for the basic supplies (the adsorbent) for CS, PKS, and GR was IDR 24,000/kg; IDR 22,820/kg; and IDR 102,375/kg, respectively. Meanwhile, the raw materials for PKS, WHL, and CC were obtained free of charge as waste in the environment. The costs of producing 1 kg of CS, PKS, PP, WHL, CC, and GR were IDR 75,020; IDR 73,722; IDR 270,215; IDR 266,475; IDR 266,475; and IDR 112,612.5, respectively. The 12% savings figure for PP, WHL, and CC reflects a conservative and realistic estimate of the economic benefits obtained by diverting agricultural and biomass wastes from conventional disposal routes (such as landfill or incineration) toward their valorization as adsorbent raw materials. This percentage represents the approximate reduction in overall waste management costs, specifically savings on transportation, tipping fees, landfill charges, incineration costs, and compliance with environmental regulations that local municipalities and industries would otherwise incur for disposal [90,91].
Table 6.
Detailed breakdown of the estimated costs for 1 kg of CS, PKS, PP, WHL, CC, and GR adsorbents.
The price for 1 kg of readily available activated carbon (CS, PKS, and GR) ranges from IDR 73,000–113,000, which is relatively low compared to the cost of producing organic waste adsorbents (PP, WHL, and CC). The price estimates indicate that PP, WHL, and CC are not viable economical alternatives for commercially available activated carbon in the adsorption of DOM. However, they can contribute to environmental sustainability by serving as adsorbents for water and wastewater treatment, thereby reducing waste.
3.6. Comparison of Characterization, Mechanism, Kinetics, Isotherm, and Thermodynamics of CS, PKS, PP, WHL, CC, and GR in Removing DOM
The comparative analysis of six adsorbents, CS, PKS, PP, WHL, CC, and GR, in removing DOM are presented in Table 7. The quantitative assessment of adsorbent materials for DOM removal relies on a set of critical parameters, each reflecting a distinct aspect of adsorbent performance. Assigning appropriate weights to these parameters ensures a balanced evaluation that accounts for both technical efficiency and practical feasibility.
Table 7.
Quantitative comparison and composite scores of CS, PKS, PP, WHL, CC, and GR in removing DOM.
Surface area (m2/g), weighted at 10%, represents the total available sites for adsorption. A higher specific surface area generally correlates with increased adsorption capacity, as adsorption is fundamentally a surface phenomenon [92].
Mesopore volume (cm3/g), assigned the highest weight at 30%, is crucial for the adsorption of larger organic molecules. Mesopores (2–50 nm in diameter) provide channels that not only increase the overall capacity, but also improve the diffusion and accessibility of adsorbates to the internal surface of the adsorbent [93].
DOM removal efficiency (%), weighted at 30%, directly measures the maximum performance of the adsorbent in removing target pollutants. This parameter is central to practical applications, as it reflects the ability of the material to achieve regulatory or treatment goals [94].
Initial sorption rate (mg/g/min), with a weight of 15%, captures the speed at which adsorption occurs. Fast sorption rates are desirable for operational efficiency, reducing contact time and reactor volume requirements [95].
Thermal stability, weighted at 10%, reflects the material’s suitability for regeneration and reuse. Adsorbents with high thermal stability can withstand repeated regeneration cycles, typically involving elevated temperatures, without significant loss of performance [96].
Cost (IDR/kg), assigned a weight of 5% (inversely weighted), addresses the economic feasibility of the adsorbent. While technical performance is critical, the practicality of deploying an adsorbent at scale depends heavily on its cost, which includes raw material price, processing, and regeneration expenses [97].
Table 7 exhibits that GR emerges as the most effective adsorbent, as reflected by its highest composite score (0.89). This superiority is not coincidental; it stems from GR’s consistently strong performance across the most influential parameters, such as mesopore volume, DOM removal efficiency, initial sorption rate, and thermal stability. Although its cost is not the lowest among the group, the exceptional efficiency and reusability of GR more than compensate for the higher investment, rendering it especially appropriate for advanced water treatment applications where high standards and operational longevity are required. The data indicate that GR’s pore structure and surface chemistry are optimized for rapid and effective adsorption, ensuring its dominance in both single-use and regenerative systems.
CS stands out as the best compromise between cost and performance. While it does not reach the removal efficiency or thermal resilience of GR, CS achieves a solid composite score due to its moderate to high values in surface area, removal efficiency, and especially its low cost. This balance makes CS a pragmatic choice for scenarios where budget constraints are significant, but moderate contaminant removal is still necessary. Its natural abundance and relatively simple processing further enhance its appeal for widespread or decentralized water treatment solutions.
WHL offer a unique value proposition, particularly from a sustainability perspective. Although WHL’s composite score (0.38) is moderate, primarily limited by low thermal stability and higher processing costs, it performs reasonably well in mesopore volume and removal efficiency. The use of WHL as an adsorbent not only addresses the pressing issue of invasive aquatic weed management but also provides an environmentally friendly option for pollutant removal. WHL is best suited for single-use or low-temperature applications, especially in regions where water hyacinth is abundant and waste valorization is a priority.
In contrast, PKS, CC, and PP occupy the lower end of the performance spectrum. Their composite scores are diminished by weaker results in key parameters such as mesopore volume, removal efficiency, and sorption rate. Notably, despite the exceptionally high surface area of CC, its low mesopore accessibility and limited functional group diversity hinder its practical effectiveness. These materials may still have a role in specific contexts, such as local waste utilization or minimal treatment requirements, but they are less competitive for demanding water purification tasks.
Overall, the normalized and weighted composite scoring method reveals that effective DOM adsorption depends most critically on mesopore volume, removal efficiency, and thermal stability, rather than surface area alone. This analysis underscores the importance of considering multiple, application-relevant criteria when selecting adsorbents, offering a comprehensive framework for informed, data driven decision-making in water treatment technologies.
3.7. Comparative Study
The adsorption of different pollutants according to CS, PKS, PP, WHL, CC, and GR is shown in Table 8 and is consistent with the findings of this investigation. Compared to earlier research that often emphasized only maximal adsorption capacity (Qmax), the present work uses a composite score derived from multiple criteria: surface area, mesopore volume, DOM removal efficiency, initial sorption rate, thermal stability, and cost. Among all tested materials, GR exhibited an outstanding composite score (0.89), outperforming both traditional bio-based adsorbents and even many advanced materials from previous studies. GR achieved the highest DOM removal efficiency (96%), rapid sorption kinetics, and superior thermal stability, owing to its optimized mesoporous structure and π–π interaction capability, features typically absent in adsorbents such as raw CS, PKS, or CC, which were frequently reported in the earlier literature to have high surface areas but limited removal rates in real applications, due to low mesopore volume or pore accessibility.
Table 8.
Adsorption studies of various pollutants using CS-, PKS-, PP-, WHL-, CC-, and GR-based adsorbents.
Notably, the use of WHL and CS also represents progress compared to previous waste-based adsorbents. While their composite scores (0.38 and 0.45, respectively) are moderate, they demonstrate better holistic performance than PKS, PP, and CC, especially in terms of cost-effectiveness and practical sustainability. The results confirm that previous limitations, such as excessive microporosity or minimal mesopore volume in materials like CC, can be overcome either by selecting better-suited raw materials (like WHL) or by tailoring pore structure and surface chemistry (as in GR). Thus, the present study provides a more nuanced framework for evaluating adsorbent performance and underlines that future research should combine both high adsorption efficiency and operational practicality, an approach not commonly seen in earlier research.
4. Conclusions
This study systematically evaluated the adsorption performance of six organic adsorbents—three commercial (graphite [GR], coconut shells [CS], and palm kernel shells [PKS]) and three waste-derived (plantain peels [PP], water hyacinth leaves [WHL], and corn cobs [CC])—for the removal of dissolved organic matter (DOM) from aqueous solutions. Among all adsorbents, GR achieved the greatest removal efficacy at 96%, followed by CS (65%), WHL (57%), PKS (24%), PP (20%), and CC (12%).
Adsorption kinetics revealed that GR, CS, PP, and CC followed pseudo-second-order, suggesting that chemisorption is the rate-limiting factor. PKS best fitted the pseudo-first-order model, while WHL exhibited intra-particle diffusion-controlled behavior, reflecting its porous structure and heterogeneous surface. The Freundlich isotherm demonstrated the most accurate fit for equilibrium data among all adsorbents, indicating multilayer adsorption on heterogeneous surfaces.
GR is the most thermally stable adsorbent, retaining the highest residual mass and exhibiting minimal thermal events, making it ideal for applications requiring high stability and reusability. CS and PKS offer moderate thermal stability, suitable for single or low-temperature cycles, while PP, WHL, and CC are less stable and best used in applications where thermal regeneration is not required.
While surface area is important, adsorption efficiency and kinetics are more strongly influenced by pore accessibility, surface chemistry, and thermal stability. GR and WHL stand out as the most effective adsorbents in this group, with GR being the top performer overall due to its combination of high efficiency, stability, and rapid kinetics.
GR emerges as the most effective adsorbent, as reflected by its highest composite score (0.89). This superiority is not coincidental; it stems from GR’s consistently strong performance across the most influential parameters, such as mesopore volume, DOM removal efficiency, initial sorption rate, and thermal stability. CS stands out as the best compromise between cost and performance. WHL offer a unique value proposition, particularly from a sustainability perspective. In contrast, PKS, CC, and PP occupy the lower end of the performance spectrum.
The findings highlight the practicality of employing affordable, waste-derived adsorbents for localized water purification. By converting agricultural and invasive biomass into functional materials, the findings promote both environmental remediation and circular economy principles. Future research should address adsorbent regeneration, application in real wastewater systems, and scaling strategies for rural and peri-urban deployment.
Author Contributions
Conceptualization, S.L., N.P., A.M.F. and T.M.I.M.; Methodology, R.A.K., S.L. and K.R.; Software, N.P. and T.M.I.M.; Validation, N.P., A.M.F. and T.M.I.M.; Formal analysis, R.A.K., S.L., A.M.F. and T.M.I.M.; Investigation, R.A.K. and N.P.; Data curation, S.L. and K.R.; Writing—original draft, R.A.K.; Writing—review & editing, R.A.K., F.A., S.L., N.P., A.M.F. and T.M.I.M.; Supervision, F.A., S.L., N.P. and T.M.I.M.; Project administration, F.A., N.P. and K.R.; Funding acquisition, S.L., N.P., A.M.F. and K.R. All authors have read and agreed to the published version of the manuscript.
Funding
This research and the APC were funded by International Indexed Publication (PUTI) Q1 University of Indonesia, grant number NKB-524/UN2.RST/HKP.05.00/2024.
Data Availability Statement
The authors affirm that the data underpinning the findings of this study can be found within the article.
Acknowledgments
Authors would like to thank the International Indexed Publication (PUTI) Q1 University of Indonesia 2024 for funding the material needed in the experimental work and Indonesian National Research and Innovation Agency (BRIN) for adsorbent characterization testing.
Conflicts of Interest
The authors declare no competing interests.
References
- Lewandowski, J.; Meinikmann, K.; Krause, S. Groundwater–surface water interactions: Recent advances and interdisciplinary challenges. Water 2020, 12, 296. [Google Scholar] [CrossRef]
- Wasewar, K.L.; Singh, S.; Kansal, S.K. Process intensification of treatment of inorganic water pollutants, in Inorganic pollutants in water. In Inorganic Pollutants in Water; Elsevier: Amsterdam, The Netherlands, 2020; pp. 245–271. [Google Scholar]
- Kolya, H.; Kang, C.-W. Toxicity of metal oxides, dyes, and dissolved organic matter in water: Implications for the environment and human health. Toxics 2024, 12, 111. [Google Scholar] [CrossRef] [PubMed]
- Zheng, X.; Xu, Z.; Liu, J.; Luo, Y.; Gu, L.; Zhao, D.; Hu, S.; Pan, X. Multiple roles of dissolved organic matter on typical engineered nanomaterials: Environmental behaviors, pollutants removal and potential risks. Carbon Res. 2022, 1, 27. [Google Scholar] [CrossRef]
- Chen, J.; Wan, N.; Wang, D.; Zhang, W. Molecular properties and biotoxicity of dissolved organic matter leached from microplastic (MP-DOM) during typical hydrothermal treatment of sewage sludge. Sci. Total Environ. 2023, 892, 164548. [Google Scholar] [CrossRef]
- Zhang, R.; Sun, B.; Song, Y.; Chen, X.; Song, C.; Wei, Z.; Su, X.; Zhang, C.; Wu, Z. Evaluating the phytotoxicity of dissolved organic matter derived from black carbon. Sci. Total Environ. 2021, 778, 146231. [Google Scholar] [CrossRef]
- Health Canada. Guidance on Natural Organic Matter in Drinking Water; Water and Air Quality Bureau, Healthy Environments and Consumer Safety Branch: Ottawa, ON, Canada, 2020. [Google Scholar]
- Regan, S.; Hynds, P.; Flynn, R. An overview of dissolved organic carbon in groundwater and implications for drinking water safety. Hydrogeol. J. 2017, 25, 959–967. [Google Scholar] [CrossRef]
- Knap-Bałdyga, A.; Żubrowska-Sudoł, M. Natural organic matter removal in surface water treatment via coagulation—Current issues, potential solutions, and new findings. Sustainability 2023, 15, 13853. [Google Scholar] [CrossRef]
- He, H.; Sun, N.; Li, L.; Ai, J.; Zhou, H.; Yang, X.; Yang, X.; Wang, D.; Zhang, W. Effects of dissolved organic matter removal and molecular transformation in different water treatment processes on formation of disinfection byproducts. Water Res. 2023, 245, 120626. [Google Scholar] [CrossRef]
- Sun, W.; Zhang, Y.; Lu, Z.; Ke, Y.; Wang, X.; Wu, J. Fate of naturally dissolved organic matter and synthetic organic compounds subjected to drinking water treatment using membrane, activated carbon, and UV/H2O2 technologies. Environ. Sci. Technol. 2023, 57, 5558–5568. [Google Scholar] [CrossRef]
- Sillanpää, M. Natural Organic Matter in Water: Characterization and Treatment Methods; Butterworth-Heinemann: Oxford City, UK, 2014. [Google Scholar]
- Shi, Y.; Hu, H.; Ren, H. Dissolved organic matter (DOM) removal from biotreated coking wastewater by chitosan-modified biochar: Adsorption fractions and mechanisms. Bioresour. Technol. 2020, 297, 122281. [Google Scholar] [CrossRef]
- Dhinesh, R.; Aruna, S.; Ravaneswaran, K.; Kirthiga, S.S.; Keerthivarman, S.G.; Al-Ghanim, K.S.; Kamaraj, C. Aquatic weed Eichhornia crassipes as sustainable feedstocks for biochar production: A potential of ammonium adsorption and kinetic models. J. Clean. Prod. 2024, 459, 142566. [Google Scholar] [CrossRef]
- Iheanacho, O.C.; Nwabanne, J.T.; Obi, C.C.; Onu, C.E. Packed bed column adsorption of phenol onto corn cob activated carbon: Linear and nonlinear kinetics modeling. S. Afr. J. Chem. Eng. 2021, 36, 80–93. [Google Scholar] [CrossRef]
- Alterary, S.S. Functionalized gum acacia–activated carbon-CaO/NiO nanocomposite for potential photocatalytic removal of organic pollutants from water. Environ. Sci. Pollut. Res. 2023, 30, 113520–113537. [Google Scholar] [CrossRef]
- Teymourinia, H.; Alshamsi, H.A.; Al-nayili, A.; Sohouli, E.; Gholami, M. Synthesis of new photocatalyst based on g-C3N4/N, P CQD/ZIF-67 nanocomposite for ciprofloxacin degradation under visible light irradiation. J. Ind. Eng. Chem. 2023, 125, 259–268. [Google Scholar] [CrossRef]
- Setiawan, A.; Kusumawati, T.A.; Ramadani, T.A.; Wang, Y.-F.; Kusumawardani, A.; Dermawan, D. Composite of activated carbon-hydroxyapatite from corn (Zea mays L.) cob and catfish (Pangasius sp.) bones with H3PO4 activation for methylene blue dye adsorption. Inorg. Chem. Commun. 2024, 167, 112744. [Google Scholar] [CrossRef]
- Wagh, M.P.; Aher, Y.; Mandalik, A. Potential of moringa oleifera seed as a natural adsorbent for wastewater treatment. Trends Sci. 2022, 19, 2019. [Google Scholar] [CrossRef]
- Bo, J.; Shi, B. Performances of residues from hydrolyzed corn-cobs for the adsorption of Congo red. Ind. Crops Prod. 2024, 220, 119311. [Google Scholar] [CrossRef]
- Adorna, J., Jr.; Borines, M.; Doong, R.-A. Coconut shell derived activated biochar–manganese dioxide nanocomposites for high performance capacitive deionization. Desalination 2020, 492, 114602. [Google Scholar] [CrossRef]
- Baby, R.; Hussein, M.Z.; Zainal, Z.; Abdullah, A.H. Preparation of functionalized palm kernel shell bio-adsorbent for the treatment of heavy metal-contaminated water. J. Hazard. Mater. Adv. 2023, 10, 100253. [Google Scholar] [CrossRef]
- Neolaka, Y.A.B.; Baunsele, S.D.; Nitbani, F.O.; de Rozari, P.; Widyaningrum, B.A.; Lawa, Y.; Amenaghawon, A.N.; Darmokoesoemo, H.; Kusuma, H.S. Preparation of cellulose adsorbent based on banana peel waste (Musa paradisiaca): Green activation and adsorption of Rhodamine B from the aquatic environment. Nano-Struct. Nano-Objects 2024, 38, 101146. [Google Scholar] [CrossRef]
- Flores-Rojas, A.I.; Modellin-Castillo, N.A.; Cisneros-Ontiveros, H.G.; Acosta-Doporto, G.A.; Cruz-Briano, S.A.; Leyva-Ramos, R.; Berber-Mendoza, M.S.; Diaz-Flores, P.E.; Ocampo-Perez, R.; Labrada-Delgado, G.J. Detection and mapping of the seasonal distribution of water hyacinth (Eichhornia crassipes) and valorization as a biosorbent of Pb (II) in water. Environ. Sci. Pollut. Res. 2023, 31, 40190–40207. [Google Scholar] [CrossRef]
- Kang, M.; Zhao, H.; Ye, J.; Song, W.; Shen, H.; Mi, J.; Li, Z. Adsorption dominant sodium storage in three-dimensional coal-based graphite microcrystal/graphene composites. J. Mater. Chem. A 2019, 7, 7565–7572. [Google Scholar] [CrossRef]
- Chen, J.; Duan, Q.; Ji, C.; Liu, J.; Wang, Z.; Song, J.; Zhang, C. Modified coconut shell biochars (MCSBCs): Fabrication and their adsorptions for Pb (II). Heliyon 2024, 10, e32422. [Google Scholar] [CrossRef]
- Rahim, A.R.A.; Johari, K.; Rabat, N.E.; Hussain, M.; Shezad, N.; Park, Y.-K. Isothermal, kinetic, thermal, and economic characteristics of NaOH-modified charred–desiccated coconut waste as adsorbent for lead (II) in water phase. J. Ind. Eng. Chem. 2023, 127, 171–181. [Google Scholar] [CrossRef]
- Lua, A.C.; Jia, Q. Adsorption of phenol by oil–palm-shell activated carbons in a fixed bed. Chem. Eng. J. 2009, 150, 455–461. [Google Scholar] [CrossRef]
- Areti, H.A.; Jabesa, A.; Muleta, M.D.; Emena, A.N. Adsorptive performances and valorization of green synthesized biochar–based activated carbon from banana peel and corn cob composites for the abatement of Cr (VI) from synthetic solutions: Parameters, isotherms, and remediation studies. Heliyon 2024, 10, e33811. [Google Scholar] [CrossRef] [PubMed]
- Kabir, M.M.; Alam, F.; Akter, M.M.; Gilroyed, B.H.; Didar-ul-Alam, M.; Tijing, L.; Shon, H.K. Highly effective water hyacinth (Eichhornia crassipes) waste-based functionalized sustainable green adsorbents for antibiotic remediation from wastewater. Chemosphere 2022, 304, 135293. [Google Scholar] [CrossRef]
- Varela, C.F.; Moreno-Aldana, L.; Agámez-Pertuz, Y.Y. Adsorption of pharmaceutical pollutants on ZnCl2-activated biochar from corn cob: Efficiency, selectivity and mechanism. J. Bioresour. Bioprod. 2024, 9, 58–73. [Google Scholar] [CrossRef]
- Campos, N.F.; Guedes, G.A.J.C.; Oliveira, L.P.S.; Gama, B.M.V.; Sales, D.C.S.; Rodriguez-Diaz, J.M.; Barbosa, C.M.B.M.; Duarte, M.M.M.B. Competitive adsorption between Cu2+ and Ni2+ on corn cob activated carbon and the difference of thermal effects on mono and bicomponent systems. J. Environ. Chem. Eng. 2020, 8, 104232. [Google Scholar] [CrossRef]
- Rovani, S.; Rodrigues, A.G.; Medeiros, L.F.; Cataluna, R.; Lima, E.C.; Fernandes, A.N. Synthesis and characterisation of activated carbon from agroindustrial waste—Preliminary study of 17β-estradiol removal from aqueous solution. J. Environ. Chem. Eng. 2016, 4, 2128–2137. [Google Scholar] [CrossRef]
- Xin, Y.; Bay, Y.; Wu, X.; Zhang, D.; Weihua, A.; Fang, M.; Huang, Z.; Yao, Y. Adsorption Performance of Modified Graphite from Synthetic Dyes Solutions. Materials 2024, 17, 4349. [Google Scholar] [CrossRef]
- Quilitzsch, M.; Osmond, R.; Krug, M.; Heijnen, M.; Ulbricht, M. Macro-initiator mediated surface selective functionalization of ultrafiltration membranes with anti-fouling hydrogel layers applicable to ready-to-use capillary membrane modules. J. Membr. Sci. 2016, 518, 328–337. [Google Scholar] [CrossRef]
- Gronwald, O.; Frost, I.; Ulbricht, M.; Shalmani, A.K.; Panglisch, S.; Grunig, L.; Handge, U.A.; Abetz, V.; Heijnen, M.; Weber, M. Hydrophilic poly (phenylene sulfone) membranes for ultrafiltration. Sep. Purif. Technol. 2020, 250, 117107. [Google Scholar] [CrossRef]
- Tolkou, A.K.; Tsoutsa, E.K.; Kyzas, G.Z.; Katsoyiannis, I.A. Sustainable use of low-cost adsorbents prepared from waste fruit peels for the removal of selected reactive and basic dyes found in wastewaters. Environ. Sci. Pollut. Res. 2024, 31, 14662–14689. [Google Scholar] [CrossRef]
- Jawad, A.H.; Bardhan, M.; Islam, M.A.; Islam, M.A.; Syed-Hassan, S.S.A.; Surip, S.N.; ALOthman, Z.A.; Khan, M.R. Insights into the modeling, characterization and adsorption performance of mesoporous activated carbon from corn cob residue via microwave-assisted H3PO4 activation. Surf. Interfaces 2020, 21, 100688. [Google Scholar] [CrossRef]
- Revellame, E.D.; Fortela, D.L.; Sharp, W.; Hernandez, R.; Zappi, M.E. Adsorption kinetic modeling using pseudo-first order and pseudo-second order rate laws: A review. Clean. Eng. Technol. 2020, 1, 100032. [Google Scholar] [CrossRef]
- Kalam, S.; Abu-Khamsi, S.A.; Kamal, M.S.; Patil, S. Surfactant adsorption isotherms: A review. ACS Omega 2021, 6, 32342–32348. [Google Scholar] [CrossRef] [PubMed]
- Sultan, M.; Miyazaki, T.; Koyama, S. Optimization of adsorption isotherm types for desiccant air-conditioning applications. Renew. Energy 2018, 121, 441–450. [Google Scholar] [CrossRef]
- Inglezakis, V.J.; Poulopoulos, S.G.; Kazemian, H. Insights into the S-shaped sorption isotherms and their dimensionless forms. Microporous Mesoporous Mater. 2018, 272, 166–176. [Google Scholar] [CrossRef]
- Wang, G.; Li, N.; Xing, X.; Sun, Y.; Zhang, Z.; Hao, Z. Gaseous adsorption of hexamethyldisiloxane on carbons: Isotherms, isosteric heats and kinetics. Chemosphere 2020, 247, 125862. [Google Scholar] [CrossRef]
- Cundari, L.; Fanneza, A.L.; Arisma, N.C. Characterization of biosorbent from musa acuminata balbisian peel using FTIR spectroscopy and its application to cadmium (Cd) removal: Effect of activator type, pH, and biosorbent ratio. Chem. J. Tek. Kim. 2023, 9, 142. [Google Scholar] [CrossRef]
- Arifiyana, D. Biosorption of Fe (II) ions from aqueous solution using Kepok banana peel (Musa acuminate). JKPK (J. Kim. Dan Pendidik. Kim.) 2021, 6, 206–215. [Google Scholar] [CrossRef]
- Rao, H.J. Characterization Studies on Adsorption of Lead and Cadmium Using Activated Carbon Prepared from Waste Tyres. Nat. Environ. Pollut. Technol. 2021, 20, 561–568. [Google Scholar] [CrossRef]
- Munagapati, V.S.; Yarramuthi, V.; Kim, Y.; Lee, K.M.; Kim, D.-S. Removal of anionic dyes (Reactive Black 5 and Congo Red) from aqueous solutions using Banana Peel Powder as an adsorbent. Ecotoxicol. Environ. Saf. 2018, 148, 601–607. [Google Scholar] [CrossRef]
- Poornesh, M.; Bhat, S.; Bellairu, P.K.; McDermott, O. Enhancement of Tensile Strength of Coconut Shell Ash Reinforced Al-Si Alloys: A Novel Approach to Optimise Composition and Process Parameters Simultaneously. Processes 2024, 12, 1521. [Google Scholar] [CrossRef]
- Apriansyah, R.; Gusti, D.R.; Naswir, M.; Permana, E. Preparation of activated carbon from palm shell by chemical activation with koh as an adsorbent dye. Al-Kim. J. Ilmu Kim. Dan Terap. 2024, 11, 172–177. [Google Scholar]
- Akendo, I.C.; Gumbe, L.O.; Gitau, A.N. Dewatering and Drying Characteristics of Water Hyacinth (Eichhornia crassipes) Petiole. Part I. Dewatering Characteristics. Master’s Thesis, University of Nairobi, Nairobi, Kenya, 2008. [Google Scholar]
- Kim, Y.S.; Hanif, M.A.; Song, H.; Kim, S.; Cho, Y.; Ryu, S.K.; Kim, H.G. Wood-Derived Graphite: A Sustainable and Cost-Effective Material for the Wide Range of Industrial Applications. Crystals 2024, 14, 309. [Google Scholar] [CrossRef]
- Melese, T.; Chala, K.; Ayele, Y.; Abdisa, M. Preparation, characterization of raw corncob adsorbent for removal of heavy metal ions from aqueous solution using batch method. Afr. J. Pure Appl. Chem. 2020, 14, 81–90. [Google Scholar]
- Călin, C.; Sirbu, E.-E.; Tanase, M.; Gyorgy, R.; Popovici, D.R.; Banu, I. A Thermogravimetric Analysis of Biomass Conversion to Biochar: Experimental and Kinetic Modeling. Appl. Sci. 2024, 14, 9856. [Google Scholar] [CrossRef]
- Balavairavan, B.; Saravanakumar, S. Characterization of ecofriendly poly (vinyl alcohol) and green banana peel filler (GBPF) reinforced bio-films. J. Polym. Environ. 2021, 29, 2756–2771. [Google Scholar] [CrossRef]
- Mukaratirwa-Muchanyereyi, N.; Kugara, J.; Zaranyika, M. Adsorption of volatile polar organic solvents on water hyacinth (Eichhornia crassipes) root biomass: Thermodynamic parameters and mechanism. Int. J. Environ. Sci. Technol. 2016, 13, 1941–1950. [Google Scholar] [CrossRef]
- Rahmat, A.; Zahrani, A.; Hidayat, H.; Arum, F.; Respati, S.A.; Susanti, W.D.; Hariadi, H.; Mutolib, A. Characteristics of jengkol peel (pithecellobium jiringa) biochar produced at various pyrolysis temperatures for enhanced agricultural waste management and supporting sustainable development goals (SDGs). ASEAN J. Sci. Eng. 2025, 5, 145–172. [Google Scholar] [CrossRef]
- Rezaei, F.; Hassanajili, S. Facile fabrication of superhydrophobic magnetic bio-waste for oil spill cleanup. Ind. Crops Prod. 2023, 201, 116848. [Google Scholar] [CrossRef]
- Kanchana, S.; Jeyanthi, J.; Livingston Peter Goldwyn, P. Factors Influencing the Process of Biosorption of Heavy Metals from Aqueous Solution. Int. J. Res. Civ. Eng. Archit. Des. 2013, 1, 45–50. [Google Scholar]
- Neolaka, Y.A.; Lawa, Y.; Naat, J.N.; Riwu, A.A.P.; Iqbal, M.; Darmokoesoemo, H.; Kusuma, H.S. The adsorption of Cr (VI) from water samples using graphene oxide-magnetic (GO-Fe3O4) synthesized from natural cellulose-based graphite (kusambi wood or Schleichera oleosa): Study of kinetics, isotherms and thermodynamics. J. Mater. Res. Technol. 2020, 9, 6544–6556. [Google Scholar] [CrossRef]
- Ivancev-Tumbas, I.; Landwehrkamp, L.; Hobby, R.; Vernillo, M.; Panglisch, S. Adsorption of organic pollutants from the aqueous phase using graphite as a model adsorbent. Adsorpt. Sci. Technol. 2020, 38, 286–303. [Google Scholar] [CrossRef]
- Bagheri, N.; Abedi, J. Adsorption of methane on corn cobs based activated carbon. Chem. Eng. Res. Des. 2011, 89, 2038–2043. [Google Scholar] [CrossRef]
- Carneiro, M.T.; Barros, A.Z.B.; Morais, A.I.S.; Melo, A.L.F.C.; Bezerra, R.D.S.; Osajima, J.A.; Silva-Filho, E.C. Application of water hyacinth biomass (Eichhornia crassipes) as an adsorbent for methylene blue dye from aqueous medium: Kinetic and isothermal study. Polymers 2022, 14, 2732. [Google Scholar] [CrossRef]
- Ryu, S.-R.; Eun-Ki, J.; Jung-Seok, Y.; Baek, K. Adsorption of As (III) and As (V) in groundwater by Fe–Mn binary oxide-impregnated granular activated carbon (IMIGAC). J. Taiwan Inst. Chem. Eng. 2017, 72, 62–69. [Google Scholar] [CrossRef]
- Qiu, H.; Lv, L.; Pan, B.-C.; Zhang, Q.-J.; Zhang, W.-M.; Zhang, Q.-X. Critical review in adsorption kinetic models. J. Zhejiang Univ.-Sci. A 2009, 10, 716–724. [Google Scholar] [CrossRef]
- Al-Harby, N.F.; Albahly, E.F.; Mohamed, N.A. Kinetics, isotherm and thermodynamic studies for efficient adsorption of Congo Red dye from aqueous solution onto novel cyanoguanidine-modified chitosan adsorbent. Polymers 2021, 13, 4446. [Google Scholar] [CrossRef]
- Ratnawati, R.; Prasetyaningrum, A.; Hargono, H.; Zakaria, M.F. Biosorption of Cu (II) Ions by Water Hyacinth Leaf Powder: Process Performance, Kinetics, and Biosorption Isotherm. Period. Polytech. Chem. Eng. 2024, 68, 239–252. [Google Scholar] [CrossRef]
- Perwitasari, D.S.; Pracesa, Y.A.Y.; Pangestu, M.A.; Tola, P.S. Langmuir and Freundlich isotherm approximation on adsorption mechanism of chrome waste by using tofu dregs. In Proceedings of the 2nd International Conference Eco-Innovation in Science, Engineering, and Technology, Wuhan, China, 15 November 2021; pp. 106–112. [Google Scholar]
- Marnani, N.N.; Tezel, F.H.; Basu, O.D. Adsorptive Removal of Dyes: A Comparison of Graphene Oxide to Granular Activated Carbon and Zeolite NaY. Appl. Sci. 2024, 14, 9811. [Google Scholar] [CrossRef]
- Sun, Z.; Qu, K.; Cheng, Y.; You, Y.; Huang, Z.; Umar, A.; Ibrahim, Y.S.A.; Algadi, H.; Castaneda, L.; Colorado, H.A.; et al. Corncob-derived activated carbon for efficient adsorption dye in sewage. ES Food Agrofor. 2021, 4, 61–74. [Google Scholar]
- Bavaresco, A.; Fonseca, J.M.; Scheufele, F.B.; da Silva, C.; Teleken, J.G. Use of carbonized corn cob biomass to reduce acidity of residual frying oil. Acta Sci. Technol. 2021, 43, e51303. [Google Scholar] [CrossRef]
- Rolence, C.; Machunda, R.; Njau, K. Water hardness removal by coconut shell activated carbon. East Asian Sci. Technol. Soc. Int. J. 2014, 2, 97–102. [Google Scholar] [CrossRef]
- Yasdi, Y.; Ussarvi, D.; Rinaldi, R.; Juita, F.; Cahyani, S.E. Coconut shell-based activated carbon preparation and its adsorption efficacy in reducing BOD from The Real Wastewater from Kitchen Restaurant (RWKR): Characteristics, Sorption Capacity, and Isotherm Model. J. Presipitasi Media Komun. Dan Pengemb. Tek. Lingkung. 2021, 18, 116–130. [Google Scholar] [CrossRef]
- Zhang, L.; Wang, Y.; Jin, S.S.; Lu, Q.Z.; Ji, J. Adsorption isotherm, kinetic and mechanism of expanded graphite for sulfadiazine antibiotics removal from aqueous solutions. Environ. Technol. 2017, 38, 2629–2638. [Google Scholar] [CrossRef]
- Nur, M.; Rompegading, A.B.; Nasir, M.; Yani, A.; Irfandi, R.; Bachtiar, H.M.; Fauziah, S.; Amir, N.I.; Agustina, A.S.; Sangkota, V.D.A.; et al. Efficiency of Water Hyacinth (Eichhornia crassipes) in the Phytoremediation of Copper-Contaminated Waters of Lake Tempe, South Sulawesi Indonesia. Int. J. Des. Nat. Ecodynamics 2024, 19, 1081–1087. Available online: http://iieta.org/journals/ijdne (accessed on 20 March 2025). [CrossRef]
- Babayemi, A.K. Performance evaluation of palm kernel shell adsorbents for the removal of phosphorus from wastewater. Adv. Chem. Eng. Sci. 2017, 7, 215–227. [Google Scholar] [CrossRef]
- Phiri, J.T.; Oh, S. Biosorption of Cd (II), Co (II), and Cu (II) onto Microalgae under Acidic and Neutral Conditions. Sustainability 2024, 16, 6342. [Google Scholar] [CrossRef]
- Cruz-Lopes, L.P.; Macena, M.; Esteves, B.; Guine, R.P.F. Ideal pH for the adsorption of metal ions Cr6+, Ni2+, Pb2+ in aqueous solution with different adsorbent materials. Open Agric. 2021, 6, 115–123. [Google Scholar] [CrossRef]
- Satyam, S.; Patra, S. Innovations and challenges in adsorption-based wastewater remediation: A comprehensive review. Heliyon 2024, 10, e29573. [Google Scholar] [CrossRef]
- Hsieh, C.-T.; Teng, H. Influence of mesopore volume and adsorbate size on adsorption capacities of activated carbons in aqueous solutions. Carbon 2000, 38, 863–869. [Google Scholar] [CrossRef]
- Iwuozor, K.O.; Ighalo, J.O.; Emenike, E.C.; Igwegbe, C.A.; Adeniyi, A.G. Do adsorbent pore size and specific surface area affect the kinetics of methyl orange aqueous phase adsorption? J. Chem. Lett. 2021, 2, 188–198. [Google Scholar]
- Arya, M.C.; Bafila, P.S.; Mishra, D.; Negi, K.; Kumar, R.; Bughani, A. Adsorptive removal of Remazol Brilliant Blue R dye from its aqueous solution by activated charcoal of Thuja orientalis leaves: An eco-friendly approach. SN Appl. Sci. 2020, 2, 265. [Google Scholar] [CrossRef]
- Kosasih, A.N.; Febrianto, J.; Sunarso, J.; Ju, Y.-H.; Indraswati, N.; Ismadji, S. Sequestering of Cu (II) from aqueous solution using cassava peel (Manihot esculenta). J. Hazard. Mater. 2010, 180, 366–374. [Google Scholar] [CrossRef]
- Kusumadewi, R.A.; Wijayanti, A.; Hadisoebroto, R. Utilization of banana peel and water hyacinth leaves as adsorbent for removal of copper from wastewater. Int. J. Sci. Technol. Res. 2019, 8, 2529–2534. [Google Scholar]
- Salim, N.A.A.; Puteh, M.H.; Khamidun, M.H.; Fulazzaky, M.A.; Abdullah, N.H.; Yusoff, A.R.M.; Zaini, M.A.A.; Ahmad, N.; Lazim, Z.M.; Nuid, M. Interpretation of isotherm models for adsorption of ammonium onto granular activated carbon. Biointerface Res. Appl. Chem. 2021, 11, 9227–9241. [Google Scholar]
- Kulkarni, M.R.; Revanth, T.; Acharya, A.; Bhat, P. Removal of Crystal Violet dye from aqueous solution using water hyacinth: Equilibrium, kinetics and thermodynamics study. Resour.-Effic. Technol. 2017, 3, 71–77. [Google Scholar]
- Abbas, M.; Trari, M. Adsorption Behavior of Methylene Blue onto Activated Coconut Shells: Kinetic, Thermodynamic, Mechanism and Regeneration of the Adsorbent. Dose-Response 2024, 22, 15593258241290708. [Google Scholar] [CrossRef]
- Zghal, S.; Jedidi, I.; Cretin, M.; Cerneaux, S.; Abdelmouleh, M. Adsorptive removal of Rhodamine B dye using carbon graphite/cnt composites as adsorbents: Kinetics, isotherms and thermodynamic study. Materials 2023, 16, 1015. [Google Scholar] [CrossRef] [PubMed]
- Olufemi, B.; Eniodunmo, O. Adsorption of nickel (II) ions from aqueous solution using banana peel and coconut shell. Int. J. Technol. 2018, 9, 434–445. [Google Scholar] [CrossRef]
- Nurain, A.; Sarker, P.; Rahaman, M.S.; Rahman, M.M.; Uddin, M.K. Utilization of banana (musa sapientum) peel for removal of Pb2+ from aqueous solution. J. Multidiscip. Appl. Nat. Sci. 2021, 1, 117–128. [Google Scholar] [CrossRef]
- Maryanti, D.F. Performance of Community-Based Solid Waste Management for Integrated and Sustainable Solid Waste Management: The Case of Bogor City, Indonesia. Master’s Thesis, UNESCO-IHE Institute for Water Education, Delft, The Netherlands, 2017. [Google Scholar]
- Warer, J.Y.; Wurarah, R.N.; Allo, A.G.; Parinussa, S.M. Sustainable innovation: Economic valuation of wood waste for sustainable development at PT Wapoga Mutiara Industries. EcoProfit Sustain. Environ. Bus. 2024, 2, 47–57. [Google Scholar] [CrossRef]
- Hadi, P.; Yeung, K.Y.; Barford, J.; An, K.J.; McKay, G. Significance of “effective” surface area of activated carbons on elucidating the adsorption mechanism of large dye molecules. J. Environ. Chem. Eng. 2015, 3, 1029–1037. [Google Scholar] [CrossRef]
- Strangfeld, C.; Wiehle, P.; Munsch, S.M. About the dominance of mesopores in physisorption in amorphous materials. Molecules 2021, 26, 7190. [Google Scholar] [CrossRef] [PubMed]
- Khaliha, S.; Jones, D.; Kovtun, A.; Navacchia, M.L.; Zambianchi, M.; Melucci, M.; Palermo, V. The removal efficiency of emerging organic contaminants, heavy metals and dyes: Intrinsic limits at low concentrations. Environ. Sci. Water Res. Technol. 2023, 9, 1558–1565. [Google Scholar] [CrossRef]
- Vladisavljević, G.T. Membrane emulsification in pharmaceutics and biotechnology. In Current Trends and Future Developments on (Bio-) Membranes; Elsevier: Amsterdam, The Netherlands, 2019; pp. 167–222. [Google Scholar]
- Yu, Q.; Delgado, J.D.L.P.; Veneman, R.; Brilman, D.W.F. Stability of a benzyl amine based CO2 capture adsorbent in view of regeneration strategies. Ind. Eng. Chem. Res. 2017, 56, 3259–3269. [Google Scholar] [CrossRef]
- Ighalo, J.; Omoarukhe, F.O.; Ojukwu, V.E.; Iwuozor, K.O.; Igwegbe, C.A. Cost of adsorbent preparation and usage in wastewater treatment: A review. Clean. Chem. Eng. 2022, 3, 100042. [Google Scholar] [CrossRef]
- Nurhilal, O.; Bagaskara, A.; Sihite, A.H.; Hidayat, S.; Setianto, S. Absorbance study on the adsorptive removal of Fe (III) ions using activated carbon from coconut shells. Curr. Res. Green Sustain. Chem. 2025, 10, 100458. [Google Scholar] [CrossRef]
- Acosta-Herrera, A.A.; Hernandez-Montoya, V.; Tovar-Gomez, R.; Moreno-Virgen, M.d.R.; Perez-Cruz, M.A.; Montes-Moran, M.A.; Cervantes, F.J. Tailored carbon adsorbents developed from coconut shells and coconut palm fibers for the removal of contaminants from anodizing wastewater. J. Mol. Liq. 2023, 386, 122471. [Google Scholar] [CrossRef]
- Prabakaran, E.; Pillay, K. Synthesis of palm kernel shells-biochar adsorbent for removal of methylene blue and then reused for latent fingerprint detection using spent adsorbent. Green Anal. Chem. 2025, 13, 100259. [Google Scholar] [CrossRef]
- Lua, A.C. A comparative study of the pore characteristics and phenol adsorption performance of activated carbons prepared from oil-palm shell wastes by steam and combined steam-chemical activation. Green Chem. Eng. 2024, 5, 85–96. [Google Scholar] [CrossRef]
- Sarkar, A.; Mushahary, N.; Das, B.; Basumatary, S. A novel approach for modification of montmorillonite using banana peel ash extract for enhanced adsorption efficiency of methylene blue dye. Desalination Water Treat. 2024, 320, 100585. [Google Scholar] [CrossRef]
- Gbangbo, K.R.; Kouakou, A.R.; Ehouman, A.D.; Yao, B.; Lou, G.V.-E.G.; Gnaboa, Z.; Adouby, K.; Eboue, K.D.; Binjamin, A.K. Use of plantain peel adsorbents for the reduction of carbon monoxide from biogas for use as chick heating energy in an egg production industry. Case Stud. Chem. Environ. Eng. 2023, 7, 100337. [Google Scholar] [CrossRef]
- Aranda-García, E.; Guerrero-Coronilla, I.; Cristiani-Urbina, E. Water Hyacinth Leaves Are an Efficient, Green, and Cost-Effective Biosorbent for the Removal of Metanil Yellow from Aqueous Solution: Kinetics, Isotherm, and Thermodynamic Studies. Molecules 2024, 29, 3409. [Google Scholar] [CrossRef]
- Binh, Q.A.; Nguyen, H.-H. Investigation the isotherm and kinetics of adsorption mechanism of herbicide 2, 4-dichlorophenoxyacetic acid (2, 4-D) on corn cob biochar. Bioresour. Technol. Rep. 2020, 11, 100520. [Google Scholar] [CrossRef]
- Kumaravel, S.; Geetha, M.; Niyitanga, T.; Kumar, D.S.; Al-Ansari, M.M.; Mythili, R.; Suganthi, S.; Guganathan, L.; Murugan, A.; Ragupathy, S. Preparation and characterization of activated carbon from corn cob by chemical activation and their adsorption of brilliant green dye from wastewater. Process Saf. Environ. Prot. 2024, 188, 1338–1345. [Google Scholar] [CrossRef]
- Seemab, S.; Muhammad, S.; Nawaz, S.; Ahmad, S.; Ullah, R.; Khan, A. Exploring the adsorption potential of waste graphite obtained from spent dry cells for Congo red dye from aqueous solutions. Chem. Eng. Sci. 2025, 306, 121224. [Google Scholar] [CrossRef]


Disclaimer/Publisher’s Note: The statements, opinions and data contained in all publications are solely those of the individual author(s) and contributor(s) and not of MDPI and/or the editor(s). MDPI and/or the editor(s) disclaim responsibility for any injury to people or property resulting from any ideas, methods, instructions or products referred to in the content. |
© 2025 by the authors. Licensee MDPI, Basel, Switzerland. This article is an open access article distributed under the terms and conditions of the Creative Commons Attribution (CC BY) license (https://creativecommons.org/licenses/by/4.0/).