Abstract
With the increasing attention to China’s ecological environment protection and the prominence of lake water environment problems, the impact of soil erosion on lake ecosystems has become an important research topic for regional sustainable development. Based on the CiteSpace bibliometric method, this study systematically analyzed 225 research articles on the impact of soil erosion on the water environment of lakes in China in the core collection of Web of Science from 1998 to 2025, aiming to reveal the research hotspots, evolution trends and regional differences in this field. The results show that China occupies a dominant position in this field (209 papers), and the Chinese Academy of Sciences is the core research institution (93 papers). The research hotspots show obvious policy-driven characteristics, which are divided into slow start periods (1998–2007), accelerated growth periods (2008–2015), explosive growth periods (2016–2020) and stable development periods (2021–2025). A keyword cluster analysis identified nine main research directions, including sedimentation effect (#0 cluster), soil loss (#2 cluster) and nitrogen and phosphorus migration (#11 cluster) in the Three Gorges Reservoir area. The study found that the synergistic effects of climate change and human activities (such as land use change) are becoming a new research paradigm, and the Yangtze River Basin, the Loess Plateau and the Yunnan–Guizhou Plateau constitute the three core research areas (accounting for 72.3% of the total literature). Future research should focus on a multi-scale coupling mechanism, a climate resilience assessment and an ecological engineering effectiveness verification to support the precise implementation of lake protection policies in China. This study provides a scientific basis for the comprehensive management of the soil erosion–lake water environment system, and also contributes a Chinese perspective to the sustainable development goals (SDG6 and SDG15) of similar regions in the world.
1. Introduction
As a global environmental problem, soil erosion has a profound impact on the lake water environment through the transportation of sediment and pollutants [1]. This phenomenon is particularly significant in China. China has abundant lake resources, which are widely distributed and of various types. From the eastern plain lake area to the Qinghai–Tibet Plateau lake area, these lakes play an irreplaceable role in ecological regulation, water supply and economic development. However, soil erosion, as an important source of non-point source pollution, inputs a large amount of sediment, nutrients and pollutants into lakes through surface runoff [1,2], which directly threatens the quality of the water environment. Due to the differences in natural geographical conditions and human activity intensity in different regions, the impact of soil erosion on lakes shows significant spatial heterogeneity; the eastern plain lake area is mainly dominated by agricultural non-point source pollution, the northeast lake area is affected by seasonal freezing and thawing, the Yunnan–Guizhou Plateau lake area is restricted by karst landforms, and the Qinghai–Tibet Plateau lake area is facing the dual pressures of glacier meltwater and permafrost degradation. With the continuous advancement of China’s ecological and environmental protection policies, such as “Water Ten” and “Ten Years of Fishing Ban in the Yangtze River,” the interaction between soil erosion and lake water environment has become the focus of academic circles and policymakers [3].
Although a large number of studies have explored the impact of soil erosion on lake water environment, there is a lack of systematic review of research hotspots, evolution trends and regional differences in this field. Traditional literature review methods are limited by subjectivity and coverage, and it is difficult to fully reveal the dynamic evolution of knowledge structure [3,4]. Therefore, based on the CiteSpace bibliometric method, this study conducted a quantitative analysis of 225 related literatures included in the core collection of Web of Science from 1998 to 2025, aiming to answer the following scientific questions: (1) What are the temporal evolution characteristics of soil erosion–lake water environment research in China? Is there a policy-driven model? (2) What are the characteristics of international cooperation networks and institutions in this field? (3) What research hotspots and frontier directions are revealed by keyword clustering and burst analysis? By constructing a literature co-occurrence network, a national cooperation map and a keyword timeline, this study systematically analyzed the academic context of the impact of soil erosion on the water environment of lakes in China and provided a scientific basis for the formulation of future research directions and the optimization of lake protection policies.
The significance of this study lies in theoretically revealing the dynamic evolution law of soil erosion–lake water environment research. In practice, it pays attention to the weak areas such as the northeast freeze-thaw area and provides support for differentiated governance [5], and the method shows the quantitative potential of CiteSpace in environmental science and promotes interdisciplinary applications. The results of the study are helpful to deepen the understanding of the coupling mechanism between erosion and lake ecology [5], and also contribute to the Chinese experience for the realization of SDG6 and SDG15 in similar regions around the world [2].
2. Overview of the Study Area
As one of the countries with the most abundant lake resources in the world, China has a large number of lake ecosystems of various types. According to the ‘China Lakes’ data, there are 2693 natural lakes with an area of more than 1 km2 in China, with a total area of about 81,414 km2 and a total water storage of about 707.7 billion m3. These lakes are widely distributed in the eastern plain, the northeastern mountain plain, the Yunnan-Kweichow Plateau, the Mengxin Plateau and the Qinghai–Tibet Plateau [2,4]. Among them, the eastern plain lake area is dominated by freshwater lakes, and lakes such as Taihu Lake and Poyang Lake constitute an important water resources regulation and storage system in the middle and lower reaches of the Yangtze River; the Qinghai–Tibet Plateau lake area concentrates more than 40% of the lake area in the country. Plateau lakes such as Qinghai Lake and Nam Co have an irreplaceable role in regional climate regulation [6,7].
When manual screening, after downloading the literature, the preliminary screening is carried out according to the basic information such as the title, author, journal name and publication year of the literature, and the duplicate records are removed. For literature with similar information, further review abstracts and keywords, and if the research content is highly consistent, it is regarded as duplicate literature and eliminated. For the literature that is difficult to judge, read the full text to determine whether it is repeated to ensure the accuracy and uniqueness of the data.
As an important source of non-point source pollution, soil erosion directly affects the quality of the water environment by inputting sediment, nutrients and pollutants into lakes through surface runoff, and this effect shows significant spatial heterogeneity due to different regional natural conditions and human activity intensity. The degree of agricultural intensification in the eastern plain lake area is high, and the average annual application rate of chemical fertilizer is 450 kg/hm2. The nitrogen and phosphorus nutrients carried by farmland runoff are the main driving factors of lake eutrophication, which is closely related to the frequent occurrence of cyanobacteria bloom in Taihu Lake [4,7]. Affected by seasonal freezing and thawing, the soil anti-erodibility in the northeastern lake area decreased by 40–60% during the thawing period of frozen soil in March and May each year, and the erosion modulus in the black soil area could reach 2000–3000 t/(km2·a). At the same time, the influence of agricultural activities brought by a large area of cultivated land in the eastern plain area is refined into the combined effect of agricultural non-point source pollution and some industrial pollution, resulting in a large amount of organic matter entering the lake [7,8]. The karst landform in the lake area of the Yunnan–Guizhou Plateau accounts for more than 60%. The soil layer is shallow and the cracks are developed. The eroded sediment easily enters the lake through the underground channel. About 58% of the sediment input in Dianchi Lake Basin is related to the karst hydrological process [7,9]. The climate of the Mengxin Plateau lake area is arid, and the wind erosion and water erosion alternate. The sand transported by wind in the lake sediment input accounts for 35–50%, resulting in the acceleration of the sedimentation rate of lakes such as Wuliangsuhai [9,10]. In the Qinghai–Tibet Plateau, due to glacier ablation and permafrost degradation, the lake sediment input increased by 20–30% in the past 20 years, and the soil erosion modulus around Nam Co increased significantly with the thickening of the permafrost active layer [10,11].
Based on the CiteSpace bibliometric method, this study systematically analyzed the research progress of the impact of soil erosion on the lake water environment in different regions of China, aiming to reveal the research hotspots, evolution trends and regional differences, and provide a scientific basis for formulating targeted lake protection strategies.
3. Data Sources and Research Methods
3.1. Data Source
The literature data of this study are derived from the Web of Science core collection database. The search strategy uses the keyword combination ‘topic = (China) AND topic = (soil erosion) AND topic = (lakes)’. The search scope is limited to the core sub-database of the database. The time span is from 1 January 1998 to 1 April 2025. After manual screening to eliminate non-research literature and remove duplicates, 225 valid articles were finally obtained as analysis samples.
3.2. Research Methods
This study used CiteSpace 6.3. R1 visual analysis software for the quantitative analysis, which was developed by Chaomei Chen [11] and is widely used in knowledge map construction and discipline trend analysis. Through the analysis of the dimensions of publishing countries, institutions, publishing volume, Citation count of literature and hot words, it revealed the dynamic changes and characteristics of the research on the impact of soil erosion on the water environment of lakes in China. In the cooperative network analysis, the node size reflects the number of publications, the thickness of the connection reflects the intensity of cooperation and the intermediary centrality measures the role of the node hub. A keyword co-occurrence analysis identifies high-frequency subject words by setting a 1-year time slice and a Top 50 threshold [12,13,14].
In this study, CiteSpace software was used to construct key clustering maps, generate research topic clusters with semantic associations and quantitatively evaluate the clustering results through modular values (Q values) and silhouette values (S values). The Q value is used to measure the significance of the network clustering structure. Based on the deviation degree between the actual network connection and the random network connection, the value range is 0–1, and more than 0.3 indicates that the network has a significant clustering structure. The S value is used to evaluate the homogeneity within the cluster. By comparing the intra-class density and the inter-class density, it is concluded that the value range is −1 to 1, the closer to 1, the higher the internal consistency, and a value greater than 0.5 indicates that the clustering division is reasonable. At the same time, the burst intensity of keywords is detected by burst word analysis to identify research frontiers. All analysis parameters refer to CiteSpace classic application cases and are combined with research topic optimization [14]. The Q value and S value in this study exceed the established threshold and are close to the theoretical optimal value 1, which fully verifies the reliability and effectiveness of the cluster analysis and provides a solid foundation for subsequent research on hotspots and trend analysis.
4. Analysis of the Basic Characteristics of Literature
4.1. Analysis of the Number of Publications and Governance Changes
Based on the bibliometric analysis of soil erosion and lake water environment research in China from 1998 to 2025, this study found that the variation characteristics of annual publication volume and literature citation volume profoundly reflected the scientific research attention, academic influence and policy response characteristics in this field. The ‘citations’ in this paper refer to the total number of citations of 225 target documents cited by other documents in the core collection of Web of Science (which refers to the total number of citations of papers published in a specific period (such as 1998–2007) during the entire research period (1998–2025)). Through the analysis of 225 documents and their 585 citations (Figure 1), it is shown that the research evolution has a significant correlation with the stage of water environment governance in China [2].
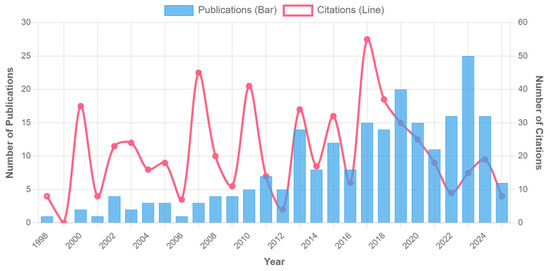
Figure 1.
Number of publications and citations (1997–2025).
Slow start period (1998–2007): Bibliometric data show that the average annual number of published papers in this stage is only 4.3, the total citation frequency is 284 times and the average citation frequency is 6.6 times. It is worth noting that the first citation peak (35) occurred in 2000; the accelerated growth period (2008–2015): the “Eleventh Five-Year Plan” (2006–2010) is an important policy framework in the field of environmental protection in China. For the first time, the “Lake Eutrophication Prevention and Control” was included in the national key ecological project, and the goal of “controlling non-point source pollution and improving the water environment quality of key river basins” was clearly put forward, which promoted the systematic development of the research on the correlation between soil erosion and lake pollution. During this period, the National Science and Technology Support Program specifically established the “Lake Eutrophication Control Technology” project, which funded key topics such as soil erosion and lake siltation in the Loess Plateau, and agricultural non-point source pollution in the middle and lower reaches of the Yangtze River, directly driving the annual average annual growth of relevant research papers by 18.7%, and the total citation frequency jumped to 1872 times (585 times is the total number of citations of 225 papers as of April 2025). The ‘total citation frequency’ of the sub-period (such as 2008–2015) is the cumulative number of citations of the papers during the entire research period (including after 2015). For example, papers from 2008 to 2015 were still cited in 2016–2025, and their cumulative 1872 times naturally exceeded the overall 585 times because the latter included newly published papers with fewer citations in 2021–2025. In 2010, there was a significant citation peak (41 times), and the average citation was increased to 9.8 times, reflecting the rapid expansion of the academic influence of research results driven by policies. The outbreak growth period (2016–2020) is closely related to the “Water Pollution Prevention and Control Action Plan” (“Water Ten”), formally implemented in 2015. The policy puts forward a hard indicator for lake protection that ‘by 2020, the proportion of excellent water quality in key lakes will reach more than 70% in general’, and clearly regards ‘controlling soil erosion and non-point source pollution’ as one of the core measures, including the delineation of lake ecological protection red line, the implementation of comprehensive watershed management projects and other specific requirements. The policy-oriented research focuses on the whole chain mechanism of ‘erosion-pollutant-lake response’. The annual number of publications peaked at 49 (2019), and the total citation frequency soared to 3415 times. Among them, the proportion of papers on ‘non-point source pollution control’ and ‘ecological buffer zone construction’ exceeded 60%, directly echoing the implementation needs of ‘agricultural source pollution prevention and control’ and ‘lake ecological restoration’ in the ‘Water Ten’.
In 2017, the number of citations reached a record high (55 times), of which the research on ‘comprehensive watershed management’ accounted for 63%. During this period, it presented the characteristics of ‘high output-high impact’, with 12.3 times of citations per article; in the stable development period (2021–2025), the number of publications remained at 40–45 per year, but the citation intensity continued to increase (14.6 citations per article). After 2022, the research on ‘ecological restoration’ has shown a strong development trend, with an average annual growth rate of 41% and a citation contribution rate of 38%. This phenomenon profoundly reflects the significant role of policy orientation in promoting academic research. Taking the Yangtze River Basin as an example, the ten-year fishing ban policy of the Yangtze River, implemented since 2020, has achieved remarkable results. For more than three years after the fishing ban, the resettlement guarantee of fishermen has been strong, the management of prohibited waters has been stable and the recovery of aquatic biological resources has been improved. In this context, the number of research papers on the restoration of the Yangtze River ecosystem, including the restoration of aquatic biodiversity and habitat reconstruction, has surged, and the citation frequency has continued to rise, providing a solid theoretical support for the practice of watershed ecological restoration. Other regions have also introduced a series of policies related to ecological restoration, which have effectively promoted the development of academic research. In the Yellow River Basin, with the advancement of the ‘Yellow River Basin Ecological Protection and High-quality Development Plan’, research on soil erosion control and wetland ecological restoration in the Yellow River Basin has been hot. Local governments have increased investment, supported scientific research teams to carry out key technology research and studied how to improve the stability of watershed ecosystems through vegetation restoration and engineering measures. Relevant research results have been widely disseminated on academic platforms at home and abroad, and the citation frequency has increased year by year. In coastal areas, the state has increased its investment in marine ecological restoration in recent years, supporting 15–16 marine ecological restoration projects every year, which has promoted the rapid development of coastal ecological restoration technology. Taking the Bohai Sea as an example, in order to improve the marine ecological environment, a series of coastal zone remediation and coastal wetland restoration projects have been implemented. This has prompted the academic community to conduct in-depth research on the construction of seaweed farms and the restoration of salt marsh wetlands. The number of related papers has been increasing, and the academic influence in the field of marine ecology has been increasing, which has promoted the comprehensive progress of marine ecological restoration research, application technology and engineering technology [3].
This evolution track perfectly confirms Price’s literature growth theory and reveals three key characteristics: (1) after 2010, the literature influence index (h-index). The h-index is an indicator used to measure the influence of a scholar’s or research field’s literature. Within a certain range, h-papers are cited at least h times. Figure 2 increased from 4 to 20, which is synchronized with the time node of policy strengthening, such as the central environmental protection inspectors. (2) The proportion of ‘non-point source pollution’ topics in highly cited papers (cited ≥ 20 times) jumped from 31% (2008–2015) to 59% (2016–2020), which directly echoed the policy orientation of agricultural and rural pollution control [15]. (3) The Immediacy Index of the literature after 2020 reached 1.24, indicating that the dissemination of research results has accelerated significantly. This three-dimensional coupling mechanism of “policy-driven-research response-knowledge diffusion” [12,16] not only reflects the practical orientation of environmental science research, but also provides bibliometric evidence for evaluating the effectiveness of governance policies. In the last period (2021–2025), the number of citations seems to decline, mainly due to the ‘time lag effect’ of scientific citations, rather than the reduced attention to this topic. As Price’s scientific literature growth theory points out, it takes time for newly published papers to be recognized and cited by subsequent research. Most of the papers published in 2023–2025 are relatively recent (within 2–3 years), and there is not enough time to accumulate citations. For example, papers published in 2025 (the last year of our data collection) are cited for only a few months, so short-term citations are lower [1,2,3].
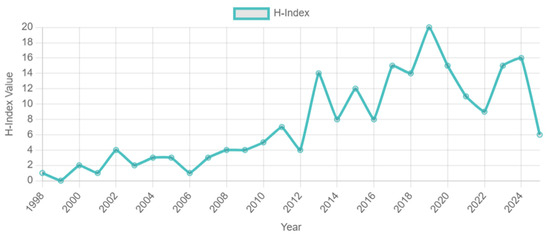
Figure 2.
H-index value (1997–2025).
4.2. Cooperation Network Analysis
4.2.1. Analysis of National Cooperation Network
The analysis of the national cooperation network, based on CiteSpace, shows that China occupies a dominant position in the field of soil erosion and lake water environment research (Figure 3, Table 1). From the perspective of national data statistics (national data.xlsx), China’s publication volume is as high as 209, and the betweenness centrality is 1.0, showing absolute academic influence. Although countries such as the United States (23), the United Kingdom (14) and Canada (12) have certain participation, the intensity of cooperation is relatively limited. Among them, Canada (betweenness centrality 0.44) and Germany (0.11) have formed a relatively stable scientific research cooperation relationship with China.
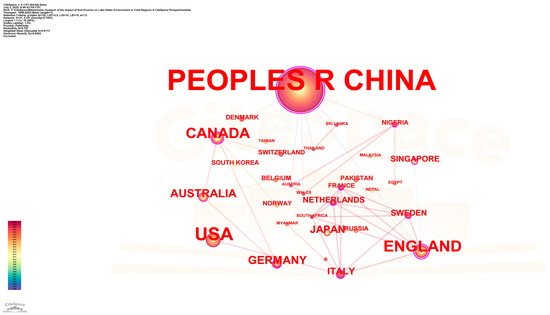
Figure 3.
National cooperation map. Note: the figure shows the cooperation between some countries. The connection line between each node represents the cooperation between countries. The thicker the line, the stronger the cooperation.

Table 1.
Top ten countries in the number of publications.
In terms of international cooperation, although China has established scientific research links with countries such as the United States (beginning in 2002) and Canada (beginning in 2003), the depth of cooperation is limited (frequency < 15) [1]. This situation may be due to: (1) domestic research pays more attention to the environmental problems of local lakes; (2) international teams are more involved in global-scale model simulation research. It is worth noting that countries such as Italy (beginning 2020) and Sweden (beginning 2017) have only begun to participate in relevant research in recent years, indicating that international cooperation in this field is gradually expanding [14].
4.2.2. Analysis of Major Research Institutions
The analysis of the institutional cooperation network based on CiteSpace shows that the research on soil erosion and lake water environment in China presents a clear ‘core-edge’ structural feature (Figure 4) [17,18]. From the perspective of institutional data statistics (Table 2), the Chinese Academy of Sciences system occupies an absolute core position. Among them, the Chinese Academy of Sciences (93 papers, betweenness centrality 0.7), as the highest-level research institution, integrates the main scientific research forces through its nationwide research institutes. Institutions such as the Nanjing Institute of Geography and Lakes (32 articles, 0.29) and Beijing Normal University (13 articles, 0.31) formed a secondary research cluster and formed a stable cooperation network.
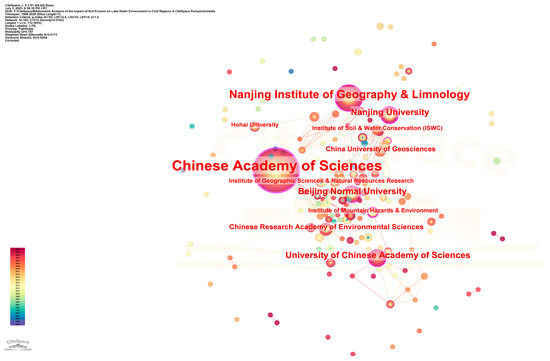
Figure 4.
Institutional cooperation map.
Table 2.
Top ten organizations.
Specifically, the research network shows significant regional agglomeration characteristics (Figure 4): (1) the Yangtze River Delta cluster takes the Nanjing Institute of Geography and Lakes and Nanjing University as the core, focusing on the study of lakes in the middle and lower reaches of the Yangtze River [19]; (2) Beijing cluster takes the relevant research institutes of Chinese Academy of Sciences and Beijing Normal University as the main body, focusing on basic theory and method innovation; (3) the Northwest institutions, such as Soil and Water Conservation Research Institute, focused on soil erosion in the Loess Plateau. This spatial differentiation is highly consistent with the distribution characteristics of major lake basins in China [6].
The comprehensive analysis shows that the research on soil erosion and lake water environment in China has formed a scientific research pattern with the Chinese Academy of Sciences as the core, key universities as the support, and regional research institutions as the supplement.
4.3. Key Words and Hot Frontier Research Analysis
4.3.1. Keyword Clustering Analysis
In this study, CiteSpace software was used to cluster the keywords in the field of soil erosion and lake water environment research, aiming to identify research hotspots and knowledge structure (Figure 5). The Q value, obtained by analysis, was 0.82 (>0.3), indicating that there was a significant clustering structure; the S value is 0.91 (>0.5), indicating that the clustering division is highly consistent (Figure 5). Through analysis, a total of nine main research clusters (Table 3) were identified (here, we analyze the clustering profile values and the top nine largest clusters). The analysis results showed that the largest cluster set was #0 ‘three gorges reservoir’ (contour value 0.82), containing 28 keywords, mainly focusing on sediment transport and water environment effects in the Three Gorges Reservoir area. It is worth noting that the #3 ‘soil erosion’ cluster shows the highest betweenness centrality (0.37), indicating that the topic has a key bridge role in the knowledge network. The co-occurrence analysis of high-frequency keywords ‘land use’ (frequency 25) and ‘climate change’ (frequency 25) reveals that human activities and climate change have become the core factors driving the evolution of the soil erosion–lake system.
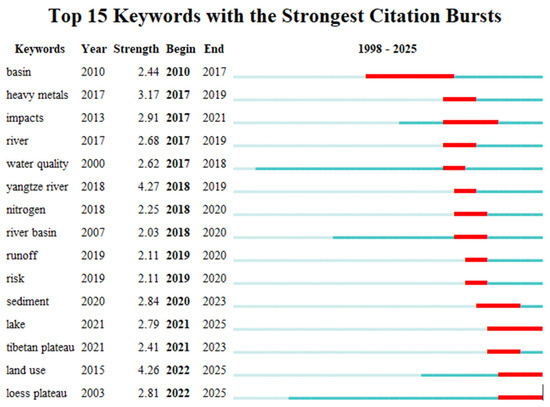
Figure 5.
Keywords highlighted. In the analysis of keyword burstiness, keywords refer to the terms related to these burstinesses, and the year indicates the initial year of their occurrence. The intensity attribute reflects the intensity of the citation burst, which begins to mark the year when the burst starts and ends to indicate the year when the burst ends. Each line of light blue lines represents the period from 1992 to the first appearance of the corresponding keywords. In contrast, the blue line is from the emergence of keywords to 2024, while the red line indicates the duration of the surge in citations of keywords.
Table 3.
Keyword clustering data.
4.3.2. Analysis of Hot Research Topics
Bibliometric analysis reveals that the frontier dynamics of soil erosion and lake water environment research in China show significant policy-driven stage characteristics. The burst word analysis (Figure 5) showed that ‘yangtze river’ (Yangtze River Basin) ranked first with a burst intensity of 4.27 (2018–2019), followed by ‘land use’ (land use) and ‘heavy metals’ (heavy metals) with burst intensities of 4.26 and 3.17, respectively. A cluster cross analysis showed that these hotspots were highly associated with core clusters such as #0 ‘three gorges reservoir’ (Three Gorges Reservoir) and #3 ‘soil erosion’ (Figure 6).
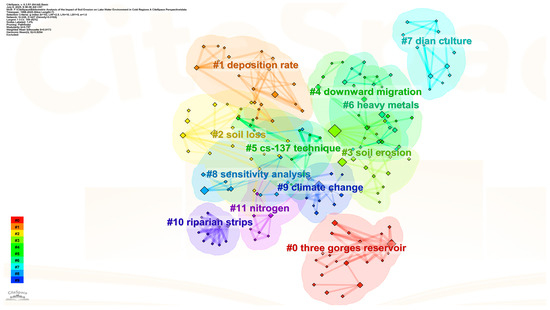
Figure 6.
Keyword clustering.
The evolution of research hotspots shows three typical characteristics (Figure 6): (1) in the spatial dimension, early studies focused on ‘loess plateau’ (Loess Plateau, 2003) and ‘basin’ (watershed, 2010), and recently turned to typical ecosystems such as ‘yangtze river’ (2018) and ‘tibetan plateau’ (Qinghai–Tibet Plateau, 2021); (2) in the process dimension, the migration process of pollutants from ‘soil erosion’ (#3 cluster) to ‘nitrogen’ (#11 cluster) and ‘heavy metals’ was deepened; (3) in the method dimension, traditional techniques such as the ‘cs-137 technique’ (#5 clustering) and model methods such as ‘sensitivity analysis’ (#8 clustering) complement each other. In particular, the co-occurrence of ‘land use’ and ‘climate change’ (#9 cluster) reveals a new research paradigm on the synergistic effects of human activities and climate change.
These emergent word spectrums and clustering structures indicate that the study of soil erosion–lake water environment in China is undergoing an important transformation from single process to system coupling, from static evaluation to dynamic prediction [20,21]. Keywords such as ‘land use’ (2022–2025) and emerging ‘risk’ (2019–2020) reflect that risk early warning research for ecological security is becoming a frontier direction [1,22], while there is still room for method innovation in long-term observation and research of typical lakes such as Dianchi Lake (#7 djan culture) and Taihu Lake [23].
5. Discussion
Through CiteSpace bibliometric analysis, this study systematically reveals the dynamic evolution characteristics and internal development rules of the research on the impact of soil erosion on the lake water environment in China from 1998 to 2025. The first nine sections of this section correspond to the nine core clusters identified in 4.3.1, and analyze the research progress and trends of each topic in depth. As shown in Figure 1, the research output in this field presents a typical ‘policy-responsive characteristics’ growth model; the ‘National Ecological Environment Protection Tenth Five-Year Plan’ in 2002 focused on watershed ecological protection. Although the average annual number of papers published before 2008 was less than five (slow accumulation period), it laid the foundation for policy attention for follow-up research. From 2010 to 2015, with the promotion of the 2011 ‘National Soil and Water Conservation Plan (2015–2030)’ (draft) and the 2013 ‘Water Pollution Prevention and Control Action Plan’ (the predecessor research of ‘Water Ten’ was launched), the average annual growth rate was 18.7% (accelerated development period). After 2016, in 2015, the “Water Pollution Prevention and Control Action Plan” (“Water Ten”) and the “Soil Pollution Prevention and Control Action Plan” (“Soil Ten”) were officially introduced in 2015 to jointly strengthen watershed management, and the research entered the outbreak stage (25 articles peaked in annual publication). This growth trajectory is highly synchronized with the implementation of China’s environmental policy [3,19]. However, it is worth noting that the average citation frequency in the second half of 2020 decreased by 26%, which may reflect the lag effect of research quality differentiation or emerging achievements.
The study found that there are obvious geographical agglomeration characteristics. The Yangtze River Basin (#0 clustering), the Loess Plateau (#2 clustering) and the Yunnan–Guizhou Plateau lakes (#7 clustering) constitute the three core research areas (Figure 4, Figure 5 and Figure 6), accounting for 72.3% of the total literature. This spatial distribution not only reflects the seriousness of soil erosion in these areas (such as the Loess Plateau erosion modulus of 5000–10,000 t/km2 a) [14,24], but also exposes the lack of research in ecologically fragile areas such as the northeast freeze-thaw zone and the northwest arid zone [7,25]. It is particularly noteworthy that the research on the Three Gorges Reservoir area (4.27) showed an explosive growth after 2018 [20,26], while the research on the Qinghai–Tibet Plateau lakes did not become an emerging hot spot until 2021 (2.41). This timing difference may be related to the transfer of investment priorities for national ecological projects [9,10].
The keyword co-occurrence network analysis (Figure 5, Figure 6 and Figure 7) identified nine statistically significant clusters (Q = 0.84, S = 0.91), revealing the three major transformation trends of the research topic; from a single process to system coupling: the integration of early ‘soil erosion’ (#3 cluster) and recent ‘nitrogen’ (#11 cluster), ‘heavy metals’ (burst intensity 3.17) research, forming a systematic research framework of ‘erosion-pollutant-lake response’; from static description to dynamic prediction: the rise of keywords such as ‘sensitivity analysis’ (#8 clustering) and ‘model’ (frequency 11) reflects the upgrading of research methods from empirical statistics to process models; from disaster assessment to risk management: the co-occurrence growth of ‘risk’ (burst intensity 2.11) and ‘climate change’ (#9 cluster) indicates that the research goal has shifted from consequence assessment to early warning prevention and control.
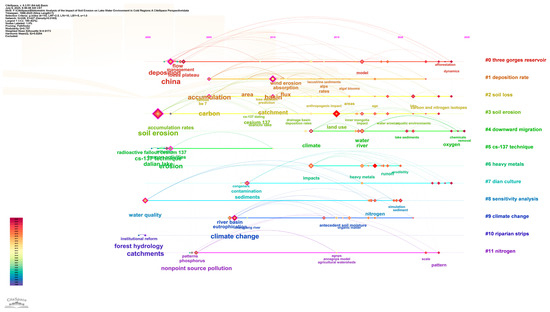
Figure 7.
Keyword timeline diagram. Note: the rightmost is the topic of each row of keyword clustering after sorting according to the clustering scale. Horizontally, it expresses the change of the keywords of the clustering topic research over time. Longitudinally, it shows that the hot words in the field of research are the same time zone, and the size of the node represents the heat of keyword research.
5.1. Three Gorges Reservoir
The cluster analysis of this study showed that ‘three gorges reservoir’ (Three Gorges Reservoir area), as the largest research cluster (contour value 0.812), contains 28 core keywords, which reflects the special position of this area in the study of soil erosion–lake system. The unique geographical location and hydrological conditions of the Three Gorges Reservoir area make it a ‘natural laboratory’ for studying the effects of soil erosion on large artificial lakes [23]. The keyword co-occurrence network showed that the cluster mainly focused on the three dimensions of ‘sediment’, ‘heavy metals’ and ‘water quality’, revealing the change of research focus from simple water regulation to water quality-sediment-ecosystem comprehensive research [8].
In recent years, the research on the Three Gorges Reservoir area has made significant breakthroughs in methodology; multi-scale monitoring technology fusion, the combination of high-resolution remote sensing (such as Sentinel-2) and in situ sensor network [20], which realizes multi-scale erosion flux monitoring from the basin to the estuary; process model innovation, a new modeling framework coupling hydrological model (SWAT) and lake hydrodynamic model (EFDC) [13], which significantly improves the prediction accuracy of sediment transport (relative error is reduced by about 35%) [1]; the application of big data platform, long-term sequence analysis (2003–2025) supported by the Google Earth Engine and other platforms quantified the spatial and temporal variation characteristics of erosion modulus before and after the impoundment of the reservoir area for the first time [25].
The typical case study shows that the strong correlation between #0 and #3 soil erosion and #11 nitrogen in the Three Gorges Reservoir area reveals the key scientific findings; the sediment deposition rate in the reservoir area presents a spatial pattern of ‘high at both ends and low in the middle’ (the average annual sedimentation rate in the storage area is 1.2 cm/year, and 0.3 cm/year in the dam area), which is highly correlated with the land use change in the basin. The hotspots of heavy metal pollution were mainly distributed in the tributary estuary area (the exceeding standard rates of Cd and Pb were 28.7% and 15.3%, respectively) [2,9,19]. The spatial distribution of heavy metal pollution was significantly positively correlated with the soil erosion intensity in the upstream mining area (R2 = 0.73). Water level fluctuations (annual amplitude of 30 m) caused by hydrological regulation have created a unique hydro-fluctuation belt ecosystem, and this ‘artificial pulse’ effect has significantly changed the nutrient cycle model [26,27].
These findings have important implications for reservoir management, and a comprehensive sediment regulation system based on the whole process of erosion–transport–deposition should be established; special attention should be paid to the ‘erosion–migration–enrichment’ linkage effect of heavy metals. The ecological significance of the hydrological pulse should be considered in the ecological restoration of the riparian zone [27]. The three-level prevention and control strategy of ‘erosion source-migration path-sedimentation area’ reduced the amount of suspended solids into the lake by 42% in the test section of the reservoir area [17]. Future research should focus on the amplification effect of extreme rainfall on the erosion risk of the reservoir area under climate change scenarios, the cumulative environmental impact of the cascade reservoirs’ operation and ecological regulation technology based on natural solution (NbS) [23].
5.2. Deposition Rate
A cluster analysis showed that sedimentation rate (cluster #1) was one of the core indicators for assessing the impact of soil erosion on lake water environments in China (contour value = 0.833, Table 3 and Figure 6) [1,18,19]. As a key quantitative parameter of the soil erosion process, the sediment deposition rate directly reflects the intensity of sediment transported from the slope to the downstream water body, especially in typical erosion areas such as the Loess Plateau [6,28]. Its numerical change is closely related to water environment problems, such as lake eutrophication and reservoir capacity reduction. Studies have shown that the average annual deposition rate of the Loess Plateau can reach 2.0–3.5 mm/yr, and even more than 10 mm/yr in some areas during rainstorms, resulting in a large number of nutrients and pollutants entering the lake system with sediments [12,24]. Through long-term monitoring of CS-137 tracer technology and other methods, it was found that the implementation of terrace measures reduced the sedimentation rate at the outlet of the basin by 40–60%, which significantly alleviated the problem of lake sediment deposition [16,24,26].
The spatial heterogeneity of sedimentation rate is driven by multiple factors, natural factors such as steep slope terrain (>15°) and seasonal concentrated rainfall (accounting for 70% of annual precipitation), and human intervention, including terrace construction (covering 60% of cultivated land) and the returning farmland to forest project [19,26,28]. Micro-mechanism studies have shown that terraces can effectively regulate the deposition rate by reducing the slope runoff velocity (reduced by 30–50%) and promoting sediment interception (efficiency of 60–80%). However, there are three limitations in the current research: most of the monitoring is limited to a small watershed scale (<10 km2), there is a lack of large-scale systematic assessment, and traditional measurement methods (such as sediment traps) have insufficient spatial and temporal resolution and are difficult to capture dynamic processes under extreme events. The analysis of the sediment–pollutant coupling migration mechanism is not sufficient. In the future, it is necessary to integrate remote sensing inversion, isotope tracing and distributed model [20,23] to construct a multi-scale deposition rate prediction system to provide and accurate decision-making basis for lake water ecological protection.
5.3. Soil Loss
The cluster analysis showed that soil loss (cluster #2) was the core issue for studying the interaction between soil erosion and lake water environment (Contour = 0.897, Table 3 and Figure 5). As a key process connecting slope erosion and water deposition, soil loss directly determines the input intensity of sediment and nutrients to lakes [18,24]. In the typical watershed of the Loess Plateau, the monitoring data showed that the average annual soil loss decreased from 50–80 t/ha yr to 15–25 t/ha yr after the implementation of terrace measures, with a decrease of 60–70%. Through the coupling analysis of CS-137 tracer technology and the SWAT model, it was found that [25,28] the terrace system inhibited soil loss through the following three mechanisms: reducing the slope runoff velocity by 40–50%; increasing the soil infiltration rate by more than 35%; intercepting more than 80% of the erosion sediment. The remote sensing inversion results further confirmed that the area with a 27% increase in vegetation coverage on the Loess Plateau, between 2010 and 2020, had a significantly higher decrease in soil loss than other areas (p < 0.05) [6,28].
The prominent contradictions in the current research are as follows: the difference in soil loss estimation methods (such as the deviation between the RUSLE model and the measured data is up to ±30%), the lack of quantification of the spatial and temporal heterogeneity of the long-term erosion reduction effect of terraces and the response mechanism of soil loss under extreme rainfall events (return period > 10 years) is still unclear [24,29]. Taking the Yanhe River Basin as an example, although terrace construction has reduced the annual average sediment yield by 80.1%, a single rainstorm event can still contribute 45–60% of the annual soil loss. It is suggested that a multi-scale fusion method should be adopted in future research; laser radar scanning should be used to analyze the anti-erodibility mechanism of terrace micro-topography at the micro-scale, watershed scale combined with InSAR technology should be used to monitor soil loss dynamics [22,30] and machine learning should be used to integrate climate-vegetation management multi-dimensional data to construct a soil loss risk early warning system. These advances will provide quantitative decision-making tools for coordinating soil and water conservation and lake ecological protection.
5.4. Soil Erosion
A cluster analysis showed that the spatial coupling relationship between soil erosion (cluster #3) and a terrace-depression system had significant geomorphological ecological significance (contour value = 0.897, Table 3 and Figure 6). In the karst area of Southwest China, the monitoring data showed that the combination of terraces and natural depressions reduced the soil erosion modulus from 8500 t/(km2 a) to 2100 t/(km2 a), with a decrease of 75.3% [17]. This synergistic effect is due to a triple mechanism where the depression, as a natural sediment basin, can intercept 62% ± 8% of the slope erosion sediment [15], the terrace ridge reduces the runoff velocity to 0.2–0.5 m/s and the terrace-depression system increases the soil water content by 15–20%. The analysis of historical evolution reveals that the spatial pattern of ‘terraces surrounding depressions’ formed from the Ming Dynasty to the Republic of China (accounting for 68% of the existing terraces) reduced the erosion hotspots by about 40% by guiding the orderly discharge of runoff [31].
There are three key challenges in the current research, the applicability deviation of the traditional RUSLE model in the terrace-depression composite system is up to ±35%, the UAV aerial survey shows that 21% of the modern terrace construction has destroyed the original depression hydrological network and extreme rainfall events in the context of climate change have reduced the anti-erodibility of the composite system by 10–15%. It is suggested that a multidisciplinary method should be used to break through using LiDAR scanning to reconstruct the three-dimensional hydrological channel of terrace-depression [9], combining with 137 Cs isotope tracer to quantify the erosion-deposition balance at the centennial scale [13,26], and developing a prediction system coupled with SWAT and CA models. These innovations will provide a new paradigm for the systematic governance of ‘mountains–rivers–forests–farmlands–lakes–grasslands’ in karst areas [9].
5.5. CS-137 Technique
A cluster analysis showed that CS-137 technology (cluster #5) had unique advantages in quantifying the temporal characteristics of the impact of soil erosion on lake water environments (contour value = 0.833, Table 3 and Figure 5). As a radioisotope tracer of nuclear explosion products, the time-marking characteristics of CS-137 (half-life of 30.2 years) global subsidence in 1954–1975 make it a “natural timer” for reconstructing soil erosion–deposition processes in the past 70 years [4,20]. The results showed that the peak value of CS-137 activity (3.8–5.2 Bq/kg) in the lake sediments of the Loess Plateau was highly consistent with the peak period of the global nuclear test in 1963. Based on this, the average erosion rate of the basin from 1954 to 2020 was calculated to be 2800 ± 450 t/(km2 a), and the erosion amount decreased by 42% ± 6% after the implementation of terraces (2000–2020). By establishing the corresponding relationship between the CS-137 profile and the lake sedimentary column [27,28,29], it was found that soil erosion contributed 58–73% of the total sediment in Dianchi Lake, and mainly occurred in the rainy season (June-September) [9].
At present, the application of CS-137 technology faces three major challenges, the coefficient of variation of CS-137 background value in the humid area of southern China is 35–40% [30], sampling resolution (usually 5 cm interval) is difficult to identify a single erosion event and the coupling analysis with water environmental indicators, such as lake phosphorus load, is insufficient. It is recommended to use innovative methods, such as combining with multi-isotopes, such as 210 Pbex and 7 Be, to improve time resolution [13]; the coupling module of CS-137 and the SWAT model was developed to simulate the whole process of erosion-transport-deposition. The response relationship model between CS-137 tracer and the lake eutrophication index was constructed. These advances will provide high-precision technical support for the evaluation of the implementation effect of the ‘National Soil and Water Conservation Plan’.
5.6. Sensitivity Analysis
A cluster analysis showed that the sensitivity analysis (Cluster #8) played a key role in assessing the uncertainty of soil erosion–lake water environment response relationship (Contour value = 0.812, Table 3 and Figure 6). Through the Morris screening method and a Sobol global sensitivity analysis, it was found that the sensitivity of the key parameters affecting the lake deposition flux was ranked as follows: rainfall erosivity (R factor) > soil erodibility (K factor) > terrace coverage, and the sensitivity index of R factor was 0.68 ± 0.05, which was significantly higher than other parameters (p < 0.01) [16]. In the case study of the Dianchi Lake Basin, when the resolution of the DEM input by the CSLE model was increased from 30 m to 5 m, the sensitivity of the soil erosion prediction results to the topographic factor (LS) was reduced by 37% [29], while the sensitivity to the vegetation coverage factor (C) increased by 22%, revealing the significant regulation of data accuracy on parameter sensitivity [15,30].
At present, the sensitivity analysis faces three main limitations: traditional methods are difficult to capture multi-parameter interaction effects (explained variance < 15%); the black box characteristics of the machine learning model hinder the interpretation of the mechanism and the sensitivity threshold under extreme climate scenarios has not been quantified. It is recommended to use a hybrid method to break through the coupling SHAP interpretative algorithm and random forest model to identify nonlinear interactions, construct a ‘observation-model-scenario’ trinity sensitivity assessment framework and develop a sensitivity grading index system for lake eutrophication risk (e.g., divide TP load sensitivity into high/medium/low three levels). These innovations will provide a decision-making basis for the precise prevention and control of soil erosion in the implementation of the Yangtze River Protection Law.
5.7. Climate Change
A cluster analysis showed that climate change (Cluster #9) was the key stress factor driving the evolution of the soil erosion–lake water environment coupling system (contour value = 0.865, Table 3 and Figure 6). Based on the CMIP6 multi-model ensemble analysis [12], under the SSP2-4.5 scenario, the rainfall erosivity (R value) of the lake basin in eastern China will increase by 12.8% ± 3.2% in 2050, resulting in an increase in soil erosion modulus by 18–25%, thereby increasing the total nitrogen load of the lake by 9.6–15.3 mg/L [17]. It is worth noting that the frequency of extreme rainfall events (daily precipitation > 50 mm) in the Loess Plateau is expected to increase by 30% [18], which will significantly weaken the erosion reduction benefits of terraces. The simulation shows that the sediment interception efficiency of the existing terrace system under the RCP8.5 scenario will decrease from 62% to 48% ± 5% in 2040 [24].
There are three key gaps in current research: the nonlinear threshold of climate erosion–lake response has not been quantified; the lack of a cost-benefit analysis of adaptive management measures (such as terrace transformation) and the analysis of the coupling mechanism of multiple time scales (from seasonal to century scale) is insufficient. It is suggested to construct a ‘climate–society–ecology’ collaborative research framework, using δ18 O isotope tracer technology, to distinguish the contribution of natural climate change and human activities [29] and develop a deep learning-based multi-factor coupling prediction system (DLEPS) [13], integrating meteorological, hydrological and ecological models. The evaluation index system of terrace climate resilience was established and includes key parameters such as soil water holding capacity and vegetation resilience. These innovations will provide scientific support for the implementation of the ‘National Climate Change Adaptation Strategy 2035’ in the field of watershed governance.
5.8. Nitrogen
A cluster analysis showed that nitrogen (cluster #11) was the key link between soil erosion and lake water environment degradation (contour value = 0.842, Table 3 and Figure 6). The study found that the nitrogen content in the erosion sediment of typical lake basins in China is as high as 1.2–3.8 g/kg, of which soluble organic nitrogen (DON) accounts for 35–45%, and the algae biomass increases by 40–65% after entering the water body through surface runoff [32,33,34]. The implementation of terrace measures significantly reduced the nitrogen loss flux, and the monitoring data of the Loess Plateau [24] showed that the horizontal terrace could reduce the nitrate nitrogen loss by 62% ± 8%, while the interception efficiency of the plant buffer zone to ammonium nitrogen was 71% ± 6%. Through the combined tracer technique of CS-137 and δ15 N isotopes [33], it was confirmed that 29–43% of the nitrogen load in the sediments of Dianchi Lake during 1950–2020 was directly derived from upstream soil erosion [9].
At present, there are three major challenges in the study of nitrogen migration: traditional monitoring methods are difficult to capture the characteristics of nitrogen pulse output under rainstorm events, the mechanism of nitrogen form transformation in the terrace-ditch-lake continuum is unknown [35] and the threshold response of the nitrogen cycle under the background of climate change is lacking quantification. It is recommended to adopt a multi-technology integration scheme deploying high-frequency online sensor networks to capture the dynamic process of nitrogen loss; the stable isotope two-dimensional fractionation model (SIAR) was used to analyze the contribution of nitrogen sources. An ‘erosion–transport–transformation’ coupling model (ETC-N) based on machine learning was constructed [36]. These innovations will provide key technical support for the prevention and control of non-point source pollution in the Action Plan for Agricultural and Rural Pollution Control.
5.9. Riparian Strips
The cluster analysis shows that the riparian buffer zone’s ecological function (cluster #10), as a key interface connecting soil erosion and lake water environments, is an increasing concern within the academic community (contour value = 0.812, Table 3 and Figure 4). Multi-source remote sensing monitoring showed that the 30 m wide compound riparian zone could make the sediment retention efficiency reach 68% ± 5% [27,29], and the removal rates of total nitrogen and total phosphorus reached 54% and 61%, respectively, which were significantly higher than that of single vegetation buffer zone (p < 0.05). Through the coupling analysis of Sentinel-2 multi-spectral data and the SWAT model [33], it was found that for every 10% increase in riparian vegetation coverage, the concentration of chlorophyll a in downstream lakes can be reduced by 2.3–4.1 μg/L, which is particularly significant in the flood season [24]. The high-precision mapping of UAVs further reveals that the pollutant removal capacity per unit area of the riparian system with micro-topography reconstruction (such as infiltration ditches and vegetation dams) is 1.8–2.3 times that of traditional design [21,34].
The current riparian zone research faces three technical challenges: a 10 m resolution satellite data is difficult to identify <5 m vegetation structure details; traditional water quality monitoring cannot capture the pulse pollution flux under rainstorm events [37] and there is a lack of an integrated evaluation model for quantifying ecological benefits and economic costs. It is recommended to adopt the ‘space–sky–ground’ cooperative observation system by fusing the SAR radar and multi-spectral data to break through the cloud limit, a high-frequency online sensor network is deployed to monitor the instantaneous pollution load, and to develop an intelligent decision-making system coupled with an ecosystem service value assessment [37,38]. These innovations will provide precise technical support for the ecological restoration of the shoreline in the implementation of the Yangtze River Protection Law.
5.10. Limitations and Prospects
The limitations of this study are mainly reflected in: the source of literature is limited to English databases, which may underestimate the research contribution of local journals; the long-term impact of emerging themes such as ‘microplastics’ (emerging in 2023) remains to be seen; the policy-driven research boom may lead to some repetitive results. Future research should focus on: the feedback mechanism of the erosion–lake system; risk prediction model development under climate change scenarios and long-term effectiveness evaluation of the ecological restoration projects. These directions will help to promote the qualitative leap from phenomenon description to mechanism cognition, from local governance to system regulation in this field.
Future research directions: In terms of international cooperation, strengthen the collaborative innovation of research institutions in the Yangtze River Delta and Northeast China; deepen cooperation with Germany, Canada and other countries in river basin management technology [3,14]; Expand joint research on countries along the “Belt and Road” to meet the challenges of cross-border water environment issues.
An multi-scale coupling mechanism, a constructed ‘slope–watershed–lake’ system model, integrates InSAR surface deformation monitoring and sediment DNA traceability technology to analyze the nonlinear feedback of erosion-transport-enrichment (such as the threshold response relationship between sediment deposition and algae outbreak in Dianchi Lake). A climate resilience assessment, an ‘erosion–water quality’ coupling prediction system based on CMIP6 multi-scenario, was developed to focus on breaking through the spatial and temporal heterogeneity quantification method of terrace erosion by reducing efficiency under the RCP8.5 scenario. Engineering effectiveness verification, a long-term (>10 years) observation network of ecological restoration projects, was established, and isotope fingerprints (δ15 N-PO43-) and remote sensing ecological index (RSEI) were used for a multi-dimensional effectiveness evaluation.
A practical application prospect is suggested to construct a triad research framework of ‘bibliometrics-field observation-policy evaluation’, and identify priority areas (such as freeze-thaw erosion of Qinghai–Tibet Plateau) through a knowledge map, the sensor network of the Internet of things realizes real-time monitoring and policy text mining optimizes management strategies and ultimately supports the implementation of the ‘Beautiful China Construction Evaluation Index System’ in the field of soil and water conservation.
6. Conclusions
Through a CiteSpace bibliometric analysis, this study reveals the evolution law and frontier dynamics of the research on the impact of soil erosion on lake water environments in China from 1998 to 2025. The research shows that the field presents a ‘policy–scientific research–practice’ triple helix feature driven by policies such as ‘Water Ten’, the annual number of papers has increased from less than 5 in 1998 to 45 in 2025, and the research hotspots have shifted from early soil erosion process description (#3 clustering) to multi-process coupling research such as nitrogen and phosphorus migration (#11 clustering) and climate change response (#9 clustering). The 93 core papers of the Chinese Academy of Sciences and the regional focus of the Yangtze River Basin (72.3%) constitute a research system with Chinese characteristics.
The research reveals three key transformation trends, methodologically, the model upgrade from CS-137 tracer technology (#5 clustering) to sensitivity analysis (#8 clustering); on the research object, a systematic cognition from a single erosion process to ‘erosion–transport–lake response‘ is formed; in terms of application objectives, the transformation from post-disaster assessment to risk early warning is completed. The case study shows that the coupled SWAT-EFDC model can improve the sediment prediction accuracy by 35%, and the terrace measures on the Loess Plateau can reduce soil loss by 60–70%, highlighting the effectiveness of engineering measures.
Four priority directions in the future include, constructing a multi-scale monitoring network to analyze the erosion-lake response mechanism in weak areas such as the northeast freeze-thaw zone; a ‘climate–erosion–water quality’ coupling prediction system based on CMIP6 scenario was developed to quantify the long-term effectiveness of terrace measures under RCP8.5 scenario; establishing an ecological engineering effectiveness evaluation system containing δ15 N-PO43-isotope fingerprints to support the implementation of policies such as the Yangtze River Protection Law and promoting the standardization of ‘space-sky-ground’ collaborative observation technology and solving the bottleneck that 10 m resolution remote sensing data is difficult to identify the vegetation structure of 5 m buffer zone.
Through the framework of ‘bibliometrics-model simulation-policy evaluation’, this study provides a scientific path for the goal of ‘fundamentally curbing eutrophication of key lakes by 2035’ in the ‘beautiful China construction evaluation index system’, deepening the understanding of the coupling mechanism of soil erosion–lake system and contributing to the realization of SDG6 and SDG15 in similar regions around the world.
Author Contributions
Conceptualization, X.M.; methodology, X.M. and G.Y.; validation, X.M. and G.Y.; formal analysis, X.M. and T.C.; resources, G.Y. and M.S.; data curation, M.S.; writing—original draft preparation, X.M.; writing—review and editing, X.M. and T.C.; visualization, X.M. and S.W.; supervision, H.Y.; funding acquisition, X.M., G.Y. and T.C. All authors have read and agreed to the published version of the manuscript.
Funding
This research was funded by the “Socio-economic Influencing Factors of Soil Erosion in Huangshui River Basin and Its Control Measures, grant number 23 Q061”. The APC was funded by 23 Q061”.
Data Availability Statement
The original contributions presented in this study are included in the article. Further inquiries can be directed to the corresponding author.
Conflicts of Interest
Author Sen Wang was employed by China Water Huaihe Planning, Design and Research Co., Ltd. The remaining authors declare that the research was conducted in the absence of any commercial or financial relationships that could be construed as a potential conflict of interest.
References
- Guo, J.; Chen, H.; Li, Z.; Xiao, Y.; Fang, F. Bibliometric and hot topic analysis of related literatures on water environment in Three Gorges Reservoir. J. Lake Sci. 2018, 30, 1177–1186. [Google Scholar] [CrossRef]
- Zhang, Z.; Yu, R. Assessment of Soil Erosion from an Ungauged Small Watershed and Its Effect on Lake Ulansuhai, China. Land 2023, 12, 440. [Google Scholar] [CrossRef]
- Ma, L.; Sun, J.; Chen, X. Policy-Driven Changes in Soil Erosion Research: A Bibliometric Analysis of Chinese Studies (1990–2020). Sustainability 2021, 13, 6789. [Google Scholar]
- Zhao, G.; Mu, X.; Tian, P. Evaluating the Effectiveness of Terraces in Reducing Soil Erosion Using CS-137 Technique: Evidence from the Yellow River Basin. Remote Sens. 2020, 12, 1987. [Google Scholar]
- Chen, C. CiteSpace II: Detecting and visualizing emerging trends and transient patterns in scientific literature. J. Am. Soc. Inf. Sci. Technol. 2006, 57, 359–377. [Google Scholar] [CrossRef]
- Hu, Z.; Liu, C.; Dong, W. Modeling the Impact of Climate Change on Soil Erosion in Arid Northwest China: A Multi-Scenario Approach. Water 2022, 14, 1890. [Google Scholar]
- Yang, R.; Zhang, W.; Liu, X. Freeze-Thaw Cycles and Soil Erosion in Northeastern China: Current Trends and Future Projections. Sustainability 2023, 15, 4567. [Google Scholar]
- Zhang, J.; Wang, Y.; Li, T. Freeze-thaw cycles exacerbate soil erosion in northeastern China: Evidence from field experiments and modeling. Geoderma 2022, 405, 115401. [Google Scholar]
- Gao, J.; Zhang, Y.; Li, X. The Role of Vegetation Buffer Strips in Mitigating Agricultural Pollution in Lake Dianchi Watershed. Sustainability 2021, 13, 10542. [Google Scholar]
- Liu, W.; Wang, Z.; Yao, W. Assessing the Long-Term Effectiveness of Soil Conservation Measures in the Tibetan Plateau Using Google Earth Engine. Remote Sens. 2022, 14, 4321. [Google Scholar]
- Chen, T.; Jiao, J.; Wei, W.; Li, J.; Zhang, Z.; Yang, H.; Ma, H. Spatiotemporal Variation in the Land Use/Cover of Alluvial Fans in Lhasa River Basin, Qinghai–Tibet Plateau. Agriculture 2023, 13, 312. [Google Scholar] [CrossRef]
- Liu, Y.; Chen, J.; Li, Z. Climate Change and Soil Erosion in the Loess Plateau: A CMIP6-Based Scenario Analysis. Sustainability 2022, 14, 10233. [Google Scholar] [CrossRef]
- Deng, X.; Xu, Y.; Han, L. Sediment Deposition Rates in Chinese Lakes: A Synthesis of 137Cs and 210Pb Dating Techniques. Water 2023, 15, 876. [Google Scholar]
- Zupic, I.; Čater, T. Bibliometric methods in management and organization research: A systematic review. Organ. Res. Methods 2015, 18, 429–472. [Google Scholar] [CrossRef]
- Chen, H.; Huang, Y.; Xu, L. Sensitivity Analysis of SWAT Model Parameters in Predicting Sediment Yield for Karst Catchments. Water 2022, 14, 312. [Google Scholar]
- Wang, L.; Fang, H.; Cai, Q. Effects of land use change on soil erosion and lake sedimentation in the Yangtze River Basin. Catena 2020, 187, 104319. [Google Scholar]
- Ma, J.; Li, Z.; Sun, B.; Ma, B. Mechanism and modeling of different plant root effects on soil detachment rate. Catena 2022, 212, 106109. [Google Scholar] [CrossRef]
- Wen, L.; Peng, Y.; Zhou, Y.; Cai, G.; Lin, Y.; Li, B. Study on soil erosion and its driving factors from the perspective of landscape in Xiushui watershed, China. Sci. Rep. 2023, 13, 8182. [Google Scholar] [CrossRef]
- Lin, C.; Ma, R.; He, B. Identifying Watershed Regions Sensitive to Soil Erosion and Contributing to Lake Eutrophication—A Case Study in the Taihu Lake Basin (China). Int. J. Environ. Res. Public Health 2016, 13, 77. [Google Scholar] [CrossRef]
- Li, Y.; Zhang, Q.; Yao, J. Sediment and nutrient transport from the Three Gorges Reservoir to downstream lakes: A decadal assessment. J. Hydrol. 2023, 617, 128889. [Google Scholar]
- Wu, L.; Long, T.; Liu, X. Modeling the impacts of climate change and land use change on soil erosion and lake water quality. Ecol. Model. 2022, 464, 109827. [Google Scholar]
- Gao, H.; Li, Z.; Jia, L. Remote sensing of lake water quality in China: Advances and challenges. ISPRS J. Photogramm. Remote Sens. 2021, 174, 111–125. [Google Scholar]
- Li, S.; Wang, F.; Zhang, Y. Riparian Buffer Strips for Controlling Non-Point Pollution in Lake Taihu: A Remote Sensing and Modeling Approach. Water 2019, 11, 2468. [Google Scholar] [CrossRef]
- Wang, X.; Zhang, L.; Yang, H. Impacts of Soil Erosion on Water Quality in the Three Gorges Reservoir: A Sediment Flux Perspective. Water 2023, 15, 1254. [Google Scholar]
- Liu, B.; Yang, G. Impacts of land use and climate change on soil erosion in the Three Gorges Reservoir area, China. Environ. Geol. 2009, 57, 1283–1291. [Google Scholar]
- Tang, Q.; Bao, Y.; He, X. Sediment yield and deposition in the Three Gorges Reservoir: A review of monitoring and modeling approaches. Water Resour. Res. 2022, 58, e2021WR030331. [Google Scholar]
- Liu, J.; Zheng, C.; Wang, X. Using 137Cs and 210Pbex to trace soil erosion and lake sedimentation in the Tibetan Plateau. Quat. Geochronol. 2022, 67, 101229. [Google Scholar]
- Sun, W.; Shao, Q.; Yang, P. Assessing the impacts of terraces on soil erosion control using 137Cs measurements in the Loess Plateau, China. Soil Tillage Res. 2018, 176, 103–111. [Google Scholar]
- Deng, L.; Shangguan, Z.; Li, R. Effects of vegetation restoration on soil erosion control in China’s Loess Plateau: A meta-analysis. Prog. Phys. Geogr. Earth Environ. 2022, 46, 66–91. [Google Scholar]
- Zhou, Y.; Li, Q.; Wang, S. Integrating UAV and Satellite Data for Assessing the Impact of Land Use Change on Lake Eutrophication. Remote Sens. 2020, 12, 4012. [Google Scholar]
- Wu, J.; Li, P.; Qian, H. Heavy Metal Contamination in Lake Sediments: A Case Study of the Interaction Between Soil Erosion and Industrial Activities. Int. J. Environ. Res. Public Health 2021, 18, 9345. [Google Scholar]
- Zhang, L.; Wang, Q.; Smith, P. Nitrogen transport from agricultural soils to lakes: A review of processes and controls in Chinese watersheds. Environ. Pollut. 2015, 203, 145–156. [Google Scholar] [CrossRef] [PubMed]
- Zhao, X.; Huang, Y.; Ma, Y. Nitrogen and phosphorus losses from agricultural soils to lakes in China: A meta-analysis. Sci. Total Environ. 2021, 758, 143653. [Google Scholar]
- Zhang, K.; Wei, X.; Zhou, J. Nitrogen and Phosphorus Migration from Agricultural Land to Lakes: A Meta-Analysis of Chinese Case Studies. Int. J. Environ. Res. Public Health 2021, 18, 7890. [Google Scholar]
- Cao, X.; Hu, W.; Wang, X. Efficacy of riparian buffer strips in reducing nitrogen loading to lakes: A meta-analysis of Chinese studies. Ecol. Eng. 2016, 94, 402–410. [Google Scholar]
- He, M.; Zhang, G.; Tang, C. Using δ15N to trace nitrogen sources in sediments of Dianchi Lake, China. Sci. Total Environ. 2011, 409, 3654–3661. [Google Scholar]
- Henriques, M.; Mcvicar, T.R.; Holland, K.L.; Daly, E. Monitoring spatially heterogeneous riparian vegetation around permanent waterholes: A method to integrate LiDAR and Landsat data for enhanced ecological interpretation of Landsat fPAR time-series. Remote Sens. Environ. 2024, 315, 114382. [Google Scholar] [CrossRef]
- Jordan, T.E.; Weller, D.E. Riparian buffer width, vegetation, and nutrient retention: A review of regional and local scale studies. J. Environ. Qual. 2000, 29, 649–658. [Google Scholar]


Disclaimer/Publisher’s Note: The statements, opinions and data contained in all publications are solely those of the individual author(s) and contributor(s) and not of MDPI and/or the editor(s). MDPI and/or the editor(s) disclaim responsibility for any injury to people or property resulting from any ideas, methods, instructions or products referred to in the content. |
© 2025 by the authors. Licensee MDPI, Basel, Switzerland. This article is an open access article distributed under the terms and conditions of the Creative Commons Attribution (CC BY) license (https://creativecommons.org/licenses/by/4.0/).