Article

Experimental Assessment of Vegetation Density and Orientation Effects on Flood-Induced Pressure Forces and Structural Accelerations

1
Department of Civil Engineering, University of Engineering and Technology Taxila, Rawalpindi 47080, Pakistan
2
Department of Civil Engineering, College of Engineering, Qassim University, Al-Mulida 51431, Saudi Arabia
3
Department of Civil Engineering, Aristotle University of Thessaloniki, 54124 Thessaloniki, Greece
4
Department of Civil Engineering, Comsats University Islamabad, Abbottabad Campus, Abbottabad 22060, Pakistan
5
Multan Electric Power Company, Water and Power Development Authority, Lahore 54000, Pakistan
*
Authors to whom correspondence should be addressed.
Water 2025, 17(19), 2879; https://doi.org/10.3390/w17192879
Submission received: 28 August 2025 / Revised: 27 September 2025 / Accepted: 30 September 2025 / Published: 2 October 2025

Abstract

This study aims to assess the effect of vegetation angle and density on hydrostatic pressure and acceleration of a downstream house model experimentally. The vegetation cylinders were positioned at angles 30°, 45°, 60° and 90° with respect to the flow and two densities of vegetation conditions, i.e., sparse (G/d = 2.13) and intermediate (G/d = 1.09), where G is the spacing between the model vegetation elements in the cross-stream di-rection and d is the vegetation diameter. The streamwise acceleration of the house model was measured by an X2-2 accelerometer that was located downstream from the vegetation patches. Results show that the perpendicular orientation of the vegetation patch (90°) most effectively reduces hydrodynamic loads, with intermediate density (I90) achieving the highest reductions, i.e., 22.1% for acceleration and 7.4% for pressure impacts. Even sparse vegetation (S90) provided substantial protection, reducing acceleration by 21.9% and pressure by 5.8%. These findings highlight the importance of integrating vegetation density and orientation into flood management designs to enhance both their performance and reliability under varying hydraulic conditions.

1. Introduction

Natural disasters, such as tsunamis, floods, and storm surges, have a significant impact on coastal regions [1]. Among these disasters, floods and tsunamis pose severe threats to infrastructure and residential buildings. Recent studies highlight the persistent threat faced by coastal communities, with annual floods claiming the lives of approximately 20,000 individuals and impacting the livelihoods of 20 million worldwide [2]. Over the past few decades, Asian and European countries have experienced catastrophic floods and tsunamis, resulting in extensive damage to buildings and loss of human life [3]. The immense losses incurred by these calamities have spurred scientific research into both structural and non-structural defences against flood and tsunami devastation [4]. Previous studies primarily focused on risk assessment through flood mapping of riverbeds and flood-prone areas [5]. Over the past decade, researchers have investigated energy dissipation and flow behaviours across embankments using prototypes, numerical models, and analytical techniques [6]. A multitude of studies have explored combined defence systems, such as sea embankments and riparian vegetation, double embankment configurations, and the integrated defence approach of moat dikes with vegetation. This acknowledges the prohibitive cost and time requirements associated with artificial solutions, such as dams and canals, particularly for developing nations [7].
However, the integrity of ecosystems has emerged as a critical factor in water management challenges. Given the substantial capital investments required for hard structures and their susceptibility to failure under extreme conditions, researchers have focused on the synergy between hard and soft defences, particularly the interplay between building structures or hydraulic defences (such as concrete walls) and vegetation. For example, some recent devastating floods have been characterized by the rapid inundation of entire floodplains following embankment failures. The complex hydrodynamics of such events, particularly the interaction between main channels and vegetated floodplains which influences flow resistance and breach propagation, can be investigated through experimental studies [8,9]. Vegetation acts as a natural barrier, absorbing a portion of the flood force and stabilizing the banks. Therefore, evaluating uncertainty in such phenomena is essential, as they challenge existing risk assessment paradigms rooted in historical and deterministic approaches [9,10].
Riparian vegetation, as indicated by post-flood surveys, plays a crucial role in mitigating flood energy and capturing debris, thereby reducing the destructive impacts of flooding. Analytical and experimental findings have underscored the significance of vegetation density and geometry in diminishing flood energy [11]. Downstream of vegetation, a marked reduction in water level and velocity has been observed. Additionally, the orientation of vegetation relative to the main flow direction has a profound influence on flow parameters, including energy dissipation, approach time, and flow patterns [12,13]. To quantify energy dissipation through various vegetation densities, a series of experiments was conducted under diverse flow conditions [4]. The collision of water with plants weakens its force, resulting in a gentler impact on structures [14,15]. However, recent studies have highlighted that structural damage is significantly influenced by dynamic and impact loads induced by debris [2,16,17].
Therefore, there is an urgent need to mitigate structural strain caused by flooding and assess the vulnerability of civil structures to dynamic loading [3,4]. Recent efforts have aimed at mitigating dynamic loads on structures by employing both natural (soft) and artificial (hard) solutions [9,18]. While several studies have explored combinations of defence systems, including sea embankments, riparian vegetation, double embankments, moat dikes with vegetation, and moats with or without vegetation, the high costs and protracted timelines associated with artificial solutions have deterred their adoption, especially in developing nations [7,19]. The safety of structures in floodplains constitutes a global challenge [20,21]. Persistent exposure to natural hazards, such as flooding, seismic activity, and weathering, poses the most significant threat to structural integrity [22,23]. Due to the importance of structures in human life, it is crucial to ensure ongoing monitoring of their safety and performance [24,25]. A micro-electro-mechanical sensor (MEMS) equipped with a high-sensitivity accelerometer, offers the capacity to collect crucial data for calculating a structure’s vibration and acceleration [26,27,28]. Using a USB X2-2 accelerometer, one can record a building’s acceleration history, with the accelerometer functioning as both a sensor and data collector [29,30,31].
Although the role of vegetation in flood energy dissipation is recognized, a critical gap exists in understanding how its spatial arrangement specifically orientation and density affect the destabilizing acceleration forces on downstream structures. This paper bridges this gap by presenting an experimental analysis of how vegetation angles (30° to 90°) and densities (sparse and intermediate) mitigate hydrostatic pressure and, crucially, reduce the streamwise acceleration of a model structure. Our findings reveal that the vegetation patch oriented at 90° to the main flow direction, most effectively reduces pressure on the house model, with the intermediate density (I90) achieving the highest reductions, i.e., 22.1% in acceleration and 7.4% in pressure. Even sparse vegetation (S90) provided substantial protection, reducing acceleration by 21.9% and pressure by 5.8%.

2. Materials and Methods

2.1. Experimental Setup

First, a physical model of the building was constructed using wooden tiles, while the vegetation array consisted of steel cylinders. After preparing the model, it was placed in the channel for experiments, and the depth in front of the model structure was measured. To investigate the various forces (impact and hydrostatic forces) acting on the model structure and its acceleration under different vegetation configurations and densities, as well as in the absence of vegetation, the following methodology was employed.
Laboratory experiments were conducted in the glass-sided computerized channel at the Water Resources Laboratory of the Civil Engineering Department, University of Engineering and Technology, Taxila. The channel has specific dimensions: it is 0.31 m wide, 0.5 m deep, and 10 m in length, as illustrated in Figure 1a,b. The channel’s discharge was measured using a flow meter installed on the upstream side of the channel, as depicted in the diagram. The flow velocity was controlled by a pump speed controller located at the upstream end of the channel. Water depth was measured using a point gauge integrated within the channel. These experiments were designed to represent general ground and flood conditions and were not tied to any specific geographical location.

2.2. Vegetation Configurations

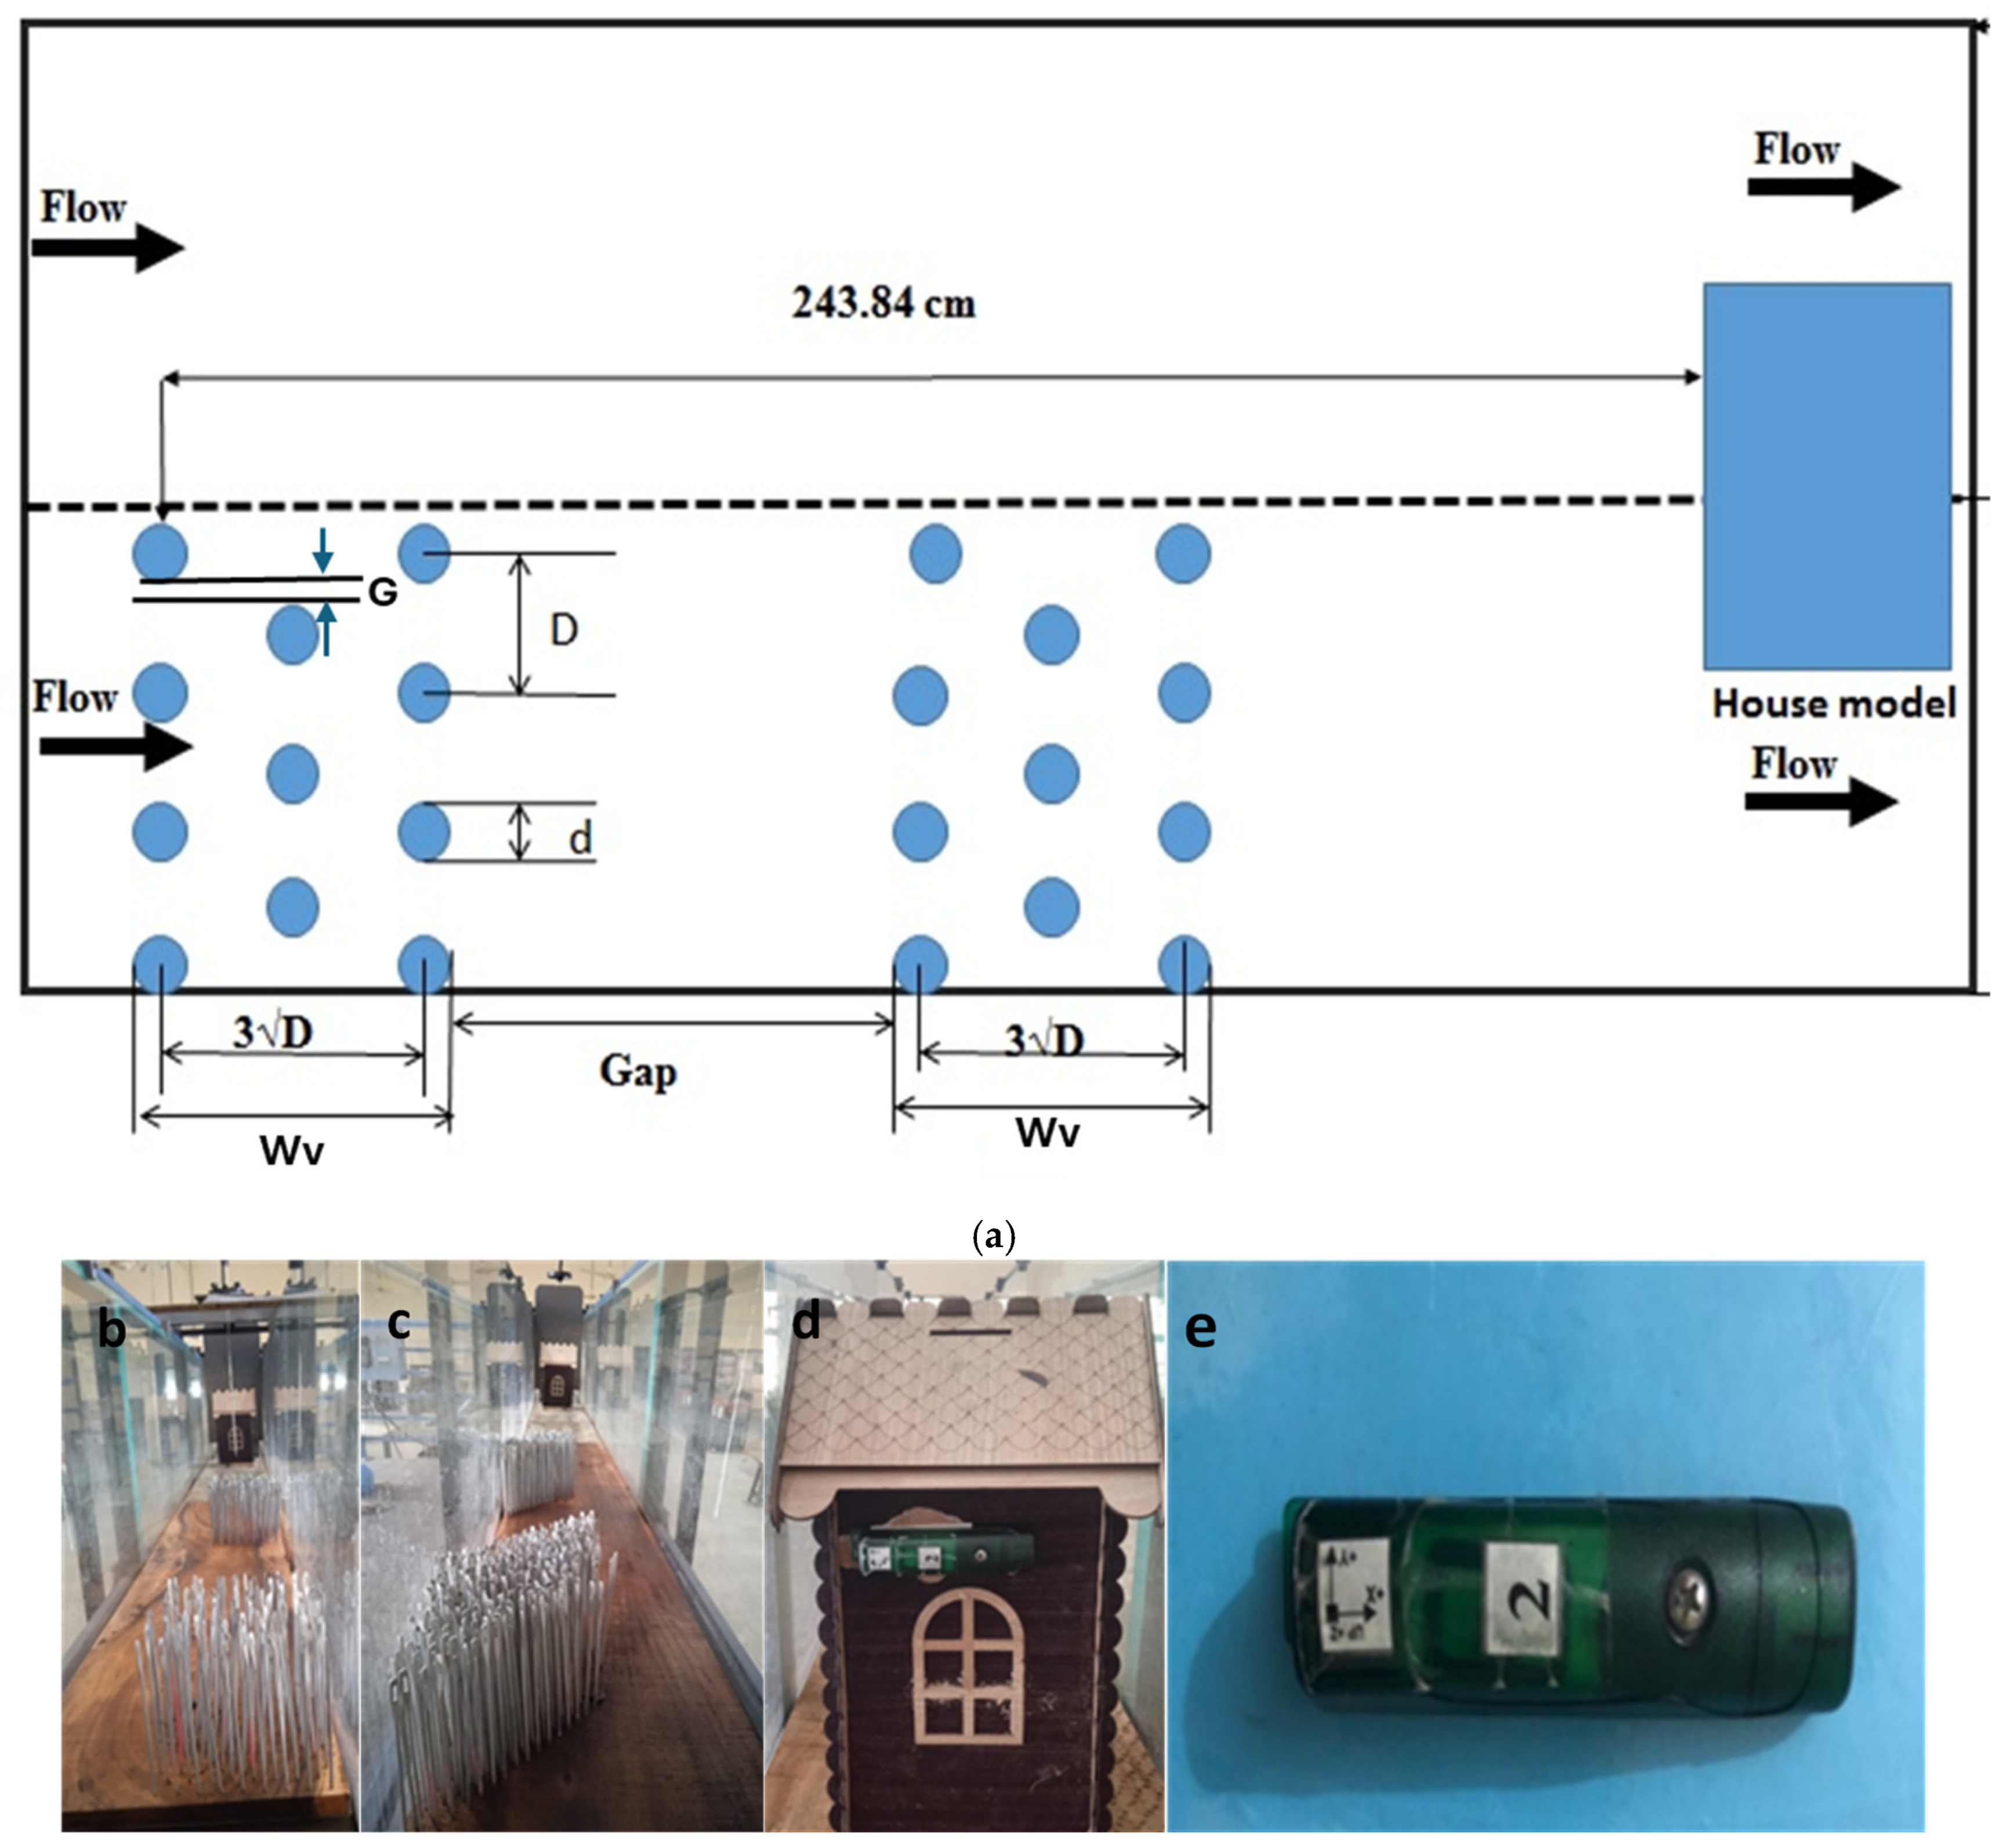
Eucalyptus tree species were selected for this study. At a 1:100 scale, the model represents prototype trees with a height of 7.6 to 14.6 m and a trunk diameter of approximately 0.11 to 0.3 m. To maintain geometrical similarity metal rods of 0.003 m (0.3 cm) at a scale of 1:100 was used which is a standard practice for representing solid, non-flexible tree trunks in physical hydraulic models [8,9]. The cylinders were arranged in two patches at various orientations (30°, 45°, 60°, and 90°) relative to the flow direction, covering half the width of the flume, as shown in Figure 2a. Experiments were conducted for seven Froude numbers within the range of 0.18–0.25. Various orientations of the vegetation were examined, as shown in Figure 2b,c. Initially, both vegetation and building models were placed perpendicular to the flow, and experiments were conducted under these conditions. Subsequently, the vegetation angle was adjusted to 90°, 60°, 45°, and 30° for each orientation, and experiments were conducted across all scenarios [9]. The acceleration of the building model, installed on the downstream, was measured by attaching an X2-2 accelerometer to the physical model structure, as shown in Figure 2d. The test building was rectangular, simulating a scaled-down physical model of a house also at scale, with dimensions of 16.5 cm in length, 15.5 cm in width, and 23 cm in height. This corresponds to a genuine building with dimensions of 742 cm in length, 698 cm in width, and 1035 cm in height.
In all experimental cases (Table 1), cylindrical vegetation dowels were used in a staggered pattern. The staggered arrangement was chosen for its higher flow resistance characteristics compared to a linear arrangement. Two vegetation densities were considered along with the third case of no vegetation: a sparse arrangement (denoted by “S”) and an intermediate arrangement (denoted by “I”), depending on the G/d ratio within the vegetation array, where “d” is the diameter of the model tree (herein represented by a cylindrical dowel of 0.3 cm in diameter) and “G” represents the spacing of each vegetation element in the cross stream direction. Thus, the G/d ratio of 1.09 indicates the intermediate density layout, while a G/d ratio of 2.13 signifies the sparse density arrangement. The width of vegetation patch (Wv) is selected by considering the thickness of vegetation dn = 180 No. cm, where d n = 2 d 2 3 W v d ×   10 2 which is the cumulative diameter of vegetation elements and is defined as the product of this diameter and the number of vegetation elements in a rectangle with a frontage of unit length along the bank of the river and depth equal to the width of vegetation (Wv). The value of the spacing between the vegetation elements was decided upon empirical observations in the field—these also return values of density that are representative of the sparse and intermediate vegetation density patches [7,14]. Different numbers of vegetation dowels (here denoted by “dn”) are also used, resulting in two distinct thicknesses for the vegetation patch: one with dn = 180 and another with dn = 380. The following combinations are tested: two vegetation patch densities (S and I), two vegetation patch thicknesses (with 180 and 380 number of vegetation elements), and four distinct orientations of the vegetation patch relative to the main flow direction, resulting in 16 combinations of vegetation densities, which are compared to the bare (no vegetation) case, for seven flow conditions with distinct Froude numbers, resulting in a total of (16 + 1) × 7 = 119 experimental combinations.
An X2-2 accelerometer (manufactured by GeoSIG, Zurich, Switzerland), featuring a rotating sensor with high sensitivity, is depicted in Figure 2e. This accelerometer type is instrumental in gauging the dynamic forces acting on the model structure when it is subjected to sudden hydrodynamic loading. To capture the building’s motion over time, a USB accelerometer can be employed [22]. The accelerometer serves as both a monitoring tool and a data collection device. Depending on the gain settings, it can record accelerations within the range of 1.25 g to 2 g. Additionally, the data recorder is operational within a temperature range spanning from −5 °F to 130 °F (−20 °C to 55 °C). It has been specifically designed for tracking structural vibrations and seismic activity. With a 15-bit resolution, users have the flexibility to select sample rates of 8, 16, 32, 64, 128, 256, or 512 Hz [20].

3. Results

3.1. Flow-Induced Pressure

The results illustrate the fluid pressure forces acting on the upstream face of the building model, both before and after the insertion of the vegetation array, under various flow conditions. Initially, flow parameters ranged from Fro = 0.18 to Fro = 0.25 in the absence of any vegetation within the channel. It was observed that the pressure force increased nearly linearly with the Froude number. The vegetation, however, demonstrated their ability to resist the incoming floodwaters, thereby reducing their hydraulic force. The effectiveness of the model depends on the vegetation’s ability to mitigate these fluid forces. Consequently, this study aimed to diminish fluid forces by modifying vegetation orientations under different vegetation conditions.

3.1.1. Effects of Vegetation Patch Density and Thickness

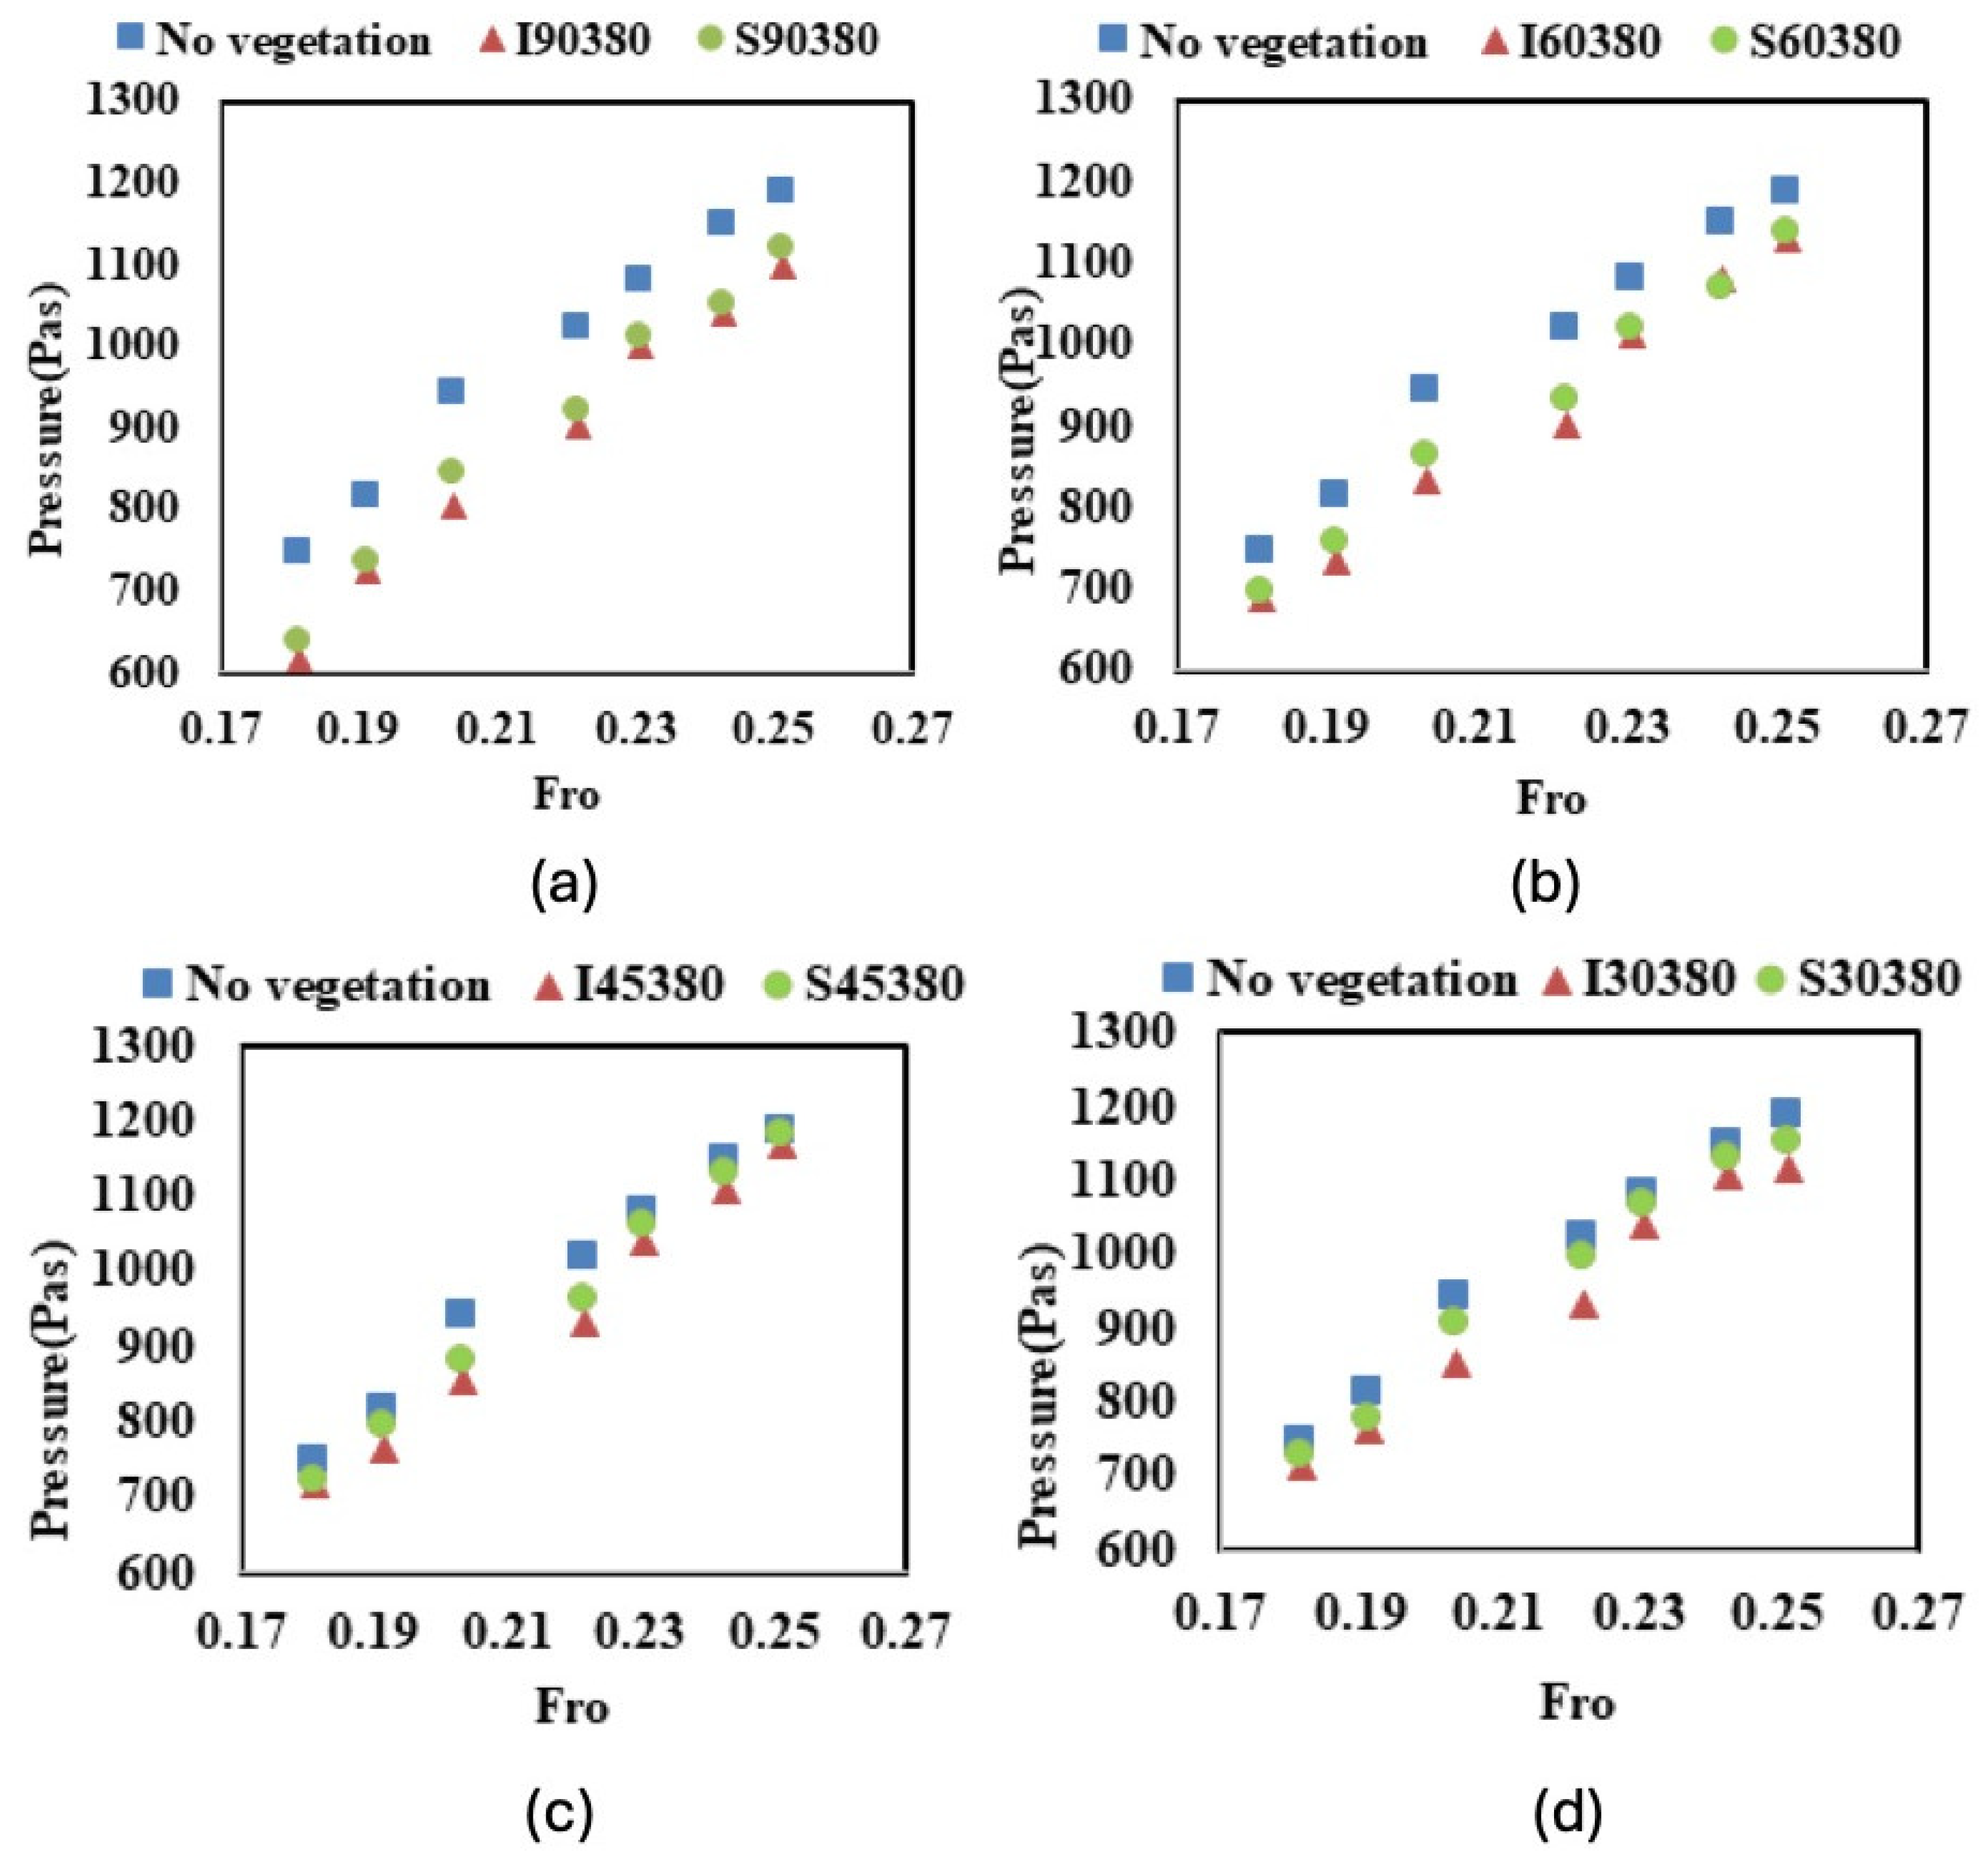
The comprehensive analysis of hydraulic pressure dissipation presented in Figure 3a–d and Figure 4a–d reveals several crucial insights into vegetation-based flood mitigation. Both sparse and intermediate density vegetation configurations demonstrated significant effectiveness in reducing hydrostatic pressure forces compared to non-vegetated conditions against all tested Froude numbers. The perpendicular orientation (90°) consistently emerged as the optimal arrangement for both vegetation densities, achieving the maximum pressure reduction due to its superior flow resistance characteristics. Intermediate density vegetation notably outperformed sparse vegetation at the same orientations, especially at higher Froude numbers. This demonstrates the superior capacity of denser vegetation patches to dissipate energy more effectively. The consistent superiority of the 90° orientation across both densities underscores the critical importance of vegetation alignment relative to flow direction. These findings provide robust empirical evidence that strategically designed vegetative barriers, particularly those featuring dense vegetation perpendicular to flow direction, can significantly reduce hydraulic pressure on downstream structures. The results offer valuable guidance for engineers and planners seeking to implement nature-based solutions for flood protection, emphasizing that optimal performance requires careful consideration of both vegetation density and orientation parameters in flood management design strategies.
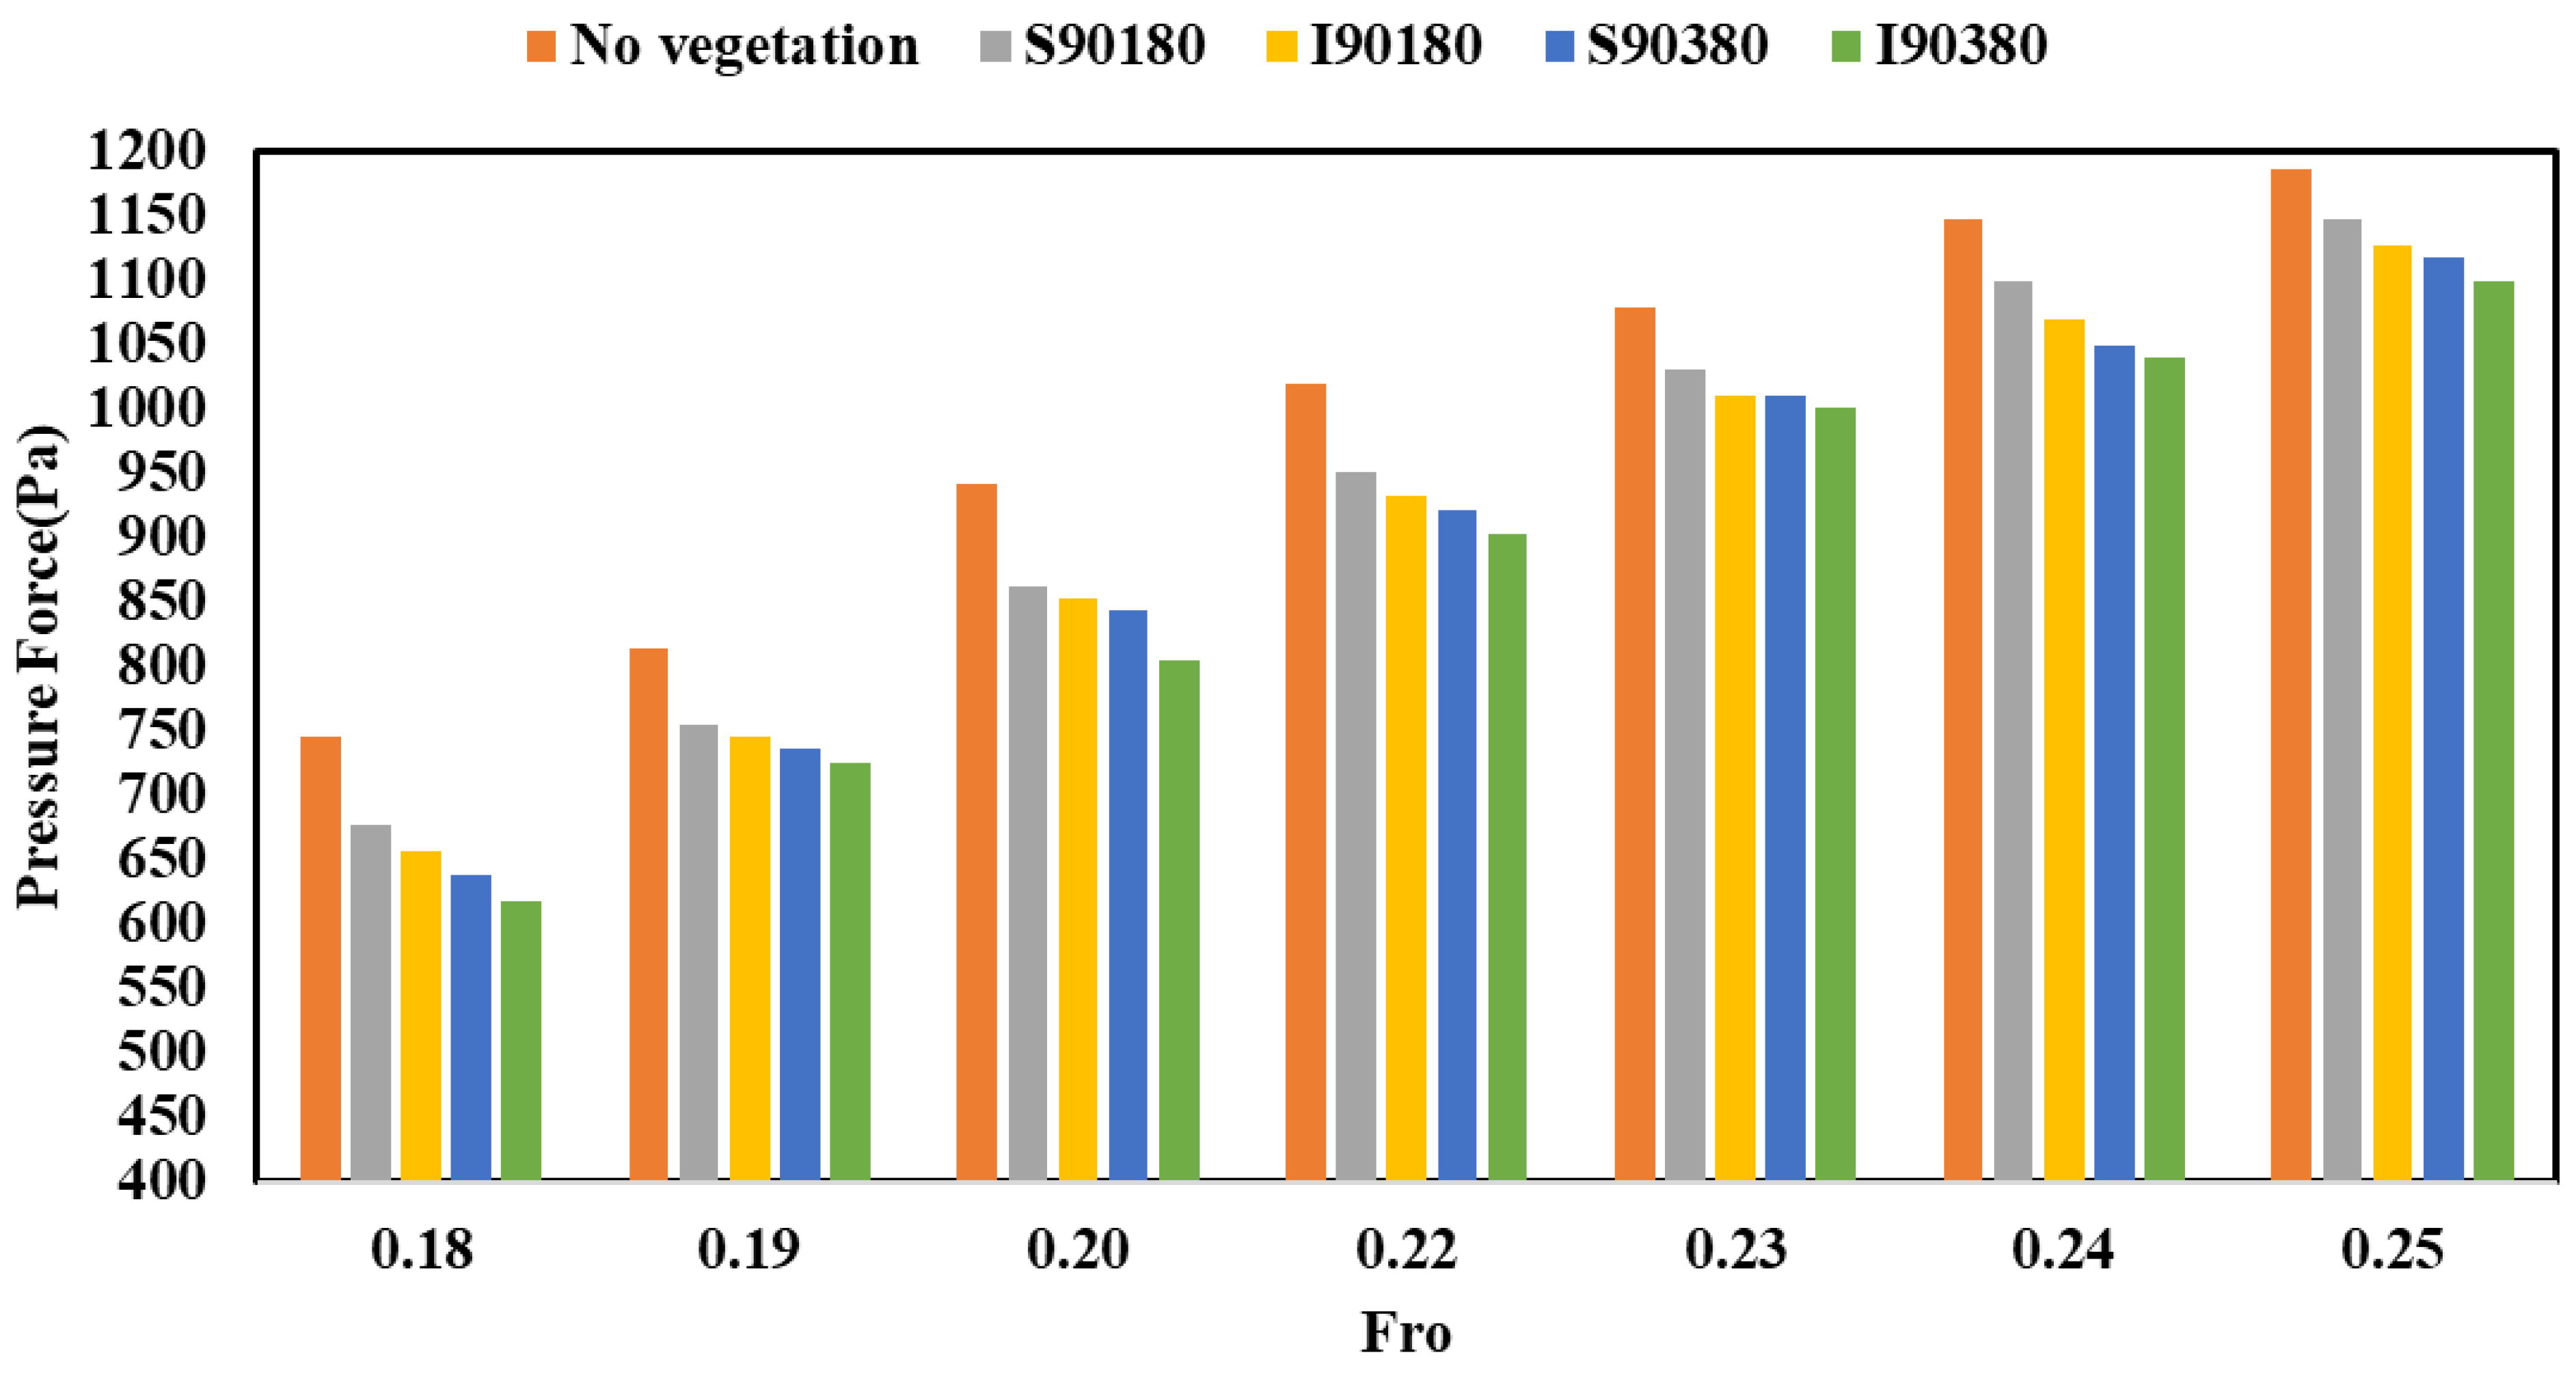
Figure 5 aims to illustrate one of the core finding of the study that maximizing flood protection requires optimizing both orientation (with 90° being the best) along with vegetation density. The superior performance of the denser, thicker patch is likely due to its increased ability to obstruct the main flow and dissipating its turbulent energy, thus reducing the impact as it reaches the model structure.

3.1.2. Effect of Angles and Staggered Arrangement

Experiments were conducted to determine the effect of different angles of vegetation placement. Figure 6a–d depicts the hydraulic pressure force versus Froude numbers for four various vegetation orientations (90°, 60°, 45°, 30°) and in the absence of vegetation. It demonstrates that decreasing the vegetation angle raises the hydraulic pressure upstream. The hydraulic pressure was found to be greatest in the absence of vegetation and lowest in an arrangement with vegetation at a 90° orientation. By increasing the orientation of the vegetation patch relative to the flow, more obstruction is provided by the vegetation. Perpendicular vegetation offers increased resistance to water flow, thereby reducing the water depth on the upstream face of the building model. Consequently, the fluid pressure force decreases. Maximum hydraulic pressure force reduction observed for I90380 (with vegetation in intermediate arrangement), and minimum pressure force reduction observed for the case without vegetation.
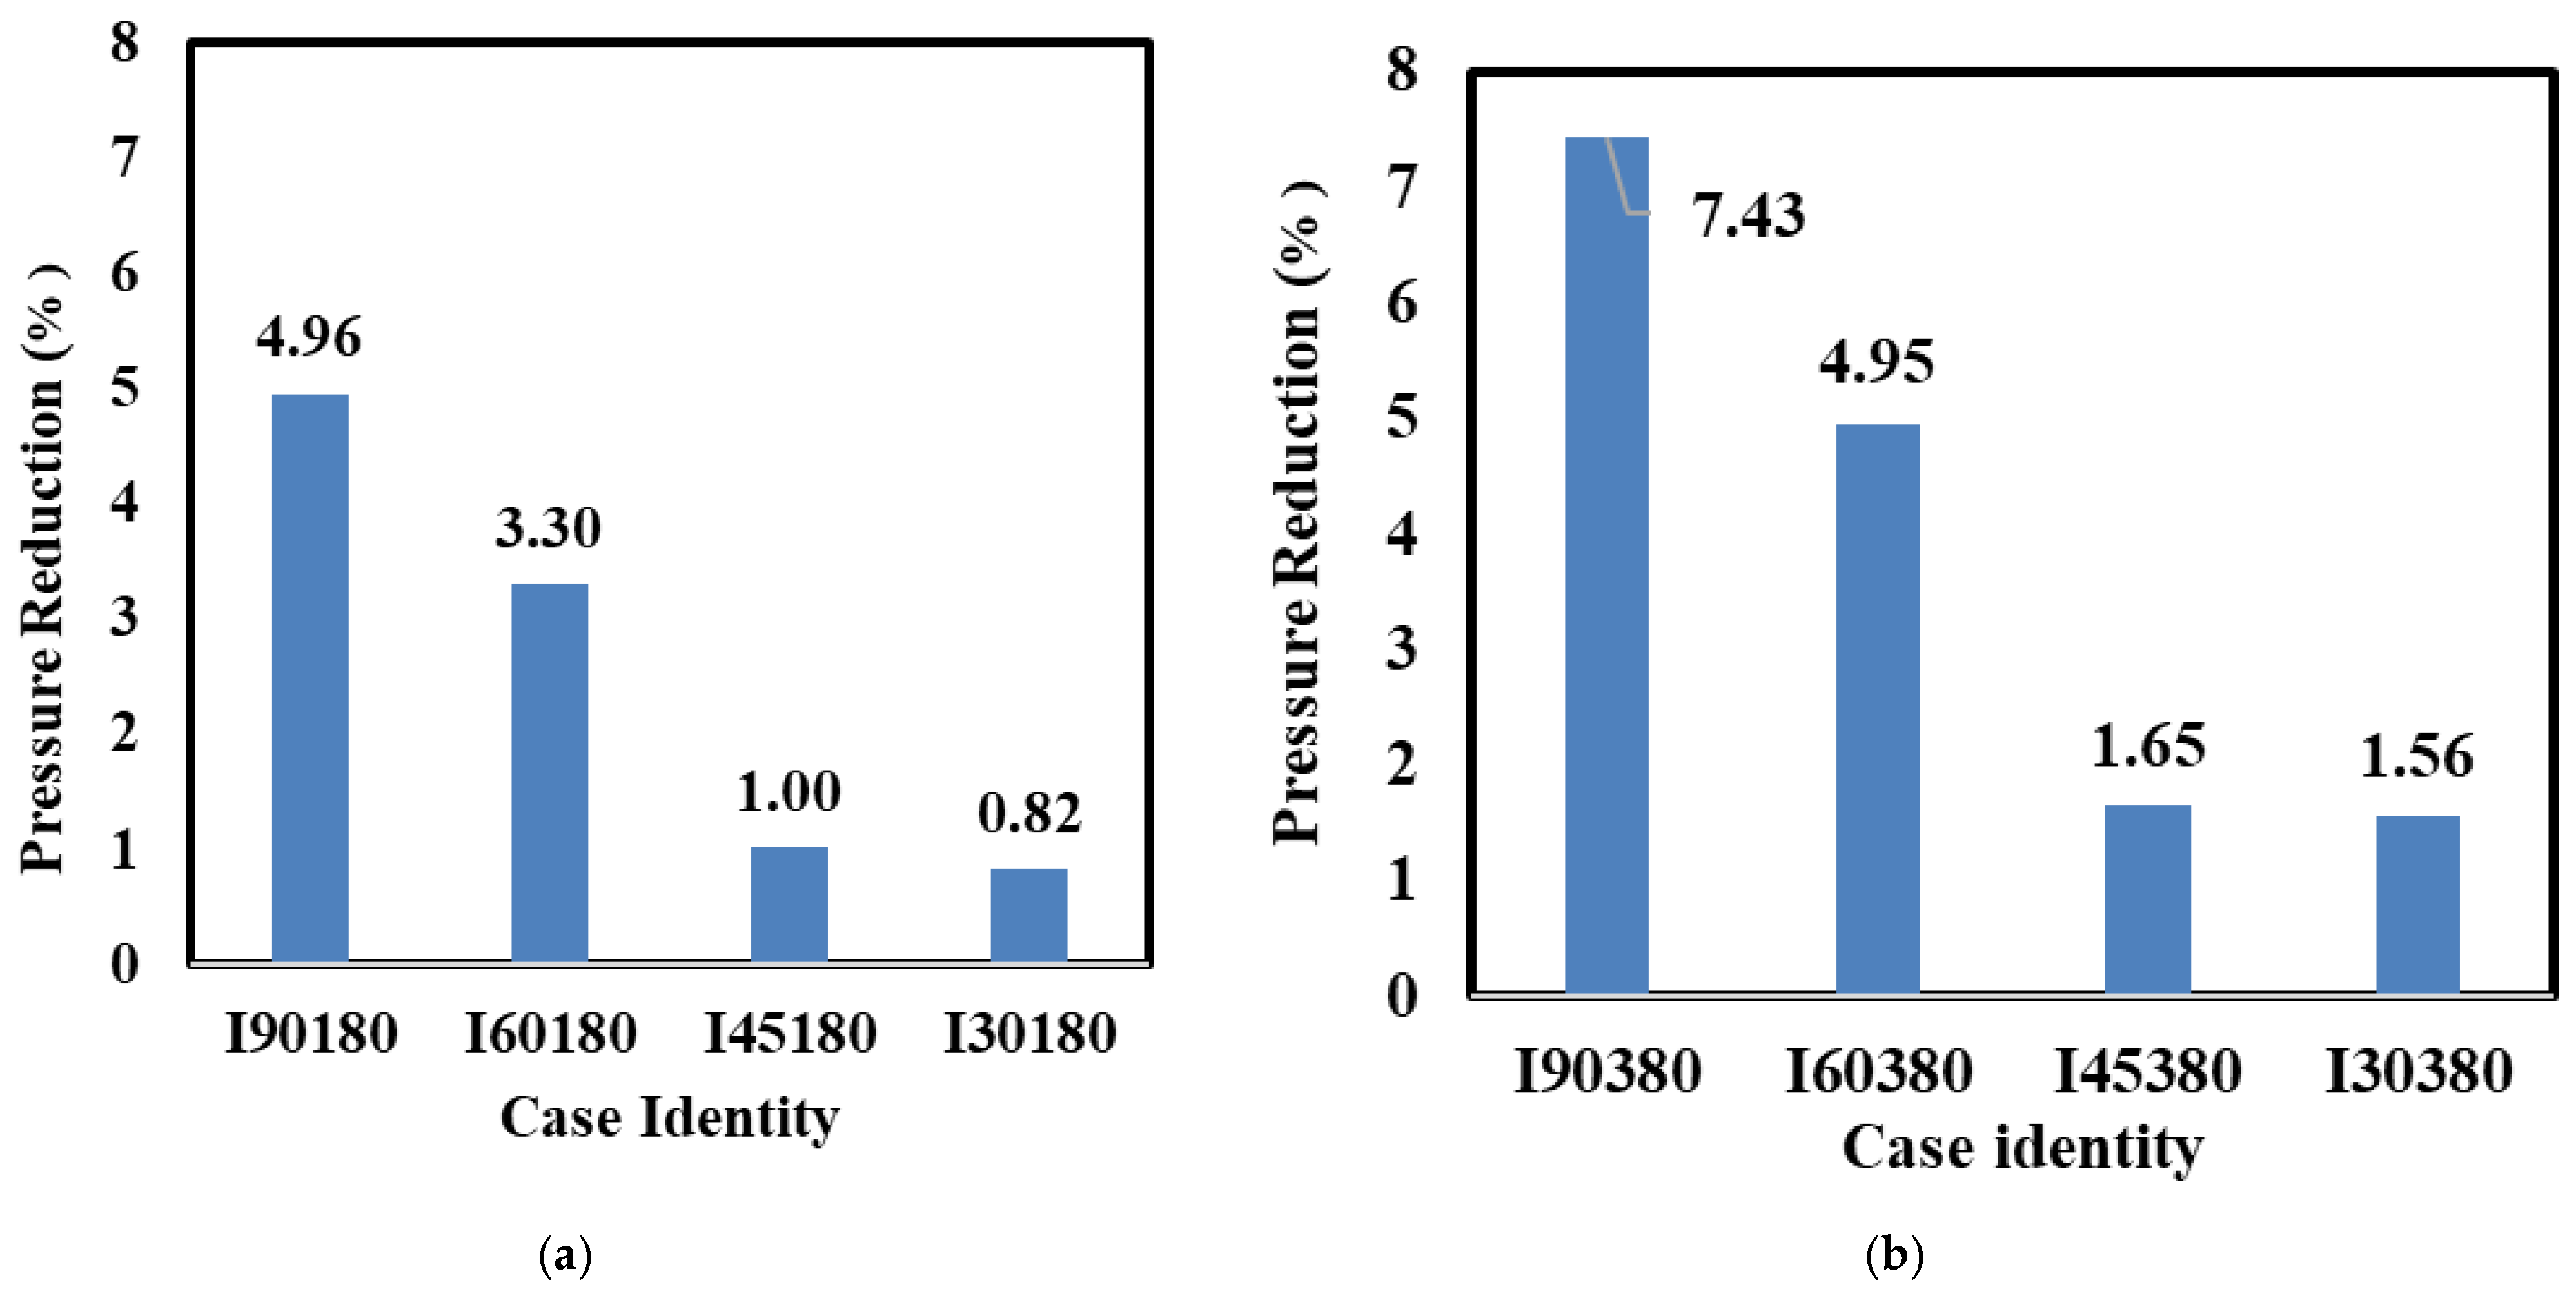
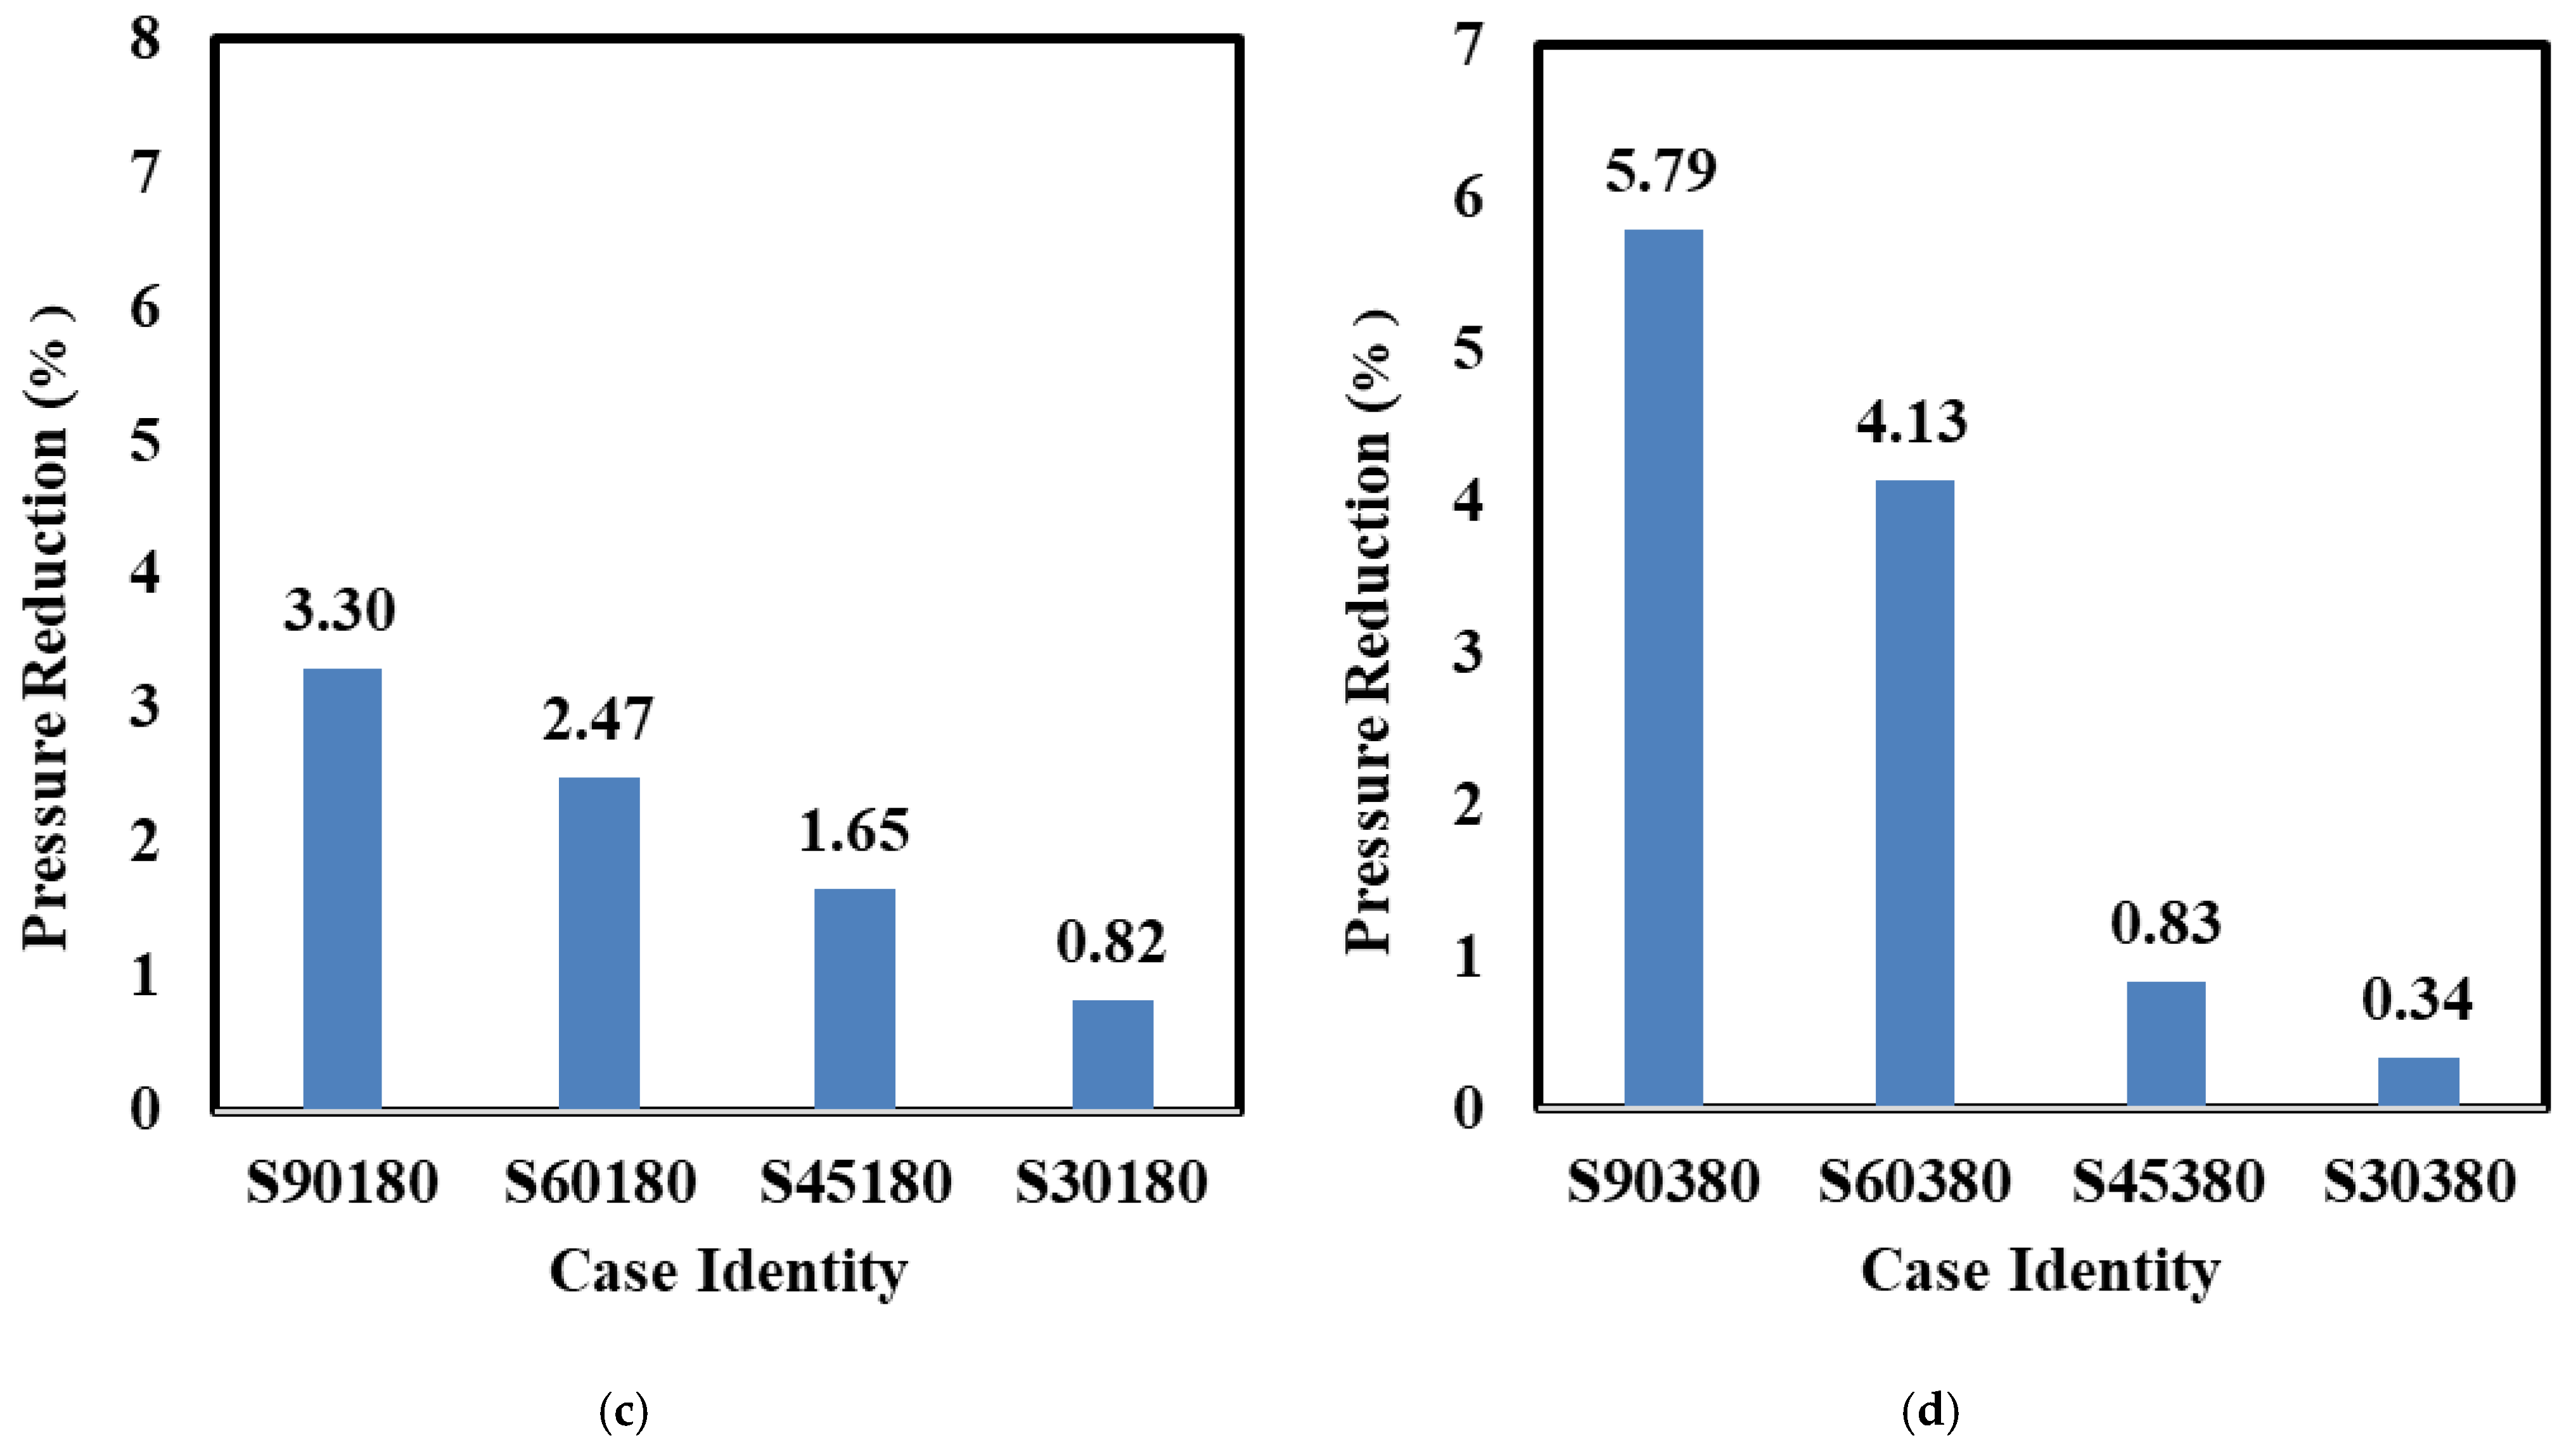
Figure 7 quantifies the percentage reduction in hydrostatic pressure for both intermediate (a,b) and sparse (c,d) vegetation configurations. The results demonstrate that vegetation density and orientation significantly influence performance. The maximum pressure reduction of 7.43% was achieved using the intermediate-density vegetation at a perpendicular orientation (I90380), while the minimum reduction of 0.82% occurred with intermediate vegetation at a 30° orientation (I30180). Similarly, sparse vegetation exhibited a maximum reduction of 5.79% at 90° (S90380) and a minimum reduction of 0.34% at 30° (S30380). These findings underscore the critical importance of both vegetation density and alignment, with perpendicular arrangements consistently yielding superior flow resistance and energy dissipation across all density conditions.

3.2. Acceleration of the Physical Model

3.2.1. Effect of Vegetation Density and Thickness

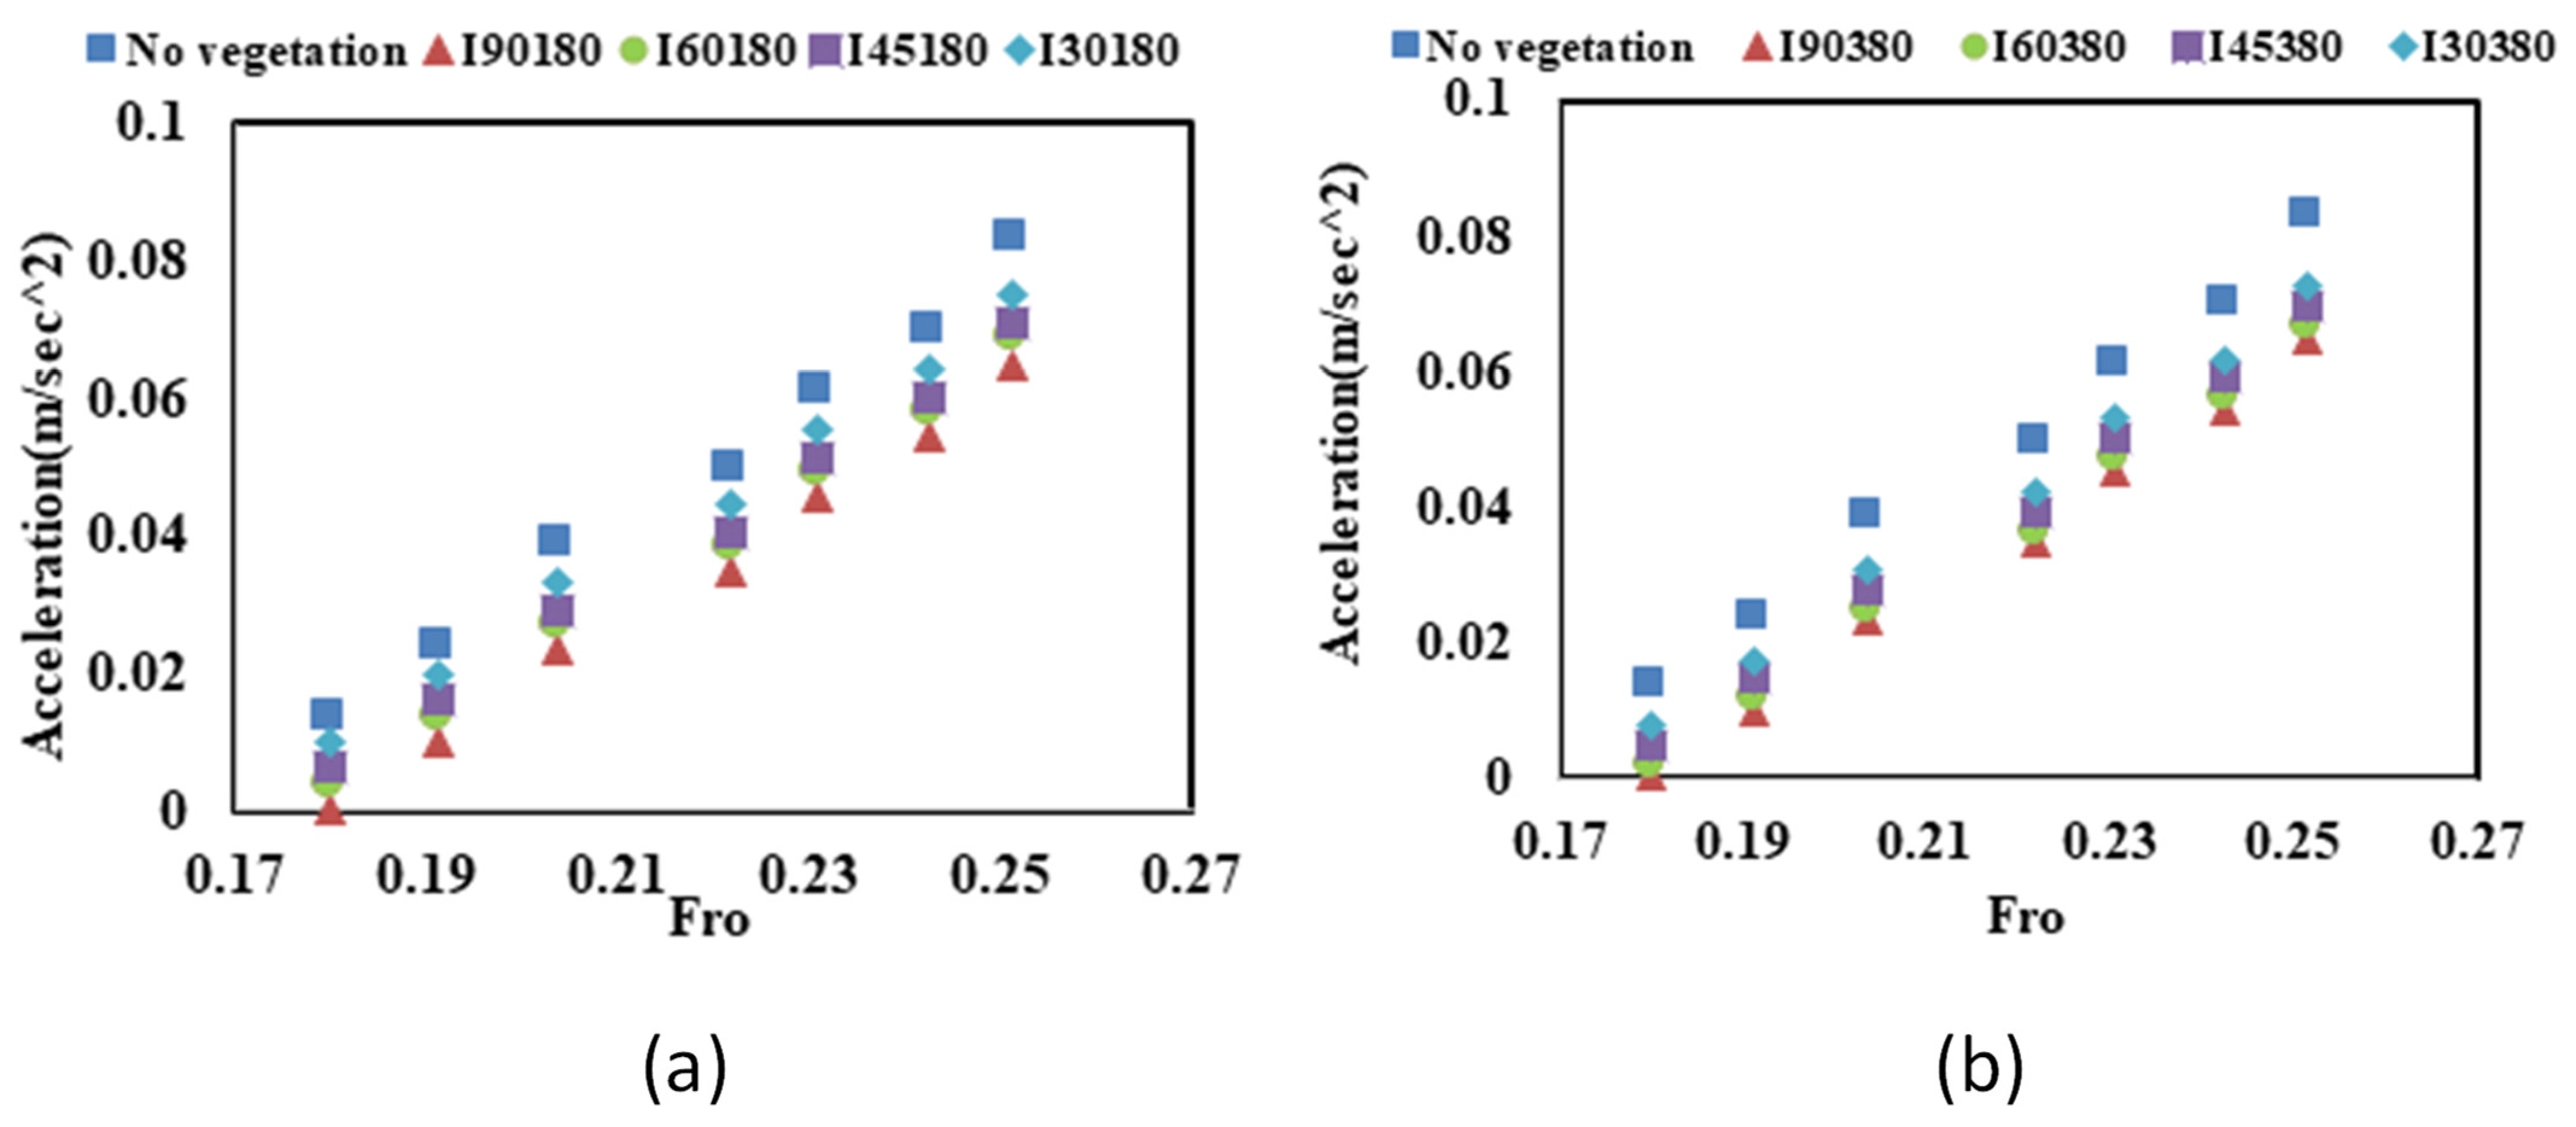
Figure 8a,b presents a comparative analysis of model acceleration reduction across vegetation densities (dn = 180 and dn = 380) and orientations (90°, 60°, 45°, 30°). The bar graphs demonstrate that vegetation significantly reduces structural acceleration compared to non-vegetated conditions, with perpendicular (90°) orientations yielding the highest dissipation across both densities. This superior performance is attributed to the greater flow resistance and energy dissipation capacity of denser vegetation patches. The results underscore the combined importance of vegetation density and orientation, confirming that optimal flood protection requires both high-density planting and perpendicular alignment to flow direction. These findings provide critical insights for designing nature-based flood mitigation systems that effectively safeguard infrastructure. Similar trends were observed for sparse vegetation cases that is why only intermediate vegetation cases are presented in Figure 8a,b.
These findings demonstrate that closely spaced vegetation can serve as a more effective strategy against approaching inland floods. Therefore, the intermediate vegetation arrangement with a vegetation patch thickness of dn = 380 and perpendicular vegetation is preferable to the sparse arrangement with a patch thickness of dn = 180. On average, the model building acceleration dissipation for the four angles (90°, 60°, 45°, and 30°) in the intermediate arrangement was 22.1%. Similarly, in the sparse vegetation configuration, the average percentage reduction in the physical model structure acceleration due to the presence of the vegetation array was 21.8%. Although there is a small percentage difference between intermediate and sparse vegetation, it suggests that even sparse vegetation arrays offer substantial protective utility, which is significant for cost-effective risk reduction strategies where resources or space are constrained. The maximum loss of physical model structure acceleration was observed for the intermediate arrangement with I90380, as perpendicular vegetation provides greater hydraulic resistance than I60380, I45380, and I30380. The dn = 380 vegetation patch model with an intermediate arrangement proves to be more resilient against these conditions.

3.2.2. Significance of Vegetation Orientations in Physical Model Structure Acceleration

Figure 9a–d illustrates the relationship between acceleration and Fro for four different vegetation orientations (90°, 60°, 45°, and 30°) to emphasise the importance of angle selection. The results demonstrate the significant role of vegetation in reducing the structural impacts on the physical model structure. In the case of dn = 180, positioning the vegetation patch at a different orientation results in an approximate 11.0% increase in the attenuation of the model building’s acceleration. In contrast, for dn = 380, the loss of physical model structure acceleration is approximately 18.0%. The highest percentage of acceleration loss was observed for intermediate vegetation with a 90° orientation. The acceleration results exhibit a similar trend to vegetation density, highlighting that the maximum acceleration dissipation is associated with an angle of 90° (I90, I60, I45, I30) and an intermediate vegetation patch arrangement with dn = 380.

3.3. Time of Approach

The presence of the vegetation array introduces an increase to the flow approach time due to the resistance the flow experiences. Initially, the approach time before positioning the model in the channel was recorded, followed by the time after placement. The time difference between these two recordings represents the increase in approach time, termed herein as “time delay”.
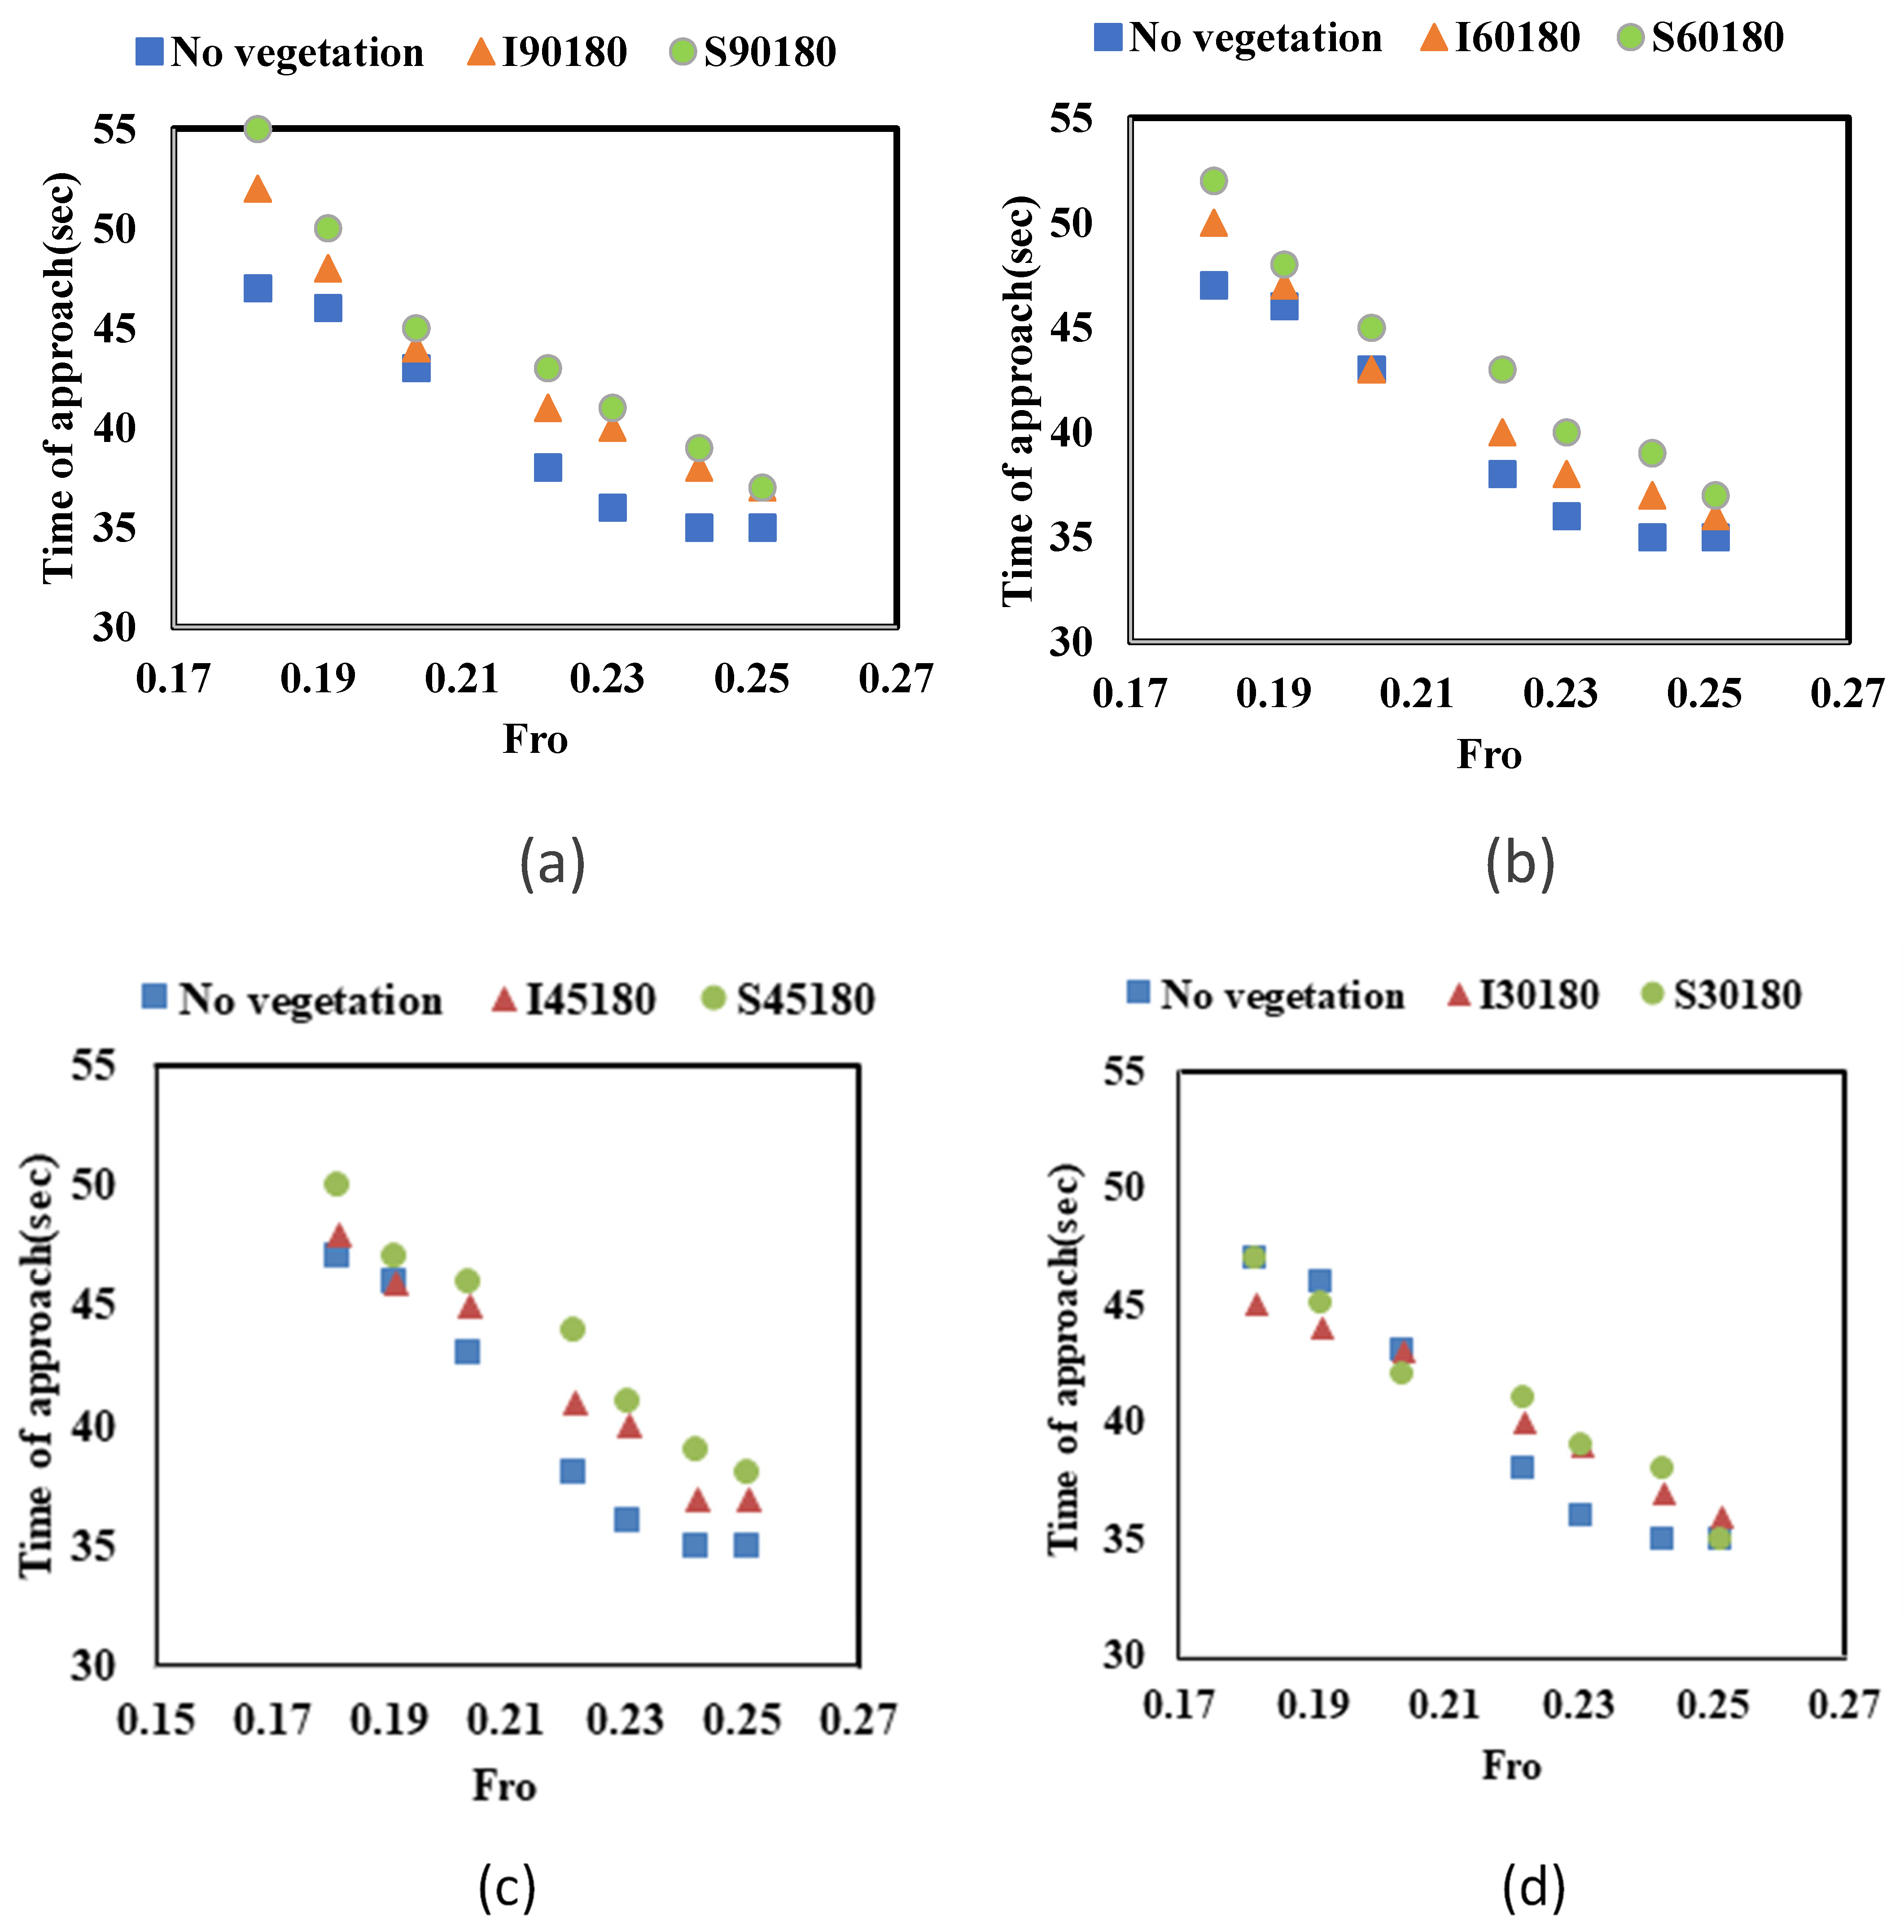
The approach time values range from 35 to 47 s in the absence of the vegetation array. However, after situating the model under different Froude numbers, the approach time varied. For the case of the dn = 180 vegetation arrangement as shown in Figure 10a–d, the approach time ranged from 37 to 52 s for I90180, 36 to 50 s for I60180, 37 to 48 s for I45180, and 36 to 45 s for I30180.
The time of approach for vegetation thickness dn = 380 in sparse arrangement against various Froude number were 37–55 s for S90380, 37–52 s for S60380, 38–52 s for S45380, 35–47 s for S30380. Similarly, the time of approach for intermediate vegetation having thickness dn = 380 against four different vegetation angles S90380, S60380, S45380, S30380 and was 47–60 s, 48–57 s, 41–52 s and 42–49 s as shown in Figure 10a–d. The maximum time delay was 1 min for I90380, i.e., time of approach increases 21.66%.
It was noted that by increasing the angle of the vegetation the time of approach also increases. The proper management of inland forest may play an important role in delay time results shows that by increasing the vegetation thickness and density the time lapse delay also increases because the more hindrance offers by the vegetation to pass the water through them. Hence maximum delay in time was noted in case of intermediate vegetation arrangement having vegetation thickness dn = 380.

3.4. Statistical Analysis

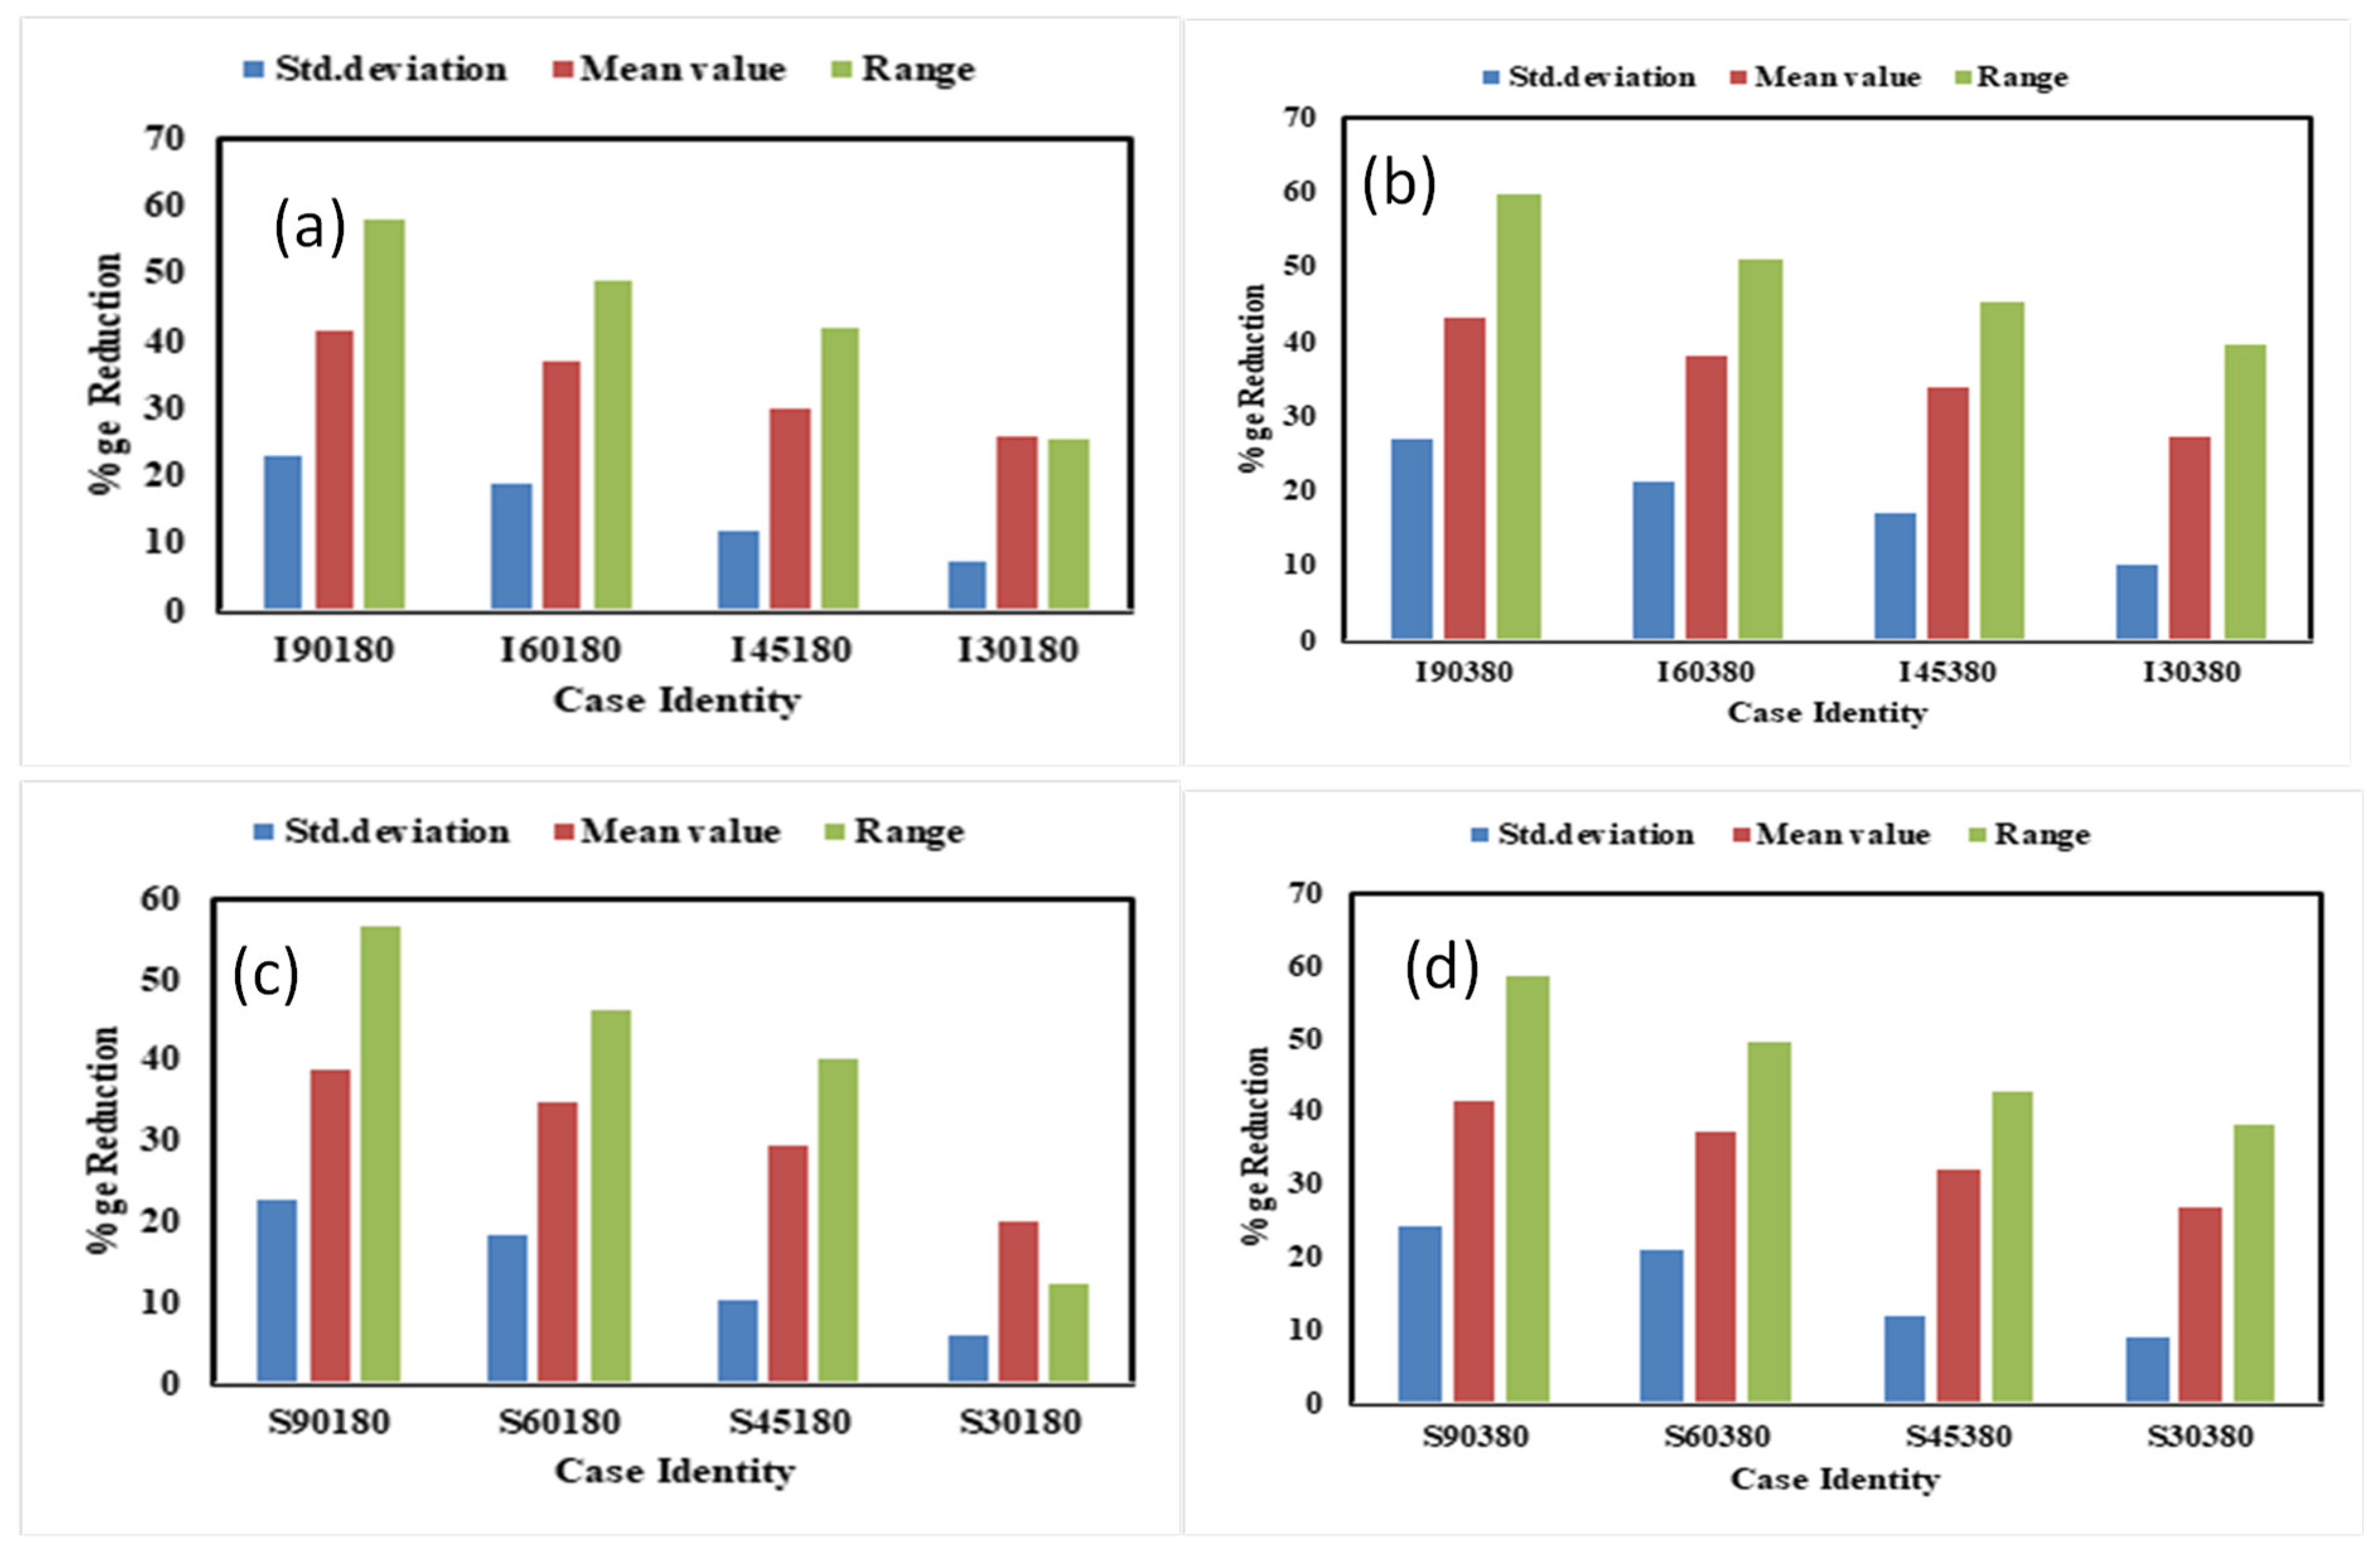
Vegetation proves to be a highly effective method for mitigating flood damage and reducing hydraulic pressure. In a rectangular channel, we conducted investigations into the impact of vegetation at various angles relative to the flow direction [2,4]. The resistance offered by vegetation arrangements to the passage of flow influences flow hydraulics, including the water surface profile within the forest, which directly affects the structural accelerations beyond the forest [1]. Figure 11a–d presents the percentage reduction in key statistical parameters, i.e.; standard deviation, mean, and range for both intermediate and sparse vegetation configurations across four alignment angles (90°, 60°, 45°, and 30°). The results demonstrate that vegetation significantly improves pressure dissipation consistency, with the perpendicular (90°) orientation yielding the highest reduction in statistical variability for both densities. Intermediate vegetation (e.g., I90) consistently outperforms sparse arrangements (e.g., S90), achieving greater reductions in all statistical measures due to its enhanced flow resistance and pressure dissipation capacity. This underscores the role of denser vegetation not only in mitigating peak hydrodynamic loads but also in stabilizing flow conditions, reducing uncertainty in flood impact predictions.

4. Discussion

This experimental investigation revealed critical relationships between vegetation configuration and flood mitigation effectiveness. Vegetation models demonstrated significant capacity to reduce hydrostatic pressure forces on structures, with effectiveness varying by density. Sparse vegetation (G/d = 2.13) achieved good pressure reduction, while intermediate vegetation (G/d = 1.09) provided a smaller reduction under identical flow conditions. Perpendicular vegetation arrangements performed better than oblique configurations in reducing hydrostatic pressure and structural acceleration. X2-2 accelerometer measurements showed vegetation reduced building acceleration across Froude numbers (0.18–0.25), with intermediate density vegetation performing optimally. Vegetation altered subcritical flow patterns, creating energy dissipation zones that effectively reduced downstream fluid forces while maintaining stable flow.
This research tests the effect of vegetation angle relative to flow across several Froude numbers under subcritical conditions. Density is defined by G/d as in previous studies, with undular jump formation characteristics analyzed for sparse (G/d = 2.13), intermediate (G/d = 1.09), and dense (G/d = 0.25) vegetation. Only sparse and intermediate types were implemented here due to construction challenges and the rarity of dense vegetation. Denser vegetation dissipates more energy, as earlier studies show. Here, hydraulic pressure and building acceleration under subcritical flow are analyzed based on G/d and Froude number.
Prior laboratory studies examined riverbank vegetation density effects on flow velocity in the main channel and within vegetation, hydrodynamics [32,33,34,35,36,37,38,39,40], and scour around vegetation [41]. For S90, building acceleration vs. Froude numbers (0.18–0.25) indicates acceleration dissipation increases as vegetation orientation shifts from 30° to 90°, with maximum reduction at 90°, especially for intermediate density dn = 380. Maximum acceleration loss was observed for the intermediate 90° arrangement, as perpendicular vegetation creates more resistance than orientations at 60°, 45°, and 30°, consistent with literature.
Undular jump formation and energy dissipation under subcritical conditions were studied using three vegetation patch thicknesses (dn = 180, 380, 580) in the past [14]. Energy reduction ranges for sparse and intermediate vegetation were 26–28% and 29–32%, respectively. In this study, S90 and I90 use constant patch thicknesses (dn = 180 and dn = 380), with average acceleration reductions ranging between ~20.8% and 22.1% across tested Froude numbers. Previous research on perpendicular and oblique weirs, as well as combined vegetation and weir effects on energy loss [42,43,44,45,46,47,48], align with these hydraulic pressure results.
Vegetation arrays increase time delays, with flow approach differing by 35 to 47 s irrespective of patch orientation. Compared to Froude number 0.18, approach time increased by 21.7% across tested flows.
This study’s findings, relying on pressure and acceleration measurements on a model structure, provide a macroscopic understanding of vegetation patches’ effects on flow impacting downstream infrastructure [49,50,51,52,53,54]. While extensive research focuses on turbulent flow fields downstream of vegetation, this work directly assesses the impact on structures. Advanced sensing technologies like instrumented particles with inertial measurement units (IMUs) offer potential to quantify hydrodynamic forces on surfaces, linking turbulent events and sediment entrainment [28,55]. Applying this to vegetation wakes could reveal mechanisms behind the acceleration and pressure reductions observed, aiding in optimizing nature-based design solutions.
This experimental study as already acknowledged above, has limitations due to scale effects (inherent in all laboratory experiments) that may influence flow and vegetation interactions, possibly differing from field conditions. Moreover, the assumption of rigid vegetation in the models neglects the flow-structure dynamic aspects due to plant flexibility, which could further alter energy dissipation and flow patterns. Future studies should incorporate turbulence-resolving measurement techniques such as particle image velocimetry (PIV) or advanced acoustic methods, with flexible or real plants to capture detailed flow-vegetation interactions.

5. Conclusions and Recommendations

5.1. Conclusions

This study clarifies the importance of vegetation orientation variation in different vegetation conditions in dissipating hydraulic pressure and structural acceleration. The primary findings of this study are as follows.
  • Experimental results indicate that the reduction in hydraulic pressure increases with increasing vegetation thickness and decreasing vegetation orientation relative to the main flow, reaching a maximum at an intermediate vegetation density, with dn = 380. Thus, intermediate vegetation density (G/d = 1.09) emerges as the optimal configuration, achieving superior hydrostatic pressure and acceleration reduction compared to sparse arrangements while remaining practically implementable.
  • Perpendicular vegetation alignment provides measurably superior flood force mitigation compared to oblique arrangements, supporting design recommendations for nature-based flood defences.
  • The results show that vegetation plays a significant role in influencing fluid pressure forces and the dissipation of acceleration in model building. The X2-2 accelerometer methodology successfully quantified structural response under flood conditions, providing a replicable framework for evaluating vegetation-based mitigation strategies. The physical model’s structural acceleration reduction increases with the vegetation patch orientation changing from 30° to 90°. The hydraulic pressure and maximum model building acceleration reduction for the case of sparse vegetation patch arrangement with a vegetation patch thickness of dn = 180 and 90° orientation were 3.3% and 20.8%, respectively.
  • The hydraulic pressure and maximum model building acceleration dissipation in the intermediate arrangement, with a vegetation patch thickness of dn = 380 and orientation at 90° relative to the flow direction, were 7.4% and 22.1%, respectively.
  • The time of approach within the vegetation depends upon the resistance offered by the vegetation. The findings demonstrated that, in all cases considered, the time of approach decreased linearly as the Fr value increased. The value of approaching time for I90 is higher than for S90. The maximum value of approaching time is seen to increase by 21.7% and 14.5%, respectively.
  • The results show maximum depth of water against the highest Froude number, i.e., 0.25. Therefore, the statistical parameters are at their maximum without vegetation at Fro = 0.25. The standard deviation, mean, and range values dissipated to a maximum in intermediate cases. The values of statistical analysis I90 are higher than S90. The maximum values of standard deviation, mean, and range dissipation were 26.1%, 43.5%, and 59.8%, respectively. These findings support the integration of strategically configured vegetation into flood risk management systems, offering sustainable alternatives to traditional hard infrastructure while providing quantifiable protection benefits.

5.2. Recommendations

Based on the findings of this research, it is recommended that flood management strategies should incorporate vegetation as a key component. The results highlight the significance of vegetation angle and density in reducing hydraulic pressure and house acceleration during flooding events. To optimise flood protection, practitioners should consider implementing vegetation arrangements with a 90° angle to the flow direction and prioritise intermediate vegetation density levels. Furthermore, ongoing monitoring and research efforts should be encouraged to refine and adapt these strategies to changing environmental conditions. Collaborative initiatives involving hydrologists, ecologists, engineers, and policymakers are crucial for developing comprehensive and effective flood management policies. Community engagement is crucial for raising awareness and garnering local support for vegetation-based flood protection measures. Overall, integrating vegetation into flood management practices represents a sustainable and cost-effective approach to mitigate flood risks and enhance resilience in flood-prone regions.

Author Contributions

Conceptualization, A.A. and I.Q. (Imran Qadir); methodology, A.A.; software, S.S.M.; validation, M.V. and G.A.P.; formal analysis, A.R.G.; investigation, F.M.A.; resources, G.A.P.; data curation, A.A.; writing—original draft preparation, I.Q. (Imran Qadir), A.A. and M.V.; writing—review and editing, A.A.; visualization, I.Q. (Irfan Qadir); supervision, A.A.; project administration, A.A. All authors have read and agreed to the published version of the manuscript.

Funding

This research received no external funding.

Data Availability Statement

The data are contained within the article.

Conflicts of Interest

The author Imran Qadir was employed by the company Multan Electric Power Company, Water and Power Development Authority, Pakistan. The remaining authors declare that the research was conducted in the absence of any commercial or financial relationships that could be construed as a potential conflict of interest.

References

  1. Lacerna, K.C.; Dalugdog, W.D. Disaster Preparedness among Selected Beach Resorts in San Juan Batangas. Int. J. Multidiscip. Appl. Bus. Educ. Res. 2025, 6, 3208–3230. [Google Scholar] [CrossRef]
  2. Smith, K. Environmental Hazards: Assessing Risk and Reducing Disaster; Routledge: New York, NY, USA, 2003. [Google Scholar]
  3. United Nations Office for Disaster Risk Reduction. Global Assessment Report on Disaster Risk Reduction 2025: Resilience Pays: Financing and Investing for Our Future; Stylus Publishing, LLC: New York, NY, USA, 2025. [Google Scholar]
  4. Zaha, T.; Tanaka, N.; Kimiwada, Y. Flume Experiments on Optimal Arrangement of Hybrid Defence System Comprising an Embankment, Moat, and Emergent Vegetation to Mitigate Inundating Tsunami Current. Ocean Eng. 2019, 173, 45–57. [Google Scholar] [CrossRef]
  5. Feizbahr, M.; Tonekaboni, N.; Jiang, G.J.; Chen, H.X. Optimized Vegetation Density to Dissipate Energy of Flood Flow in Open Canals. Math. Probl. Eng. 2021, 2021, 9048808. [Google Scholar] [CrossRef]
  6. Rezzoug, A.; Khan, A.; Murtaza, N.; Rizvi, S.A.S. Predicting Flood Energy Reduction in Vegetated Open Channel: Comparative Assessment of Hybrid Artificial Intelligence Techniques. Eng. Appl. Artif. Intell. 2025, 159, 111756. [Google Scholar] [CrossRef]
  7. Ahmed, A.; Ghumman, A.R. Experimental Investigation of Flood Energy Dissipation by Single and Hybrid Defence Systems. Water 2019, 11, 1971. [Google Scholar] [CrossRef]
  8. Ahmed, A.; Valyrakis, M.; Ghumman, A.R.; Pasha, G.A.; Farooq, R. Experimental Investigation of Flood Energy Reduction through Vegetation at Various Angles. River Res. Appl. 2021, 37, 644–655. [Google Scholar] [CrossRef]
  9. Rehman, S.U.; Ahmed, A.; Gilja, G.; Valyrakis, M.; Ghumman, A.R.; Pasha, G.A.; Farooq, R. A Laboratory Study of the Role of Nature-Based Solutions in Improving Flash Flooding Resilience in Hilly Terrains. Water 2023, 16, 124. [Google Scholar] [CrossRef]
  10. Merz, B.; Hall, J.; Disse, M.; Schumann, A. Fluvial Flood Risk Management in a Changing World. Nat. Hazards Earth Syst. Sci. 2010, 10, 509–527. [Google Scholar] [CrossRef]
  11. Nepf, H.M. Hydrodynamics of Vegetated Channels. J. Hydraul. Res. 2012, 50, 262–279. [Google Scholar] [CrossRef]
  12. Vundavilli, V.S.S.R.H. The Interaction of Buoyant River Plumes with Vegetation and Consequences for Sediment Transport and Deposition in Coastal Regions. Ph.D. Thesis, The University of Waikato, Hamilton, New Zealand, 2023. [Google Scholar]
  13. van Zelst, V.T.M.; Dijkstra, J.T.; van Wesenbeeck, B.K.; Eilander, D.; Morris, E.P.; Winsemius, H.C.; Ward, P.J. Cutting the Costs of Coastal Protection by Integrating Vegetation in Flood Defences. Nat. Commun. 2021, 12, 6533. [Google Scholar] [CrossRef]
  14. Pasha, G.A.; Tanaka, N. Undular Hydraulic Jump Formation and Energy Loss in a Flow through Emergent Vegetation of Varying Thickness and Density. Ocean Eng. 2017, 141, 308–325. [Google Scholar] [CrossRef]
  15. Liu, X.; Xiao, C.; Wang, Z.; Zhu, N.; Du, N.; Xu, J.; Li, Y. Experimental Investigation on Effect of Vegetation Distribution Pattern on Hydraulic Characteristics of Overland Flow. Hydrol. Process. 2025, 39, e70234. [Google Scholar] [CrossRef]
  16. Tanaka, N. Effectiveness and Limitations of Coastal Forest in Large Tsunami. Annu. J. Hydraul. Eng. JSCE 2012, 56, 127–132. [Google Scholar]
  17. Tiggeloven, T.; de Moel, H.; Winsemius, H.C.; Eilander, D.; Erkens, G.; Gebremedhin, E.; Ward, P.J. The Benefits of Coastal Adaptation through Conservation of Foreshore Vegetation. J. Flood Risk Manag. 2022, 15, e12790. [Google Scholar] [CrossRef]
  18. Kumar Yadav, P.; Thapa, S.; Han, X.; Richmond, C.; Zhang, N. Investigation of the Effects of Wetland Vegetation on Coastal Flood Reduction Using Hydrodynamic Simulation. In Proceedings of the ASME 2015 Fluids Engineering Division Summer Meeting, Seoul, Republic of Korea, 26–31 July 2015. [Google Scholar] [CrossRef]
  19. Dissanayaka, K.D.C.R.; Tanaka, N.; Vinodh, T.L.C. Integration of Eco-DRR and Hybrid Defense System on Mitigation of Natural Disasters (Tsunami and Coastal Flooding): A Review. Nat. Hazards 2022, 110, 1–30. [Google Scholar] [CrossRef]
  20. Ali, A.; Pasha, G.A.; Ghani, U.; Ahmed, A.; Abbas, F.M. Investigating Role of Vegetation in Protection of Houses during Floods. Civ. Eng. J. 2019, 5, 2598–2613. [Google Scholar] [CrossRef]
  21. Varanis, M.; Silva, A.; Mereles, A.; Pederiva, R. MEMS Accelerometers for Mechanical Vibrations Analysis: A Comprehensive Review with Applications. J. Braz. Soc. Mech. Sci. Eng. 2018, 40, 527. [Google Scholar] [CrossRef]
  22. Martínez-Castro, R.E.; Jang, S.; Christenson, R.E. Rapid Cable Tension Estimation Using Dynamic and Mechanical Properties. In Proceedings of the Sensors and Smart Structures Technologies for Civil, Mechanical, and Aerospace Systems 2016, Las Vegas, NV, USA, 21–24 March 2016; SPIE: Washington, DC, USA, 2016; Volume 9803. [Google Scholar] [CrossRef]
  23. Tanaka, N. Vegetation Bioshields for Tsunami Mitigation: Review of Effectiveness, Limitations, Construction, and Sustainable Management. Landsc. Ecol. Eng. 2009, 5, 71–79. [Google Scholar] [CrossRef]
  24. Jennings, P.C. Distant Motions from a Building Vibration Test. Bull. Seismol. Soc. Am. 1970, 60, 2037–2043. [Google Scholar] [CrossRef]
  25. Alhusban, Z.; Valyrakis, M. Assessing Sediment Transport Dynamics from Energy Perspective by Using the Instrumented Particle. Int. J. Sediment Res. 2022, 37, 833–846. [Google Scholar] [CrossRef]
  26. Al-Obaidi, K.; Xu, Y.; Valyrakis, M. The Design and Calibration of Instrumented Particles for Assessing Water Infrastructure Hazards. J. Sens. Actuator Netw. 2020, 9, 36. [Google Scholar] [CrossRef]
  27. Al-Obaidi, K.; Valyrakis, M. A Sensory Instrumented Particle for Environmental Monitoring Applications: Development and Calibration. IEEE Sens. J. 2021, 21, 10153–10166. [Google Scholar] [CrossRef]
  28. Al-Obaidi, K.; Valyrakis, M. Linking the Explicit Probability of Entrainment of Instrumented Particles to Flow Hydrodynamics. Earth Surf. Process. Landf. 2021, 46, 2448–2465. [Google Scholar] [CrossRef]
  29. Hott, J.W. The Design and Implementation of an Underfloor Accelerometer-Based Local Structural Dynamics Monitoring System for the Ashraf Islam Engineering Building. Master’s Thesis, Tennessee Technological University, Cookeville, TN, USA, 2024. [Google Scholar]
  30. Chitsaz, N.; Banihabib, M.E. Comparison of Different Multi-Criteria Decision-Making Models in Prioritizing Flood Management Alternatives. Water Resour. Manag. 2015, 29, 2503–2525. [Google Scholar] [CrossRef]
  31. Mita, A.; Yokoi, I. Fiber Bragg Grating Accelerometer for Buildings and Civil Infrastructures. Proc. SPIE 2001, 4330, 479–486. [Google Scholar] [CrossRef]
  32. Sanjou, M.; Okamoto, T.; Nezu, I. Experimental Study on Fluid Energy Reduction through a Flood Protection Forest. J. Flood Risk Manag. 2018, 11, e12339. [Google Scholar] [CrossRef]
  33. Valyrakis, M.; Liu, D.; Turker, U.; Yagci, O. The Role of Increasing Riverbank Vegetation Density on Flow Dynamics across an Asymmetrical Channel. Environ. Fluid Mech. 2021, 21, 643–666. [Google Scholar] [CrossRef]
  34. Williams, C.J.; Pierson, F.B.; Kormos, P.R.; Al-Hamdan, O.Z.; Hardegree, S.P. Vegetation, Ground Cover, Soil, Rainfall Simulation, and Overland-Flow Experiments before and after Tree Removal in Woodland-Encroached Sagebrush Steppe. Earth Syst. Sci. Data 2020, 12, 1347–1365. [Google Scholar] [CrossRef]
  35. Siniscalchi, F.; Nikora, V.I.; Aberle, J. Plant Patch Hydrodynamics in Flows: Results from a Laboratory Study. Water Resour. Res. 2012, 48, W10533. [Google Scholar] [CrossRef]
  36. Liu, C.; Tang, H.; Zhou, J. Effects of Patch Properties of Submerged Vegetation on Sediment Scouring and Deposition. Water 2022, 14, 4025. [Google Scholar]
  37. Vargas-Luna, A.; Crosato, A.; Uijttewaal, W.S.J. Effects of Vegetation on Flow and Sediment Transport: Comparative Analyses and Validation of Predicting Models. Earth Surf. Process. Landf. 2015, 40, 157–176. [Google Scholar] [CrossRef]
  38. Zong, L.; Nepf, H. Flow and Deposition in and Around a Finite Patch of Vegetation. Geomorphology 2010, 110, 363–372. [Google Scholar] [CrossRef]
  39. Liu, D.; Diplas, P.; Fairbanks, J.D.; Hodges, C.C. An Experimental Study of Flow through Rigid Vegetation. J. Geophys. Res. Earth Surf. 2008, 113, F04015. [Google Scholar] [CrossRef]
  40. Tang, C.; Yi, Y.; Zhang, S. Flow and Turbulence in Unevenly Obstructed Channels with Rigid and Flexible Vegetation. J. Environ. Manage. 2022, 323, 116736. [Google Scholar] [CrossRef]
  41. Yagci, O.; Tafarojnoruz, A.; Celik, M.F.; Kitsikoudis, V.; Duran, Z.; Kirca, V.S.O. Scour Patterns around Isolated Vegetation Elements. Adv. Water Resour. 2016, 97, 251–265. [Google Scholar] [CrossRef]
  42. Van Dijk, W.M.; Teske, R.; Van de Lageweg, W.I.; Kleinhans, M.G. Effects of Vegetation Distribution on Experimental River Channel Dynamics. Water Resour. Res. 2013, 49, 7558–7574. [Google Scholar] [CrossRef]
  43. Ram, N.H.; Sriram, V. Energy Dissipation Characteristics of Vegetation Belt for the Tsunami-like Bore. Phys. Fluids 2025, 37, 037172. [Google Scholar] [CrossRef]
  44. Borghei, S.M.; Jalili, M.R.; Ghodsian, M. Discharge Coefficient for Sharp-Crested Side Weir in Subcritical Flow. J. Hydraul. Eng. 1999, 125, 1051–1056. [Google Scholar] [CrossRef]
  45. Ali, S.; Uijttewaal, W.S.J. Flow Resistance of Vegetated Oblique Weirlike Obstacles during High Water Stages. Hydrol. Earth Syst. Sci. 2014, 18, 1–14. [Google Scholar] [CrossRef]
  46. Keshavarzi, A.; Ball, J.E. Discharge Coefficient of Sharp-Crested Side Weir in Trapezoidal Channel with Different Side-Wall Slopes under Subcritical Flow Conditions. Irrig. Drain. 2014, 63, 40–50. [Google Scholar] [CrossRef]
  47. Azimi, A.H.; Rajaratnam, N.; Zhu, D.Z. Submerged Flows over Rectangular Weirs of Finite Crest Length. J. Irrig. Drain. Eng. 2014, 140, 04014008. [Google Scholar] [CrossRef]
  48. Cheng, N.-S.; Nguyen, H.T. Hydraulic Radius for Evaluating Resistance Induced by Simulated Emergent Vegetation in Open-Channel Flows. J. Hydraul. Eng. 2011, 137, 995–1004. [Google Scholar] [CrossRef]
  49. Stoesser, T.; Kim, S.J.; Diplas, P. Turbulent Flow Through Idealized Emergent Vegetation. J. Hydraul. Eng. 2010, 136, 1003–1017. [Google Scholar] [CrossRef]
  50. Tinoco, R.O.; San Juan, J.E.; Mullarney, J.C. Simplification bias: Lessons from laboratory and field experiments on flow through aquatic vegetation. Earth Surf. Process. Landf. 2020, 45, 121–143. [Google Scholar] [CrossRef]
  51. Luhar, M.; Nepf, H.M. From the Blade Scale to the Reach Scale: A Characterization of Aquatic Vegetation Drag. Adv. Water Resour. 2013, 51, 305–316. [Google Scholar] [CrossRef]
  52. Folkard, A.M. Hydrodynamics of Model Posidonia Oceanica Patches in Shallow Water. Limnol. Oceanogr. 2005, 50, 1592–1600. [Google Scholar] [CrossRef]
  53. Marjoribanks, T.I.; Hardy, R.J.; Lane, S.N.; Parsons, D.R. High-Resolution Numerical Modelling of Flow—Vegetation Interactions. J. Hydraul. Res. 2014, 52, 775–793. [Google Scholar] [CrossRef]
  54. Wilson, C.A.M.E.; Stoesser, T.; Bates, P.D.; Pinzen, A.B. Open Channel Flow through Different Forms of Submerged Flexible Vegetation. J. Hydraul. Eng. 2003, 129, 847–853. [Google Scholar] [CrossRef]
  55. Al-Obaidi, K.; Valyrakis, M. Coherent Flow Structures Linked to the Impulse Criterion for Incipient Motion of Coarse Sediment. Appl. Sci. 2023, 13, 10656. [Google Scholar] [CrossRef]
Figure 1. (a) Illustration of the open channel laboratory flume, and (b) schematic diagram of the experimental setup showing the main elements of the experiment and dimensions (all in m).
Water 17 02879 g001aWater 17 02879 g001b
Figure 2. (a) Sketch of the experimental flume showing the vegetation in a staggered arrangement, with Wv the width of the vegetation patch, (b,c) showing the angle of the vegetation patch relative to the main flow direction, in front of the model structure in the flume, (d) demonstration of the installation of the accelerometer on the model structure and (e) photo of the accelerometer.
Water 17 02879 g002
Figure 3. Demonstration of the effect of Froude number on measured pressure force for the cases of no vegetation, intermediate (I) and sparse (S) cases of vegetation density, for dn = 180 and the vegetation patch oriented at an angle with respect to the main flow direction: (a) 90°, (b) 60°, (c) 45° & (d) 30°.
Water 17 02879 g003
Figure 4. Demonstration of the effect of Froude number on measured pressure force for the cases of no vegetation, intermediate (I) and sparse (S) cases of vegetation density, for dn = 380 and the vegetation patch oriented at an angle with respect to the main flow direction: (a) 90°, (b) 60°, (c) 45° & (d) 30°.
Water 17 02879 g004
Figure 5. The effect of vegetation density and patch orientation on pressure force for various Froude numbers for the case of 90° orientation of the patch to the main flow direction.
Water 17 02879 g005
Figure 6. Demonstration of the effect of Froude number on measured pressure force for various cases of dn and vegetation density: (a) intermediate (I) and dn = 180, (b) sparse (S) and dn = 180, (c) intermediate (I) and dn = 380, and (d) sparse (S) and dn = 380.
Water 17 02879 g006aWater 17 02879 g006b
Figure 7. Illustration of the reduction in hydrostatic pressure for various vegetation configurations: (a) intermediate vegetation density and dn = 180, (b) intermediate vegetation density and dn = 380, (c) sparse vegetation density and dn = 180, and (d) sparse vegetation density and dn = 380.
Water 17 02879 g007aWater 17 02879 g007b
Figure 8. Demonstration of the effect of Froude number on the acceleration of the model structure for different orientations relative to the main flow direction for: (a) dn = 180 and, (b) dn = 380.
Water 17 02879 g008
Figure 9. Demonstration of the effect of Froude number on the acceleration of the model structure for different orientations relative to the main flow direction for: (a) intermediate vegetation density and dn = 180, (b) intermediate vegetation density and dn = 380, (c) sparse vegetation density and dn = 180, and (d) sparse vegetation density and dn = 380.
Water 17 02879 g009aWater 17 02879 g009b
Figure 10. Demonstration of the effect of vegetation density (no vegetation, intermediate and sparse) for various Froude numbers on the time of approach, for dn = 180 and different orientations of the vegetation patch relative to the main flow direction, for: (a) 90°, (b) 60°, (c) 45°, and (d) 90°.
Water 17 02879 g010
Figure 11. Percentage reduction in pressure, showing the standard deviation, mean and range of measured values (for the range of flow conditions), for different orientations of the vegetation patch relative to the main flow direction, and cases for vegetation density and dn: (a) intermediate vegetation density and dn = 180, (b) intermediate vegetation density and dn = 380, (c) sparse vegetation density and dn = 180, and (d) sparse vegetation density and dn = 380.
Water 17 02879 g011
Table 1. Characteristics of the flow configurations tested, where Fro is the initial Froude number, d the diameter of cylinder, dn is the thickness of vegetation.
Case #Angle of VegetationInitial Froude No. (Fro)d (cm)Vegetation TypeVegetation Thickness (dn)
1No vegetation0.18, 0.19, 0.20, 0.22, 0.23, 0.24, and 0.250.3 180,380
2900.18, 0.19, 0.20, 0.22, 0.23, 0.24, and 0.250.3Intermediate180,380
3900.18, 0.19, 0.20, 0.22, 0.23, 0.24, and 0.250.3Sparse180,380
4600.18, 0.19, 0.20, 0.22, 0.23, 0.24, and 0.250.3Intermediate180,380
5600.18, 0.19, 0.20, 0.22, 0.23, 0.24, and 0.250.3Sparse180,380
6450.18, 0.19, 0.20, 0.22, 0.23, 0.24, and 0.250.3Intermediate180,380
7450.18, 0.19, 0.20, 0.22, 0.23, 0.24, and 0.250.3Sparse180,380
8300.18, 0.19, 0.20, 0.22, 0.23, 0.24, and 0.250.3Intermediate180,380
9300.18, 0.19, 0.20, 0.22, 0.23, 0.24, and 0.250.3Sparse180,380
Disclaimer/Publisher’s Note: The statements, opinions and data contained in all publications are solely those of the individual author(s) and contributor(s) and not of MDPI and/or the editor(s). MDPI and/or the editor(s) disclaim responsibility for any injury to people or property resulting from any ideas, methods, instructions or products referred to in the content.