Article

Evaluation of Hydraulic Performance of Sewage Pipe Networks

1
Tianjin Municipal Engineering Design & Research Institute Co., Ltd., Tianjin 300392, China
2
School of Environmental Science and Engineering, Tianjin University, Tianjin 300072, China
*
Author to whom correspondence should be addressed.
Water 2025, 17(2), 159; https://doi.org/10.3390/w17020159
Submission received: 16 November 2024 / Revised: 27 December 2024 / Accepted: 3 January 2025 / Published: 9 January 2025
(This article belongs to the Special Issue Urban Sewer Systems: Monitoring, Modeling and Management)

Abstract

:
With the continuous increase in the urbanization rate, the amount of sewage received by the sewage pipe network has also been increasing annually. The phenomenon of high water level operation in sewage pipe networks has emerged in many cities, which seriously affects drainage efficiency. Therefore, constructing an effective evaluation method to assess the hydraulic performance of pipe networks operating at high water levels, as well as identifying high-risk pipelines, formulating cost-effective rehabilitation schemes, and evaluating the rehabilitation effects has become necessary to solve this problem. In this study, a sewage pipe network hydraulic performance evaluation method based on flow velocity, pipe fullness, and manhole fullness was established. This method comprehensively considers the instantaneous values and cumulative operation durations of each indicator in the pipeline and, thus, can accurately evaluate the hydraulic performance of the pipe network. This method was applied to the sewage pipe network in City H, and it was found that there existed problems such as low flow velocity, unreasonable pipe diameter, overloading, and high risk of overflow. After the renovation of specific pipeline sections according to the evaluation results, the comprehensive hydraulic performance of the pipe network was significantly improved, with the grade rising from “poor” to “medium +”. This research shows that this evaluation method can accurately assess the hydraulic performance of the current and the renovated sewage pipe network, providing scientific guidance for the renovation and optimization.

1. Introduction

As Chinese cities have developed rapidly in recent years, urban sewage pipe networks have also been growing rapidly with the increase in sewage volume. The total sewage discharge in China amounted to 64 × 109 m3 in 2022, with the length of the sewage pipe network reaching 913,000 km, reflecting a 33.6% increase from 2018 to 2022 [1]. Given that the main function of urban sewage pipe networks is to transport sewage, their healthy operation plays a crucial role in maintaining social public health, safety, environment, and economy [2,3]. Since the construction of the drainage pipe network is underground, its structural and hydraulic failures cannot be detected in time. Consequently, most drainage pipe networks often operate in a “sub-healthy” state until the ground collapses, and urban waterlogging, service interruptions, etc., occur [4]. The sewage pipe networks in many cities in China cannot meet the needs of urban sewage discharge. Firstly, due to the increased sewage volume along with urban development, the early-constructed sewage pipe networks with limited drainage capacity are overloaded [5]. Secondly, because of poor management and natural aging, problems such as external water intrusion and mixing of rainwater with sewage have arisen [6], reducing the available space for sewage transmission. As a result, high water level operation and overflow often occur in the pipe networks, reducing the drainage efficiency of the pipe networks. There is also a large number of problems with the drainage pipe networks in developed countries. For example, in many old towns in the United States, due to the combined sewer system, there is the issue of pollution resulting from overflow during the rainy season [7] In the UK, when it comes to dealing with rainstorms, traditional drainage pipe networks focus more on rapid drainage and fail to fully consider the impacts on the environment and ecosystem, which leads to rainwater runoff carrying pollutants into receiving water bodies and, thus, affecting water quality [8]. In Germany, during the early expansion of its eastern region, a large number of infrastructure facilities were built, resulting in the underutilization of the pipe networks. With a small water flow and a long transmission distance, problems like sewer blockages and bad odors emerged [9]. To solve these problems, various countries have adopted a series of measures, including the professional operation and maintenance mechanism integrating sewage treatment plants and pipe networks [10], low-impact development technologies [11], sustainable drainage systems [8,12,13,14], enhanced data monitoring and analysis [15,16], integrated management strategies [7,17], the formulation of policies and regulations [18], and a focus on “cold spots” [9].
The rehabilitation of the drainage pipe network is a complex process, and the assessment of the network’s condition is an important part of it. Before-rehabilitation assessments help to understand the health status of the network, identify high-risk pipelines, and develop optimal repair strategies. After-rehabilitation assessments provide the best means of evaluating the effectiveness of the rehabilitation plan [18,19,20,21,22,23]. Early assessments of urban sewage network conditions and drainage efficiency were primarily based on indicators such as service area [24,25], treated water volume [26], pipeline physical conditions (diameter, material, length, etc.) [27,28,29], sewage collection rate [30], and costs and personnel [31,32]. However, these indicators mainly focus on the pipe status and network parameters of the drainage infrastructure, with a relatively narrow evaluation scope, resulting in evaluation outcomes that often fail to accurately reflect the true health status of the pipe network during operation. Common weighting methods for pipe network evaluation indicators include the traditional analytic hierarchy process [33,34,35,36,37,38], as well as emerging methods such as the entropy weighting method [39], neural network method [40], genetic algorithm [18], and combined weighting methods [41]. The “Technical Specification for Inspection and Evaluation of Urban Sewer” (CJJ181-2012), introduced by China in 2012, provides detailed explanations and regulations for the evaluation of drainage pipeline defects. However, it focuses primarily on the physical condition of the drainage network and fails to consider the impact of network fundamental attributes, such as the drainage system type and collection efficiency. Myung et al. [40] applied a neuro-fuzzy approach to assessing the operational status of sewage networks, with key evaluation metrics including pipe diameter, the number of pipeline cracks, etc. Similarly, Zhou et al. [42] evaluated the operational efficiency of the sewage system in Shanghai using a set of indicators, such as structural and functional defects, network coverage, misconnection issues, and municipal pipeline connectivity.
At present, comparatively few studies have been conducted on the evaluation of pipe networks using hydraulic indicators. Zhang et al. [43] used the pipe full-flow time as a drainage capacity indicator and employed the SWMM model to simulate and analyze the performance of the drainage system under different design recurrence intervals rainfall events. Saad et al. [44] proposed a method for evaluating the hydraulic performance of drainage networks, with key indicators including the hydraulic capacity of pipe sections, the frequency and duration of overloading, the volume of overflow, etc. Mohammadi et al. [45] examined potential factors influencing the condition of drainage pipelines through analysis of predictive models, identifying pipe age, material, diameter, and length as key factors contributing to pipeline deterioration. Zhou et al. [46] developed a method to assess the health of drainage pipelines by integrating hydrodynamic simulation, with results showing that load condition and flow velocity were the primary factors, accounting for 70.61%. There are also some scholars [47,48] who have used hydraulic performance indicators such as flow velocity, pipe filling degree, and manhole overflow volume in the development of drainage network performance evaluation systems.
The assessment of hydraulic performance in sewage pipe networks is essential for addressing issues such as low flow velocity and high water levels, which contribute to inefficiencies in the network’s hydraulic performance. It not only helps identify high-risk pipelines to develop the most cost-effective rehabilitation plans but also allows for the assessment of restoration effectiveness after rehabilitation. Current methods for evaluating the hydraulic performance of sewage pipe networks typically focus on the physical connectivity and integrity of the network, considering factors such as pipe age, sewage collection rate, and network density. However, these methods do not assess the actual hydraulic performance of the network, such as pipe flow velocity and fullness. As a result, they fail to reflect the true hydraulic performance of the network during operation, including whether the water collection capacity meets discharge requirements, whether manholes overflow, and whether flow velocity and pipe fullness meet design specifications. Given that the existing methods and their indicators are incapable of reflecting the actual hydraulic performance of the network, understanding the practical hydraulic conditions within the pipe network is crucial for aspects such as optimizing drainage efficiency, ensuring the health of the pipe network, and enhancing drainage management. It is, thus, important to incorporate new hydraulic-related indicators. These new hydraulic indicators are vital in bridging the gaps within the current pipe network evaluation methods, enabling a more accurate and comprehensive evaluation and representation of the actual hydraulic performance in the drainage pipe networks.
Our study aims to develop a hydraulic performance assessment method for sewage pipe networks by combining the SWMM platform with key hydraulic indicators. It aims to evaluate the actual hydraulic performance in the pipe networks better and, at the same time, fill the gaps of hydraulic indicators in the current pipe network evaluation methods. This method will be applied to evaluate the hydraulic performance of the sewage pipe network in H City. Based on the evaluation results, certain renovations will be carried out and the effectiveness of such renovations will be assessed.

2. Methodology

The flowchart of the evaluation method for hydraulic performance is shown in Figure 1. Based on the surveying data of the pipe network and the measured data of pipe flow, the SWMM model of the target pipe network is built into the SWMM 5.2 software. Then, the operating parameters of the model are set and run. After running, the simulated result data are obtained and evaluated according to three evaluation indicators: flow velocity; pipe fullness; and manhole fullness. By comprehensively considering the scores of these three indicators, the final evaluation result of the pipe network is obtained.

2.1. Indicators for Assessing Hydraulic Performance

2.1.1. Pipe Flow Velocity

The flow velocity is a critical indicator for assessing hydraulic performance [49]. To investigate flow velocity in sewage pipe networks, researchers have proposed the concept of self-cleaning sewer design [50,51,52,53]. This design concept ensures that the sewer system maintains a clean condition during operation by minimizing the formation of fouling substances, sediments, and biofilms, which improves the efficiency of water drainage, reduces maintenance costs, and safeguards water quality and safety [54,55]. The tractive force method is a method of designing sewers with self-cleaning conditions based on critical shear stress [56]. Kevin et al. [57] applied the tractive force method to the evaluation of the self-cleaning ability of existing sewers and constructed an equation for evaluating the self-cleaning flow velocity of each sewer under different sewer diameters and water depths in the sewer, as shown in Equations (1) and (2).
V s c = 1.486 n R 1 6 ( τ c γ ) 1 / 2
τ c = 0.0181 ( D p ) 0.277
where V s c is the self-cleaning flow velocity (ft/s); n is roughness coefficient; R is hydraulic radius (ft); τ c is critical shear (lb/ft2); γ is the specific weight of water (lb/ft3), and D p is the nominal diameter of design particles. They verified this method using the data from flow monitoring points across the United States, demonstrating the effectiveness of the tractive force method in the evaluation of self-cleaning design for sewers. The critical shear τ c reflects the minimal shear force necessary to move particles throughout the sewer and has a value that varies with the solid particles being carried in the wastewater. Based on wastewater solids characteristics in the UK, this value is 0.0181 lb/ft2 for the most unfavorable case (median particle size of deposited particles d50 = 1 mm and specific gravity of 2.7). For domestic sewage (d50 = 0.06 mm) and rainwater (d50 = 0.1 mm), the values are 0.0083 lb/ft2 and 0.0096 lb/ft2, respectively.
In this study, the τ c values corresponding to a d50 of 0.1 mm were adopted as the flow velocity score (VS) criteria for VS = 60. Since this is the d50 of rainwater that is larger than the d50 of domestic sewage, a velocity larger than this indicates that the flow velocity can meet the basic requirement for transporting sewage. The τ c values at a d50 of 1 mm, which is 10 times the d50 of rainwater, were adopted as the VS criteria for VS = 80, which means that the flow velocity can meet the transportation requirements of typical rainwater and sewage. The τ c value at a d50 of 10 mm, which is 100 times the d50 of rainwater, was used as the criterion for VS = 100, implying that such a flow velocity can meet the transportation of all sewage and rainwater particles in the pipe and no deposition will occur. Table 1 shows the corresponding VS criteria for different sewer diameters at maximum fullness (0.75) according to Equations (1) and (2). In the “Standard for design of outdoor wastewater engineering” (GB 50014–2021) published in China, the minimum design flow velocity of the drainage pipe under the designed fullness is 0.6 m/s, which is similar to the flow velocity range of 0.40–0.61 m/s, corresponding to the VS = 80 scoring standard in our research. This indicates that the critical flow velocity obtained by referring to the characteristics of wastewater particles in the UK has a good correspondence with the design flow velocity of drainage pipe networks in China, which proves that the constructed VS criteria are reasonable.
Equation (3) depicts the pipe VS criterion based on the self-cleaning critical flow velocity.
P v i j = 100 ,                                                                 v i j v 100 80 + 20 × v i j v 80 v 100 v 80 ,     v 80 v i j < v 100 60 + 20 × v i j v 60 v 80 v 60 ,                           v 60 v i j < v 80     60 × v i j v 60 ,                                             v i j < v 60  
where P v i j is the VS of sewer i at the moment j; v i j is the flow velocity of pipe i at the moment j (m/s); v 100 , v 80 , v 60 refer to the self-cleaning critical flow velocity (m/s) at VS of 100, 80, and 60, respectively.
The sewer does not need to reach a high flow velocity all the time to meet the requirements of flushing sediment and self-cleaning. Instead, reaching it for a certain length of time is enough. Thus, in the final FS evaluation of a sewer, we take the cumulative time into consideration. Firstly, when the pipe flow velocity reaches v 100 and continues to run for more than 1 h, the VS will be 100 points. Secondly, when the pipe flow velocity reaches v 80 and continues to run for more than 3 h, the VS will be above 80 points. Thirdly, when the pipe flow velocity reaches v 60 and continues to run for more than 6 h, the VS will be above 60 points. For sewers that do not match the aforementioned conditions, the VS is computed by averaging all VS moments during operation, as stated in Equation (4).
P v i =     100 ,                                                                             t p v i j 100 1   h 80 + 20 × t p v i j 80 3 24 3 ,             t p v i j 80 3   h   60 + 20 × t p v i j 60 6 24 6 ,           t p v i j 60 6   h   1 n j n p v i j ,                                                             else                              
where P v i is the VS for sewer i. The comprehensive VS of the entire network is calculated as illustrated in Equation (5):
P v = i n P v i l i
where P v is the comprehensive VS of the entire network; l i is the ratio of the length of pipe i to the total length of the pipe network.

2.1.2. Pipe Fullness

Pipe fullness directly reflects the water transmission capacity and the risk of overflow of sewers. When the pipe fullness exceeds its design value, the risk of overload and overflow increases. Moreover, if this situation lasts for a long time, the pipe’s water transmission capacity is insufficient. Table 2 shows the maximum pipe fullness of different pipe diameters as per the “Standard for design of outdoor wastewater engineering” (GB50014-2021).
The higher the pipe fullness, the greater the chance of overload. Ideally, the sewer should be operated at a fullness less than the design value at all times; nevertheless, due to the uncertain discharge timing of drainage households, there is some variability that may cause the pipe fullness to be larger than the design value for brief periods. Therefore, to account for the impact of this uncertainty on the sewer, the length of operation time when the pipe fullness is larger than the design value is utilized to assess the pipe fullness hydraulic performance, with the criteria of the pipe fullness score (FS), indicated in Equation (6):
P f i = 100 × ( 1 t f p > f D t t o t a l ) 2
where P f i is the FS of pipe I; f p is the fullness of the pipe, and f D is the maximum design fullness of the pipe at the corresponding diameter. t f p   >   f D is the length of operation time (h) in which the pipe’s instantaneous fullness exceeds its design value. t t o t a l is the total running time (h). Based on the criterion, when t f p   >   f D t t o t a l is less than 5%, the FS is greater than 90; when it is less than 10%, the FS is greater than 81; and when it is more than 20%, the FS is less than 64. The comprehensive FS of the entire network is calculated as illustrated in Equation (7).
P f = i n P f i l i
where P f is the comprehensive FS of the entire network.

2.1.3. Manhole Fullness

Manhole fullness is defined as the ratio of the water level above the pipe crown to the buried depth of the pipe crown. Since the pipe network experiences an overflow when manhole fullness exceeds 100%, it is the most direct indicator of the overflow of the pipe network. Ideally, the water level in the manhole should be below the buried depth of the pipe crown, and at this time, manhole fullness is 0. When the water level submerges the pipe crown, it indicates that the connecting pipes are in a full-flow condition. At this time, the manhole fullness will be greater than 0, bringing about a risk of overflow. Moreover, the risk of overflow will increase rapidly with the rise in manhole fullness. Considering the existence of variability in the drainage of drainage households, manhole fullness should be allowed to be greater than 0 for a short period but should not exceed 20%; otherwise, there will be a risk of easy overflow. The criteria for the manhole fullness score (MFS) are shown as Equations (8) and (9):
p w i j = 100 ,                                                   f w i j = 0   100 ( 1 f w i j ) 2 ,     f w i j   >   0
f w i j = h w i j G
where p w i j is the MFS of manhole i at the moment j; f w i j is the fullness of manhole i at the moment j; h w i j is the water level above the pipe crown of manhole i at time j (m), and G is the buried depth of the pipe crown (m). Since we are evaluating the overflow risk of a sewer network, attention should be paid to the manholes that are most likely to have overflow risks during the peak drainage period rather than all manholes. Therefore, we choose the top 20% of manholes with the lowest p w i j values to represent the manhole fullness hydraulic performance of the sewer network. Specifically, the average value of p w i j within one hour before and after the moment when p w i j is the lowest for each manhole is taken as the MFS for that manhole. Then, the average MFS of these 20% of manholes is considered the comprehensive MFS of the sewer network.

2.1.4. Pipe Network Comprehensive Score

How to determine the weights of VS, FS, and MFS in the calculation of pipe network comprehensive score (PNCS) is an important issue. A large number of the literature reviews show that there is currently no relevant research mentioning the importance of ranking these three indicators. Therefore, we turned to examine the impact of different weight distribution schemes on the PNCS of our research object. Among the three hydraulic performance indicators of the pipe network, the flow velocity indicator should be the most important. This is because the flow velocity is related to deposition and the rapid transportation of sewage and is a key factor in ensuring the long-term healthy operation of the pipe. The importance of manhole fullness is second. Once a manhole overflows, it will have a negative impact on the environment and may also cause public dissatisfaction. In comparison, pipe fullness seems to be the least important. Even if it exceeds the designed fullness or even reaches full flow, its sewage conveyance capacity is less affected compared to the non-full flow state, and the danger caused by full flow does not seem as urgent as that of manhole overflow. Therefore, we formulated three weight distribution schemes, VS:MFS:FS = 0.5:0.3:0.2, 0.4:0.4:0.2, 1/3:1/3:1/3, and studied the PNCS under these three weight distribution schemes. We found that under the first scheme, the PNCS of the main pipeline of the pipe network before and after renovation could not well reflect the real situation of the evaluated pipe network, while the PNCS under the latter two schemes could better show the actual situation before and after the renovation. We considered that in the 0.4:0.4:0.2 weight distribution scheme, the weight of pipe fullness is relatively low and may not be very reasonable. In comparison, the 1/3:1/3:1/3 weight distribution scheme distributes the weights of different indicators more evenly. It can also comprehensively consider the value and significance of each indicator. Therefore, VS:MFS:FS = 1/3:1/3:1/3 is used as the weights in the calculation of PNCS.
The grading of PNCS levels is presented in Table 3.
When PNCS > 90, the hydraulic performance is rated “Excellent”. In this case, the flow velocities of all the pipes can almost meet the self-cleaning requirements for all incoming water qualities; the pipe fullness is almost always less than the design value; the manhole fullness is nearly zero; and the sewer network is fully capable of meeting the current drainage needs and has a strong resistance to the impact of short-term accidental inflow of water.
When 80 ≤ PNCS < 90, the hydraulic performance is rated as “Good”. In this case, the flow velocity can meet the self-cleaning requirements of typical rainfall and sewage; the time when the pipe fullness is greater than the design value is short; the manhole fullness is nearly zero, and the sewer network meets current drainage needs and has a medium level of impact resistance to short-term accidental inflow of water.
When 70 ≤ PNCS < 80, the hydraulic performance is rated as “Medium +”. In this case, the pipe flow velocity can basically meet the conventional drainage self-cleaning requirements; the time of pipe fullness exceeding the design value is at a medium level; the time when the manhole fullness is greater than zero is relatively long, but the value is relatively small; the pipe network can basically meet the current drainage requirements, and it has a certain impact resistance to short-term accidental inflow of water.
When 60 ≤ PNCS < 70, the hydraulic performance is rated as “Medium −”. In this case, the flow velocity can only barely meet the conventional drainage self-cleaning requirements for sewage, and there are easy-to-deposit phenomena: the pipe fullness exceeds the design value for a longer period; the time when the manhole fullness is greater than zero is longer, and the value of manhole fullness is larger; the network can only barely meet the current drainage requirements; and it has almost no impact resistance to short-term accidental inflow of water.
When PNCS < 60, the hydraulic performance is rated as “Poor”. In this case, the pipe flow velocity is low, and the operation state is at a high water level for a long time, making it very easy to produce sedimentation, and the long hydraulic retention time will aggravate the biodegradation of BOD in the wastewater; the manhole fullness is larger; the risk of overflow is very high, and there is no impact resistance to the accidental inflow of water.

2.2. Research Object

In this study, a branch of the sewage pipe network in City H was chosen as a research object to assess the hydraulic performance of the network before and after renovation. Figure 2 depicts the distribution of the pipe network in the research area. The study area is 5.4 km2; the total length of the sewers is 26.9 km, with the length of each pipe diameter and its proportions provided in Table 4, and the end collection volume is 32,000 m3/day. The types of drainage households are mainly residential areas and public buildings, and the sewage from the downstream industrial areas is not discharged into the network. The network is a complete branch of the sewage collection system, with sewage collected and released to the downstream wastewater treatment plant via the main pipeline along Xi’an Road and Yan’an Road.

2.3. SWMM Pipe Network Model

2.3.1. SWMM

Drainage network models serve as the foundation for studying rainfall runoff, catchment patterns, and operational features [58], as well as assisting in the optimization of planning, operation, maintenance, and restoration [59,60,61]. The SWMM model of the United States Environmental Protection Agency was the first hydrological model constructed, kicking off the study history of software modeling of urban drainage systems [62,63]. Following that, the Wallingford model, Infoworks model, and MIKE model evolved, allowing for a highly convenient simulation analysis of the urban drainage network [64,65,66]. The SWMM model is a tool for assessing the hydraulic performance of drainage networks, commonly used to simulate the hydraulic characteristics of the network, quantify resilience, and combine with other models for comprehensive assessment [67,68,69,70]. Some scholars have developed a real-time flood monitoring system based on SWMM [71]. Previous simulation studies on drainage pipe network models in China mostly focused on the simulation of sponge cities, rainfall runoff, and the flow capacity of drainage pipes [72,73]. These studies have shown that SWMM was a viable urban storm model for simulating storm floods and analyzing pipe network drainage. Meanwhile, compared with other models, SWMM is an open-source model, and its simulation results are easy to obtain for data analysis. Therefore, we select SWMM to build our model.

2.3.2. Model Run Indicators

According to the survey data, the distribution of the pipe network in the study area, pipe shape, pipe length, pipe elevation, pipe diameter, roughness (0.014 for municipal trunk pipes and 0.015 for municipal branch pipes), and pumping stations, is generalized into SWMM, and a SWMM model of the network is established. For the model operation, the kinematic wave method was used to calculate the confluence of the pipe network. The Dampen method was selected for the inertial term, and the time step was set at 20 s. The simulation running time of the model was from 0:00 on December 12th, 2022, to 3:00 on December 15th, 2022. Given that the set daily inflow volume remained consistent, in order to ensure that the operation of the pipe network reached an equilibrium state, the data on December 14th were selected for analysis. At this time, the pipe network had been running continuously for two days, and its operating state had tended to be in a stable equilibrium.

2.3.3. Drainage Curves for Drainage Households

To obtain accurate drainage data, flow monitoring was carried out on the main pipe on the west side of the upstream, thus obtaining the drainage data of the drainage households upstream of this point during 12–14 December 2022. The drainage volumes in each period of these three days were averaged to determine the daily drainage curve of this pipe network. Based on this curve, the drainage volumes of different drainage households were calculated according to the Equation (10):
q h = A h A m · q m
where q h is the water consumption by drainage households (m3/d); q m is the measured flow (m3/d); A h is the total floor area for calculation of the building volume ratio of drainage households (m2); A m is the total floor area for the calculation of the building volume ratio in areas of measured flow (m2).
After calibration, the SWMM model demonstrates a strong match between the simulated flow rate at the monitoring locations and the measured flow rate (Figure 3), indicating that the input flow data properly represent the pipeline’s real flow rate.

3. Result and Discussion

3.1. Pipe Flow Velocity Evaluation

The flow velocity of the entire network was first analyzed, and the results showed that the VS of the entire network was 51.6 points, which was rated as a “poor” grade. This indicated that under the existing conditions, the overall flow velocity of the pipe network was relatively low, and it was difficult to meet the requirements of effective drainage. Further analysis of the VS of the main pipeline showed a score of 69.3 points, belonging to the “medium −” grade. Although the main pipeline performed slightly better, the overall flow velocity hydraulic performance was still relatively poor.
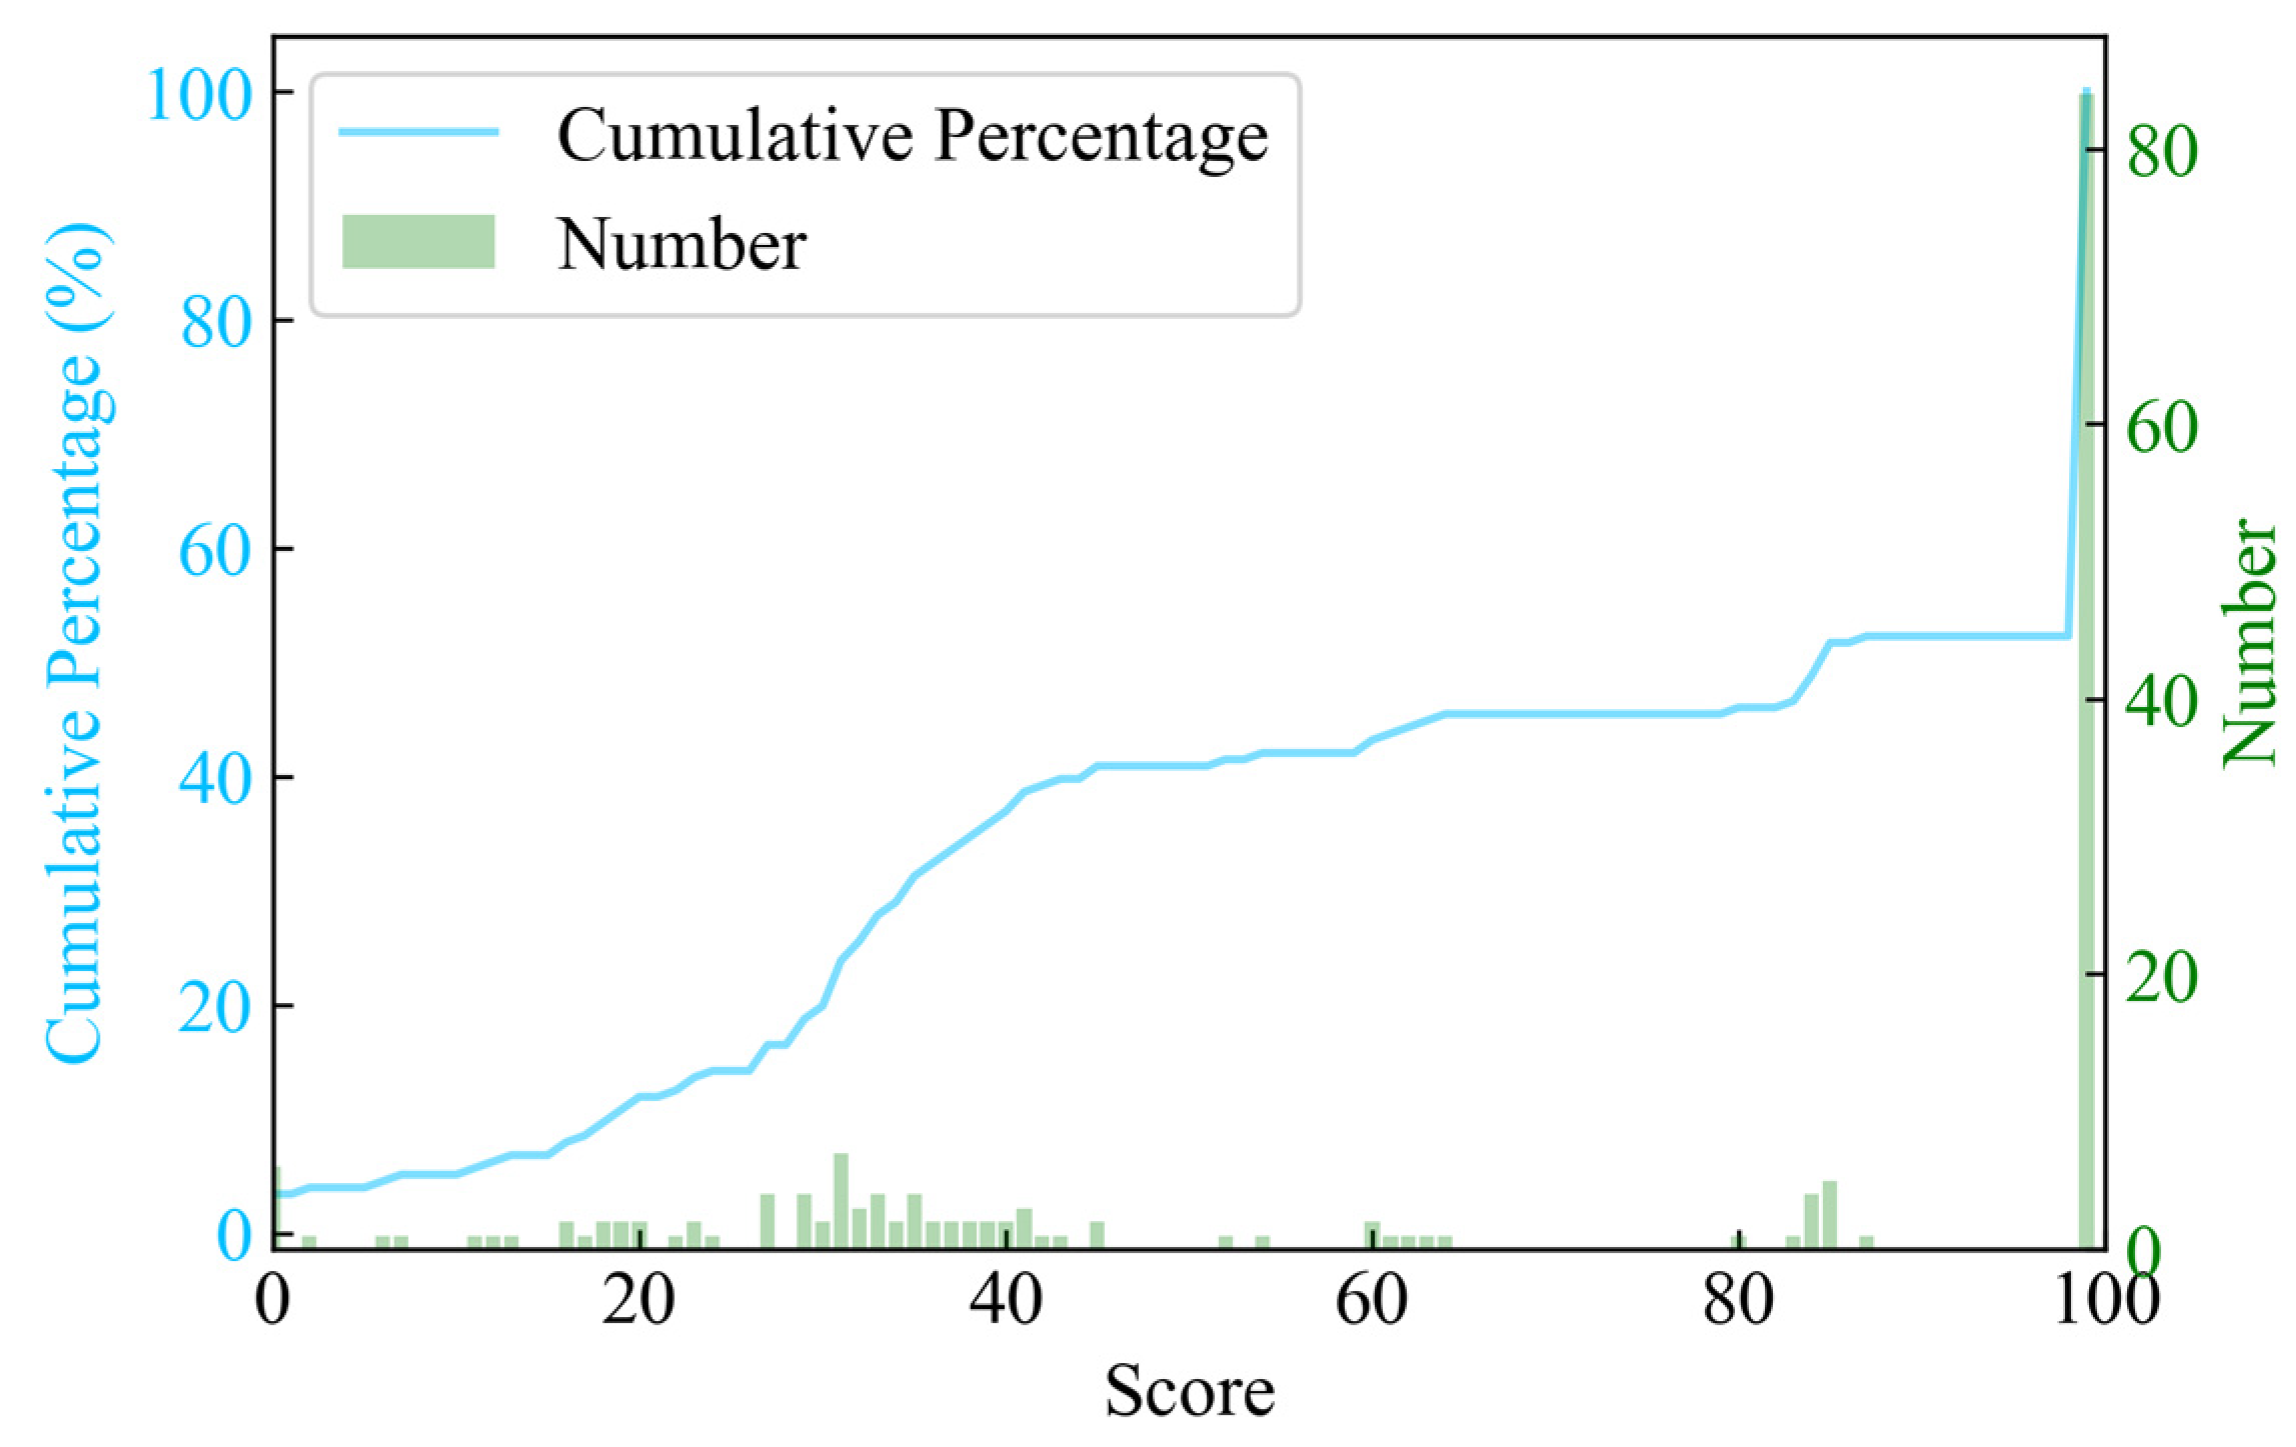
To gain an in-depth understanding of the distribution characteristics of the flow velocity of each pipeline section, we conducted a zonal statistical analysis of the VS of each section (Figure 4). According to the results, only 30.84% of pipeline sections met the self-cleaning criteria during operation (VS = 100), which means that the flow velocity was adequate to scour and carry particles with d50 ≤ 10 mm for at least 1 h; only 7.94% of pipe sections with VS between 80 and 100 indicated that these sections achieved excellent flow velocities for more than 3 h during the day, which was sufficient to transport particles with d50 ≤ 1 mm, while 4.21% of pipe sections with VS between 60 and. 80 points were suitable for transporting only basic domestic sewage discharge, making it difficult to cope with more complex drainage requirements and relatively prone to sedimentation and BOD degradation problems. The percentage of pipe sections with VS < 60 was 57.01%, indicating that more than half of the pipelines had difficulties in scouring and transporting the particulate matter in the sewage in terms of flow velocity. This will pose challenges in two aspects. First, the particulate matter in the sewage will settle at the bottom of the pipeline. Over time, this will lead to blockage of the pipeline, reduce the water transmission capacity, and increase the risk of pipeline rupture [74,75]. Tu et al. [76] found that when the flow velocity was less than 0.3 m/s, more than 30% of the pipeline was occupied by larger sand grain deposits. Second, the lengthened hydraulic retention time due to the low flow velocity means that the sewage needs to stay in the pipe network for a longer period. As a result, the organic components in the sewage will be further decomposed and utilized by the microorganisms in the sewer [6], leading to a very low BOD concentration of the sewage arriving at the wastewater treatment plant, which is unfavorable for the biological treatment of wastewater. Jin et al. [77] found that when the hydraulic retention time was 6 h, the microorganisms could remove 8.67% of the dissolved COD and 5.58% of the total nitrogen during sewage transportation. Zan et al. [78] found that the biological processes in the sewer reactor would consume 25% to 30% of the total COD. Meanwhile, the microbial degradation of organic matter may also release harmful gases, exacerbating risks such as the greenhouse effect and pipeline corrosion [79].
The proportion of pipelines in different VS zones in this pipe network varies significantly: pipelines with VS < 60 account for 57.01%; pipelines with VS between 60 and 100 only account for 12.15%, and pipelines with VS = 100 account for 30.84%. This indicates that the hydraulic operating state of the pipe network is rather extreme. Most of the pipelines are either in the low-flow velocity zone or in the high-flow velocity zone, reflecting that the diameter distribution may be unreasonable: the diameters of high-flow pipelines are relatively small, while the diameters of low-flow pipelines are relatively large.
We examined the changing trend of the entire network’s VS over a day to determine the dynamic change in flow velocity hydraulic performance. The VS of the entire network at a given moment is calculated as the total of the instantaneous VS of all pipes at that moment weighted by pipe length (Figure 5). Studies have shown that the daily variation in flow velocity usually changes with the magnitude of sewage inflow, presenting the characteristics of a fast flow velocity at peak times and a slow flow velocity at trough times [80]. For example, in the research on the interaction between urban drainage systems and surface water flow by Kitsikoudis et al. [81], they observed experimental phenomena by gradually increasing the flow rate and found that when the flow rate increased, the flow velocity also increased correspondingly; when the flow rate decreased, the flow velocity also decreased accordingly. Similarly, we found that the VS of the entire network fluctuated significantly over time and was generally consistent with the inflow curve of the drainage households, with a slight lag. The main reason is that it takes a certain amount of time for the sewage to flow into the pipe network and propagate to the downstream sections. During the peak drainage periods (8:00–10:00 and 17:00–1:00), the pipeline experiences a large flow volume accompanied by a relatively high flow velocity, leading to a higher VS of the pipe network. In contrast, during the trough drainage periods (3:00–7:00), the pipeline flow volume is small, and the corresponding VS is also relatively low. Notably, the VS remained consistently below 60 throughout the day, indicating that the network as a whole can hardly meet the minimum flow velocity standard for cleanly transporting particles with a d50 of 0.1 mm at any time. Moreover, with the lowest VS of 17.9 during the trough period, the flow velocity hydraulic performance was extremely poor.
It should be noted that the relatively low VS of the entire network may be partly due to the insufficient precision and data accuracy of the inflow settings in the SWMM model. For example, it is impossible to monitor all drainage households to obtain accurate flow data when establishing the model, so the inflow in SWMM may be significantly off from the actual situation for the majority of branch pipes. The inflow of the main pipeline gathers the flows of multiple branch pipes and has been calibrated by the flow of the monitoring sites, bringing the main pipeline’s operation closer to the actual situation. Therefore, we conducted an analysis and comparison of it.
As shown in Figure 6, the proportion of pipeline sections with full VS in the main pipeline reaches 47.73%, which is 16.89% higher than that of the entire network, indicating that the main pipeline has a stronger ability to scour and transport larger particles. The proportions of sections with VS between 80 and 100 and 60 and 80 are 6.82% and 3.41%, respectively, both of which have decreased compared to the entire network. The proportion of sections with VS < 60 is 42.05%, which is 14.96% lower than that of the entire network. This shows that when only the main pipeline is evaluated, the flow velocity hydraulic performance of the pipe network will be significantly improved.
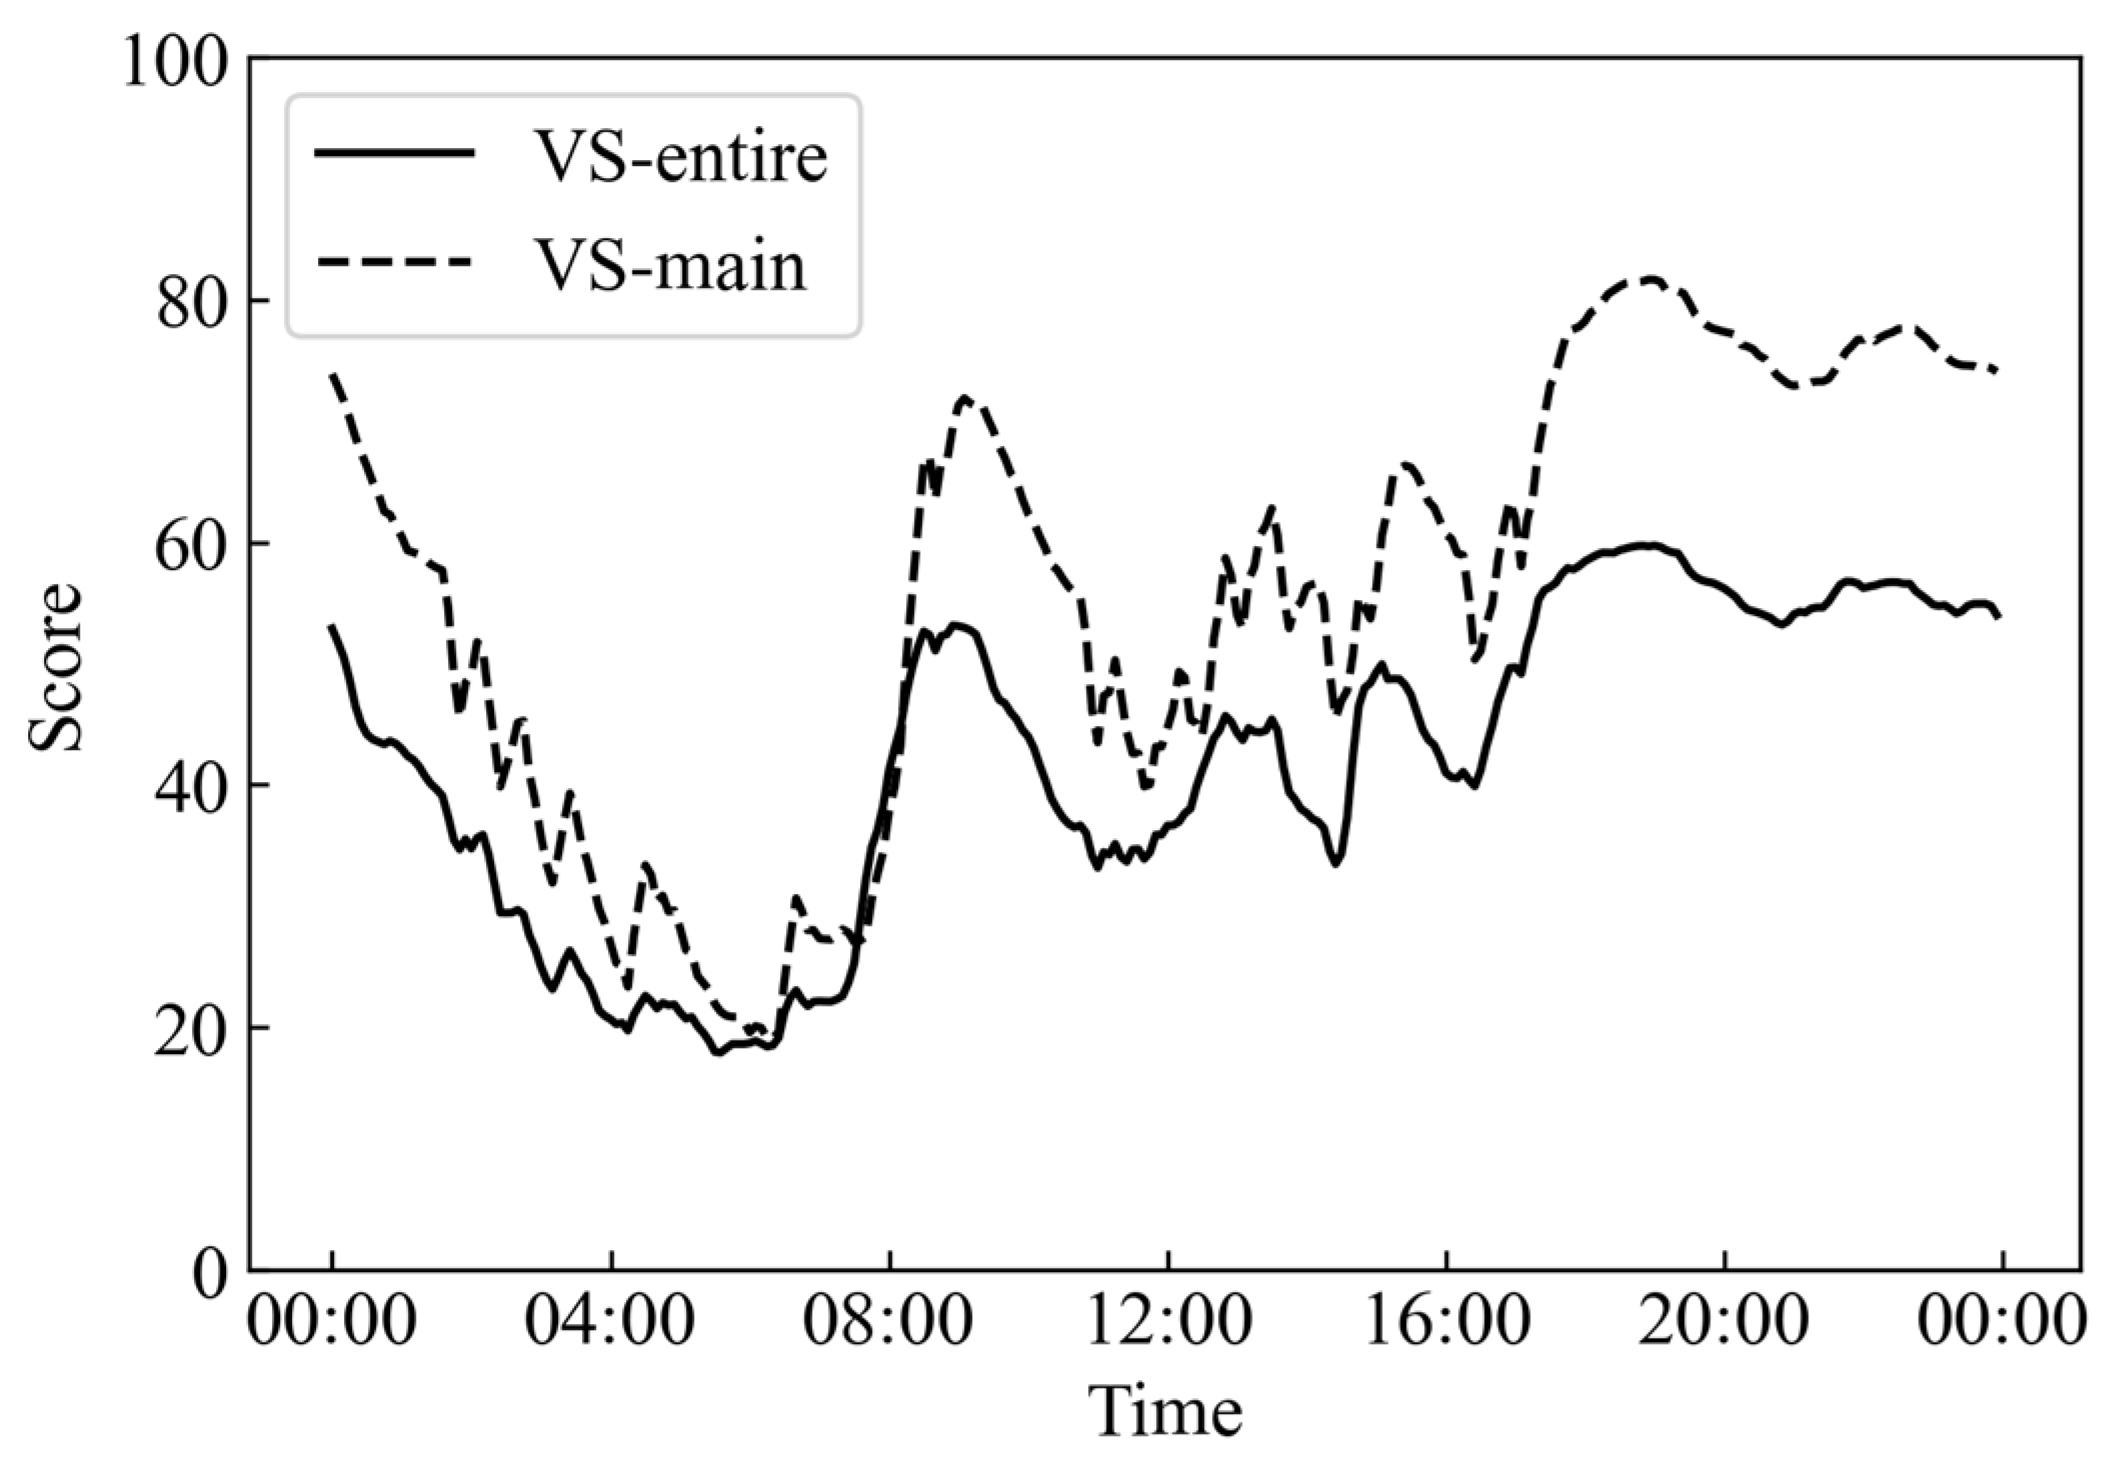
As shown in Figure 7, the VS change curve of the main pipeline throughout the day also has a similar trend to that of the inflow curve of the drainage households, and it lags behind the change curve of the entire network, indicating that it takes more time for the sewage to spread from the drainage households to the main pipeline. Different from the situation in which the VS of the entire network are all below 60, the VS of the main pipeline during the peak drainage period obviously exceeds 60 and exceeds 80 for more than 1 h. In addition, it is noted that the time when the VS is above 60 accounts for 47.58%, which means that when only the VS of the main pipeline is evaluated, nearly half of the time, the pipe network meets or exceeds the sewage transportation standard for transporting particles with a d50 of 0.1 mm, once again confirming that when only the main pipeline is evaluated, the flow velocity hydraulic performance of the pipe network will be significantly improved.

3.2. Pipe Fullness Evaluation

In the evaluation of pipe fullness, the FS of the entire network is 80.0, belonging to the “good” grade, which indicates that the fullness of most pipeline sections basically meets the design fullness requirements during operation. In contrast, the FS of the main pipeline is slightly lower, at 74.4, belonging to the “medium +” grade.
A zonal statistical analysis on the FS of each pipeline section (Figure 8) of the entire network reveals that 62.85% of the sections have a fullness lower than the design fullness during operation, consequently score full marks, indicating that most sections can operate stably under the design load. Additionally, the proportion of pipeline sections with FS between 80 and 100 is 10.28%, suggesting that these sections only have a small amount of time when their fullness exceeds the design fullness. The proportion of pipeline sections with FS < 60 is 23.60%, among which 10.75% of the sections have FS lower than 25 points, indicating that these pipeline sections have a fullness exceeding the design standard for more than 50% of the time, posing a risk of overflow. It may lead to insufficient emergency carrying capacity, particularly during peak drainage periods. Compared with the entire network, the proportions of pipeline sections in the main pipeline with full FS, FS between 80 and 100, and FS between 60 and 80 points decrease by 5.46%, 0.62%, and 1.00%, respectively, while the proportion of pipelines with FS < 60 increases by 7.08%. This indicates that when only the main pipeline is evaluated, the pipe fullness performance of the pipe network will be significantly reduced.
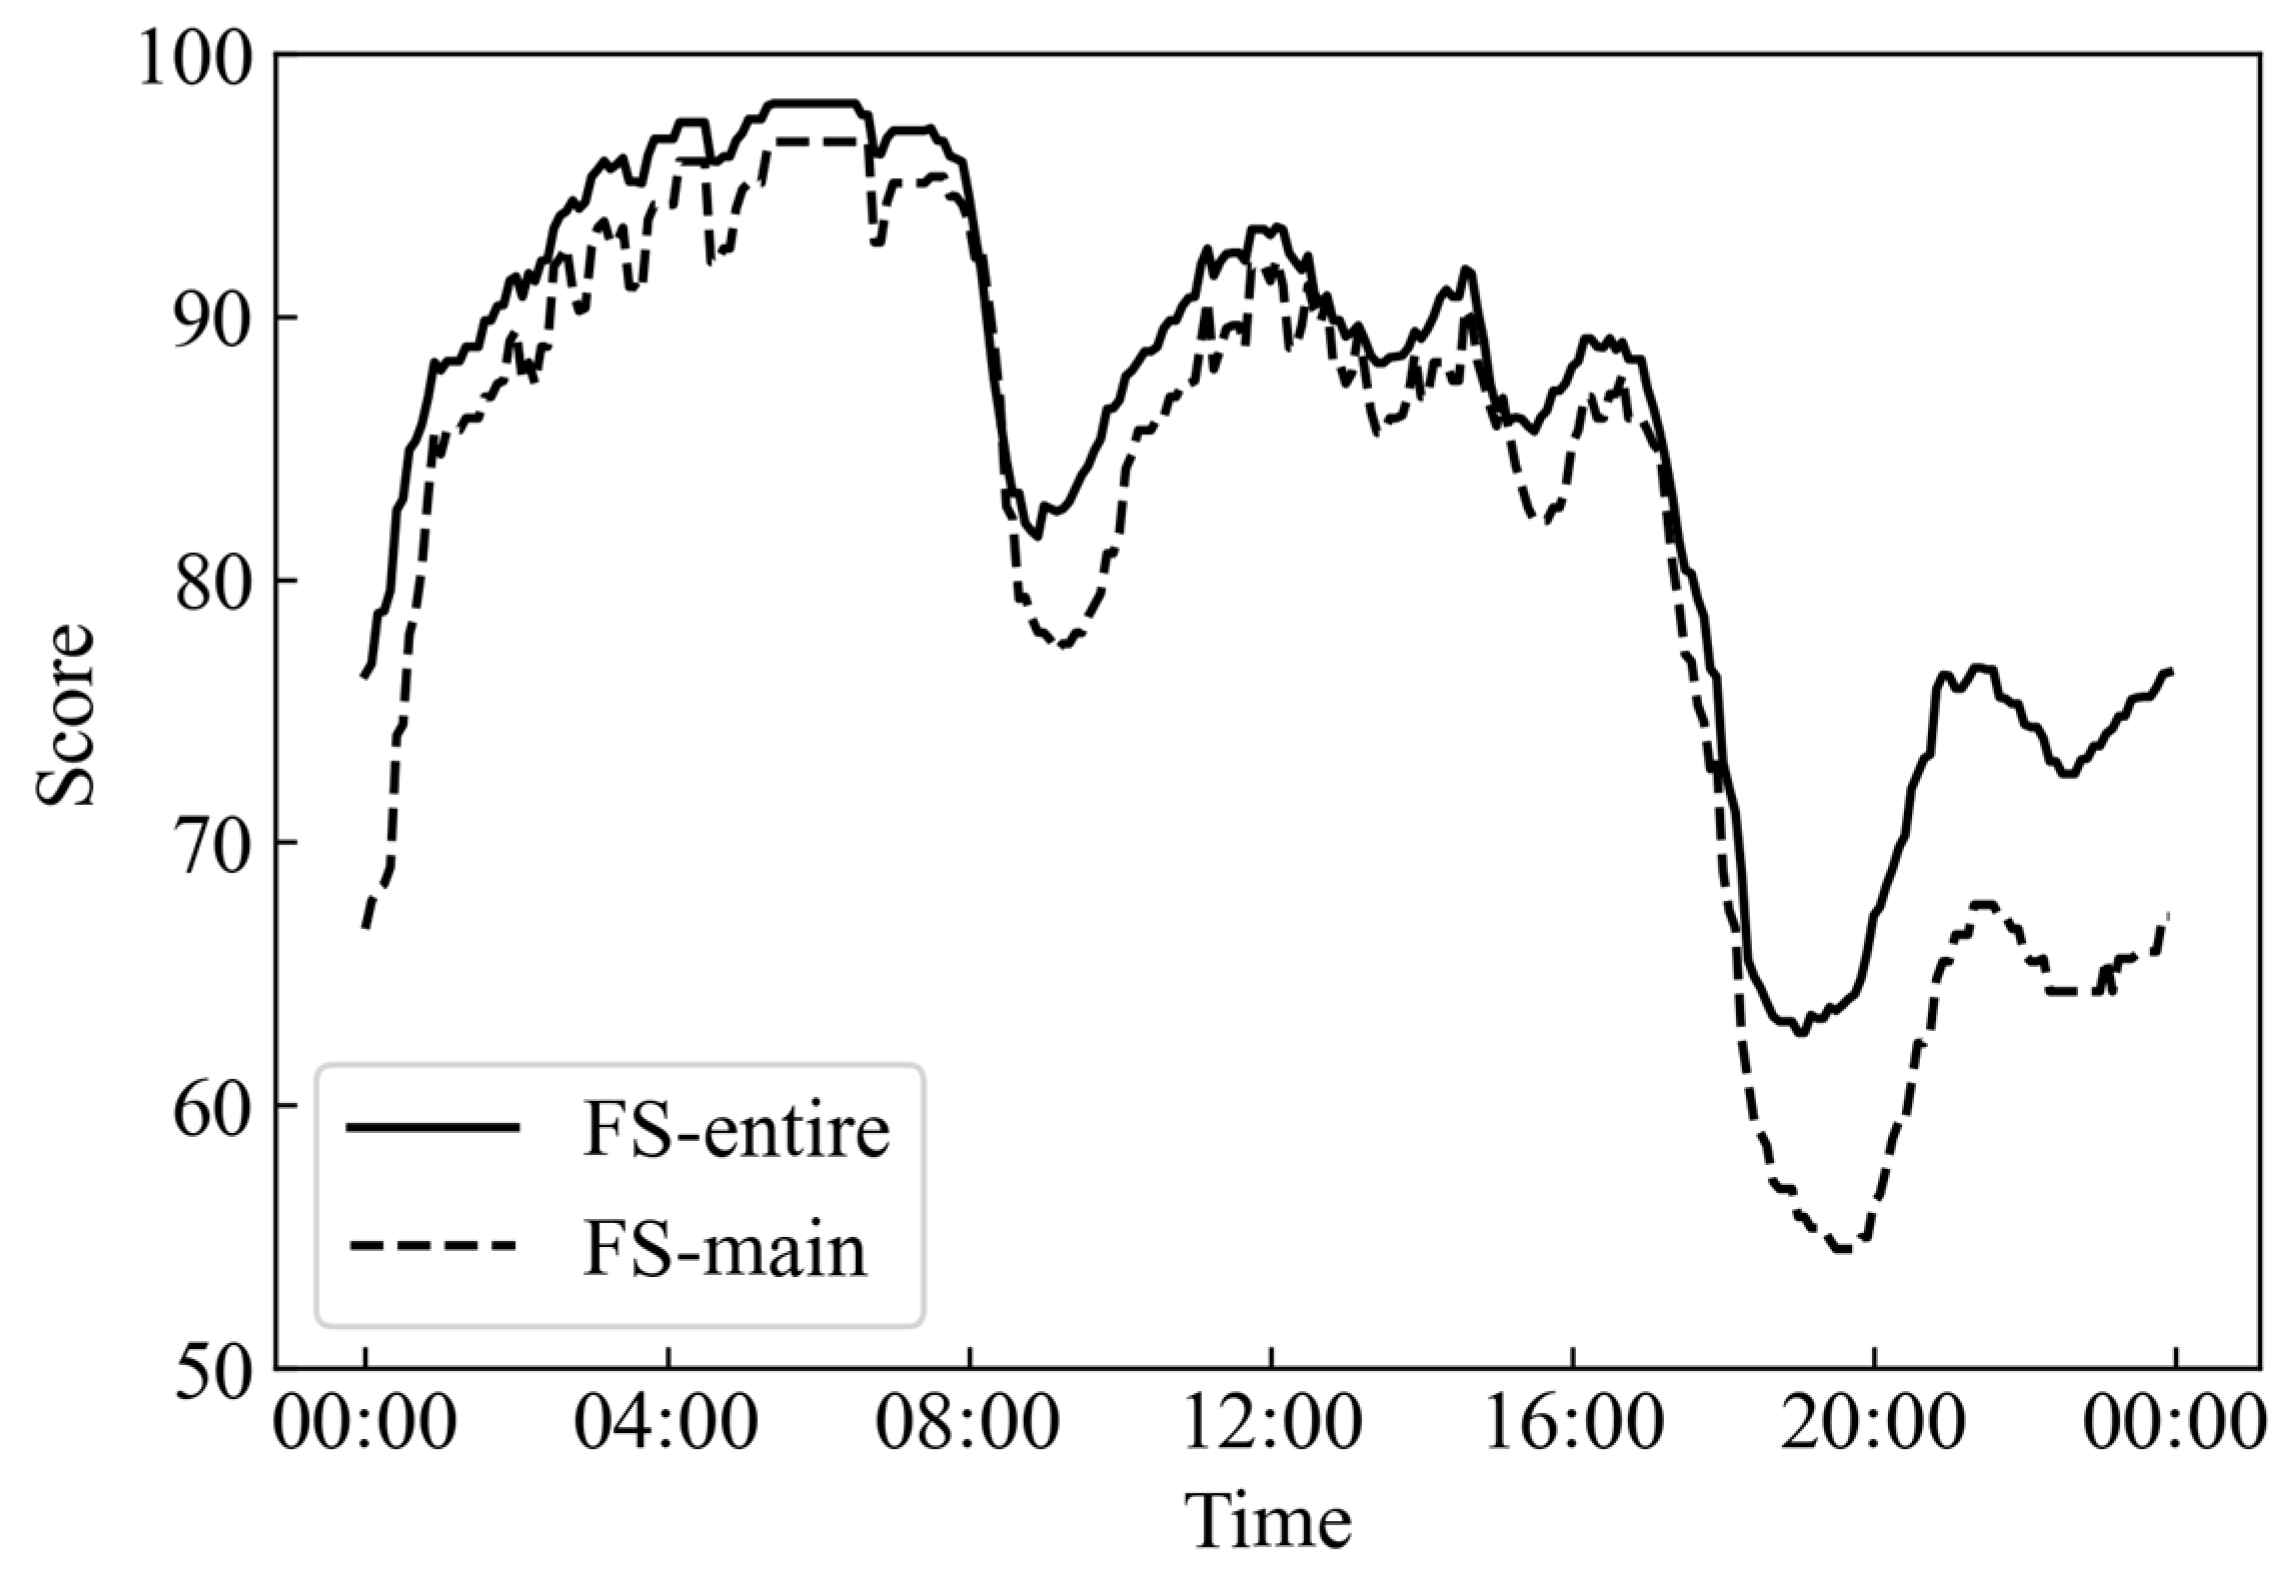
According to the rule that “a score of 100 points is given for being lower than the design fullness and a score of 0 points for being higher than the design fullness”, the instantaneous FS of each pipeline section is calculated, and the total of the length-weighted instantaneous FS of all sections at a certain moment is taken as the FS of the pipe network at that moment. The FS change curve of the entire network and the main pipeline throughout the day are analyzed (Figure 9). The trend of the entire network’s FS over time is opposite to that of the inflow curve of the drainage households, with the overall trend slightly lagging. The scoring rule enables the score at a certain moment to represent the proportion of the pipeline length that meets the design fullness requirements at that moment. The data show that during 64.93% of the operating time, the proportion of the pipeline length that meets the fullness requirements exceeds 80%, while during only 8.33% of the time, this proportion is less than 60%. The FS for the main pipeline for all moments decreased by 1.44 to 11.20 points compared to the entire network, with an average decrease of 4.25 points, once again indicating that when only evaluating the FS of the main pipeline, the fullness hydraulic performance of the pipe network will be decreased.

3.3. Manhole Fullness Evaluation

The MFS of the entire pipe network and the main pipeline are 47.7 points and 35.8 points, respectively, both of which are at the “poor” grade. The zonal statistical analysis of the MFS of each section in the entire network, as shown in Figure 10a, suggests that there are 282 manholes in the entire pipe network that score full marks, meaning that 65.89% of the manholes have water levels below the pipe tops during operation, and the hydraulic performance of these manholes is good; however, 0.94% of the manholes have MFS < 40, meaning that the average fullness of these manholes throughout the day exceeds 20%, and among them, even 0.24% of the manholes have MFS < 20, meaning that the average fullness throughout the day exceeds 40%, and there is a huge risk of overflow. The zonal statistical analysis of the MFS of each section in the main pipeline is shown in Figure 10b. There are 56.74% of the manholes with water levels below the pipe tops during operation, which is 9.15% lower than that of the entire network.
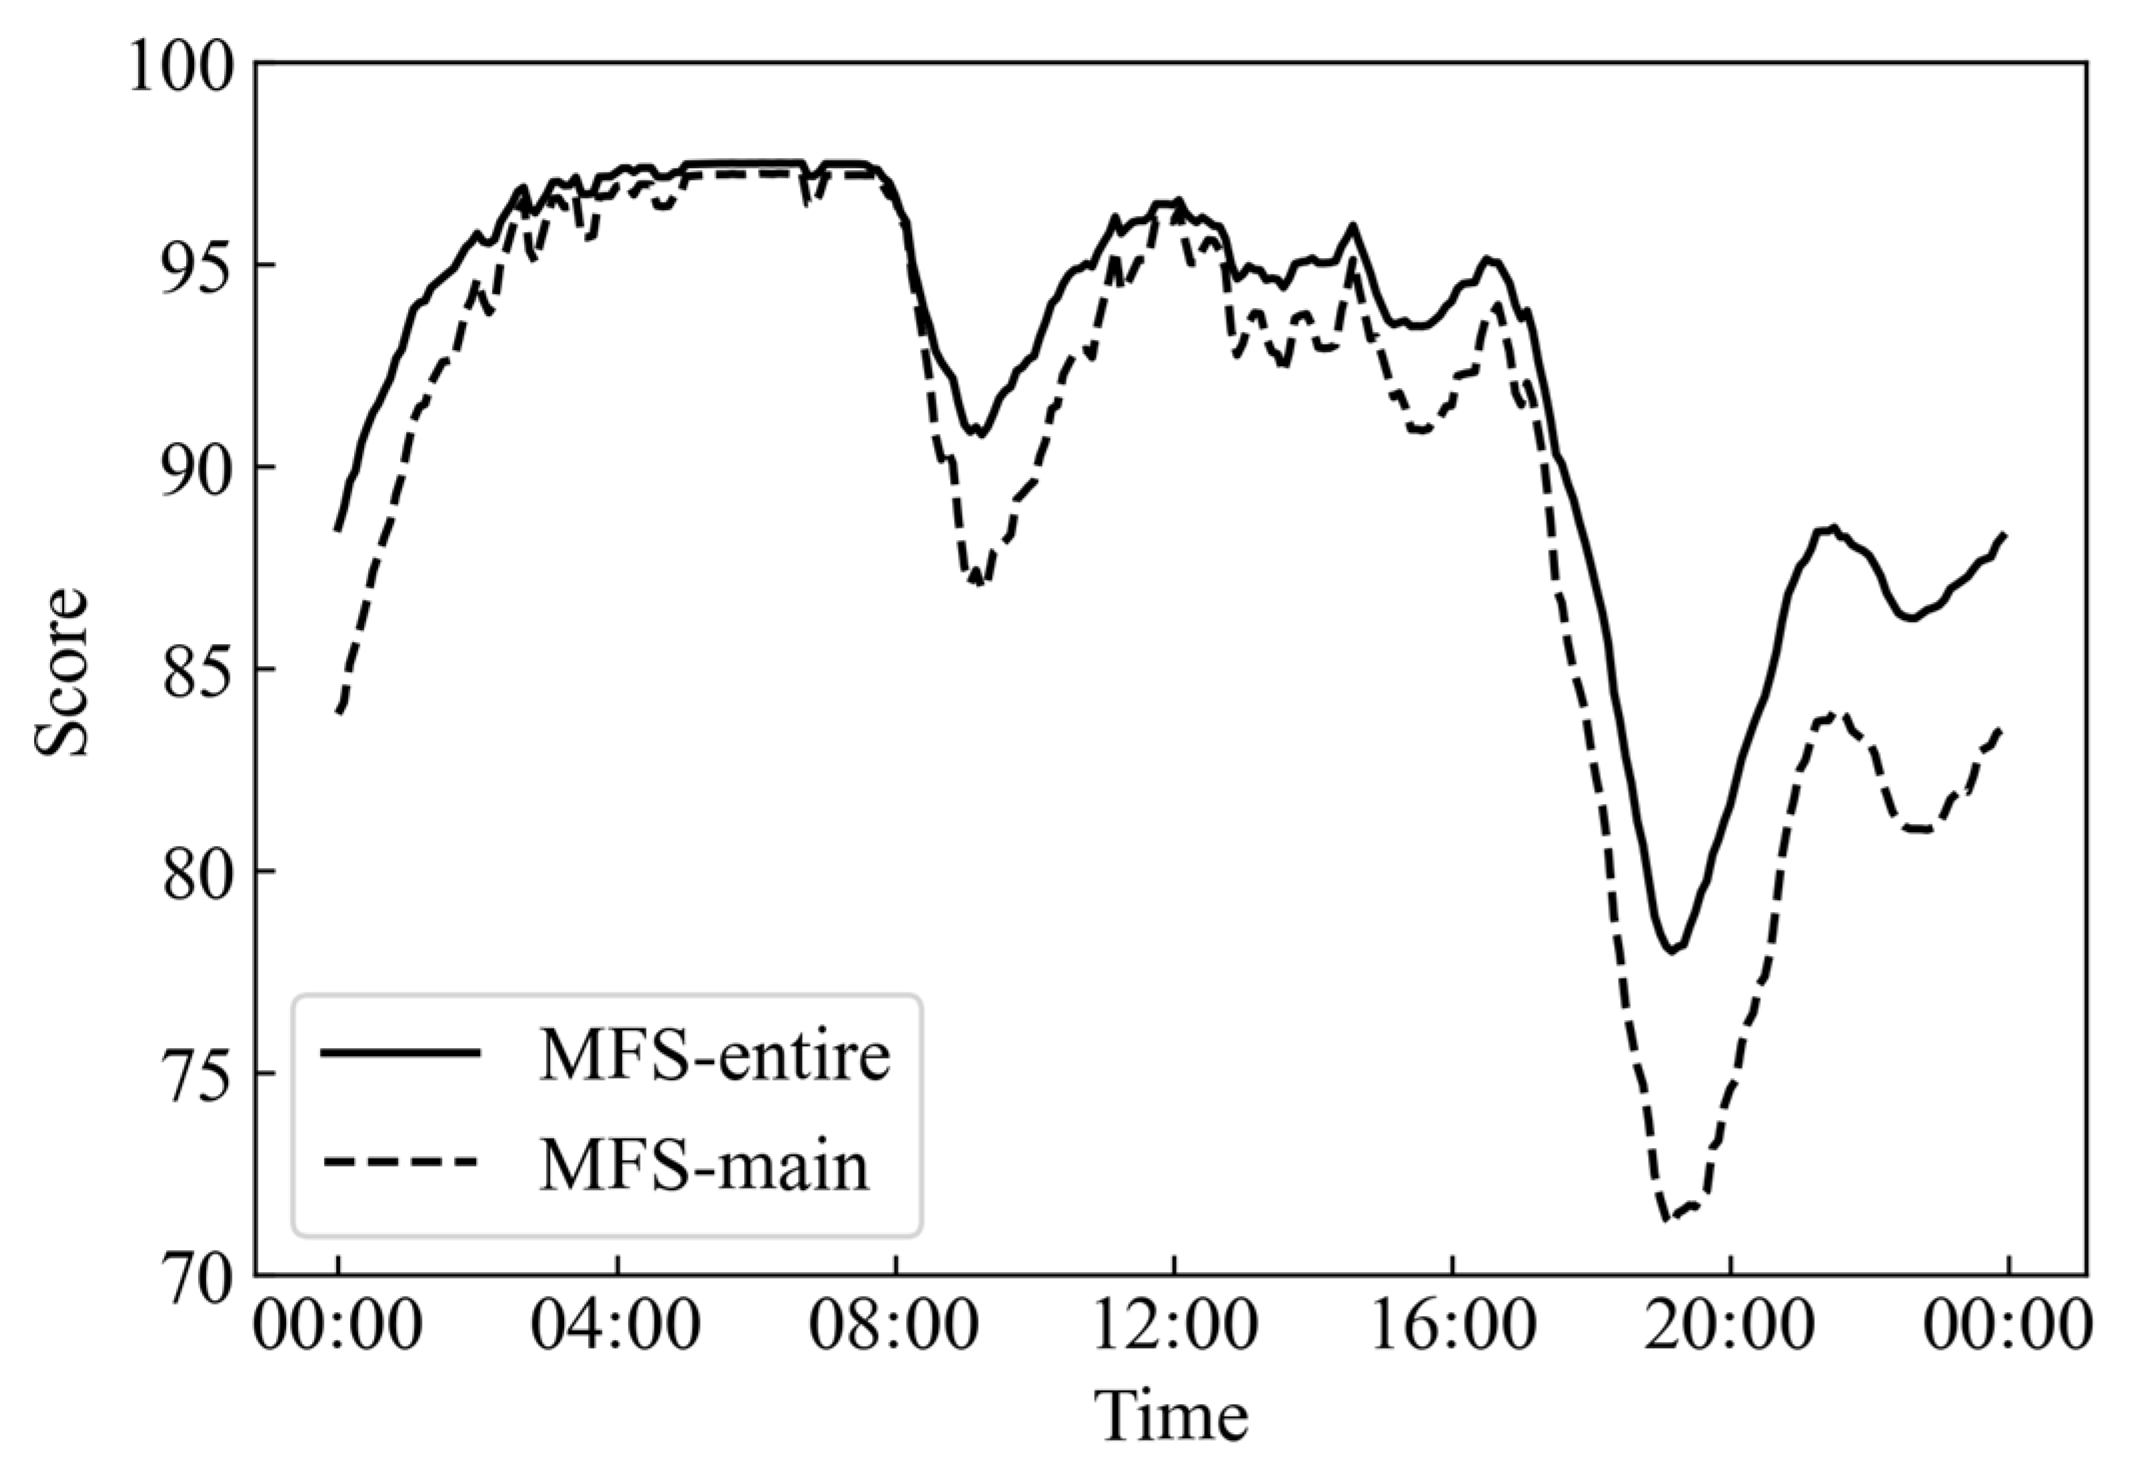
The MFS change curves of the entire network and the main pipeline throughout the day are shown in Figure 11. The trends in MFS over time are opposite to the inflow curves of the drainage households, with an overall slight lag as well. The MFS of the main pipeline is lower than those of the entire network, indicating that the overall fullness of the manholes on the main pipeline is higher than that of those on the branch pipes. The MFS range of the entire network throughout the day is from 78.0 to 97.5 points. Since the MFS is lower than 100, there are manholes in the pipe network with water levels higher than the pipe tops at every moment.
Evaluating overflow risk typically focuses on manholes with a relatively high fullness, as they are the most prone to overflow. In order to more accurately evaluate the overflow risk, we analyzed the MFS changes over time of the top 20% of manholes with the lowest instantaneous MFS, as shown in Figure 12. Compared with the MFS of all the manholes, the MFS of the 20% manholes can better reflect the overflow risk of the pipe network. Notably, during the peak drainage period, the MFS reached a minimum of 10.53 and 9.53 points, and at this time, the average fullness of the manholes exceeded 60%, signifying an extremely high risk of overflow.

3.4. Comprehensive Hydraulic Performance Evaluation and Pipeline Renovation Recommendations

The comprehensive hydraulic performance of the pipe network was evaluated based on the three aforementioned hydraulic performance indicators: flow velocity; pipe fullness; and manhole fullness. By weighing the three indicators with equal proportions and then calculating the weighted sum, the comprehensive score of the hydraulic performance of the pipe network was obtained. Whether calculated from the entire network or the main pipelines, the comprehensive score was 59.8 points, and the rating was “poor”, indicating that the pipe network could hardly meet the current drainage demand and urgently needed renovation and rehabilitation.
Based on the evaluation results, we selected pipeline sections with low FS, high VS, and low MFS of the connected manholes for renovation (Table 5). The VS of these sections was close to the full score, while the FS was relatively low, and the MFS of the connected manholes were also relatively low, indicating that their diameters were insufficient to meet the drainage demand. Field investigations confirmed the validity of our inference that the diameters of these pipeline sections were indeed smaller than those of the upstream and downstream sections. After enlarging the diameters to be the same as those of the adjacent sections, the hydraulic performance was evaluated again.
The comparison of the evaluation scores of the hydraulic performance of the pipe network before and after renovation is shown in Table 6. The VS decreased slightly, likely due to the reduced flow velocity caused by the increased pipe diameter. However, the FS increased slightly for both the entire network and the main pipeline. The entire network FS rose by 4.2 points, with the rating remaining “Good”, and the main pipeline FS increased by 7.4 points, improving its rating from “Medium +” to “Good”, indicating a significant reduction in the fullness of the main pipeline. The improvement in MFS was even more pronounced, with the entire network score rising by 29.9 points and the rating improving from “Poor” to “Medium +”; the main pipeline score increased by 41.1 points, an increase of 115%, with its rating rising from “Poor” to “Good”. This reflects a significant reduction in the risk of overflow in the manholes after the renovation.
The comprehensive hydraulic performance score of the entire network increased from 59.7 to 70.8, while the score for the main pipeline improved from 59.9 to 75.1 after the renovation. As a result, the ratings for both networks improved from “Poor” to “Medium +,” clearly demonstrating that the hydraulic performance of the sewage network has been significantly enhanced.

3.5. Indicator Correlation Analysis

The internal connections among indicators are important for measuring the scientificity and reliability of the constructed evaluation method. Therefore, it is necessary to analyze the correlation among pipe flow velocity, pipe fullness, and manhole fullness.
To begin with, the correlation between pipe flow velocity and pipe fullness will be discussed. Firstly, the evaluation objects of manhole fullness differ from those of pipe flow velocity and pipe fullness. Manhole fullness assesses the hydraulic performance of manholes during pipe network operation, while the latter two evaluate the hydraulic performance of pipelines. Secondly, the MFS starts to vary only once the pipeline reaches full flow, while at this time, the pipe flow velocity and VF change minimally, and the pipe fullness and FS remain stable. Consequently, manhole fullness has no notable correlation with flow velocity and pipe fullness.
Regarding the relationship between pipe flow velocity and pipe fullness, according to the principle of hydraulics, the flow velocity will first increase and then decrease as the pipe fullness increases. However, the constructed evaluation method here is immune to this correlation for two reasons. The first reason lies in the context of instantaneous score calculation. The instantaneous VF is computed based on the magnitude of the flow velocity. In other words, it is a continuous variable that changes with the flow velocity. On the contrary, the instantaneous FS follows a binary scoring pattern. It is simply assigned 100 or 0 points based on whether the design fullness is achieved, without any intermediate values or a proportional relationship to the flow velocity. As a result, there is no significant correlation between the two in terms of instantaneous scores. The second reason lies in the comprehensive scores of pipelines. Figure 13 shows the distribution relationship between the comprehensive VS and FS of each main pipeline, and it is found that there is no significant correlation between them. Therefore, there is also no significant correlation between the pipe flow velocity and pipe fullness.

3.6. Implications for Future Work in Sewage and Pipe Network

The method for evaluating the hydraulic performance of sewage pipe networks constructed in this research has multiple advantages for future sewage and pipe network management work. Firstly, it can accurately assess the hydraulic performance of a specific pipe network under specific water inflow conditions. This enables a comprehensive and in-depth understanding of the network’s operational status, allowing for the early prevention of problems like sewage overflow and waterlogging. Consequently, it effectively safeguards the urban environment quality and the well-being of residents. Secondly, by leveraging the score differences between pipelines and manholes, it can precisely diagnose the key factors restricting the hydraulic performance of the pipe network, thereby accurately identifying problems in the pipe network and locating the problem pipelines. Thirdly, when combined with model analysis, it can provide guidance for formulating pipe network renovation schemes. By evaluating the hydraulic performance of the pipe network under different renovation schemes, the renovation effects of each scheme can be clearly compared, and then, the optimal scheme can be selected, effectively solving problems while saving renovation costs. In addition, it also has significant guiding value for pipe network design. Based on the pipe flow velocity index, combined with the self-cleaning theory and critical shear force, the flow velocity and pipe diameter can be reasonably determined to ensure the drainage and self-cleaning functions; referring to the fullness index, the selection of pipe diameter can be optimized to ensure the water conveyance capacity; according to the manhole fullness index, the effectiveness of pipe network design can be verified, and the risk of overflow can be reduced.
However, this evaluation method also has certain limitations. Firstly, its application premise is the ability to obtain high temporal resolution hydraulic data during the operation of the pipe network, such as data on flow velocity and water level for pipelines and manholes. This means that for a pipe network to be evaluated, either an accurate pipe network model and relatively accurate water inflow data are required to obtain the necessary high-resolution data through simulation, or field high-resolution monitoring data of all pipelines must be available. This undoubtedly requires a large amount of exploration and monitoring work, which, to some extent, restricts the further popularization and application of this method. Nevertheless, with the advancement of the informatization process of sewage pipe networks, the usability of this method is expected to gradually improve. Secondly, only three indicators, specifically pipe flow velocity, pipe fullness, and manhole fullness, are adopted in this research. There may be other indicators that have a significant impact on hydraulic performance but have not been considered, and the scoring methods of these indicators need to be further tested and optimized. What is more, this method has only been applied to the pipe network in the research area, and its effectiveness in other regions has not been fully verified. More practical case applications are still needed to deeply explore the effectiveness of this evaluation method and promote its further optimization and upgrading.

4. Conclusions

This study explored an evaluation method that could more accurately reflect the hydraulic performance during the operation of sewage pipe networks. This method took pipe flow velocity, pipe fullness, and manhole fullness as evaluation indicators and formulated a reasonable scoring method by referring to the critical shear force theory and relevant design standards. Compared with the existing evaluation methods that focused on physical connectivity and integrity, it was the first to adopt evaluation indicators characterizing hydraulic conditions. It can not only more accurately reflect the actual hydraulic performance of the pipe network but also diagnose pipe network problems and guide the renovation of the pipe network.
The application of this method in the pipe network of City H proved its effectiveness. It could accurately evaluate the hydraulic performance of the pipe network and precisely diagnose pipe network problems such as low flow velocity, unreasonable pipe diameter, high overload risk, and overflow risk. Meanwhile, it could also effectively assess the improvement of the hydraulic performance of the renovated pipe network, including the improvement of flow velocity, fullness, and overflow risk, thereby verifying the effectiveness of the renovation scheme. Therefore, this method can provide scientific guidance for the renovation of the pipe network and is of great significance for improving the operation efficiency of the sewage pipe network. However, the general applicability and validity of the obtained hydraulic performance evaluation method should be tested in more case studies.
Future work can focus on the supplementation of hydraulic indicators and the optimization of the scoring method, with the expectation of more accurately reflecting the actual performance of the drainage pipe network and providing stronger support for the development of the industry. Meanwhile, the applicability of this method in other fields is also a research direction worthy of exploration.

Author Contributions

Conceptualization, Y.Z. and S.W.; methodology, P.L., D.G. and S.W.; validation, formal analysis, investigation, data curation, D.G.; resources, P.Z. and Y.Z.; writing—original draft preparation, P.L.; writing—review and editing, S.W. and Y.Z.; visualization, P.L.; supervision, P.Z. and S.W. All authors have read and agreed to the published version of the manuscript.

Funding

This research was supported by the National Key Research and Development Program of China (Grant No. 2021YFC3001405).

Data Availability Statement

The original contributions presented in the study are included in the article, further inquiries can be directed to the corresponding author.

Conflicts of Interest

Authors Peng Li, Yitao Zhang and Shaohua Wang were employed by the company Tianjin Municipal Engineering Design & Research Institute Co., Ltd., The remaining authors declare that the research was conducted in the absence of any commercial or financial relationships that could be construed as a potential conflict of interest.

References

  1. China City Statistical Yearbook 2022. Available online: https://www.mohurd.gov.cn/gongkai/fdzdgknr/sjfb/index.html (accessed on 26 September 2024).
  2. Chocat, B.; Ashley, R.; Marsalek, J.; Matos, M.R.; Rauch, W.; Schilling, W.; Urbonas, B. Toward the sustainable management of urban storm-water. Indoor Built Environ. 2007, 16, 273–285. [Google Scholar] [CrossRef]
  3. Larsen, T.A.; Gujer, W. The concept of sustainable urban water management. Water Sci. Technol. 1997, 35, 3–10. [Google Scholar] [CrossRef]
  4. Khan, Z.; Zayed, T.; Moselhi, O. Simulating impact of factors affecting sewer network operational condition. In Proceedings of the CSCE 2009 Annual General Conference, Montreal, QC, Canada, 27–30 May 2009; pp. 285–294. [Google Scholar]
  5. Zhou, Q. A review of sustainable urban drainage systems considering the climate change and urbanization impacts. Water 2014, 6, 976–992. [Google Scholar] [CrossRef]
  6. Wang, J.; Liu, G.; Wang, J.; Xu, X.; Shao, Y.; Zhang, Q.; Liu, Y.; Qi, L.; Wang, H. Current status, existent problems, and coping strategy of urban drainage pipeline network in China. Environ. Sci. Pollut. Res. Int. 2021, 28, 43035–43049. [Google Scholar] [CrossRef]
  7. Barbosa, A.; Fernandes, J.; David, L. Key issues for sustainable urban stormwater management. Water Res. 2012, 46, 6787–6798. [Google Scholar] [CrossRef]
  8. Fletcher, D.T.; Shuster, W.; Hunt, F.W.; Ashley, R.; Butler, D.; Arthur, S.; Trowsdale, S.; Barraud, S.; Semadeni-Davies, A.; Bertrand, J.-L.; et al. SUDS, LID, BMPs, WSUD and more–The evolution and application of terminology surrounding urban drainage. Urban Water J. 2015, 12, 525–542. [Google Scholar] [CrossRef]
  9. Moss, T. “Cold spots” of urban infrastructure: “Shrinking” processes in Eastern Germany and the modern infrastructural ideal. Int. J. Urban Reg. Res. 2008, 32, 436–451. [Google Scholar] [CrossRef]
  10. Notice of the Ministry of Housing and Urban-Rural Development and Other Four Departments on Strengthening the Construction and Operation & Maintenance of Urban Domestic Sewage Pipe Networks. Available online: https://www.gov.cn/zhengce/zhengceku/202403/content_6940086.htm (accessed on 26 September 2024).
  11. Chang, N.; Lu, J.; Chui, M.F.T.; Hartshorn, N. Global policy analysis of low impact development for stormwater management in urban regions. Land Use Policy 2018, 70, 368–383. [Google Scholar] [CrossRef]
  12. Ellis, J.; Deutsch, J.; Mouchel, J.; Scholes, L.; Revitt, M.D. Multicriteria decision approaches to support sustainable drainage options for the treatment of highway and urban runoff. Sci. Total Environ. 2004, 334, 251–260. [Google Scholar] [CrossRef]
  13. Hoang, L.; Fenner, R. System interactions of stormwater management using sustainable urban drainage systems and green infrastructure. Urban Water J. 2016, 13, 739–758. [Google Scholar] [CrossRef]
  14. Katharina, T.; Elodie, B.; Fanny, F.; Cherqui, F.; Nielsen, J.E.; Brüggemann, T.; Naismith, I.; Goerke, M.; López, J.S.; Rieckermann, J.; et al. European stakeholders’ visions and needs for stormwater in future urban drainage systems. Urban Water J. 2023, 20, 831–843. [Google Scholar]
  15. Bach, M.P.; Rauch, W.; Mikkelsen, S.P.; McCarthy, D.T.; Deletic, A. A critical review of integrated urban water modelling–Urban drainage and beyond. Environ. Model. Softw. 2014, 54, 88–107. [Google Scholar] [CrossRef]
  16. Einfalt, T.; Arnbjerg-Nielsen, K.; Golz, C.; Jensen, N.-E.; Quirmbach, M.; Vaes, G.; Vieux, B. Towards a roadmap for use of radar rainfall data in urban drainage. J. Hydrol. 2004, 299, 186–202. [Google Scholar] [CrossRef]
  17. Rauch, W.; Seggelke, K.; Brown, R.; Krebs, P. Integrated approaches in urban storm drainage: Where do we stand? Environ. Manag. 2005, 35, 396–409. [Google Scholar] [CrossRef]
  18. Dhakal, P.K.; Chevalier, R.L. Managing urban stormwater for urban sustainability: Barriers and policy solutions for green infrastructure application. J. Environ. Manag. 2017, 203, 171–181. [Google Scholar] [CrossRef]
  19. Berardi, L.; Giustolisi, O.; Savic, D.A.; Kapelan, Z. An effective multi-objective approach to prioritization of sewer pipe inspection. Water Sci. Technol. 2009, 60, 841–850. [Google Scholar] [CrossRef]
  20. Mu, H.; Xiong, J.; Hu, J. Assessment and rehabilitation plan for the health condition of sewage pipeline networks in a city in the Pearl River Delta. Munic. Eng. Technol. 2024, 42, 169–175. (in Chinese). [Google Scholar]
  21. Zhang, S.; Guo, Z.; Li, Y. Practice in the reconstruction and rehabilitation of sewage pipeline networks in Liaoyuan City. Water Supply Drain. 2023, 59, 141–147. [Google Scholar]
  22. Soroush, B.; Mojtaba, G.H.; Meysam, G.; Movahedinia, M.; Shahdany, S.M.H. A practical method for rehabilitation of stormwater collecting system by node flooding detection and regional hydraulic redesign: A case study of eastern Tehran metropolis. Water Sci. Technol. 2022, 86, 1759–1773. [Google Scholar]
  23. Martínez, C.; Sanchez, A.; Toloh, B.; Vojinovic, Z. Multi-objective evaluation of urban drainage networks using a 1D/2D flood inundation model. Water Resour. Manag. 2018, 32, 4329–4343. [Google Scholar] [CrossRef]
  24. Wang, J.; Xiong, Y.; Zhang, X.; Deng, Y. Evaluation of urban drainage pipeline network condition and operational efficiency based on the AHP-Fuzzy comprehensive evaluation method: A case study of Huaian District, Huaian City. J. Environ. Eng. Technol. 2022, 12, 1162–1169. (in Chinese). [Google Scholar] [CrossRef]
  25. Chen, X.; Zhao, S.; Zhao, D.; Sheng, Z.; Luo, R.; Lu, L.; Zhang, L. Introduction to urban drainage pipeline network simulation systems. China Water Wastewater 2015, 31, 104–108. (in Chinese). [Google Scholar] [CrossRef]
  26. Hou, J.; Dong, M.; Li, D.; Ma, Y.; Ju, G.; Zhang, S. Drainage performance of urban stormwater pipeline networks under extreme rainfall: A case study of Fengxi New City, Xi’an. J. Earth Sci. Environ. 2023, 45, 427–436. (in Chinese). [Google Scholar] [CrossRef]
  27. Jiang, T.; Xing, H. Research on the drainage pipeline network condition assessment system based on the analytic hierarchy process. Intell. City 2022, 8, 53–55. [Google Scholar]
  28. Huang, X.; Li, H.; Zhang, Y.; Yang, X.; Chen, S. Development and vulnerability assessment of an urban flooding vulnerability evaluation system for Xi’an City based on PSR and AHP methods. J. Nat. Disasters 2019, 28, 167–175. (In Chinese) [Google Scholar] [CrossRef]
  29. Khan, Z.; Zayed, T.; Moselhi, O. Structural condition assessment of sewer pipelines. J. Perform. Constr. Facil. 2010, 24, 170–179. [Google Scholar] [CrossRef]
  30. Ashley, R.; Hopkinson, P. Sewer systems and performance indicators—Into the 21st century. Urban Water 2002, 4, 123–135. [Google Scholar] [CrossRef]
  31. Wei, X.; Suo, X.; Cui, X. Discussion on the star rating management method for urban drainage pipeline network projects. Adv. Environ. Prot. 2024, 14, 1141–1148. [Google Scholar] [CrossRef]
  32. Yan, M.; Wang, H.; Liu, Z.; Palace, E.; Dai, X. Construction and research of an evaluation indicator system for the operational efficiency of urban drainage systems. J. Environ. Eng. 2023, 17, 3124–3136. (in Chinese). [Google Scholar] [CrossRef]
  33. Saaty, T.L. How to make a decision–The analytic hierarchy process. Eur. J. Oper. Res. 1990, 48, 9–26. [Google Scholar] [CrossRef]
  34. Ho, W.; Ma, X. The state-of-the-art integrations and applications of the analytic hierarchy process. Eur. J. Oper. Res. 2018, 267, 399–414. [Google Scholar] [CrossRef]
  35. Ghavami, S.M.; Borzooei, Z.; Maleki, J. An effective approach for assessing risk of failure in urban sewer pipelines using a combination of GIS and AHP-DEA. Process Saf. Environ. Prot. 2020, 133, 275–285. [Google Scholar] [CrossRef]
  36. Rani, H.A.; Syammaun, T.; Adamy, A.; Fadillah, A. The alternative of drainage construction technology selection by using analytical hierarchy process method. Elkawanie J. Islam. Sci. Technol. 2022, 7, 368–381. [Google Scholar] [CrossRef]
  37. Savitri, Y.R.; Kakimoto, R.; Begum, R.A.; Wardoyo, N.A.W.; Suryani, E. The application of AHP to determine the priority drainage system on flood mitigation in Surabaya, Indonesia. J. Disaster Res. 2022, 17, 431–443. [Google Scholar] [CrossRef]
  38. Wang, G.; Liu, L.; Shi, P.; Zhang, G.; Liu, J. Flood risk assessment of metro system using improved trapezoidal fuzzy AHP: A case study of Guangzhou. Remote Sens. 2021, 13, 5154. [Google Scholar] [CrossRef]
  39. Sepehri, M.; Malekinezhad, H.; Hosseini, Z.S.; Ildoromi, A. Assessment of flood hazard mapping in urban areas using entropy weighting method: A case study in Hamadan city, Iran. Acta Geophys. 2019, 67, 1435–1449. [Google Scholar] [CrossRef]
  40. Chae, M.J.; Abraham, D.M. Neuro-fuzzy approaches for sanitary sewer pipeline condition assessment. Water Sci. Technol. 2024, 41, 4–14. [Google Scholar] [CrossRef]
  41. Wei, L.; Wanli, C.; Mingji, C.; Hu, Q.; Song, Z. Operation safety risk assessment of water distribution networks based on the combined weighting method (CWM). KSCE J. Civ. Eng. 2023, 27, 2116–2130. [Google Scholar]
  42. Zhou, Y.; Dong, Y.; Sun, T. Evaluation of operational efficiency of urban sewage systems: A case study of a district in Shanghai. Urban Roads Bridges Flood Control 2024, 144, 18–19, 136–139. [Google Scholar]
  43. Zhang, W.; Zhang, X.; Liu, Y. Analysis and simulation of drainage capacity of urban pipe network. Res. J. Appl. Sci. Eng. Technol. 2013, 6, 387–392. [Google Scholar] [CrossRef]
  44. Bennis, S.; Bengassem, J.; Lamarre, P. Hydraulic performance index of a sewer network. J. Hydraul. Eng. 2003, 129, 504–510. [Google Scholar] [CrossRef]
  45. Mohammadi, M.M.; Najafi, M.; Kermanshachi, S.; Kaushal, V.; Serajiantehrani, R. Factors influencing the condition of sewer pipes: State-of-the-art review. J. Pipeline Syst. Eng. Pract. 2020, 11, 03120002. [Google Scholar] [CrossRef]
  46. Zhou, J.; Pang, Y.; Wang, H.; Du, W.; Zeng, P.; Yi, Z. Health assessment method for urban sewage pipelines integrating hydrodynamic simulation. J. Beijing Univ. Technol. 2024, 50, 1458–1467. [Google Scholar]
  47. Dong, L.; Zhao, D.; Liu, X.; Tang, L. Drainage pipeline network performance evaluation system based on monitoring and simulation technology. China Water Wastewater 2014, 30, 150–154. [Google Scholar] [CrossRef]
  48. Dong, N. Evaluation indicator system for smart municipal pipeline network operations. Surv. Spatial Geogr. Inf. 2024, 47, 1–4. [Google Scholar]
  49. Di, D.; Li, T.; Fang, H.; Xiao, L.; Du, X.; Sun, B.; Zhang, J.; Wang, N.; Li, B. A CFD-DEM investigation into hydraulic transport and retardation response characteristics of drainage pipeline siltation using intelligent model. Tunneling Undergr. Space Technol. 2024, 152, 105964. [Google Scholar] [CrossRef]
  50. Montes, C.; Bohorquez, J.; Borda, S.; Saldarriaga, J.G. Criteria of minimum shear stress vs. minimum velocity for self-cleaning sewer pipes design. Procedia Eng. 2017, 186, 69–75. [Google Scholar] [CrossRef]
  51. Ebtehaj, I.; Bonakdari, H.; Sharifi, A. Design criteria for sediment transport in sewers based on self-cleansing concept. J. Zhejiang Univ. Sci. A 2014, 15, 914–924. [Google Scholar] [CrossRef]
  52. May, R.W.; Ackers, J.C.; Butler, D.; John, S.C. Development of design methodology for self-cleansing sewers. Water Sci. Technol. 1996, 33, 195–205. [Google Scholar] [CrossRef]
  53. Montes, C.; Kapelan, Z.; Saldarriaga, J. Impact of self-cleansing criteria choice on the optimal design of sewer networks in South America. Water 2019, 11, 1148. [Google Scholar] [CrossRef]
  54. Safari, S.J.M.; Mohammadi, M.; Ghani, A.A. Experimental studies of self-cleansing drainage system design: A review. J. Pipeline Syst. Eng. Pract. 2018, 9, 04018017. [Google Scholar] [CrossRef]
  55. Vongvisessomjai, N.; Tingsanchali, T.; Babel, S.M. Non-deposition design criteria for sewers with part-full flow. Urban Water J. 2010, 7, 61–77. [Google Scholar] [CrossRef]
  56. Merritt, L.B.; Enfinger, K.L. Tractive force: A key to solids transport in gravity flow drainage pipes. Water Sci. Technol. 2019, 33, 349–358. [Google Scholar]
  57. Enfinger, K.L.; Mitchell, P.S. Scattergraph principles and practice: Evaluating self-cleansing in existing sewers using the tractive force method. Water Sci. Technol. 2012, 33, 4458–4467. [Google Scholar]
  58. Pina, R.; Ochoa-Rodriguez, S.; Simões, N.E.; Mijic, A.; Marquesm, A.S.; Maksimovi, C. Semi- vs. fully-distributed urban stormwater models: Model setup and comparison with two real case studies. Water 2016, 8, 58. [Google Scholar] [CrossRef]
  59. Yu, F.T.; Hong, H.Z.; Chang, W.L.; Di, N.T.; Bao, L.W.; Yan, H.L.; Zong, Q.Z.; Yan, P.L. Studies on the integration of geographic information system (GIS) and drainage pipe network model. Adv. Mater. Res. 2011, 1380, 317–319. [Google Scholar] [CrossRef]
  60. Garcia, S.G. A Real-Time Flood Forecasting and Simulation System Based on GIS and DEM: Analysis of Sensitivity to Scale Factors. Ph.D. Thesis, Universidad Politécnica de Valencia, Valencia, Spain, 2000. [Google Scholar]
  61. Takaijudin, H.; Zaaba, S.I. Performance of integrated urban drainage simulation model using XP-SWMM software. Water Sci. Technol. 2012, 65, 1–10. [Google Scholar]
  62. Campbell, W.C.; Sean, M.S. Simulating time-varying cave flow and water levels using the Storm Water Management Model. Eng. Geol. 2002, 65, 100–110. [Google Scholar]
  63. Temprano, J.; Arango, O.; Cagiao, J.; Suárez, J.; Tejero, I. Stormwater quality calibration by SWMM: A case study in Northern Spain. Water SA 2006, 32, 55–63. [Google Scholar] [CrossRef]
  64. Koudelak, P.; West, S. Sewerage network modelling in Latvia, use of InfoWorks CS and Storm Water Management Model 5 in Liepaja city. Water Environ. J. 2008, 22, 81–87. [Google Scholar] [CrossRef]
  65. Rubinato, M.; Shucksmith, J.; Saul, A.J.; Shepherd, W. Comparison between InfoWorks hydraulic results and a physical model of an urban drainage system. Water Sci. Technol. 2013, 68, 372–379. [Google Scholar] [CrossRef] [PubMed]
  66. Khodashenas, S.R.; Tajbakhsh, M. Management of urban drainage system using integrated MIKE SWMM and GIS. J. Water Resour. Hydraul. Eng. 2016, 5, 36–45. [Google Scholar] [CrossRef]
  67. Zhang, X.; Wang, K.; Wang, T. SWMM-based assessment of the improvement of hydrodynamic conditions of urban water system connectivity. Water Resour. Manag. 2021, 35, 4519–4534. [Google Scholar] [CrossRef]
  68. Hamouz, V.; Muthanna, T.M. Hydrological modelling of green and grey roofs in cold climate with the SWMM model. J. Environ. Manag. 2019, 249, 109350. [Google Scholar] [CrossRef] [PubMed]
  69. Wang, Z.; Chen, Y.; Zeng, Z.; Chen, X.; Li, X.; Jiang, X.; Lai, C. A tight coupling model for urban flood simulation based on SWMM and TELEMAC-2D and the uncertainty analysis. Sustain. Cities Soc. 2024, 114, 105794. [Google Scholar] [CrossRef]
  70. Kun, Z.; Chui, T.F.M.; Yang, Y. Simulating the hydrological performance of low impact development in shallow groundwater via a modified SWMM. J. Hydrol. 2018, 566, 313–331. [Google Scholar]
  71. Tanim, A.H.; Smith-Lewis, C.; Downey, A.R.; Imran, J.; Goharian, E. Bayes_Opt-SWMM: A Gaussian process-based Bayesian optimization tool for real-time flood modeling with SWMM. Environ. Model. Softw. 2024, 179, 106122. [Google Scholar] [CrossRef]
  72. Yang, Y.; Li, J.; Huang, Q.; Xia, J.; Li, J.; Liu, D.; Tan, Q. Performance assessment of sponge city infrastructure on stormwater outflows using isochrone and SWMM models. J. Hydrol. 2021, 597, 126151. [Google Scholar] [CrossRef]
  73. Sui, Z.; Li, Z. Simulation of urban rainstorm waterlogging and pipeline network drainage process based on SWMM. J. Phys. Conf. Ser. 2019, 1213, 52–61. [Google Scholar]
  74. Song, Y.; Tu, M.; Traver, R. Predicting Sedimentation in Urban Sewer Conduits. Water 2018, 10, 462. [Google Scholar] [CrossRef]
  75. Cong, Z.; Ning, L.; Kun, C.; Ren, F. Study on Drainage Mode and Anti-Clogging Performance of New Waterproofing and Drainage System in a Tunnel. Sci. Rep. 2023, 13, 5354. [Google Scholar]
  76. Tu, M.; Traver, R. Clogging Impacts on Distribution Pipe Delivery of Street Runoff to an Infiltration Bed. Water 2018, 10, 1045. [Google Scholar] [CrossRef]
  77. Jin, P.K.; Hao, X.Y.; Wang, B.B.; Guo, H. Characteristics of Water Quality Variation in Urban Sewage Pipeline Networks. Chin. J. Environ. Eng. 2015, 9, 1009–1014. [Google Scholar]
  78. Zan, F.; Tang, W.; Jiang, F.; Chen, G. Diversion of Food Waste into the Sulfate-Laden Sewer: Interaction and Electron Flow of Sulfidogenesis and Methanogenesis. Water Res. 2021, 202, 117437. [Google Scholar] [CrossRef]
  79. Gu, D.; Liu, Y.; Zhao, W.; Qiu, S.; Cui, N.; Hu, X.; Zhao, P. Status of Research on Greenhouse Gas Emissions from Wastewater Collection Systems. Water 2023, 15, 2512. [Google Scholar] [CrossRef]
  80. Sokáč, M.; Velísková, Y. Impact of Sediment Layer on Longitudinal Dispersion in Sewer Systems. Water 2021, 13, 3168. [Google Scholar] [CrossRef]
  81. Kitsikoudis, V.; Velísková, Y.; Erpicum, S.; Rubinato, M.; Shucksmith, J.D.; Archambeau, P.; Pirotton, M.; Dewals, B. Exchange between Drainage Systems and Surface Flows during Urban Flooding: Quasi-Steady and Dynamic Modelling in Unsteady Flow Conditions. J. Hydrol. 2021, 602, 126628. [Google Scholar] [CrossRef]
Figure 1. Flowchart of hydraulic performance evaluation.
Water 17 00159 g001
Figure 2. Scope of the study area and its pipe network distribution.
Water 17 00159 g002
Figure 3. Comparison of measured and simulated flow rate at the monitoring locations.
Water 17 00159 g003
Figure 4. The number of pipeline sections and their cumulative percentage in different flow velocity score (VS) zones for entire network.
Water 17 00159 g004
Figure 5. The VS changes in the entire network over time.
Water 17 00159 g005
Figure 6. The number of pipeline sections and their cumulative percentage in different VS zones for main pipeline.
Water 17 00159 g006
Figure 7. The VS changes in the entire network and main pipeline over time.
Water 17 00159 g007
Figure 8. Number of pipeline sections and cumulative percentage in different FS zones for main pipeline.
Water 17 00159 g008
Figure 9. The FS changes in the entire network and main pipeline over time.
Water 17 00159 g009
Figure 10. Number of pipeline sections and cumulative percentage in different manhole fullness scores (MFS) zones for the entire network (a) and the main pipeline (b).
Water 17 00159 g010
Figure 11. The MFS changes in the entire network and main pipeline over time.
Water 17 00159 g011
Figure 12. The changes over time in the MFS of the top 20% of manholes with the lowest instantaneous MFS in the entire network and the main pipeline.
Water 17 00159 g012
Figure 13. The distribution relationship between comprehensive FS and VS of the main pipelines.
Water 17 00159 g013
Table 1. Critical flow velocity (Vsc) for different sewer diameters at maximum fullness (0.75).
Diameter (mm)Vsc (m/s)
d50 (mm)1010.1
τ c (lb/ft2)0.03430.01810.0096
1000.56 0.40 0.29
2000.62 0.45 0.33
3000.67 0.49 0.35
4000.70 0.51 0.37
5000.73 0.53 0.38
6000.75 0.54 0.40
7000.77 0.56 0.41
8000.79 0.57 0.42
9000.80 0.58 0.42
10000.82 0.59 0.43
11000.83 0.60 0.44
12000.84 0.61 0.44
Table 2. Maximum fullness of different pipe diameters.
Diameter (mm)Maximum Design Fullness
200~3000.55
350~4500.65
500~9000.70
≥10000.75
Table 3. Graduated table of pipe network comprehensive score (PNCS) for the hydraulic performance.
GradeExcellentGoodMedium +Medium −Poor
PNCS range90–10080–9070–8060–700–60
Table 4. Length of each pipe diameter and its percentage in the pipe network.
Diameter (mm)200300400500600800100012001500Total
Length (m)50251776864452364041901799244413226,910
Percentage0.2%9.4%28.6%16.5%13.5%15.6%6.7%9.1%0.5%100%
Table 5. Pipeline sections selected for renovation.
SectionsVSFSUp MFS 1Down MFS 2D0 3 (mm)D1 4 (mm)
WS1671009578.376.8600800
WS1701008469.678.3600800
WS1711005360.869.6600800
WS1721004353.760.8600800
WS1751004349.453.7600800
WS1781004648.349.4600800
WS1791004538.148.3600800
WS1801004237.738.1600800
WS181100629.737.7600800
WS183100028.829.7600800
WS162100130.628.8600800
WS3271005027.631.78001200
WS3321004531.729.08001200
WS3331002329.026.88001200
WS3351004926.834.38001200
WS3361008034.333.08001200
WS3371004933.028.28001200
WS338100628.230.98001200
WS3391002930.956.58001200
WS3171006656.572.78001200
Notes: 1 MFS of manhole connected upstream. 2 MFS of manhole connected downstream. 3 Original pipe diameter. 4 Renovated pipe diameter.
Table 6. Scores of the hydraulic performance of the pipe network before and after renovation.
IndicatorsBeforeAfter
Entire NetworkMain PipelineEntire NetworkMain Pipeline
ScoreGradeScoreGradeScoreGradeScoreGrade
Velocity51.6Poor69.3Medium −51.2Poor67.0Medium −
Pipe fullness80.0Good74.4Medium +84.2Good81.8Good
Manhole fullness47.7Medium35.8Medium77.8Medium +76.9Medium +
Total59.8Poor59.8Poor70.8Medium +75.1Medium +
Disclaimer/Publisher’s Note: The statements, opinions and data contained in all publications are solely those of the individual author(s) and contributor(s) and not of MDPI and/or the editor(s). MDPI and/or the editor(s) disclaim responsibility for any injury to people or property resulting from any ideas, methods, instructions or products referred to in the content.