Driving Factors of Spatial–Temporal Differences in Agricultural Energy Consumption Evolution in the Yellow River Basin: A Perspective of Water–Energy–Food–Land–Population Nexus
Abstract
1. Introduction
2. Literature Review
3. Model and Data
3.1. Kaya Equation
3.2. Temporal Difference Decomposition Model
3.3. Spatial Difference Decomposition Model of Agricultural Energy Consumption
3.4. Data Source
- (1)
- Agricultural GDP (primary sector value added). In 2000, the agricultural GDP was adjusted according to the constant price to eliminate the effect of price factors.
- (2)
- Actual irrigated area. Data on the actual irrigated area have been missing for some years. So, this paper divides the irrigated water consumption of farmland by the actual average irrigation water consumption per acre to obtain the actual irrigated area.
- (3)
- Cropland area. The cultivated land area has not been updated since the third land census in 2018. Therefore, this paper uses exponential smoothing to fill in the missing data. We calculate the average change rate of the two periods: 2016–2017 and 2017–2018. Then, this paper takes 2018 as the basic period and multiplies the 2018 data by the average change rate to calculate the cultivated land area in 2019–2021.
- (4)
- Agricultural energy consumption. The total energy consumption of agriculture, forestry, livestock, and fisheries is summarized by multiplying the amount of energy of different types by the corresponding conversion coefficient to standard coal.
4. Results
4.1. Trend Analysis of the Evolution of Agricultural Energy Use
4.1.1. Overall Trend of Agricultural Energy Use in the Yellow River Basin
4.1.2. Trend of Agricultural Energy Use in the Yellow River Basin at the Provincial Scale
4.2. Decomposition of the Temporal Difference
4.2.1. Overall Decomposition Results of the Yellow River Basin
4.2.2. Decomposition Results of the Yellow River Basin at the Provincial Scale
4.3. Decomposition of the Spatial Difference
5. Conclusions and Policy Implications
5.1. Conclusions
- (1)
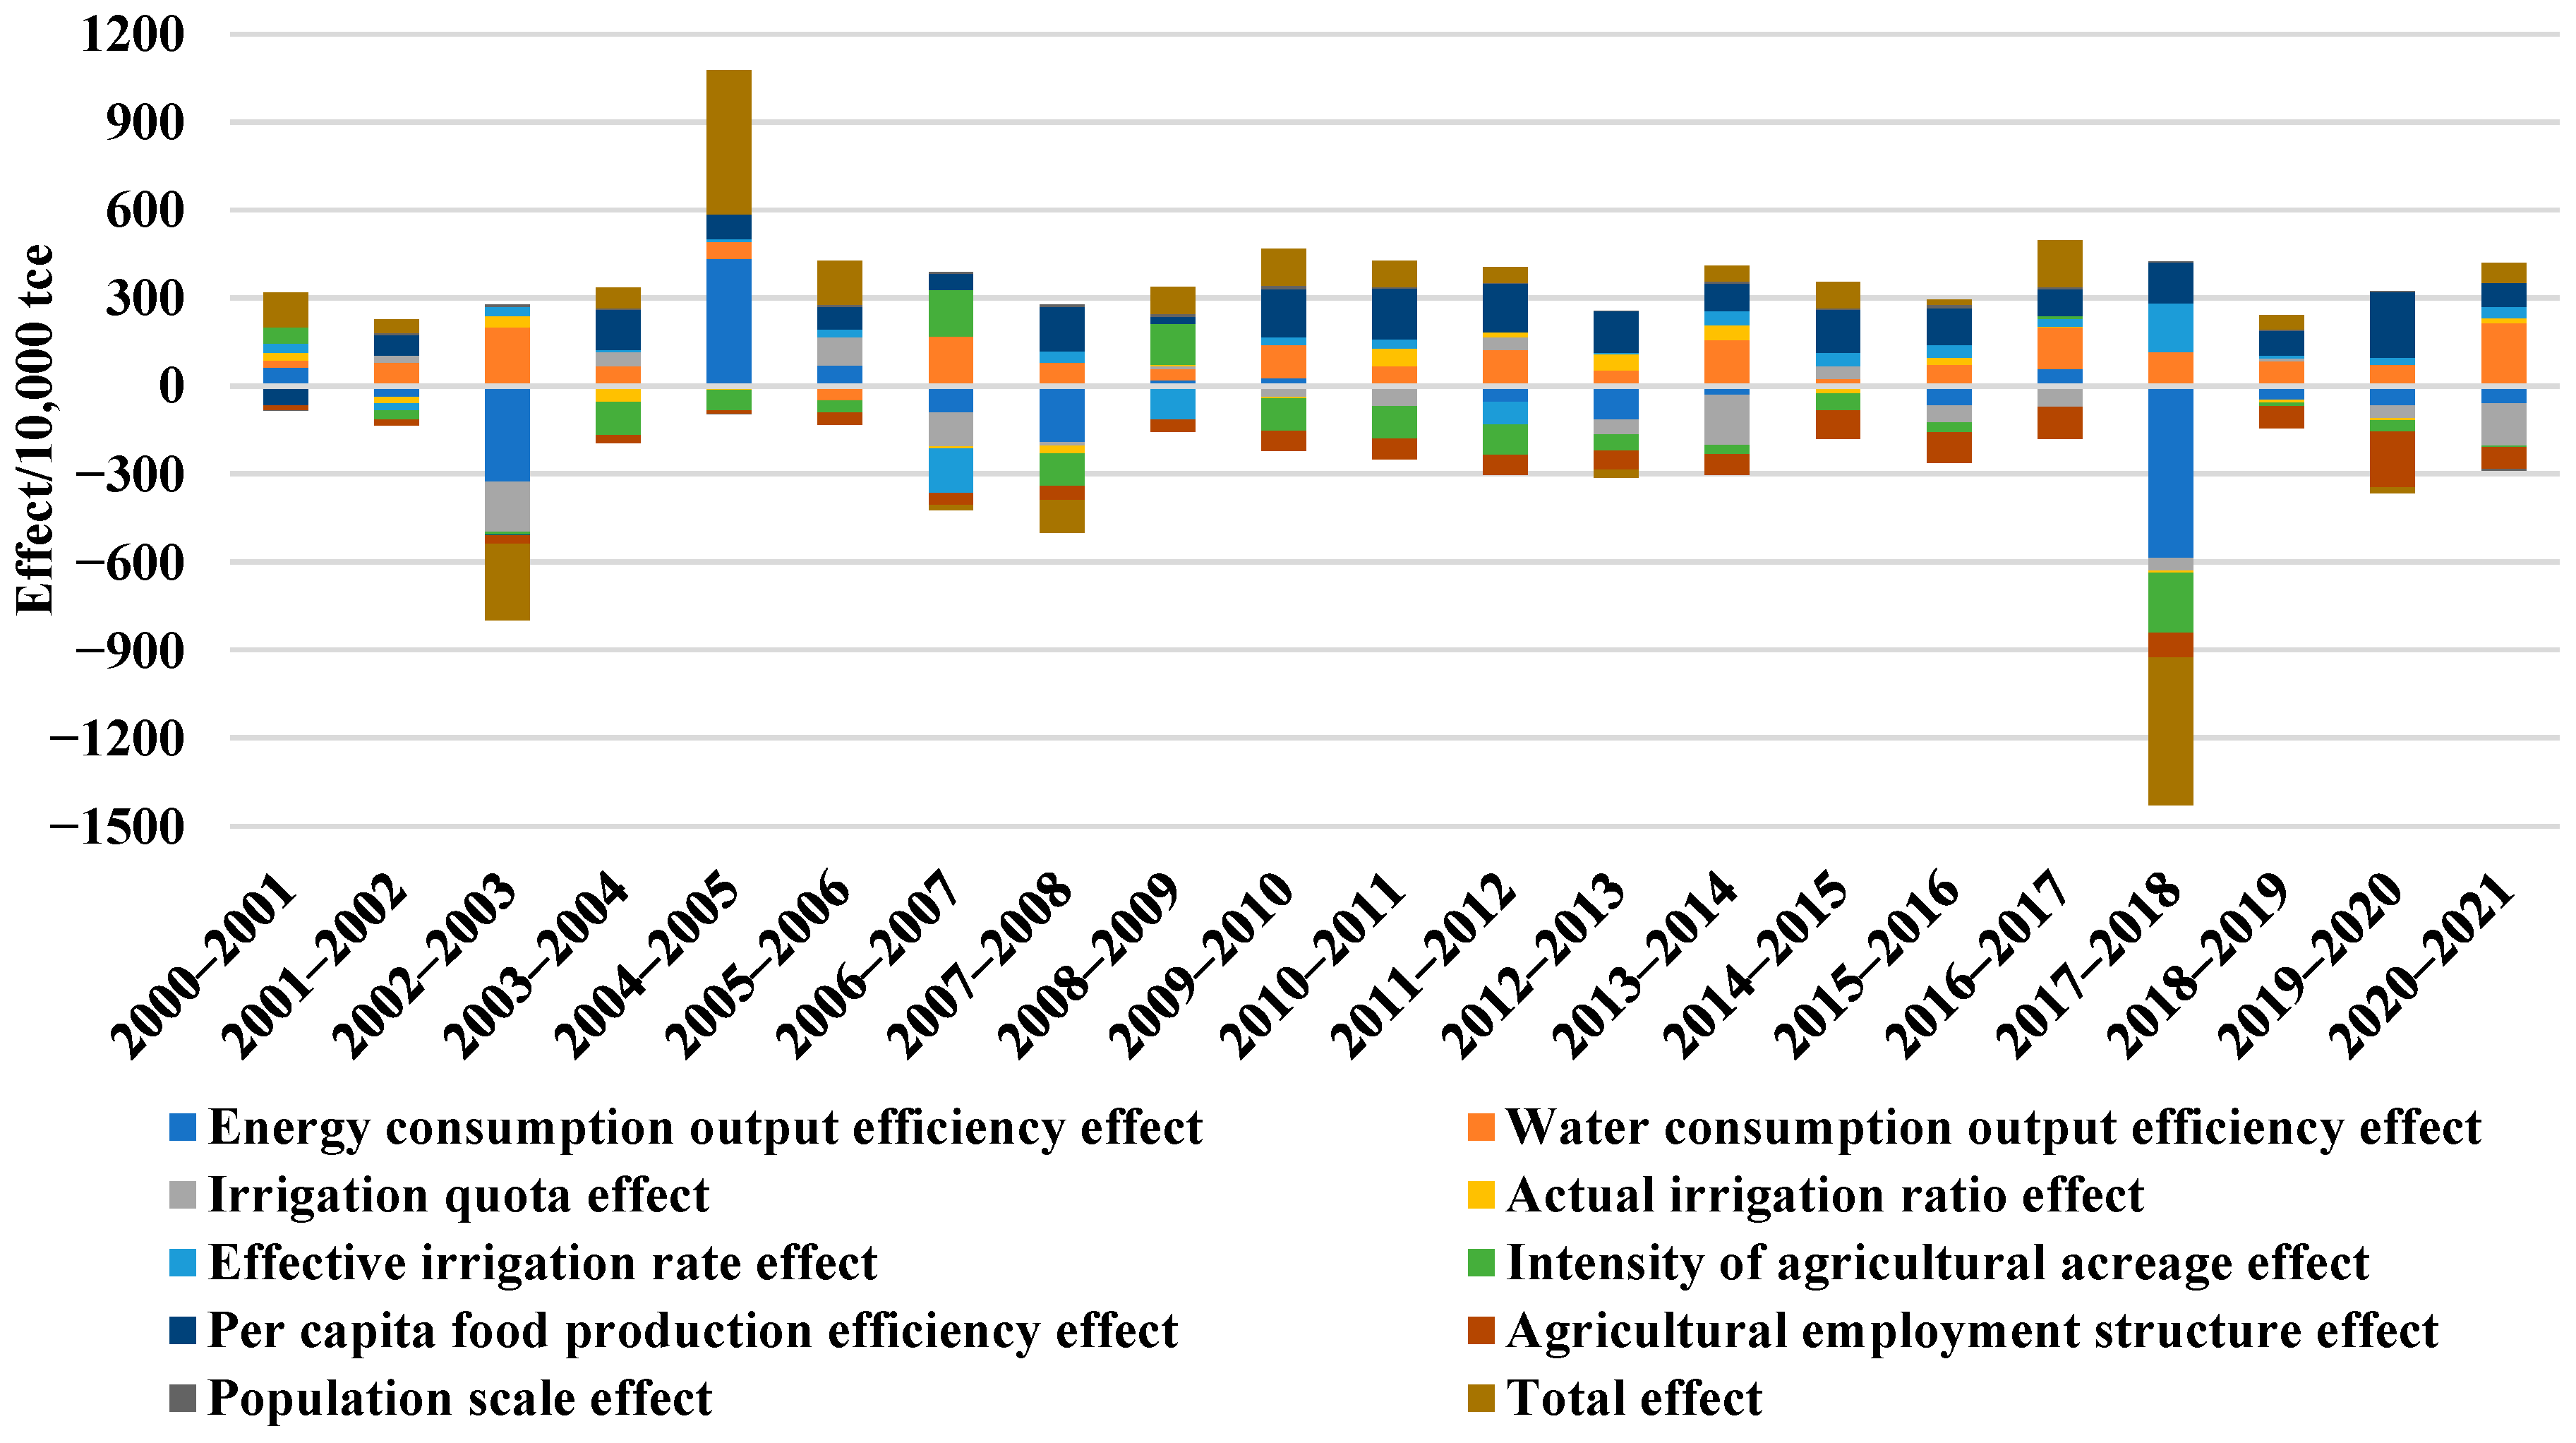
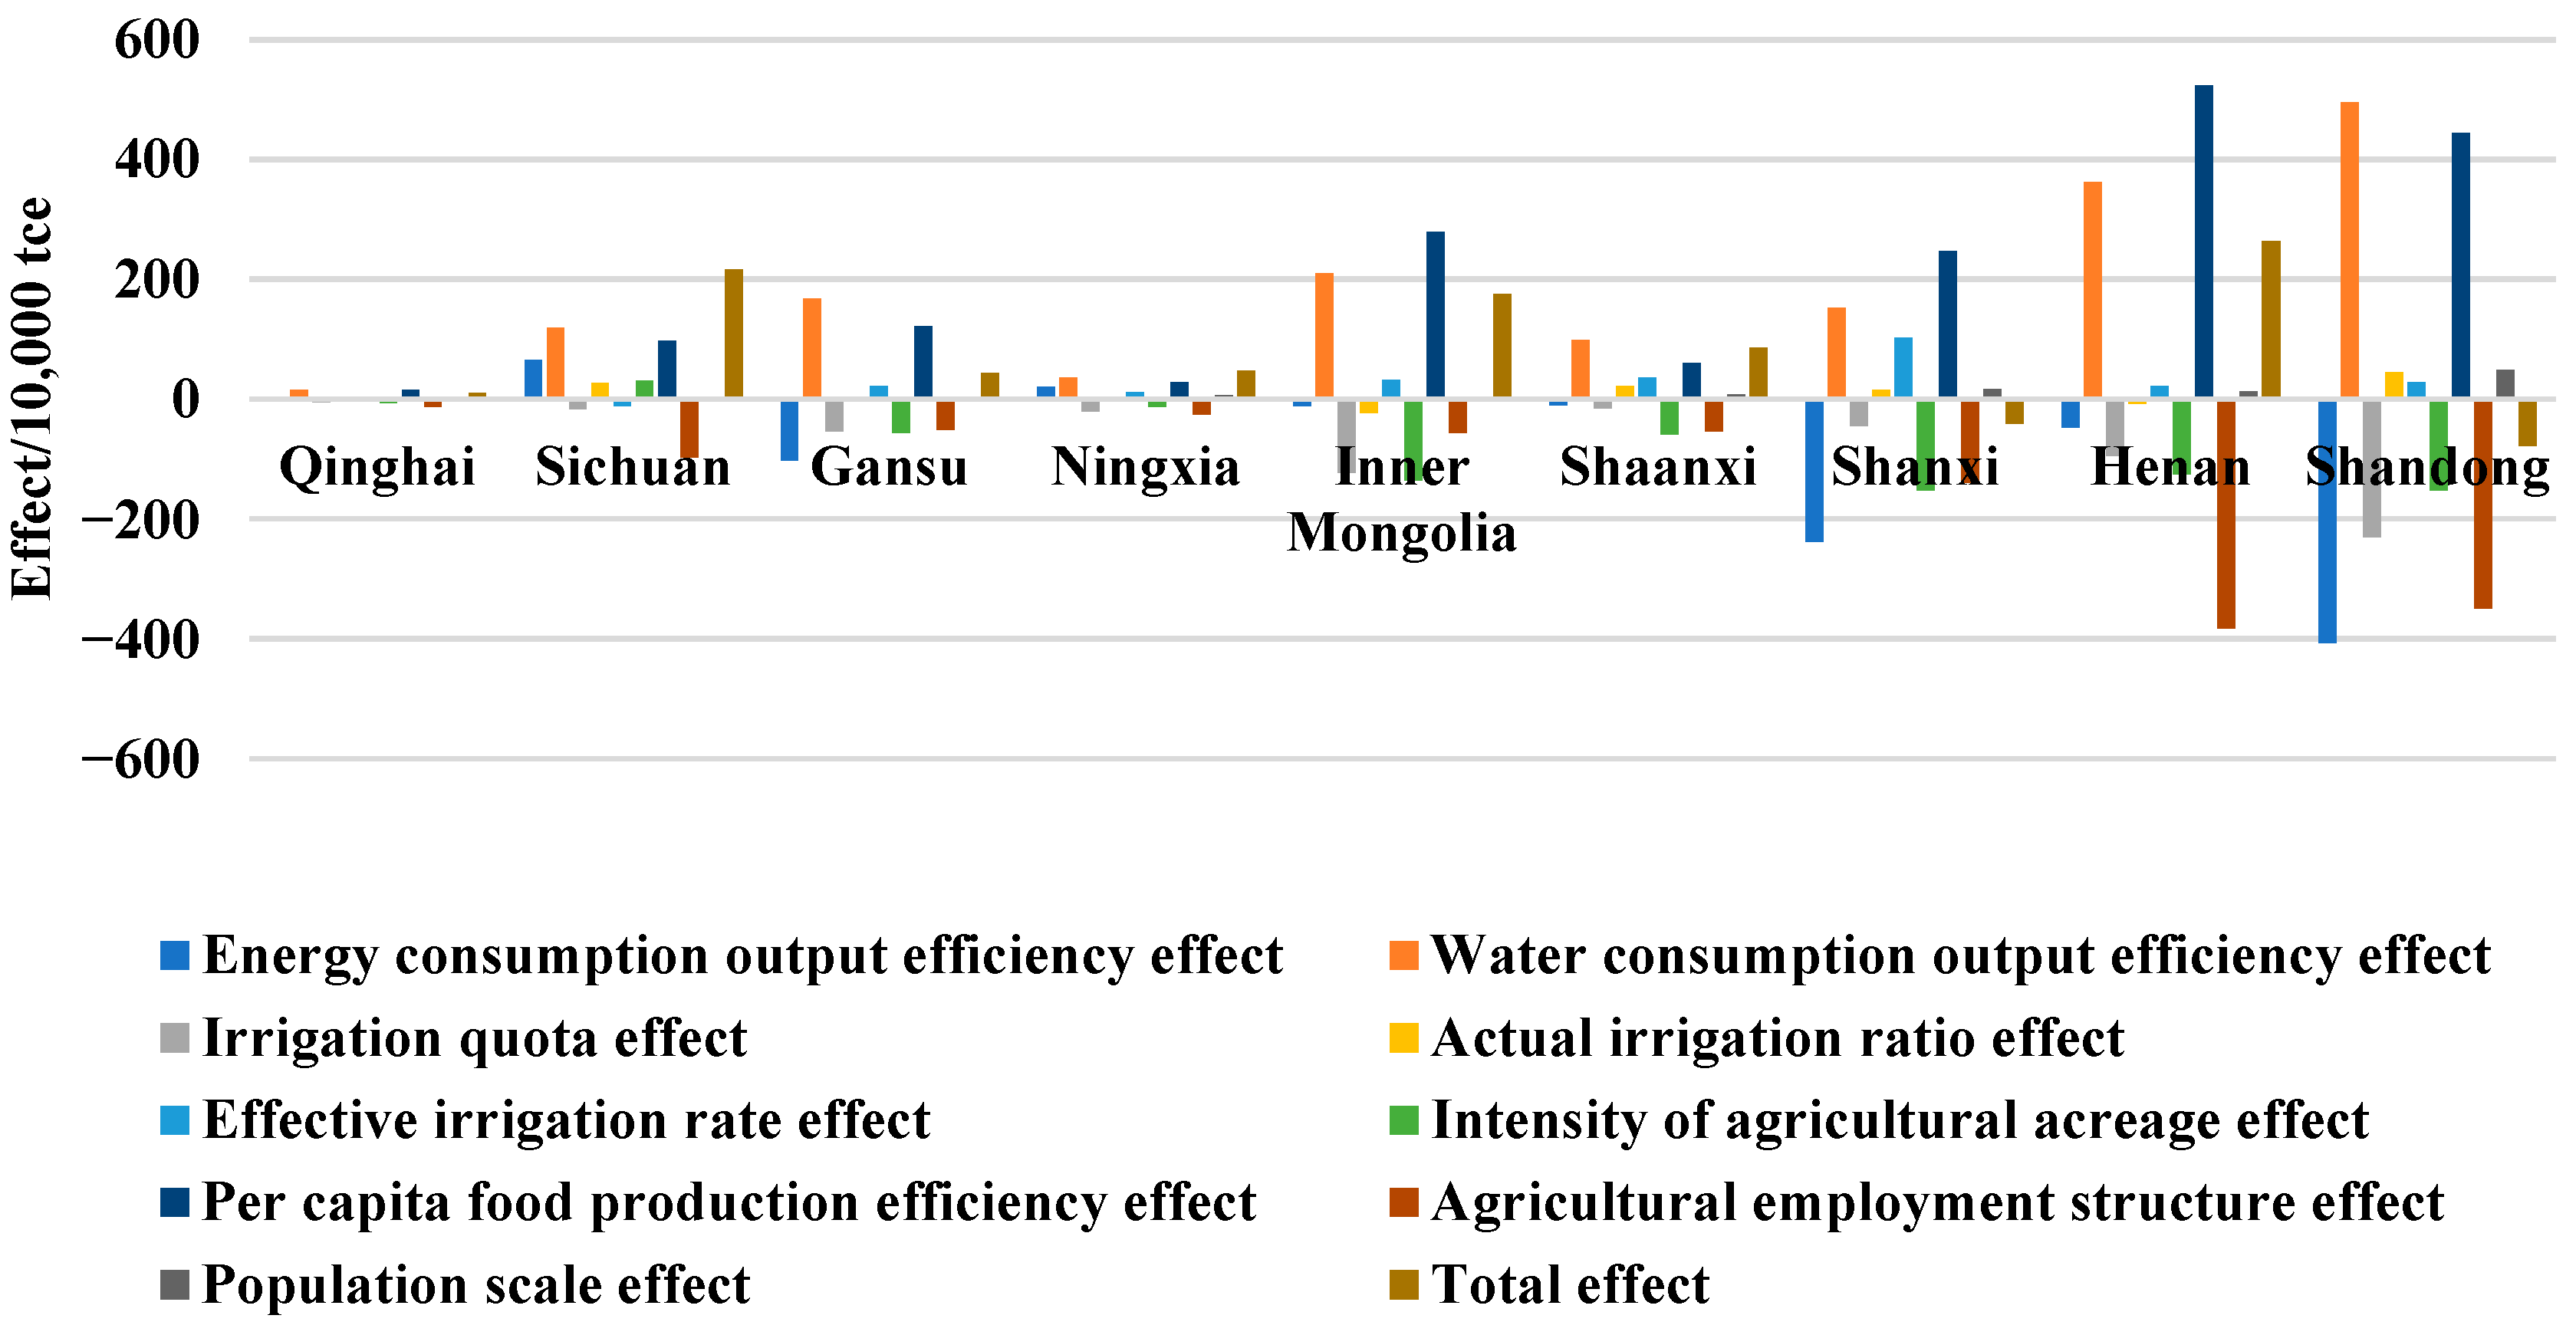
- The per capita food production efficiency effect is the main factor driving the increase in agricultural energy consumption in the YRB, followed by the water consumption output efficiency effect, the effective irrigation rate effect, the actual irrigation ratio effect, and the population scale effect. The biggest driving factor for the decrease in agricultural energy consumption in the YRB is the agricultural employment structure effect, followed by the energy consumption output efficiency effect, the intensity of agricultural acreage effect and the irrigation quota effect.
- (2)
- The individual drivers are heterogeneous across regions. The largest positive driver of Qinghai, Sichuan, Gansu, Ningxia, Shaanxi, and Shandong is the water consumption output efficiency effect, and that in other regions is the per capita food production efficiency effect. The largest negative driver of Gansu, Shanxi, and Shandong is the energy consumption output efficiency effect. The largest negative driver in Inner Mongolia and Shaanxi is the intensity of agricultural acreage effect, and that in other provinces (autonomous regions) is the agricultural employment structure effect.
- (3)
- As for Qinghai, which has the smallest agricultural energy consumption, the population scale effect maximizes the gap between other provinces and Qinghai, and the intensity of the agricultural acreage effect minimizes the gap between other provinces and Qinghai. As for Shandong, which has the largest agricultural energy consumption, the population scale effect minimizes the gap between other provinces and Shandong, and the energy consumption output efficiency effect maximizes the gap between the provinces and Shandong.
5.2. Recommendations
- (1)
- The driving effects of various factors on agricultural energy consumption manifest as both incremental and decremental. In practice, the decremental effects should be further enhanced while the incremental effects curbed. Given the heterogeneous contribution of different driving effects across regions, targeted energy conservation measures are required based on provincial realities: for example, upstream provinces with high animal husbandry proportions may prioritize promoting straw recycling technology and photovoltaic pastoral facilities to address high energy consumption and waste emissions in traditional livestock farming; downstream major grain-producing provinces should focus on subsidizing high-efficiency energy-saving agricultural machinery and optimizing planting structures to reduce mechanical energy consumption and agricultural input-related energy use in large-scale farming; provinces with fragile ecosystems and low agricultural productivity ought to prioritize subsidies for agricultural water-saving technologies and small-scale machinery renewal policies to balance grain production and energy conservation. Such region-specific strategies, aligned with provincial agricultural characteristics, emission intensities, and resource endowments, can improve the targeting and effectiveness of energy conservation policies.
- (2)
- For several provinces (autonomous regions) that are in the main grain-producing areas, such as Henan, Shandong, Sichuan, and Inner Mongolia, to safeguard grain production, traditional energy sources, such as coal and diesel, should continue to be the main source of agricultural production for the time being. However, wind, water, electricity, and bio-energy development can be accelerated and increased simultaneously. Under the conditions and cost-controllable circumstances, the degree of mechanization, intelligence and informatization should be improved to carry out large-scale agricultural planting activities to improve the efficiency of energy use.
- (3)
- For several provinces (autonomous regions) that are not in major food-producing areas, especially those with low total agricultural energy consumption, a small agricultural workforce, and no large-scale arable land, the route of energy export can be taken. Excess wind and water energy will be developed and delivered to other large agricultural production provinces in need, as shown in the text of the Qinghai Action Program for Building a National Clean Energy Industry Highland (2021–2030).
- (4)
- For other provinces such as Shaanxi and Shanxi, it is recommended that traditional energy sources such as coal and diesel are still used for agricultural production. The agricultural population is encouraged to recycle straw, utilize livestock and poultry waste resources, and promote energy-saving and environmentally friendly agricultural machinery, greenhouses, and other agricultural production tools. Local governments and village committees are carrying out activities to improve the rural environment, transforming from a traditional closed small-farm economy into a new green tourism countryside, and developing a new model that combines the small-farm economy with tourism.
Author Contributions
Funding
Data Availability Statement
Conflicts of Interest
References
- Liu, P.K.; Zhao, R.Q.; Han, X. Assessing the influence of energy transition on economic-social growth: The case of China. Environ. Sci. Pollut. Res. 2023, 1–25. [Google Scholar] [CrossRef] [PubMed]
- Lei, H.F.; Xu, W. How does the transformation of the energy structure impact the coordinated development of economy and environment? Environ. Sci. Pollut. Res. 2023, 30, 112368–112384. [Google Scholar] [CrossRef]
- Zhang, C.J.; Wei, Y.Q.; Zhao, X.Y.; Hu, J.R. Assessment and enhancement pathways of the water-energy-food-economy-ecosystem nexus in China’s yellow river basin. Energy 2025, 316, 134492. [Google Scholar] [CrossRef]
- Liu, S.J.; Zhao, L.S. Development and synergetic evolution of the water-energy-food nexus system in the Yellow River Basin. Environ. Sci. Pollut. Res. 2022, 29, 65549–65564. [Google Scholar] [CrossRef]
- Yu, Y.; Zhang, C.J.; Zhu, W.W.; Park, S.; Shi, Q.F. Identifying the driving factors of water consumption from water-energy-food nexus in the Yangtze River Delta region, China. Environ. Sci. Pollut. Res. 2021, 28, 48638–48655. [Google Scholar] [CrossRef]
- Lv, Y.X.; Li, Y.; Zhang, Z.X.; Luo, S.M.; Feng, X.; Chen, X.D. Spatio-temporal evolution pattern and obstacle factors of water-energy-food nexus coupling coordination in the Yangtze river economic belt. J. Clean. Prod. 2024, 444, 141229. [Google Scholar] [CrossRef]
- Ringler, C.; Bhaduri, A.; Lawford, R. The nexus across water, energy, land and food (WELF): Potential for improved resource use efficiency? Curr. Opin. Environ. Sustain. 2013, 5, 617–624. [Google Scholar] [CrossRef]
- Zhai, N.N.; Mao, C.L.; Feng, Y.Z.; Zhang, T.; Xing, Z.J.; Wang, Y.H.; Zou, S.Z.; Yin, D.X.; Han, X.H.; Ren, G.X.; et al. Current Status and Future Potential of Energy Derived from Chinese Agricultural Land: A Review. Biomed Res. Int. 2015, 2015, 824965. [Google Scholar] [CrossRef]
- Sargentis, G.-F.; Siamparina, P.; Sakki, G.-K.; Efstratiadis, A.; Chiotinis, M.; Koutsoyiannis, D. Agricultural Land or Photovoltaic Parks? The Water–Energy–Food Nexus and Land Development Perspectives in the Thessaly Plain, Greece. Sustainability 2021, 13, 8935. [Google Scholar] [CrossRef]
- Wang, W.W.; Liu, X.; Zhang, M.; Song, X.F. Using a new generalized LMDI (logarithmic mean Divisia index) method to analyze China’s energy consumption. Energy 2014, 67, 617–622. [Google Scholar] [CrossRef]
- Zhou, Q.; Fu, C.; Ni, H.; Gong, L. What are the main factors that influence China’s energy intensity?—Based on aggregate and firm-level data. Energy Rep. 2021, 7, 2737–2750. [Google Scholar] [CrossRef]
- Guo, X.J.; Zhang, Z.L.; Zhao, R.; Wang, G.K.; Xi, J. Association between coal consumption and urbanization in a coal-based region: A multivariate path analysis. Environ. Sci. Pollut. Res. 2018, 25, 533–540. [Google Scholar] [CrossRef]
- Shi, S.A.; Xia, L.; Meng, M. Energy Efficiency and Its Driving Factors in China’s Three Economic Regions. Sustainability 2017, 9, 2059. [Google Scholar] [CrossRef]
- Lin, B.Q.; Raza, M.Y. Coal and economic development in Pakistan: A necessity of energy source. Energy 2020, 207, 118244. [Google Scholar] [CrossRef]
- Wang, Q.; Zhang, F.Y.; Li, R.R.; Li, L.J. Forecasting China’s energy demand post-COVID-19 pandemic: Insights from energy type differences and regional differences. Energy Strategy Rev. 2022, 42, 100881. [Google Scholar] [CrossRef]
- Huang, H.; Hong, J.K.; Wang, X.Z.; Chang-Richards, A.; Zhang, J.X.; Qiao, B. A spatiotemporal analysis of the driving forces behind the energy interactions of the Chinese economy: Evidence from static and dynamic perspectives. Energy 2022, 239, 122104. [Google Scholar] [CrossRef]
- Ang, B.W.; Zhang, F.Q.; Choi, K.-H. Factorizing changes in energy and environmental indicators through decomposition. Energy 1998, 23, 489–495. [Google Scholar] [CrossRef]
- Liu, X.; Zhou, D.Q.; Zhou, P.; Wang, Q.W. Factors driving energy consumption in China: A joint decomposition approach. J. Clean. Prod. 2018, 172, 724–734. [Google Scholar] [CrossRef]
- Zhang, M.; Bai, C.Y. Exploring the influencing factors and decoupling state of residential energy consumption in Shandong. J. Clean. Prod. 2018, 194, 253–262. [Google Scholar] [CrossRef]
- Zhang, C.; Wang, Y.; Xu, J.; Shi, C. What factors drive the temporal-spatial differences of electricity consumption in the Yangtze River Delta region of China. Environ. Impact Assess. Rev. 2023, 103, 107247. [Google Scholar] [CrossRef]
- Bu, Y.; Wang, E.D.; Bai, J.H.; Shi, Q.B. Spatial pattern and driving factors for interprovincial natural gas consumption in China: Based on SNA and LMDI. J. Clean. Prod. 2020, 263, 121392. [Google Scholar] [CrossRef]
- Hu, J.; Chi, L.; Xing, L.; Meng, H.; Zhu, M.; Zhang, J.; Wu, J. Decomposing the decoupling relationship between energy consumption and economic growth in China’s agricultural sector. Sci. Total Environ. 2023, 873, 162323. [Google Scholar] [CrossRef]
- Wu, S.; Ding, S. Efficiency improvement, structural change, and energy intensity reduction: Evidence from Chinese agricultural sector. Energy Econ. 2021, 99, 105313. [Google Scholar] [CrossRef]
- Zhao, X.; Zhang, J.; Zhang, C.; Hu, J. Decoupling analysis and forecast of economic growth from electricity consumption in the Yangtze River Delta region, China. Environ. Sci. Pollut. Res. 2023, 30, 120422–120460. [Google Scholar] [CrossRef] [PubMed]
- Kaya, Y. Impact of Carbon Dioxide Emission on GNP Growth:Inter-Pretation of Proposed Scenarios; Subgroup PIEaIt, Ed.; IPCC Response Strategies Working Group Memorandum: Geneva, Switzerland, 1989. [Google Scholar]
- Ang, B.W. LMDI decomposition approach: A guide for implementation. Energy Policy 2015, 86, 233–238. [Google Scholar] [CrossRef]
- Sun, K.; Liu, C.; Yang, Z.; Han, J.; Xie, W.; He, W.; Yan, T. The spatiotemporal differences and driving factors of the energy welfare performance in the Yellow River Basin’s cities. Energy 2025, 333, 137263. [Google Scholar] [CrossRef]
- Weng, Z.; Xu, M.; Li, J.; Wu, X.; Xie, Y.; Tong, D. Carbon decoupling and drivers decomposition under the carbon neutrality target: Evidence from county-level cities in China. Resour. Conserv. Recycl. 2025, 222, 108465. [Google Scholar] [CrossRef]
- Ji, Q.; Feng, X.; Zhang, J.; Fu, B. Uncovering leveraging and hindering factors in socio-ecological interactions: Agricultural production in the Yellow River Basin as an example. J. Environ. Manag. 2024, 368, 122197. [Google Scholar] [CrossRef]
- Lu, C.; Ji, W.; Hou, M.; Ma, T.; Mao, J. Evaluation of efficiency and resilience of agricultural water resources system in the Yellow River Basin, China. Agric. Water Manag. 2022, 266, 107605. [Google Scholar] [CrossRef]
- Shen, M.; Hou, Y.; Liang, K.; Zhu, W.; Chong, C.H.; Bin, Y.; Zhou, X.; Ma, L. Energy-system characteristic shifts and their quantitative impacts on China’s CO2 trajectory: Evidence from a high-resolution energy allocation analysis–LMDI sectoral decomposition. Energy 2025, 335, 137905. [Google Scholar] [CrossRef]
- Ji, Y.; Zuo, Q.; Zhao, C.; Zhang, Z.; Wu, Q. Measurement and decomposition of green water resource utilization efficiency across multiple water use sectors in China: A perspective on water-saving potential. Environ. Impact Assess. Rev. 2025, 112, 107806. [Google Scholar] [CrossRef]
| Sichuan- Qinghai | Gansu- Qinghai | Ningxia- Qinghai | Inner Mongolia-Qinghai | Shaanxi-Qinghai | Shanxi-Qinghai | Henan-Qinghai | Shandong-Qinghai | |
|---|---|---|---|---|---|---|---|---|
| Energy consumption output efficiency effect | −30.18 →−33.19 | 34.83 →16.81 | −0.67 →31.04 | 20.56 →61.65 | −0.98 →1.87 | 142.60 →92.44 | −9.01 →−13.75 | 50.04 →−44.87 |
| Water consumption output efficiency effect | 45.24 →88.53 | 2.15 →13.87 | −10.96 →−34.74 | 8.07 →7.00 | 22.68 →49.95 | 77.83 →41.24 | 97.01 →203.89 | 145.88 →164.23 |
| Irrigation quota effect | −21.94 →−38.87 | −10.19 →−20.61 | 3.89 →1.64 | −23.62 →−81.11 | −19.86 →−36.28 | −99.56 →−95.59 | −93.10 →−194.73 | −114.55 →−146.86 |
| Actual irrigation ratio effect | 0.55 →3.31 | 9.67 →5.66 | 2.52 →6.30 | 4.69 →−15.32 | −1.82 →1.67 | 10.24 →4.89 | 10.86 →0.38 | 3.10 →0.02 |
| Effective irrigation rate effect | 19.92 →33.28 | −16.13 →−27.83 | −0.22 →7.03 | 1.12 →−1.32 | −3.74 →3.19 | −16.28 →0.28 | 50.53 →92.64 | 92.01 →82.79 |
| Intensity of agricultural acreage effect | −64.29 →−130.63 | −7.99 →−12.81 | −4.20 →−16.33 | −13.87 →−56.07 | −15.35 →−49.63 | −34.93 →−53.82 | −102.36 →−216.66 | −169.95 →−172.91 |
| Per capita food production efficiency effect | 32.26 →42.17 | 17.09 →18.79 | 10.23 →37.00 | 63.71 →179.50 | 18.33 →16.86 | 67.98 →67.71 | 51.40 →181.64 | 105.75 →113.42 |
| Agricultural employment structure effect | 1.19 →45.15 | 5.21 →44.35 | −0.62 →−1.36 | −11.89 →42.52 | −2.53 →17.57 | −30.60 →−0.68 | 13.24 →2.98 | 1.95 →12.59 |
| Population scale effect | 94.36 →273.15 | 61.57 →91.35 | 0.63 →6.98 | 66.58 →143.21 | 49.33 →116.70 | 138.34 →148.29 | 189.19 →404.76 | 313.72 →331.35 |
| Qinghai- Shandong | Sichuan- Shandong | Gansu- Shandong | Ningxia- Shandong | Inner Mongolia-Shandong | Shaanxi-Shandong | Shanxi- Shandong | Henan- Shandong | |
|---|---|---|---|---|---|---|---|---|
| Energy consumption output efficiency effect | −50.04 →44.87 | −290.22 →20.83 | 102.29 →154.97 | −58.92 →208.86 | 3.71 →323.85 | −91.08 →96.96 | 494.05 →425.94 | −186.54 →120.58 |
| Water consumption output efficiency effect | −145.88 →−164.23 | 0.92 →−181.62 | −296.44 →−284.44 | −281.59 →−394.26 | −284.35 →−440.07 | −79.30 →−139.38 | −101.21 →−262.46 | 51.37 →3.57 |
| Irrigation quota effect | 114.55 →146.86 | 85.70 →291.21 | 181.90 →223.57 | 163.68 →214.50 | 124.94 →153.75 | 47.36 →156.44 | −95.94 →34.17 | −122.05 →−39.13 |
| Actual irrigation ratio effect | −3.10 →−0.02 | −2.60 →10.53 | 51.28 →21.19 | 27.49 →29.55 | 19.65 →−49.12 | −18.45 →6.29 | 37.01 →16.65 | 43.59 →1.04 |
| Effective irrigation rate effect | −92.01 →−82.79 | −54.19 →−127.84 | −291.54 →−273.97 | −96.11 →−83.61 | −201.90 →−237.38 | −181.56 →−153.71 | −362.02 →−202.36 | −19.02 →−27.58 |
| Intensity of agricultural acreage effect | 169.95 →172.91 | −74.73 →71.58 | 312.49 →306.20 | 121.44 →166.90 | 305.83 →307.32 | 173.12 →157.97 | 372.18 →240.82 | −8.40 →−9.52 |
| Per capita food production efficiency effect | −105.75 →−113.42 | −2.77 →−186.07 | −121.96 →−161.88 | 17.07 →13.89 | 123.01 → 255.60 | −43.75 →−163.16 | −20.62 →−47.26 | −54.15 →120.77 |
| Agricultural employment structure effect | −1.95 →−12.59 | 3.75 →108.72 | 27.03 →140.49 | −9.56 →−24.13 | −72.04 →100.74 | −21.75 →41.47 | −145.69 →−33.23 | 58.37 →−36.39 |
| Population scale effect | −313.72 →−331.35 | −16.68 →−64.21 | −296.79 →−336.29 | −310.86 →−433.87 | −331.44 →−474.38 | −166.49 →−220.74 | −350.09 →−307.25 | 16.65 →−11.94 |
Disclaimer/Publisher’s Note: The statements, opinions and data contained in all publications are solely those of the individual author(s) and contributor(s) and not of MDPI and/or the editor(s). MDPI and/or the editor(s) disclaim responsibility for any injury to people or property resulting from any ideas, methods, instructions or products referred to in the content. |
© 2025 by the authors. Licensee MDPI, Basel, Switzerland. This article is an open access article distributed under the terms and conditions of the Creative Commons Attribution (CC BY) license (https://creativecommons.org/licenses/by/4.0/).
Share and Cite
Zhang, C.; Shi, J.; Zhao, X.; Pei, E. Driving Factors of Spatial–Temporal Differences in Agricultural Energy Consumption Evolution in the Yellow River Basin: A Perspective of Water–Energy–Food–Land–Population Nexus. Water 2025, 17, 2971. https://doi.org/10.3390/w17202971
Zhang C, Shi J, Zhao X, Pei E. Driving Factors of Spatial–Temporal Differences in Agricultural Energy Consumption Evolution in the Yellow River Basin: A Perspective of Water–Energy–Food–Land–Population Nexus. Water. 2025; 17(20):2971. https://doi.org/10.3390/w17202971
Chicago/Turabian StyleZhang, Chenjun, Jiaqin Shi, Xiangyang Zhao, and Erjie Pei. 2025. "Driving Factors of Spatial–Temporal Differences in Agricultural Energy Consumption Evolution in the Yellow River Basin: A Perspective of Water–Energy–Food–Land–Population Nexus" Water 17, no. 20: 2971. https://doi.org/10.3390/w17202971
APA StyleZhang, C., Shi, J., Zhao, X., & Pei, E. (2025). Driving Factors of Spatial–Temporal Differences in Agricultural Energy Consumption Evolution in the Yellow River Basin: A Perspective of Water–Energy–Food–Land–Population Nexus. Water, 17(20), 2971. https://doi.org/10.3390/w17202971


