Abstract
Technological proliferation relies on critical elements such as rare earth elements (REEs) and raises environmental problems associated with raw material extraction, industrial manufacturing, and the informal management of the growing e-waste. Algae are good bioindicators of contamination and have shown promise as biosorbents for remediating metal-contaminated environments. However, the effects of REEs on algae are still poorly documented and understood. This study investigated the uptake of yttrium (Y)—one of the most frequently used REEs, particularly in fluorescent lamps—by Ulva sp., as well as its effects on total chlorophyll content, relative growth rate, and biochemical performance. The algae were exposed to Y for 72 h at environmentally relevant concentrations, including levels found in e-waste leachates (0.5, 5.0, 50, and 500 mg/L). Ulva sp. removed 86% of Y within 72 h, with a bioconcentration factor of up to 621. EDTA analysis revealed that over 90% of yttrium was retained on the algal surface. SEM-EDS mapping showed crystal structures on the algae where Y was present. While the relative growth rate was unaffected by the tested Y gradient, photosynthesis was significantly impaired at 500 mg/L. Despite the activation of defence mechanisms, cell damage was observed at most Y concentrations tested, highlighting the potential risks associated with the presence of REEs in aquatic environments.
1. Introduction
The ever-increasing use of rare earth elements (REEs) in high-tech products and new technologies has led to an increase in mineral exploitation [1], which has detrimental effects on the environment [2]. At the same time, the increase in waste electricals and electronic equipment (e-waste), which is often improperly disposed of due to scarce recycling protocols and high costs associated with its legal disposal [3], has also contributed to the leaching of these elements and other contaminants into the aquatic environment [4]. Studies have shown that the concentration of REEs in the Pearl River in China increased from 1 μg/L to 3007 μg/L, and that 33 major eastern rivers reached total suspended REE concentrations of approximately 1712 mg/L [5]. Water from the mining areas of Kerman in Iran (ƩREEs concentration up to 10,646 μg/L) [6] and Wisniowka in Poland (ƩREEs concentration of 589 μg/L–90.1 mg/L) [7,8], or industrial discharges into the Rhine River in Germany (ƩREEs of 52 mg/L), are further examples of anthropogenic REE contamination [9]. Compared to 2013, the concentrations of some REEs increased by 37% in the Rhine and 50-fold in the Thames, London [10]. Among REEs, yttrium (Y) is one of the most widely used, particularly in LEDs and fluorescent lamps—where it is the REE present at the highest concentrations—as well as in catalysts, medical imaging devices, and other applications [11]. The presence of yttrium in aquatic environments has been shown to be detrimental, negatively affecting the growth rate of D. magna ([Y] > 790 µg/L) and C. riparius ([Y] > 450 mg/Kg), and increasing lethality of D. magna ([Y] > 1100 µg/L) and O. mykiss ([Y] > 450 µg/L) [12]. Microalgal growth was inhibited at Y concentrations greater than 0.5 mg/L, and the activity of the antioxidant enzyme superoxide dismutase increased with the addition of Y (0–0.30 mg/L). There is evidence that the toxicological effects of Y are related to its chemical similarity to Ca, acting as a potential Ca channel blocker, although most of the mechanisms underlying these effects remain unclear [13]. Moreover, the long-term effects of REEs in aquatic ecosystems are not yet fully understood or regulated, as there are currently no specific guidelines for REE concentrations in water [13]. The available studies are mainly limited to microalgae, bacteria, and invertebrates, and to our knowledge, no studies have investigated Y toxicity in marine macroalgae.
Marine macroalgae such as Ulva sp. are not only more complex than microalgae, but also act as biofilters in ecosystems by sorbing elements from the water column, and they form an important group of biomonitoring organisms [14]. Assessing Y accumulation, toxicity, and the underlying mechanisms in marine macroalgae could provide valuable information to policymakers for establishing safe levels of this element in aquatic ecosystems.
In this context, the present study aimed to evaluate (i) the biosorption and bioaccumulation of Y by the seaweed Ulva sp. at various concentrations, ranging from realistic environmental levels to those found in e-waste leachates; (ii) the effects of Y on Ulva sp. (as a bioindicator species) in terms of total chlorophyll content, relative growth rate, and biochemical performance; and (iii) the distribution of Y within the algae (bioadsorbed vs. bioaccumulated) and the possible mechanisms involved in the uptake process.
2. Materials and Methods
2.1. Reagents
All reagents used were of analytical grade. Nitric acid (65% (w/w), Suprapur ®) was purchased from Merck (Darmstadt, Germany) and yttrium(III) chloride hexahydrate salt was purchased from Sigma-Aldrich (Darmstadt, Germany). All glassware was acid-washed before use.
2.2. Sampling
Ulva sp., an euryhaline seaweed [15], was harvested at low tide in the Aveiro estuary and transported to the laboratory in isothermal plastic bags containing local water. To remove surface sediments and potential epibionts, the seaweed was rinsed with seawater and placed in 20 L aerated aquaria under natural sunlight (positioned near a large window-12 h photoperiod) at room temperature (20 ± 2 °C).
Seawater was collected from the Atlantic Ocean near Praia da Barra in Aveiro, Portugal (40.644250, −8.745356), filtered through 0.45 µm Millipore filters and characterized (Supplementary Material-Table S1). Subsequently, a dilution with ultrapure water (Milli-Q, 18 MΩ/cm) to a salinity of 10 g/L was performed for seaweed acclimation and assays. Salinity at the sampling site varies between 35 and nearly 0 g/L [16], mainly due to tidal and river inputs; therefore, an intermediate salinity was chosen for this study. Salinity was measured using an Eclipse model 45-63 portable refractometer (Bellingham + Stanley Ltd., Kent, UK).
2.3. Experimental Design
Uptake and toxicity of Y were assessed by exposing Ulva sp. (6 g/L fresh weight) to saline water (salinity 10 g/L; pH 7.8) contaminated with different initial concentrations of the element (0.5, 5.0, 50, and 500 mg/L) for three days. These acute exposure conditions were designed to simulate near–point-source pollution scenarios, such as landfill leachates or electronic waste disposal sites. Yttrium concentrations were chosen based on values reported in contaminated water systems [17], with the highest levels observed in leachates from fluorescent lamps [18,19]. While some tested concentrations exceed typical background levels in contaminated sites, including estuarine systems, this approach provides valuable insight into potential risks under worst-case exposure scenarios.
Assays were conducted in 1 L Schott Duran ® flasks at room temperature (20 ± 2 °C) under natural sunlight (12 h light: 12 h dark). The spiked solutions were allowed to pre-equilibrate for 12 h before exposure. Sampling of the solution was performed immediately before the addition of the seaweed (0 h) and at predetermined exposure times. Samples were acidified with 65% HNO3 to maintain a pH below 2 and stored at 4 °C until analysis.
All experimental conditions were performed in triplicate. Control solutions (mono-solutions of each Y concentration without seaweed) were run in parallel to assess possible Y losses. Additionally, blank solutions (seawater at salinity 10 g/L and seaweed without Y) were included to evaluate seaweed behaviour and baseline toxicity. pH monitoring was conducted ex situ after 6, 24, 48, and 72 h.
2.4. Analytical Quantification
Yttrium quantification in water samples was performed by inductively coupled plasma optical emission spectrometry (ICP-OES) using a Jobin Yvon Activa M (HORIBA Jobin Yvon, Edison, NJ, USA) spectrometer according to the methodology validated by Carvalho et al. [20]. The limit of quantification was defined as the lowest calibration standard (100 µg/L) and the detection limit was considered 1/3 of the quantification limit (33 µg/L). Calibration curves with a correlation coefficient below 0.999 were discarded. An acceptable coefficient of variation among replicates was set at 5%.
Yttrium quantification in seaweed samples was performed by ICP-OES following microwave-assisted acid digestion. Lyophilized seaweed samples (50–150 mg) were digested using a CEM MARS 6 (CEM Corporation, Matthews, NC, USA) microwave according to the protocol described by Viana et al. [21]. The digests were collected in polyethylene bottles to a final volume of 25 mL and diluted to volume with ultrapure water. Method quality control was ensured through the parallel analysis of procedural blanks (reaction vessels containing only reagents), which were consistently below the limit of quantification, and certified reference material (NIST 1515-Apple Leaves), with recoveries ranging from 88 to 109%.
2.5. Seaweed Characterization
The morphological analysis of Ulva sp. was made using a field emission gun (FEG) scanning electron microscope (SEM) (Model SU70; Hitachi, Tokyo, Japan), operated at 15 kV and equipped with an energy-dispersive X-ray spectroscopy (EDS) accessory (EDS Detector: Bruker AXS, Software: Quantax 400).
2.6. Partition of Y in Seaweed: Intra- vs. Extra-Cellular Concentration
Yttrium localization on Ulva sp. biomass (extracellular vs. intracellular) was evaluated using the desorbing agent ethylenediaminetetraacetic acid (EDTA). Based on the study by Viana et al. [21], 0.001 mol/L EDTA solution in 0.6 mol/L NaCl was used as the extractant during 15 min at 150 rpm. The extracellular contaminant fraction (Fext, %) was calculated considering the concentrations determined in the seaweed discs with (qf EDTA, μg/g) and without (qf, μg/g) prewash with EDTA (Equation (1)):
The internalized fraction (Fint, %) was calculated as follows (Equation (2)):
2.7. Biological Responses
2.7.1. Biochemical Markers Analysis
Biochemical alterations due to Y exposure were identified by biochemical marker analysis related to antioxidant enzymes (superoxide dismutase, SOD; catalase, CAT; glutathione peroxidase, and GPx activities), biotransformation enzymes (glutathione S-transferase, GSTs activity) and cellular damage (lipid peroxidation, LPO levels) determined in the whole seaweed mass. These biomarkers were selected based on their well-established roles in algal ecotoxicology [22,23,24]: SOD, GPx and CAT are central to mitigating reactive oxygen species (ROS) accumulation, while GSTs contribute to detoxification and defence against metal-induced oxidative stress. LPO, in turn, serves as a marker of membrane lipid damage. Together, these biomarkers provide complementary insights into both the defence capacity of the organism and the extent of cellular damage following metal contamination.
For each biomarker determination, 0.25 g fresh weight (FW) seaweed was used, and the determination was performed in a total of 9 samples per treatment (three samples per replicate, and three aquaria per treatment). Technical duplicates of each sample were included in each analysis. All measurements were performed using a microplate reader (BioTek, Synergy HT). Samples extraction was performed in the appropriate buffer for each parameter at a ratio of 1:4 (m/v). The homogenization step was performed using a TissueLyzer II (Qiagen) set to a frequency of 20 1/s, for 180 s and centrifuged for 25 min at 10,000× g at 4 °C. Supernatants were stored at −80 °C or used immediately. For most measures, a potassium phosphate buffer—50 mmol/L at pH 7.0 with 1 mmol/L ethylenediaminetetraacetic acid, 1% (v/v) Triton X-100, and 1 mmol/L dithiothreitol—was used for sample extraction. For LPO, the extraction was performed using 20% (w/v) trichloroacetic acid (TCA).
Antioxidant and Biotransformation Enzymes
Superoxide dismutase (SOD) and catalase (CAT) activities were quantified using the methods described by Beauchamp and Fridovich [25] and Johansson and Borg [26], respectively. Standards were used for the quantification of SOD (0–60 U/mL SOD) and CAT (0–150 μM formaldehyde). SOD and CAT reactions were read at 560 nm and 540 nm, respectively. One unit (U) of enzymatic activity represents a 50% reduction in nitroblue tetrazolium (NBT) to SOD, and the formation of 1 nmol of formaldehyde per minute to CAT.
The determination of GSTs was performed according to Habig et al. [27] with modifications made by Carregosa et al. [28] and GPx quantification according to McFarland et al. [29] with modifications. The enzymatic reactions wereread in a microplate reader at 340 nm for 5 min at 15 s intervals. The amount of thioether formed was calculated for the activity of GSTs using the extinction coefficient (ε) 9.6 (mM)−1 cm−1 and the conversion of nicotinamide adenine dinucleotide phosphate (NADPH) to GPx activity using the coefficient of extinction (ε) 6.22 (mM)−1 cm−1. The results were expressed as U per g FW, where U corresponds to the amount of enzyme that causes the formation of 1 μmol of dinitrophenyl thioether per min for GSTs or the conversion of 1 μmol NADPH per min in the case of GPx.
Oxidative Damage
Lipid peroxidation (LPO) levels were measured to assess oxidative damage to lipids, following the methods of Ohkawa et al. [30] modified by Carregosa et al. [28]. The final reactions were read at 535 nm, using the extinction coefficient for malondialdehyde (MDA) of 156 (mM)−1 cm−1. Results were expressed in nmol MDA equivalents per g of FW.
2.7.2. Total Chlorophyll Analysis
Total chlorophyll analysis was performed with a SPAD-502 m (Konica-Minolta, Japan). Because the leaf is not cut or otherwise damaged, the total chlorophyll of the same leaf can be quantified as the plant grows. Five independent SPAD measurements were performed per replicate disc (3 discs per flask).
2.7.3. Relative Growth Rate Analysis
Analysis of the relative growth rate (RGR, %/day)–Equation (3)-was performed after 24, 48 and 72 h of testing based on the area of digitalized discs (initial area Ø = 2.2 ± 0.1 cm) calculated by the Fiji software 2.1.0.
where At refers to the area at time t (t in days) and A0 refers to the initial area.
2.8. Data Analysis
The amount of Y removed from the solution by the seaweed (%) was calculated based on Equation (4):
where C0 is the initial concentration of Y in solution (mg/L) and Ct is the concentration of Y at time t (mg/L). The average amount of element sorbed by the seaweed per unit mass, qreal (mg/g, dry weight (DW)), after 72 h, was measured by ICP-OES in the biomass after microwave-assisted acid digestion.
The bioconcentration factor (BCF, L/kg), defined as the ratio between the Y concentration in the seaweed after exposure (qreal, mg/kg) and the initial concentration of Y in water (C0, mg/L), was calculated as follows (Equation (5)):
The results of all biomarkers (SOD, CAT, GSTs, GPx and LPO) of each exposure condition were subjected to hypothesis testing using multivariate permutational analysis of variance using PERMANOVA complement in PRIMER v6 [31]. Pairwise comparisons between the conditions were made because significant differences were observed in the main test. Values were considered significantly different if the p-value was <0.05 (all p-values are reported in Table S2). Degrees of freedom = 5. The null hypothesis was that for each biomarker, there were no significant differences between the exposure concentrations. Significant differences between the conditions were represented in Figures with different lower-case letters.
Graphic illustrations were developed with GraphPad Prism 8.0.1.
3. Results
3.1. Yttrium Concentration in Water
For the conditions studied, the concentrations of Y measured in water immediately after contamination were: 0.41 ± 0.01 mg/L (0.5 mg/L nominal), 3.96 ± 0.06 mg/L (5.0 mg/L nominal), 40.2 ± 0.3 mg/L (50 mg/L nominal), and 463 ± 5 mg/L (500 mg/L nominal). A relative stability of Ct/C0 ratios over 72 h was observed in the absence of Ulva sp. (control experiments), always within the control limits (Figure 1A) under all conditions. In contrast, the kinetic profiles of Y in the seaweed-based assays (Figure 1B) showed a rapid decrease in Y concentration in seawater during the first 9 h for the initial concentrations of 0.5 and 5.0 mg/L (resulting in removal efficiencies of 64% and 57%, respectively), followed by a slower decline, reaching near-equilibrium at 72 h with removal efficiencies exceeding 70%. For the higher exposure concentrations, removal after 72 h was 30% for 50 mg/L and between 3% and 5% for 500 mg/L.
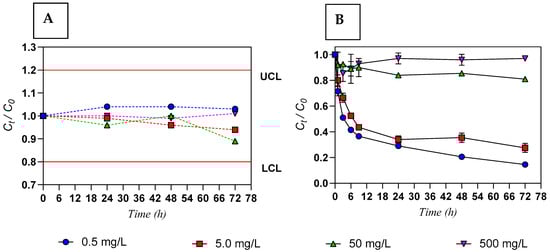
Figure 1.
Ratio between the concentrations of Y at time t (Ct) and at initial condition (C0) in contaminated water over 72 h: (A) in absence of seaweed (control—dashed lines); (B) in contact with living seaweed (Ulva sp.—solid line). Results are expressed as mean values and error bars represent the standard deviation (n = 3). Initial concentration of Y of 0.5; 5.0; 50; 500 mg/L; initial seaweed density of 6.0 g/L (FW); salinity 10 g/L. Upper control limit (UCL; Ct/C0 = 1.2) and lower control limit (LCL; Ct/C0 = 0.8) are depicted as a red line.
3.2. Yttrium Concentration in Ulva sp.
Table 1 presents the concentration of Y in Ulva sp. biomass determined by ICP-OES after 72 h of exposure to spiked water. The baseline concentration of Y, measured in pristine seaweed immediately after field collection, was below 0.02 mg/g, which was also observed in seaweed from the blank assays (seaweed exposed to clean seawater) after 72 h. The bioconcentration factor (BCF) varied with the initial Y concentration in water, ranging from 621 to 42 L/kg, with lower BCF values recorded at higher exposure concentrations.

Table 1.
Concentration of Y in the biomass of Ulva sp. at the end of the exposure (qreal, mg/g), and the respective bioconcentration factor (L/kg), for the different initial concentrations of Y studied.
3.3. Yttrium Partition in Ulva sp. Biomass
To distinguish between surface sorption and intracellular uptake, the seaweed was subjected to EDTA extraction, which revealed that 92–96% of the Y was bound to the surface of Ulva sp. (Figure 2).
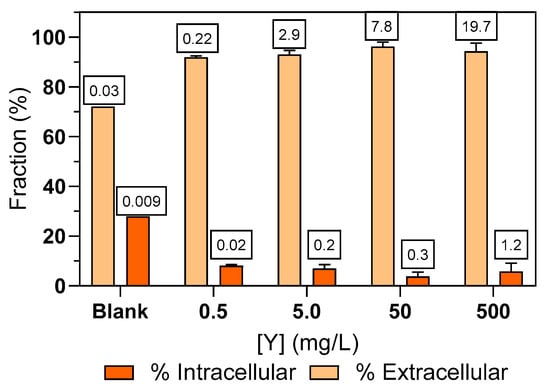
Figure 2.
Extracellular and intracellular fractions of Y in Ulva sp. after 72 h exposure to different initial Y concentrations in water (blank; 0.5; 5.0; 50; 500 mg/L), operationally defined by extraction with 0.001 mol/L EDTA L in 0.6 mol/L NaCl. Values inside the square indicate the amount of Y (µg/g) inside and outside Ulva sp.
Figure 3 presents scanning electron microscopy coupled with energy dispersive X-ray spectroscopy (SEM-EDS) images of Ulva sp. before (A and B) and after exposure (C and D) to Y at 500 mg/L. Changes were observed on the seaweed surface after exposure. SEM-EDS analyses revealed heterogeneous surface deposits enriched in Y. These deposits displayed well-defined, angular morphologies that resemble crystal-like precipitates (Figure 3C,D).
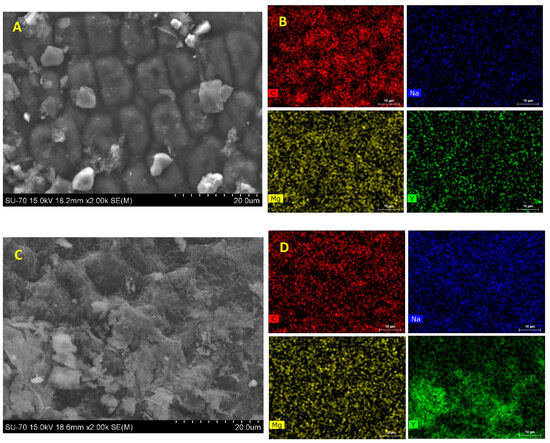
Figure 3.
Scanning electron microscopy images (A,C) and respective energy dispersive X-ray mapping of main elements (B,D) on Ulva sp. surface before (A,B) and after (C,D) exposure to 500 mg/L of Y (Carbon–red, Sodium–blue, Magnesium–yellow, Yttrium–green).
3.4. Biological Responses
3.4.1. Antioxidant and Biotransformation Enzymes
The activity of SOD decreased significantly in the seaweed exposed to Y concentrations of 0.5; and 500 mg/L compared to seaweed from the blank condition. In contrast, the SOD activity in seaweed exposed to 5.0 and 50 mg/L Y was significantly higher than in the blank and the highest concentration (Figure 4A).
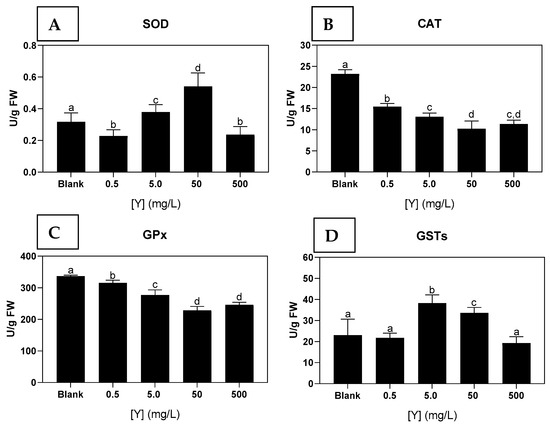
Figure 4.
(A)-Superoxide dismutase (SOD); (B)-Catalase (CAT); (C)-Glutathione peroxidase (GPx); (D)-Glutathione-S-transferases (GSTs) activities in Ulva sp. from the blank condition and after exposure to different concentrations of Y (0.5; 5.0; 50; 500 mg/L) for 72 h. Results are expressed as mean and standard deviation (n = 9). Different letters indicate significant differences (p < 0.05) between the conditions.
Seaweeds exposed to all concentrations of Y showed significantly lower CAT activities compared to seaweed Y-free (blank condition, Figure 4B).
The GPx activity was significantly lower in seaweeds exposed to all Y concentrations compared to unexposed ones. The lowest GPX activity was observed in seaweed exposed to 50 and 500 mg/L Y (Figure 4C).
Seaweeds exposed to Y concentrations of 5.0 and 50 mg/L showed a significant increase in GSTs’s activity compared to the blank values. No significant differences were observed among seaweeds exposed to 0.5, 500 mg/L and the blank condition (Figure 4D).
3.4.2. Oxidative Damage
Lipid peroxidation (LPO) levels increased significantly in seaweed exposed to all Y concentrations compared to the uncontaminated control (blank condition), with the highest levels observed in seaweed exposed to Y concentrations of 5.0, 50, and 500 mg/L (Figure 5).
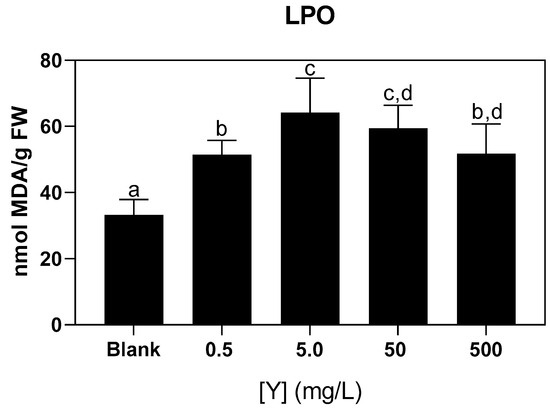
Figure 5.
Lipid peroxidation (LPO) levels in Ulva sp. from the blank condition and after exposure to different concentrations of Y (0.5; 5.0; 50; 500 mg/L) for 72 h. Results are expressed as mean and standard deviation (n = 9). Different letters indicate significant differences (p < 0.05) between the conditions.
3.4.3. Total Chlorophyll, Relative Growth Rate and pH Monitoring
After 3 days of exposure to different Y concentrations, total chlorophyll content decreased significantly at intermediate and high concentrations (5.0–500 mg/L) compared to the blank, although no visible chlorosis was observed (Figure S1A), with SPAD values of 5.89 ± 0.07, 5.49 ± 0.84, and 5.74 ± 0.45 for 5.0, 50, and 500 mg/L, respectively. In contrast, no significant differences were found between the lowest exposure concentration (0.5 mg/L Y, 9.53 ± 0.05 SPAD) and the blank condition (9.69 ± 0.05 SPAD).
The relative growth rate (RGR, %/day) of seaweed exposed to Y concentrations decreased transiently after 24 and 48 h at the higher concentrations (5.0 and 500 mg/L) by approximately 1.6-fold and 2.6-fold, respectively, compared to the Y-free condition (blank condition) (Figure S1B). However, at 72 h, the RGR for all Y concentrations was not significantly different from the blank condition.
Monitoring of medium pH revealed concentration-dependent differences consistent with photosynthetic activity (Figure 6). While pH remained stable at the blank (clean seawater with Ulva sp.) and at 0.5 mg/L Y, it declined notably at 500 mg/L Y.
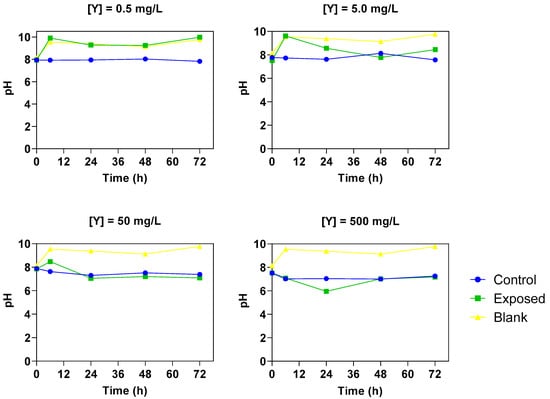
Figure 6.
pH monitoring of different concentrations of Y (0.5; 5.0; 50; 500 mg/L) over 72 h of (1) seaweed Ulva sp. exposed to Y (contaminated seawater-green); (2) control solutions (spiked seawater without Ulva sp.-blue); and (3) blank solutions (clean seawater with Ulva sp-yellow). Amount of seaweed of 6.0 g/L (FW); salinity 10 g/L; initial pH 7.8. Results are expressed as mean and standard deviation (n = 3).
4. Discussion
In contrast to other metals, available information on the toxicity of Y is extremely limited, particularly in seaweed. This knowledge gap underscores the need for fundamental baseline studies to elucidate its specific impacts at both physiological and ecological levels. Addressing this gap is therefore essential for improving predictive models of metal mixture toxicity and for guiding future strategies in environmental monitoring and management.
4.1. Sorption of Y by Ulva sp.
A rapid decrease in Y concentrations in water was observed during the first 9 h of contact with Ulva sp., likely due to the steep initial concentration gradient, as the seaweed surface was essentially Y-free (baseline levels < 0.02 mg/g, consistent with Pinto et al. [32]). Generally, sorption is a passive process where cations diffuse to available binding sites and are adsorbed. Protein- and polysaccharide-derived hydroxyl, amine, and carboxyl groups may be involved in the sorption of Y by Ulva sp. [33]. In metabolically active sorbents such as living seaweed, this is followed by metabolism-dependent internal accumulation until a steady state is reached, a well-known nutrient uptake mechanism [34,35]. Although higher initial concentrations enhance interactions with active sites, at 500 mg/L the binding sites became saturated, leading to lower removal efficiencies (3–5%). However, the highest concentration of Y in seaweed biomass was recorded under this condition, reaching 20.9 ± 1.3 mg Y/g. The strong capacity of Ulva sp. to uptake Y has been previously reported by Pinto et al. [36] at exposure concentrations of 0.5 mg Y/L. In this study, BCFs ranged from 42 to 621 L/kg, showing an inverse relationship with the water concentration gradient, highlighting that metal accumulation in seaweed tissues responds directly to the surrounding Y levels [37].
4.2. Fractioning of Y in Ulva sp. Biomass
Extractions with the chelating agent EDTA revealed that over 90% of the Y was located in the extracellular fraction of the seaweed. This high proportion may be influenced by the short duration of the experiments relative to the slower rate of Y internal accumulation in the seaweed. The interactions between REEs and living organisms remain understudied; however, a study on Nymphoides peltata (a freshwater plant) showed that Y was predominantly located in the cell wall (73–86%), with smaller amounts in organelles (8–19%) and the soluble fraction (4–8%) [38].
Elemental mapping (SEM-EDS) revealed distinct Y-enriched deposits on the algal surface at high exposure concentrations, supporting the conclusion that Y was predominantly located in the extracellular fraction. Although these deposits were initially described as ‘crystal-like,’ this refers to their morphology under SEM rather than crystallographic confirmation. Their heterogeneous, particulate appearance is consistent with surface precipitation or aggregation phenomena that occur once binding sites are saturated [21]. Similar surface-associated patterns have been reported in other algal systems. For example, Tunali & Yenigun [39] observed that Nd3+ accumulated primarily on the surface of living C. vulgaris with a scattered distribution revealed by SEM, although a portion also entered the intracellular space. This reinforces the notion that REEs often accumulate preferentially at the cell surface, with limited but detectable penetration into internal compartments. The formation of such deposits may further contribute to oxidative stress by physically altering the cell wall surface, limiting ion exchange, and reducing photosynthetic efficiency.
The sorption mechanism of Ulva sp. may be analogous to that described by Liang and Shen [11] for S. marcescens exposed to Y, where Y ions are initially attracted to the surface through electrostatic interactions. In bacteria, cell wall peptidoglycan, lipopolysaccharides, and exopolymers provide negatively charged groups (carboxyl, hydroxyl, phosphate) that bind metals through ion exchange and complexation [40,41]. A similar situation occurs in Ulva sp. cell walls, where ulvan and other polysaccharides contain abundant sulphate and carboxyl groups that act as cation-binding sites, as confirmed by FTIR and SEM-EDS analyses in recent studies [21]. Although the molecular scaffolds differ between microbes and seaweed, the chemical basis—adsorption to anionic functional groups followed by potential internalization—is analogous. This makes microbial studies a relevant comparative model for understanding metal–alga surface interactions. Subsequently, Y ions near the cell surface may exchange with Na+, K+, Mg2+, and other light metal ions through ion exchange and/or react with functional groups such as hydroxyl, carboxyl, and amine groups, forming stable complexes. A speciation analysis was performed using VisualMinteq software (version 3.1–Figure S2) to infer about the predominant chemical Y species in the spiked seawater. Under the experimental conditions studied, Y speciation revealed to be dominated mainly by carbonate species (YCO3+ and Y(CO3)2−) across all tested concentrations, with an increased sulphate complexation at the highest concentration. These speciation patterns are consistent with the high affinity of REEs for carbonate in aquatic systems [42,43]. From a biological perspective, the predominance of carbonate complexes reinforces that binding to algal surfaces may occur mainly through interaction with negatively charged functional groups such as carboxyl, hydroxyl, and phosphoryl groups, which are abundant in algal cell walls [42]. The relatively low proportion of Y3+ in solution in concentrations 0.5–50 mg/L (4–7%) versus 500 mg/L (25%), could represent one of the main reasons explaining the higher toxicity at 500 mg Y/L, given that the trivalent forms should be the most bioavailable [43].
Our results show that, after the accumulation on the surface occurs, around 5–8% of the total Y is absorbed inside the cells, regardless of the initial exposure concentration. When expressed as mass concentration, this intracellular fraction represents a measurable but relatively small portion compared with the extracellular load. The proportion remained <10% across all tested concentrations, suggesting that intracellular accumulation may be limited by the transport mechanism rather than external availability. Similar patterns have been reported in recent works as those by Ordóñez et al. [41] which highlights in their review that living algal biomass often shows surface-binding (biosorption) as the dominant uptake mode under metal exposure, with intracellular uptake being metabolism-dependent and generally smaller in magnitude. Even in algae like Ulva exposed to non-REE metals (Cu, Zn, Co), fast surface adsorption dominates in early exposure phases, with limited additional mass gain intracellularly over time [44].
This indicates that while surface complexation is rapid and dominant, intracellular Y incorporation may be constrained by physiological barriers. This intracellular fraction is likely responsible for most of the biochemical alterations observed in the biomarker analyses. Once inside the cells, REEs can even alter organelle structures [12,45].
4.3. Biomarkers and Physiological Responses of Ulva sp. to Y Exposure
Organisms exposed to stressful conditions can experience increased production of reactive oxygen species (ROS), triggering a cascade of responses, including antioxidant strategies, to prevent cellular damage [46]. SOD activity is suppressed at the lowest and highest tested concentrations and elevated at the intermediate concentration. This pattern can arise when moderate stress triggers an adaptive up-regulation of defence enzymes (transcriptional activation/induction) [47], whereas both very low exposures (which may directly interfere with basal enzyme function or regulatory signalling) and very high exposures (which cause enzyme inactivation, cofactor depletion, or cell damage) result in reduced measured activity. Although SOD activity was stimulated at intermediate Y concentrations (5.0 and 50 mg/L), CAT and GPx activities were inhibited. This apparent contradiction can be reconciled because SOD converts superoxide to hydrogen peroxide (H2O2); an increase in SOD therefore raises the cellular H2O2 burden, which must be removed by CAT and GPx [48]. However, under Y exposure, these H2O2-removing enzymes may be non-functional or depleted—for example via direct inhibition or disruption of enzyme active sites by REEs, depletion of reduced glutathione required by GPx, NADPH/cofactor loss that impairs catalase protection, or oxidative inactivation of the enzymes themselves—leading to an accumulation of H2O2 and the observed increase in lipid peroxidation [49]. Thus, rather than SOD suppression causing lower CAT/GPx, the more likely sequence is: (1) SOD up-regulation (attempt to remove O2•−); (2) increased H2O2 formation; (3) insufficient CAT/GPx activity (due to inhibition/cofactor depletion/protein damage); (4) H2O2/LPO accumulation. Nevertheless, the phase II biotransformation enzymes, GSTs, were activated at intermediate concentrations of Y. GSTs are a family of enzymes that play a crucial role in detoxifying both endogenous compounds, such as ROS, and exogenous compounds, including environmental toxins. Their activity depends on the conjugation of reduced glutathione (GSH) to electrophilic substrates, thereby increasing solubility and facilitating excretion. In algae, GSTs also act as an auxiliary antioxidant system by neutralizing lipid peroxidation products (e.g., 4-hydroxynonenal, malondialdehyde), which may accumulate when primary antioxidant enzymes such as CAT and GPx are inhibited.
The selective induction of GSTs at intermediate Y concentrations supports the idea that phase II biotransformation acts as an early adaptive response to moderate oxidative/chemical stress [47,50]. However, the lack of GST stimulation at the highest concentration likely reflects the limits of this defence—for example, depletion of reduced glutathione (GSH) or direct enzyme inhibition under severe stress—a pattern recently reviewed for microalgae and seen across aquatic organisms [47,51]. Moreover, Ulva-specific multi-endpoint studies show that antioxidant and physiological responses are highly dose- and tissue-dependent, supporting our interpretation that GST up-regulation can mitigate oxidative damage at moderate exposures but may be insufficient at very high contaminant loads [52].
This study demonstrates increased LPO levels at all tested concentrations, consistent with the EDTA and SEM analyses. Since most Y is located on the surface of the seaweed biomass, activation of endogenous defences is limited, making cellular damage more likely. Taken together, these results suggest a mechanistic cascade linking antioxidant enzyme inhibition, oxidative stress, and photosynthetic impairment. At intermediate Y concentrations, the activation of SOD reflects an early attempt to counteract ROS, whereas the inhibition of SOD, CAT, and GPx at other concentrations indicates a reduced overall antioxidant capacity. The consequent accumulation of ROS is consistent with the significant rise in lipid peroxidation, which signals oxidative injury to membranes, particularly in chloroplasts, where thylakoid integrity is essential for light harvesting and electron transport. Such oxidative damage provides a mechanistic explanation for the reductions in chlorophyll content and the altered pH patterns observed in the medium. Because pH dynamics are directly linked to CO2 uptake during photosynthesis, the decline in pH at high Y concentrations reflects impaired photosynthetic activity caused by ROS-driven damage. In this way, biochemical and physiological endpoints can be understood as interconnected responses: antioxidant disruption leads to ROS accumulation, ROS causes lipid peroxidation, and this in turn compromises photosynthetic performance.
Figueiredo et al. [53] evaluated the toxicity of Lanthanum (La, 15 µg/L) and Gadolinium (Gd, 10 µg/L) to Ulva rigida during 7 days and reported that both REEs triggered an adequate activation of the antioxidant defence system, thereby avoiding lipid damage. The differing results may be due to the much lower concentrations tested by these authors—33 to 500 times lower than those used in the present study. Henriques et al. [54] evaluated the toxicity of Europium (Eu, 152 and 500 µg/L) to Ulva lactuca and the results showed toxicity but no cellular damage, likely due to the activation of the seaweed’s defence mechanisms, combined with exposure to concentrations 3 to 33 times lower than those used in the present study. These results highlight the importance of exposure concentration on organism effects and warn of the risks associated with the increasing generation of electronic waste and related pollution, particularly concerning REEs.
Although chlorosis was not observed, total chlorophyll content decreased at intermediate Y concentrations (5.0–500 mg/L). This suggests that the energy cost of chlorophyll synthesis was impaired, potentially due to REEs interference with the chlorophyll active site, which can limit photosynthetic energy conversion.
Consistent with this mechanistic framework, the production of light-driven ROS can result in oxidative harm to crucial photosynthetic components, consequently blocking photosynthetic activity. This inhibition could manifest as a decrease in CO2 assimilation, accompanied by an increase in leaf H2O2 production [55]. While some studies indicate that low concentrations of REEs may enhance photosynthetic activity [56,57], higher concentrations of REEs might compete with or replace Mg2+ due to their structural similarity, thereby potentially limiting or inhibiting photosystem activity [45,58,59]. In this study, the pH monitoring results are consistent with this interpretation, as reduced CO2 uptake under high Y exposure coincided with signs of oxidative stress and chlorophyll loss, reinforcing the conclusion that photosynthesis was impaired under these conditions. This is because pH in the culture medium is closely tied to photosynthetic activity: as seaweed assimilate dissolved inorganic carbon during photosynthesis, CO2 removal and bicarbonate uptake typically lead to an increase in pH. Conversely, when photosynthetic performance is impaired, CO2 drawdown is reduced and the medium tends to remain more acidic or even decrease in pH [60,61]. Thus, the observed pH decline at 500 mg/L Y strongly supports the conclusion that photosynthetic processes were disrupted under these conditions.
In summary, Y exposure in Ulva sp. triggered a cascade of effects in which antioxidant enzyme inhibition led to ROS accumulation, ROS drove lipid peroxidation, and this oxidative damage impaired photosynthetic function, providing a coherent mechanistic link from biochemical stress to physiological impairment.
5. Conclusions
This study evaluated the ability of living seaweed Ulva sp. to uptake yttrium (Y) from water under ecologically relevant contamination scenarios, including concentrations typical of e-waste leachates. Dose-dependent accumulation resulted in removal efficiencies up to 86% and bioconcentration factors (BCF) as high as 621 L/Kg. EDTA extraction showed that 92–96% of Y was located on the seaweed surface across most tested concentrations.
The relative growth rate (RGR) of Ulva sp. after 72 h of exposure was not negatively affected; however, at 500 mg/L, a decrease in pH was observed as well as signs of chlorosis, suggesting a significant impairment in photosynthesis. Biochemical marker analysis revealed oxidative stress and activation of antioxidant defences at intermediate Y concentrations, though these were insufficient to prevent cellular damage. Given that most Y resides on the seaweed surface (confirmed by EDTA and SEM analysis), endogenous defence activation is limited, increasing susceptibility to cellular harm.
These findings highlight the environmental risks posed by Y contamination for seaweed in aquatic and coastal ecosystems. Nevertheless, some limitations must be acknowledged: the short exposure duration (72 h), the use of a single seaweed species, and the controlled laboratory conditions may not fully capture the complexity of natural environments. Future research should therefore include longer-term exposure scenarios, a broader range of ecologically relevant seaweed, and experiments in more realistic mesocosms or field conditions. In addition, evaluating potential trophic transfer and chronic ecological effects would provide a more comprehensive understanding of the risks posed by Y and other REEs. By addressing these aspects, future studies can better inform environmental risk assessments and management strategies for REEs, particularly in regions affected by e-waste and industrial discharges.
Supplementary Materials
The following supporting information can be downloaded at: https://www.mdpi.com/article/10.3390/w17203023/s1, Figure S1: A—Total chlorophyll content (spad value); B—Relative growth rate (%/day) in the seaweed Ulva sp. exposed to different concentrations of Y (0.5; 5.0; 50; 500 mg/L). The results are the means and standard deviation (n = 9); Figure S2: Fraction (%) of aqueous speciation calculation using the VisualMinteq software for average composition of Y at different initial concentrations on real seawater (0.5; 5.0; 50; 500 mg/L). Salinity 10; initial pH 7.8; Table S1: Seawater parameters and major and minor elements concentration; Table S2: p-values obtained through pair-wise comparison tests performed on physiological and biochemical results using PERMANOVA routine from the software PRIMER (PERMANOVA + add-on in PRIMER v6).
Author Contributions
Methodology, R.F., E.P. and B.H.; Validation, T.V., J.C., D.S.T., M.A., N.F., R.F., E.P. and B.H.; Formal analysis, T.V., J.C., D.S.T., M.A., N.F., R.F. and B.H.; Investigation, T.V., J.C., D.S.T., M.A., N.F. and B.H.; Resources, E.P. and B.H.; Writing—original draft, T.V., R.F. and B.H.; Supervision, R.F., E.P. and B.H.; Project administration, E.P. and B.H.; Funding acquisition, E.P. and B.H. All authors have read and agreed to the published version of the manuscript.
Funding
This work received financial support from the European Union (FEDER funds) through the Operational Competitiveness Program (COMPETE2020)-project Nº46998_N9ve-REE and from PT national funds (FCT/MCTES, Fundação para a Ciência e Tecnologia and Ministério da Ciência, Tecnologia e Ensino Superior). Thanks are due for the financial support to REQUIMTE (UID/50006-Laboratório Associado para a Química Verde-Tecnologias e Processos Limpos) and UID Centro de Estudos do Ambiente e Mar (CESAM) (+LA/P/0094/2020).
Data Availability Statement
The original contributions presented in this study are included in the article/Supplementary Material. Further inquiries can be directed to the corresponding author.
Acknowledgments
Thainara Viana, and Nicole Ferreira thanks FCT/MCTES (Fundação para a Ciência e Tecnologia and Ministério da Ciência, Tecnologia e Ensino Superior) and ESF (European Social Fund) through NORTE 2020 (Programa Operacional Região Norte) for their PhD grant ref. 2022.13015.BD (https://doi.org/10.54499/2022.13015.BD), and 2022.13017.BD (https://doi.org/10.54499/2022.13017.BD), respectively.
Conflicts of Interest
The authors declare no conflict of interest.
References
- International Energy Agency. Critical Minerals Market Review 2023; OECD Publishing: Paris, France, 2023. [Google Scholar] [CrossRef]
- Worlanyo, A.S.; Jiangfeng, L. Evaluating the Environmental and Economic Impact of Mining for Post-Mined Land Restoration and Land-Use: A Review. J. Environ. Manag. 2021, 279, 111623. [Google Scholar] [CrossRef] [PubMed]
- UNEP; PACE; ITU; ILO; UNIDO; UNU; UNITAR; WBSCD; WEF. A New Circular Vision for Electronics Time for a Global Reboot; World Economic Forum: Cologny, Switzerland, 2019. [Google Scholar]
- Ackah, M. Informal E-Waste Recycling in Developing Countries: Review of Metal(Loid)s Pollution, Environmental Impacts and Transport Pathways. Environ. Sci. Pollut. Res. 2017, 24, 24092–24101. [Google Scholar] [CrossRef]
- Adeel, M.; Lee, J.Y.; Zain, M.; Rizwan, M.; Nawab, A.; Ahmad, M.A.; Shafiq, M.; Yi, H.; Jilani, G.; Javed, R.; et al. Cryptic Footprints of Rare Earth Elements on Natural Resources and Living Organisms. Environ. Int. 2019, 127, 785–800. [Google Scholar] [CrossRef]
- Sharifi, R.; Moore, F.; Keshavarzi, B. Geochemical Behavior and Speciation Modeling of Rare Earth Elements in Acid Drainages at Sarcheshmeh Porphyry Copper Deposit, Kerman Province, Iran. Geochemistry 2013, 73, 509–517. [Google Scholar] [CrossRef]
- Migaszewski, Z.M.; Gałuszka, A. The Use of Rare Earth Element Profiles as a Proxy for a Fractionation Source and Mine-Waste Provenance. Sci. Total Environ. 2023, 901, 166517. [Google Scholar] [CrossRef]
- Migaszewski, Z.M.; Gałuszka, A.; Dołęgowska, S. Rare Earth and Trace Element Signatures for Assessing an Impact of Rock Mining and Processing on the Environment: Wiśniówka Case Study, South-Central Poland. Environ. Sci. Pollut. Res. 2016, 23, 24943–24959. [Google Scholar] [CrossRef] [PubMed]
- Kulaksiz, S.; Bau, M. Rare Earth Elements in the Rhine River, Germany: First Case of Anthropogenic Lanthanum as a Dissolved Microcontaminant in the Hydrosphere. Environ. Int. 2011, 37, 973–979. [Google Scholar] [CrossRef] [PubMed]
- Kraemer, D.; Schmidt, K.; Klimpel, F.; Rauch, U.; Ernst, D.M.; Paul, S.A.L.; Haeckel, M.; Koschinsky, A.; Bau, M. Tracking the Distribution of Persistent and Mobile Wastewater-Derived Substances in the Southern and Central North Sea Using Anthropogenic Gadolinium from MRI Contrast Agents as a Far-Field Tracer. Mar. Pollut. Bull. 2024, 207, 116794. [Google Scholar] [CrossRef]
- Liang, C.L.; Shen, J.L. Removal of Yttrium from Rare-Earth Wastewater by Serratia Marcescens: Biosorption Optimization and Mechanisms Studies. Sci. Rep. 2022, 12, 4861. [Google Scholar] [CrossRef]
- Cardon, P.-Y.; Triffault-Bouchet, G.; Caron, A.; Rosabal, M.; Fortin, C.; Amyot, M. Toxicity and Subcellular Fractionation of Yttrium in Three Freshwater Organisms: Daphnia Magna, Chironomus Riparius, and Oncorhynchus Mykiss. ACS Omega 2019, 4, 13747–13755. [Google Scholar] [CrossRef]
- Revel, M.; van Drimmelen, C.K.E.; Weltje, L.; Hursthouse, A.; Heise, S. Effects of Rare Earth Elements in the Aquatic Environment: Implications for Ecotoxicological Testing. Crit. Rev. Environ. Sci. Technol. 2025, 55, 334–375. [Google Scholar] [CrossRef]
- Viana, T.; Almeida, R.; Figueira, P.; Rocha, L.; Neves, M.C.; Freitas, R.; Freire, M.; Henriques, B.; Pereira, E. Removal of Mercury by Silica-Supported Ionic Liquids: Efficiency and Ecotoxicological Assessment. Aquat. Toxicol. 2023, 261, 106611. [Google Scholar] [CrossRef]
- Kumar, M.; Kumari, P.; Reddy, C.R.K.; Jha, B. Salinity and Desiccation Induced Oxidative Stress Acclimation in Seaweeds. In Advances in Botanical Research; Academic Press: Cambridge, MA, USA, 2014; Volume 71, pp. 91–123. [Google Scholar]
- Rodrigues, M.; Oliveira, A.; Queiroga, H.; Brotas, V. Seasonal and Diurnal Water Quality and Ecological Dynamics along a Salinity Gradient (Mira Channel, Aveiro Lagoon, Portugal). Procedia Environ. Sci. 2012, 13, 899–918. [Google Scholar] [CrossRef]
- Migaszewski, Z.M.; Gałuszka, A. The Characteristics, Occurrence, and Geochemical Behavior of Rare Earth Elements in the Environment: A Review. Crit. Rev. Environ. Sci. Technol. 2015, 45, 429–471. [Google Scholar] [CrossRef]
- Pinto, J.; Colónia, J.; Viana, T.; Ferreira, N.; Tavares, D.; Jacinto, J.; Abdolvasei, A.; Monteiro, F.L.; Henriques, B.; Pereira, E. Potential of the Macroalga Ulva sp. for the Recovery of Yttrium Obtained from Fluorescent Lamp Waste. J. Clean. Prod. 2022, 369, 133299. [Google Scholar] [CrossRef]
- Vaz, G.V.; Pontes, F.V.M.; Salgado, L.A.B.; Carneiro, M.C.; Paulino, J.F. A Novel Method for Leaching Rare Earth Element from Fluorescent Lamp Waste via Acid Fusion. Hydrometallurgy 2025, 232, 106420. [Google Scholar] [CrossRef]
- Carvalho, L.; Reis, A.T.; Soares, E.; Tavares, C.; Monteiro, R.J.R.; Figueira, P.; Henriques, B.; Vale, C.; Pereira, E. A Single Digestion Procedure for Determination of Major, Trace, and Rare Earth Elements in Sediments. Water Air Soil Pollut. 2020, 231, 541. [Google Scholar] [CrossRef]
- Viana, T.; Henriques, B.; Ferreira, N.; Pinto, R.J.B.; Monteiro, F.L.S.; Pereira, E. Insight into the Mechanisms Involved in the Removal of Toxic, Rare Earth, and Platinum Elements from Complex Mixtures by Ulva sp. Chem. Eng. J. 2023, 453, 139630. [Google Scholar] [CrossRef]
- Nowicka, B. Heavy Metal–Induced Stress in Eukaryotic Algae—Mechanisms of Heavy Metal Toxicity and Tolerance with Particular Emphasis on Oxidative Stress in Exposed Cells and the Role of Antioxidant Response. Environ. Sci. Pollut. Res. 2022, 29, 16860–16911. [Google Scholar] [CrossRef]
- Ajitha, V.; Sreevidya, C.P.; Sarasan, M.; Park, J.C.; Mohandas, A.; Singh, I.S.B.; Puthumana, J.; Lee, J.-S. Effects of Zinc and Mercury on ROS-Mediated Oxidative Stress-Induced Physiological Impairments and Antioxidant Responses in the Microalga Chlorella Vulgaris. Environ. Sci. Pollut. Res. 2021, 28, 32475–32492. [Google Scholar] [CrossRef]
- Kumar, M.; Kumari, P.; Gupta, V.; Anisha, P.A.; Reddy, C.R.K.; Jha, B. Differential Responses to Cadmium Induced Oxidative Stress in Marine Macroalga Ulva lactuca (Ulvales, Chlorophyta). BioMetals 2010, 23, 315–325. [Google Scholar] [CrossRef]
- Beauchamp, C.; Fridovich, I. Superoxide Dismutase: Improved Assays and an Assay Applicable to Acrylamide Gels. Anal. Biochem. 1971, 44, 276–287. [Google Scholar] [CrossRef]
- Johansson, L.H.; Håkan Borg, L.A. A Spectrophotometric Method for Determination of Catalase Activity in Small Tissue Samples. Anal. Biochem. 1988, 174, 331–336. [Google Scholar] [CrossRef]
- Habig, W.H.; Pabst, M.J.; Jakoby, W.B. Glutathione S-Transferases. J. Biol. Chem. 1974, 22, 7130–7139. [Google Scholar] [CrossRef]
- Carregosa, V.; Velez, C.; Soares, A.M.V.M.; Figueira, E.; Freitas, R. Physiological and Biochemical Responses of Three Veneridae Clams Exposed to Salinity Changes. Comp. Biochem. Physiol. Part B Biochem. Mol. Biol. 2014, 177–178, 1–9. [Google Scholar] [CrossRef]
- Mcfarland, V.A.; Inouye, L.S.; Lutz, C.H.; Jarvis, A.S.; Clarke, J.U.; Mccant, D.D. Biomarkers of Oxidative Stress and Genotoxicity in Livers of Field-Collected Brown Bullhead, Ameiurus Nebulosus Environmental Contamination and Toxicology. Environ. Contam. Toxicol. 1999, 37, 236–241. [Google Scholar] [CrossRef]
- Ohkawa, H.; Ohishi, N.; Yagi, K. Assay for Lipid Peroxides in Animal Tissues by Thiobarbituric Acid Reaction. Anal. Biochem. 1979, 95, 351–358. [Google Scholar] [CrossRef] [PubMed]
- Anderson, M.J.; Gorley, R.N.; Clarke, K.R. PERMANOVA+ for PRIMER: Guide to Software and Statistical Methods; Primer Ltd.: Plymouth, UK, 2008. [Google Scholar]
- Pinto, J.; Costa, M.; Henriques, B.; Soares, J.; Dias, M.; Viana, T.; Ferreira, N.; Vale, C.; Pinheiro-Torres, J.; Pereira, E. Competition among Rare Earth Elements on Sorption onto Six Seaweeds. J. Rare Earths 2021, 39, 734–741. [Google Scholar] [CrossRef]
- Moenne, A.; González, A.; Sáez, C.A. Mechanisms of Metal Tolerance in Marine Macroalgae, with Emphasis on Copper Tolerance in Chlorophyta and Rhodophyta. Aquat. Toxicol. 2016, 176, 30–37. [Google Scholar] [CrossRef] [PubMed]
- Volterra, L.; Conti, M.E. Algae as Biomarkers, Bioaccumulators and Toxin Producers. Int. J. Environ. Pollut. 2000, 13, 92. [Google Scholar] [CrossRef]
- Circuncisão, A.; Catarino, M.; Cardoso, S.; Silva, A. Minerals from Macroalgae Origin: Health Benefits and Risks for Consumers. Mar. Drugs 2018, 16, 400. [Google Scholar] [CrossRef]
- Pinto, J.; Henriques, B.; Soares, J.; Costa, M.; Dias, M.; Fabre, E.; Lopes, C.B.; Vale, C.; Pinheiro-Torres, J.; Pereira, E. A Green Method Based on Living Macroalgae for the Removal of Rare-Earth Elements from Contaminated Waters. J. Environ. Manag. 2020, 263, 110376. [Google Scholar] [CrossRef] [PubMed]
- Coelho, J.P.; Pereira, M.E.; Duarte, A.; Pardal, M.A. Macroalgae Response to a Mercury Contamination Gradient in a Temperate Coastal Lagoon (Ria de Aveiro, Portugal). Estuar. Coast. Shelf Sci. 2005, 65, 492–500. [Google Scholar] [CrossRef]
- Fu, Y.; Li, F.; Xu, T.; Cai, S.; Chu, W.; Qiu, H.; Sha, S.; Cheng, G.; Xu, Q. Bioaccumulation, Subcellular, and Molecular Localization and Damage to Physiology and Ultrastructure in Nymphoides peltata (Gmel.) O. Kuntze Exposed to Yttrium. Environ. Sci. Pollut. Res. 2014, 21, 2935–2942. [Google Scholar] [CrossRef]
- Tunali, M.; Yenigun, O. Biosorption of Ag+ and Nd3+ from Single- and Multi-Metal Solutions (Ag+, Nd3+, and Au3+) by Using Living and Dried Microalgae. J. Mater. Cycles Waste Manag. 2021, 23, 764–777. [Google Scholar] [CrossRef]
- Carreira, A.R.F.; Passos, H.; Coutinho, J.A.P. Metal Biosorption onto Non-Living Algae: A Critical Review on Metal Recovery from Wastewater. Green Chem. 2023, 25, 5775–5788. [Google Scholar] [CrossRef]
- Ordóñez, J.I.; Cortés, S.; Maluenda, P.; Soto, I. Biosorption of Heavy Metals with Algae: Critical Review of Its Application in Real Effluents. Sustainability 2023, 15, 5521. [Google Scholar] [CrossRef]
- Sager, M.; Wiche, O. Rare Earth Elements (REE): Origins, Dispersion, and Environmental Implications—A Comprehensive Review. Environments 2024, 11, 24. [Google Scholar] [CrossRef]
- Arienzo, M.; Ferrara, L.; Trifuoggi, M.; Toscanesi, M. Advances in the Fate of Rare Earth Elements, REE, in Transitional Environments: Coasts and Estuaries. Water 2022, 14, 401. [Google Scholar] [CrossRef]
- Ciobanu, A.-A.; Lucaci, A.-R.; Bulgariu, L. Efficient Metal Ions Biosorption on Red and Green Algae Biomass: Isotherm, Kinetic and Thermodynamic Study. J. Appl. Phycol. 2024, 36, 3809–3827. [Google Scholar] [CrossRef]
- Wei, Z.; Hong, F.; Yin, M.; Li, H.; Hu, F.; Zhao, G.; Woonchungwong, J. Subcellular and Molecular Localization of Rare Earth Elements and Structural Characterization of Yttrium Bound Chlorophyll a in Naturally Grown Fern Dicranopteris Dichotoma. Microchem. J. 2005, 80, 1–8. [Google Scholar] [CrossRef]
- Regoli, F.; Giuliani, M.E.; Benedetti, M.; Arukwe, A. Molecular and Biochemical Biomarkers in Environmental Monitoring: A Comparison of Biotransformation and Antioxidant Defense Systems in Multiple Tissues. Aquat. Toxicol. 2011, 105, 56–66. [Google Scholar] [CrossRef] [PubMed]
- Gao, M.; Ling, N.; Tian, H.; Guo, C.; Wang, Q. Toxicity, Physiological Response, and Biosorption Mechanism of Dunaliella Salina to Copper, Lead, and Cadmium. Front. Microbiol. 2024, 15, 1374275. [Google Scholar] [CrossRef] [PubMed]
- Anjum, N.A.; Gill, S.S.; Corpas, F.J.; Ortega-Villasante, C.; Hernandez, L.E.; Tuteja, N.; Sofo, A.; Hasanuzzaman, M.; Fujita, M. Editorial: Recent Insights Into the Double Role of Hydrogen Peroxide in Plants. Front. Plant Sci. 2022, 13, 843274. [Google Scholar] [CrossRef]
- Qi, Y.; Li, X.; Guo, S.; He, F.; Liu, R. Insights into the Potential Toxicity of Zn(II) to Catalase and Their Binding Mechanisms. J. Mol. Liq. 2024, 394, 123760. [Google Scholar] [CrossRef]
- Park, H.; Kim, H.-S.; Abassi, S.; Bui, Q.T.N.; Ki, J.-S. Two Novel Glutathione S-Transferase (GST) Genes in the Toxic Marine Dinoflagellate Alexandrium Pacificum and Their Transcriptional Responses to Environmental Contaminants. Sci. Total Environ. 2024, 915, 169983. [Google Scholar] [CrossRef]
- Rahhou, A.; Layachi, M.; Akodad, M.; El Ouamari, N.; Rezzoum, N.E.; Skalli, A.; Oudra, B.; El Bakali, M.; Kolar, M.; Imperl, J.; et al. The Bioremediation Potential of Ulva lactuca (Chlorophyta) Causing Green Tide in Marchica Lagoon (NE Morocco, Mediterranean Sea): Biomass, Heavy Metals, and Health Risk Assessment. Water 2023, 15, 1310. [Google Scholar] [CrossRef]
- Lee, H.; Kim, G.; Depuydt, S.; Shin, K.; Han, T.; Park, J. Metal Toxicity across Different Thallus Sections of the Green Macroalga, Ulva Australis. Toxics 2023, 11, 548. [Google Scholar] [CrossRef]
- Figueiredo, C.; Grilo, T.F.; Oliveira, R.; Ferreira, I.J.; Gil, F.; Lopes, C.; Brito, P.; Ré, P.; Caetano, M.; Diniz, M.; et al. A Triple Threat: Ocean Warming, Acidification, and Rare Earth Elements Exposure Triggers a Superior Antioxidant Response and Pigment Production in the Adaptable Ulva Rigida. Environ. Adv. 2022, 8, 100235. [Google Scholar] [CrossRef]
- Henriques, B.; Morais, T.; Cardoso, C.E.D.; Freitas, R.; Viana, T.; Ferreira, N.; Fabre, E.; Pinheiro-Torres, J.; Pereira, E. Can the Recycling of Europium from Contaminated Waters Be Achieved through Living Macroalgae? Study on Accumulation and Toxicological Impacts under Realistic Concentrations. Sci. Total Environ. 2021, 786, 147176. [Google Scholar] [CrossRef]
- Long, A.; Zhang, J.; Yang, L.-T.; Ye, X.; Lai, N.-W.; Tan, L.-L.; Lin, D.; Chen, L.-S. Effects of Low PH on Photosynthesis, Related Physiological Parameters, and Nutrient Profiles of Citrus. Front. Plant Sci. 2017, 8, 185. [Google Scholar] [CrossRef]
- Alp, F.N.; Arikan, B.; Ozfidan-Konakci, C.; Gulenturk, C.; Yildiztugay, E.; Turan, M.; Cavusoglu, H. Hormetic Activation of Nano-Sized Rare Earth Element Terbium on Growth, PSII Photochemistry, Antioxidant Status and Phytohormone Regulation in Lemna Minor. Plant Physiol. Biochem. 2023, 194, 361–373. [Google Scholar] [CrossRef]
- Cheng, J.; Du, X.; Long, H.; Zhang, H.; Ji, X. The Effects of Exogenous Cerium on Photosystem II as Probed by in Vivo Chlorophyll Fluorescence and Lipid Production of Scenedesmus Obliquus XJ002. Biotechnol. Appl. Biochem. 2020, 68, 1216–1226. [Google Scholar] [CrossRef] [PubMed]
- Liu, D.; Wang, X.; Chen, Z. Effects of Rare Earth Elements and REE-Binding Proteins on Physiological Responses in Plants. Protein Pept. Lett. 2012, 19, 198–202. [Google Scholar] [CrossRef] [PubMed]
- Zicari, M.A.; D’Aquino, L.; Paradiso, A.; Mastrolitti, S.; Tommasi, F. Effect of Cerium on Growth and Antioxidant Metabolism of Lemna minor L. Ecotoxicol. Environ. Saf. 2018, 163, 536–543. [Google Scholar] [CrossRef] [PubMed]
- Chen, C.; Zhang, Y.; Feng, Z.; Wu, M.; Xu, T.; Qiao, S.; Wang, W.; Ma, J.; Xu, J. Photosynthetic Physiological Response of Porphyra Yezoensis to Light Change at Different CO2 Concentrations. Water 2023, 15, 781. [Google Scholar] [CrossRef]
- Zerveas, S.; Mente, M.S.; Tsakiri, D.; Kotzabasis, K. Microalgal Photosynthesis Induces Alkalization of Aquatic Environment as a Result of H+ Uptake Independently from CO2 Concentration—New Perspectives for Environmental Applications. J. Environ. Manag. 2021, 289, 112546. [Google Scholar] [CrossRef]


Disclaimer/Publisher’s Note: The statements, opinions and data contained in all publications are solely those of the individual author(s) and contributor(s) and not of MDPI and/or the editor(s). MDPI and/or the editor(s) disclaim responsibility for any injury to people or property resulting from any ideas, methods, instructions or products referred to in the content. |
© 2025 by the authors. Licensee MDPI, Basel, Switzerland. This article is an open access article distributed under the terms and conditions of the Creative Commons Attribution (CC BY) license (https://creativecommons.org/licenses/by/4.0/).