Article

Geochemical Exploration Techniques with Deep Penetration: Implications for the Exploration of Concealed Potash Deposits in the Covered Area on the Southern Margin of the Kuqa Basin

1
Urumqi Comprehensive Survey Center on Natural Resources, China Geological Survey, Innovation Base of Metallogenic Prediction and Prospecting in Central Asia Orogenic Belt, Urumqi 830057, China
2
School of Environmental Studies, China University of Geosciences (Wuhan), Wuhan 430074, China
3
Institute of Mineral Resource, Chinese Academy of Geological Sciences, Beijing 100037, China
4
School of Geology and Mining Engineering, Xinjiang University, Urumqi 830017, China
*
Author to whom correspondence should be addressed.
Water 2025, 17(3), 298; https://doi.org/10.3390/w17030298
Submission received: 10 November 2024 / Revised: 2 January 2025 / Accepted: 14 January 2025 / Published: 22 January 2025

Abstract

:
In recent years, deep–penetrating geochemical exploration techniques have played a crucial role in the detection of concealed minerals. These methods effectively detect deep−seated anomalies and have been tested in various landscape–covered areas, yielding remarkable results. This study focuses on the covered areas of the southern margin of the Kuqa Basin, utilizing deep–penetrating geochemical methods for systematic sampling to explore concealed potassium salt. This study examines the chemical composition of several underground brine samples, revealing salinity levels ranging from 9.41 to 26.16 g/L and potassium concentrations of between 0.04 and 0.22 g/L. The hydrochemical coefficients indicate a high nNa+/nCl value, with low K+ × 103/Cl values. The average nNa+/nCl ratio is approximately 0.97, and the Br × 103/C1 value is about 0.07. The brine samples fall within the halite phase region of the Quaternary system Na+, K+, Mg2+//C1–H2O at 25 °C, concentrated at the high Na terminal, suggesting halite dissolution. In the metastable phase diagram of the Na+, K+, Mg2+//C1, SO42−–H2O five−element water system, all the brine samples were cast in the glauberite phase area, which may indicate that the shallow underground brine is still in the initial stage of potassium salt deposition. The underground brine mainly dissolved and filtered the stone salt in the formation during the process of runoff underground and then was squeezed by the strong active structure and discharged to the surface along the formation fault or fissure channel. The deep–penetration geochemical survey of the fracture reveals that certain profile points show significantly higher potassium and other salt contents than others, indicating a potassium anomaly. This suggests the potential ascent and migration of potassium–rich brine along deep fracture segments, providing preliminary evidence of potassium richness in the Kuqa Basin’s depths and offering significant guidance for key exploration areas in potassium salt prospecting.

1. Introduction

Potassium salt is the primary raw material for producing potash fertilizer, which is a crucial strategic resource for ensuring national food security. China, being a country with a large population and significant agricultural activities, considers food security as a fundamental aspect of its national stability. However, a widespread potassium deficiency is present in China’s arable land. Potassium salt is often referred to as the “grain of grains”, and it is one of the seven major scarce minerals in the country. Currently, China has about 1 billion tons of KCl resources/reserves identified within 200 m of the surface which are primarily distributed in continental salt lakes like those in Qaidam Basin and Lop Nur, where two large potassium salt bases have been established. Additionally, after over fifty years of research and exploration, the resources and mineralization patterns of shallow continental salt lakes in China have been largely understood, making significant breakthroughs in further exploration challenging [1]. The current self–sufficiency rate of potash fertilizer in our country is 50%. It is predicted that the production scale of the aforementioned two major bases can only be sustained for 20–30 years [2]. Therefore, it is necessary to focus on exploring domestic ancient salt basins for potash in order to change the long–term shortage of potash fertilizer in our country and ensure food security.
The conventional geochemical exploration methods have limited or no effectiveness for exploring concealed mineral deposits, particularly those covered deeply by quaternary sediments. To overcome this barrier and provide direct and effective prospecting indicators and theoretical support for exploration in different landscape areas, it is essential to introduce a geochemical exploration technique capable of penetrating cover layers to identify anomalous information emitted by deep–seated mineral deposits at the surface. The deep–penetrating geochemical method proposed by Wang Xueqiu’s team in China has proven to be effective in exploring concealed deposits beneath cover layers, yielding significant results [3,4,5,6,7,8,9]. Deep−penetrating geochemistry is a geochemical exploration theory and method that involves identifying subtle anomaly information of ore−forming elements in surface media to locate deep concealed ore bodies [10,11,12,13,14,15]. The deep penetration geochemical exploration methods mainly include the mobile metal ion measurement method [16], ground–air measurement method [17], electrical geochemical survey methods [10], Enzyme extraction method [18], Active metal ion method [19], Measurement methods for soil fine particles, etc. [20]. The soil fine particle separation measurement technology proposed in recent years has been effectively validated in the exploration of resources such as gold mines, copper mines, and uranium mines [21,22,23], However, there is relatively little research on the application of potassium salt prospecting. The deep penetration geochemical method for potassium exploration in basin faults, first proposed by Liu Chenglin and others, involves the deep penetration geochronological technology in fault zones. Within salt−bearing basins, there is usually a systematic development of faults that penetrate the basement and salt–bearing strata. Potassium salts within the stratigraphy are leached to the shallow surface by atmospheric circulation water, or brine is brought to the surface. This method captures potential source information from the deep subsurface through surface element anomalies, reduces the cost of mineral exploration, and delineates potassium exploration targets and their depths [24].
The Tarim Basin in Xinjiang is one of the largest regions in China with the greatest potential for potassium salt mineralization and prospecting. The adjacent regions in Central Asia, connected with the Tarim Basin, are extremely rich in mineral resources, yielding a series of giant and world–class potassium salt deposits, such as the Kara Kum Basin, the Afghanistan–Tajikistan Basin, with potassium salt reserves reaching hundreds of billions of tons. The Luobu Lake potassium salt deposit, located at the eastern end of the Tarim Basin, has about 500 million tons of potassium salt reserves, forming the eye−catching “Central Asia–Tarim Basin Salt Lake Chain.” [25,26]. However, the exploration and research levels in the central and western parts of the Tali Basin, which is within the same mineralization area, are relatively low, showing a significant asymmetry in potassium salt reserves. There are high expectations for breakthroughs in the discovery of large to super–large potassium salt deposits. The Kuqa Basin is located in the northern part of the Tarim Basin and is the region with the highest potassium prospecting potential in the Tarim Basin [27]. During the Paleogene to Neogene period, the invasion of the Tethys Ocean into the Kuqa Basin continuously brought abundant salt minerals; a long–term arid climate accelerated the formation of salt–bearing strata. For example, the Paleogene Kumuguleimu Formation (thickness of about 2200 m) and the Neogene Jidiqi Formation (thickness of about 1100 m) [28]; a variety of potassium minerals such as potassium salt, potassium nitrate, potassium salt magnesite, and halite have been discovered in the salt outcrops and drilling cuttings of oil and gas wells in the Kuqa Basin [27,29]. These discoveries all indicate that the northern part of the Kuqa Basin has multiple potassium–bearing horizons and prospective areas [26,30,31]. At the same time, due to structural migration, the southern subsidence area of the Kuqa depression may also undergo potassium migration and possibly form a mineralized area with considerable exploration potential [26,32,33]. Due to the southern part of the Kuqa Basin being covered by quaternary sediments, traditional geochemical exploration methods are insufficient. In response, the author conducted systematic deep–penetration geochemical sampling work in the southern margin area of the Kuqa Basin. Chemical composition studies have been conducted on the groundwater extracted from the surface cover. This is aimed to provide a basis for the layout and delineation of potassium well locations and the identification of potassium target areas. Meanwhile, this work is of significant importance for the research and development of deep potassium salt geochemical exploration technologies in covered areas.

2. Geological Background

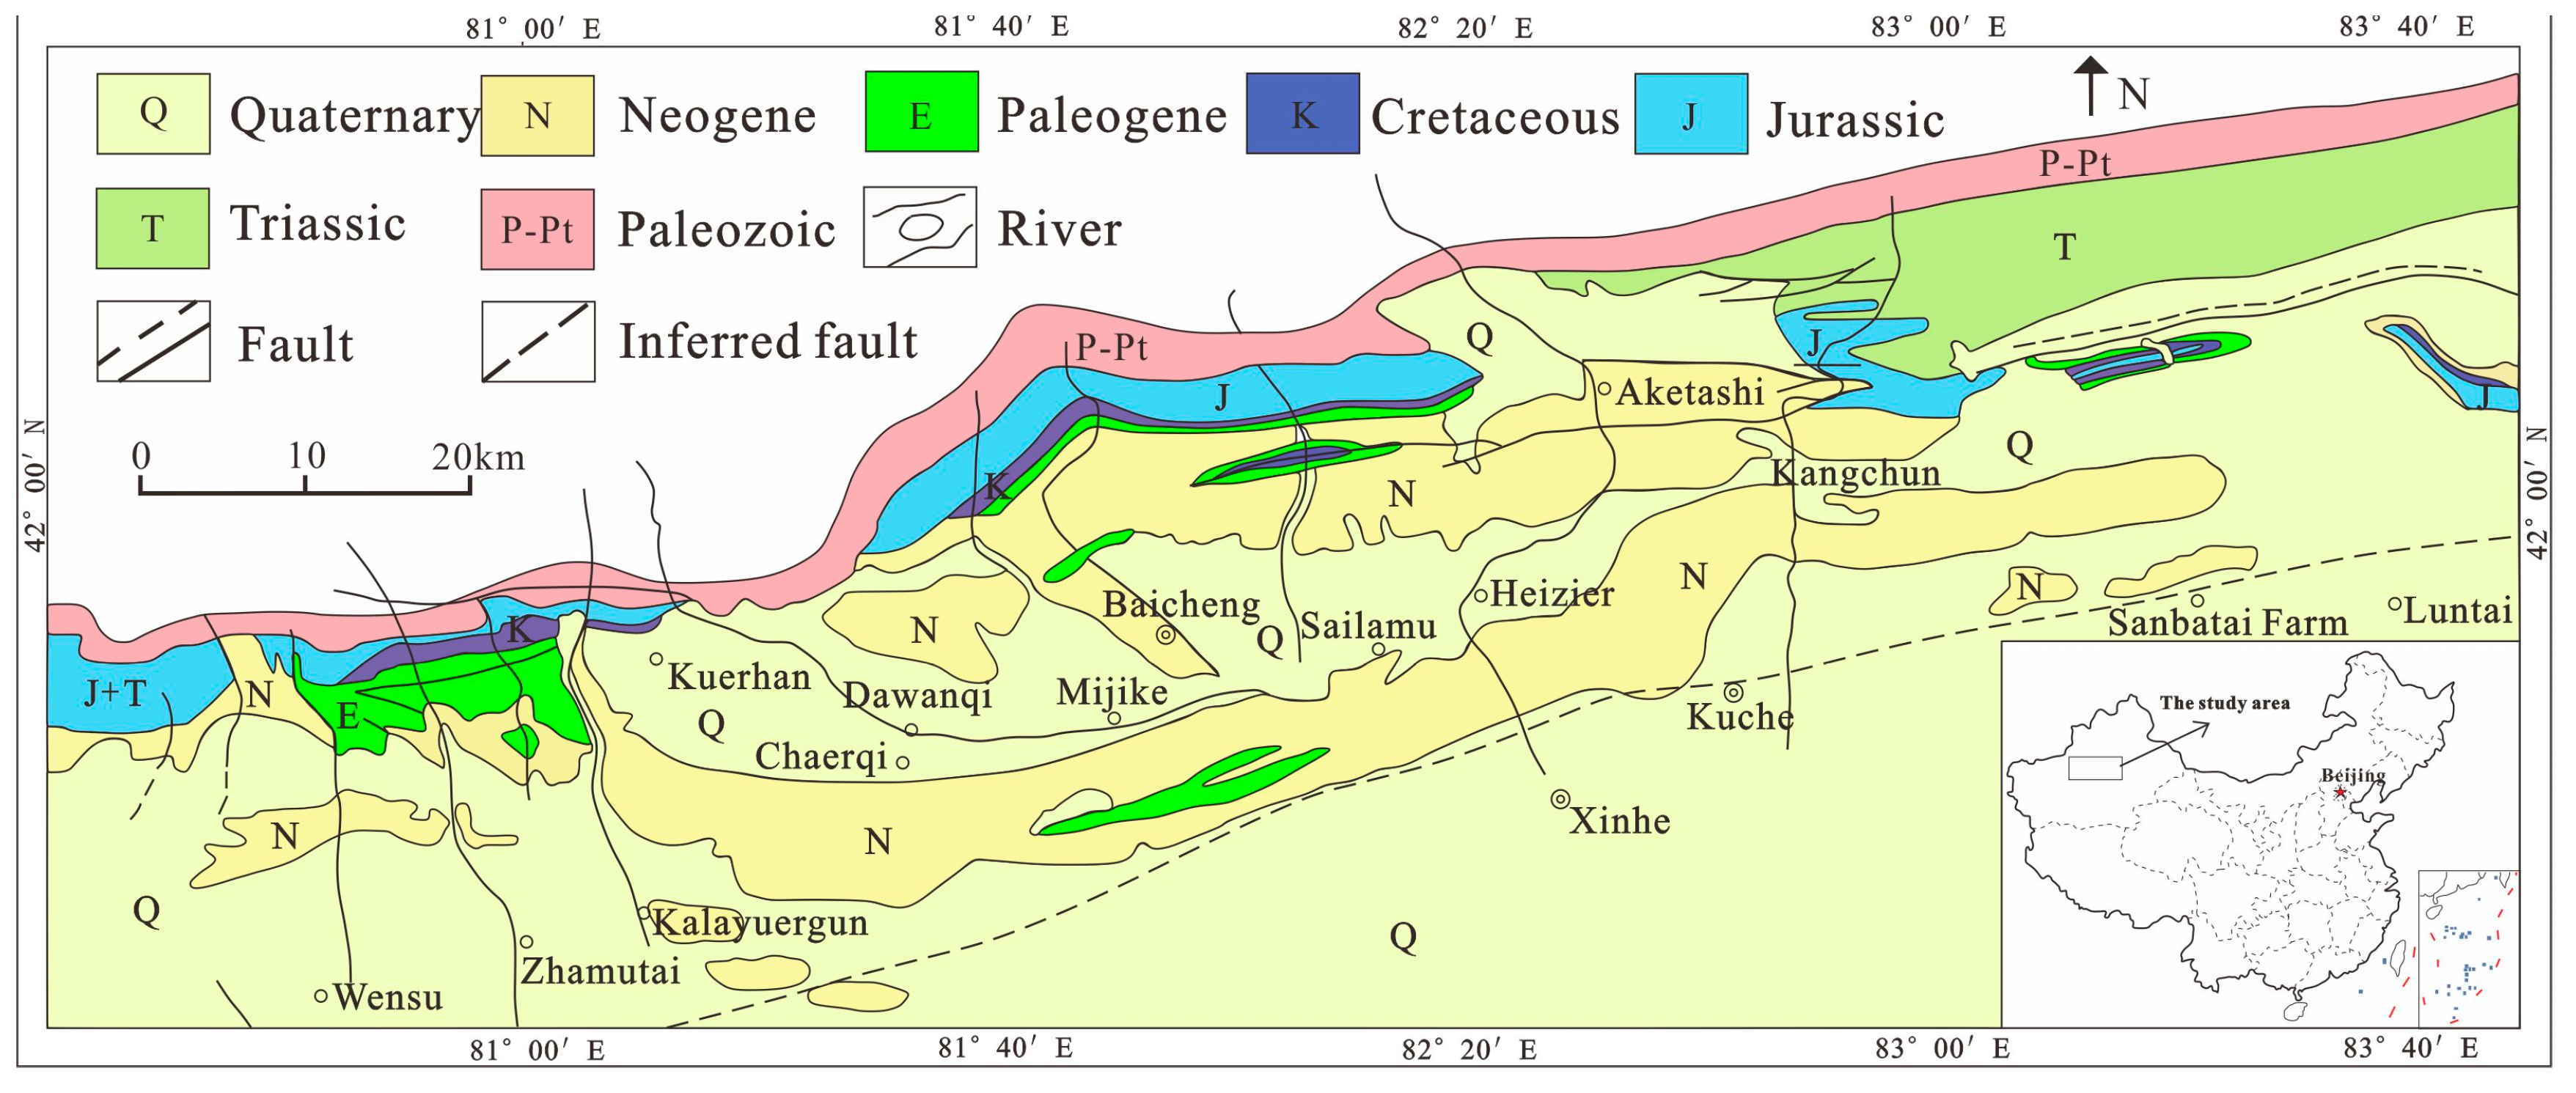
2.1. Regional Geological Background

The Kucha Basin was formed in the Mesozoic and Cenozoic continental sedimentary depression on the southern slope of the Tianshan Mountains and is an important tectonic unit in the Tarim Basin [34,35,36]. The Kucha Basin is generally a long, narrow foreland depression, with its northern boundary being defined by the Tianshan Mountains’ thrust edge to the south and extending to the northern uplift of the Tarim Basin. It is about 70 km wide and 150 km long from east to west, covering an area of approximately 30,000 km2 (Figure 1). The Kucha Basin has the characteristic of being relatively wider in the central part and significantly narrower on both the eastern and western sides, showing an NEE–oriented strip–like distribution; additionally, along the structural trend, it appears in a “lotus node” pattern [37].
The Cretaceous and Paleogene strata in the Kuqa Basin are fully exposed, including the Permian, Triassic, Jurassic, Cretaceous, Paleogene, Neogene, and quaternary systems [38]. The Paleogene system is mainly composed of fluvial and lacustrine deposits, with the lower Kumuguleimu Formation developing thick evaporite deposits and the upper part containing a small amount of salt rock, anhydrite, fine sandstone, siltstone, and mudstone deposits; the Neogene system has fluvial and lacustrine deposits at the lower part, with the Jidike Formation developing thick salt and gypsum deposits, while, at the upper part, it has alluvial fan deposits, with the alluvial materials consisting of conglomerates, gravel−bearing sandstones, and siltstones interlayered with mudstones [39].
Under the north–south compressive stress between the Tian Shan block and the Tarim block, the Kuqa Basin developed two basic sets of fault structures: northwest–southeast trending faults and northeast–southwest trending faults. The main northwest–southeast trending faults include the Kalayuergun strike–slip fault, the Kangcun strike−slip fault, and the Tugerming strike−slip fault. The main northeast–southwest trending faults include the foothill thrust fault in the northeast of the basin, the Kasanto Thrust Fault in the central−northern part, the Qiulitage Thrust Fault, and the East Qiulitage Thrust Fault [40].
The Kuqa Basin has received abundant salt materials during multiple transgressive and regressive processes of the Late Cretaceous to Paleocene [26]. Additionally, the arid and hot climatic conditions during that period led to the widespread development of evaporite deposits within the basin, which possess macroscopic conditions, such as climatic, tectonic, and provenance, for the formation of potassium salts. Therefore, it has always been a key prospective area for potassium exploration in China. Previous studies in the Kuqa Basin have been extensive. For instance, in the Eocene strata of the western part of the Kuqa Basin and in the cores of potassium salt scientific exploration wells, minerals such as sylvite, potassium chloride, potassium anhydrite, and polyhalite were found [41,42,43,44]. Solid and hydrothermal geochemical studies indicate that the ancient salt lake in the Kuqa Basin had a high degree of evaporation which was conducive to potassium formation [45]. An analysis of halite fluid inclusions revealed that the potassium content in the Eocene brine of the ancient Kuqa salt lake had reached the stage of potassium salt precipitation [30,31]. All these studies show that the Kuqa Basin has significant potential and prospects for potassium formation.

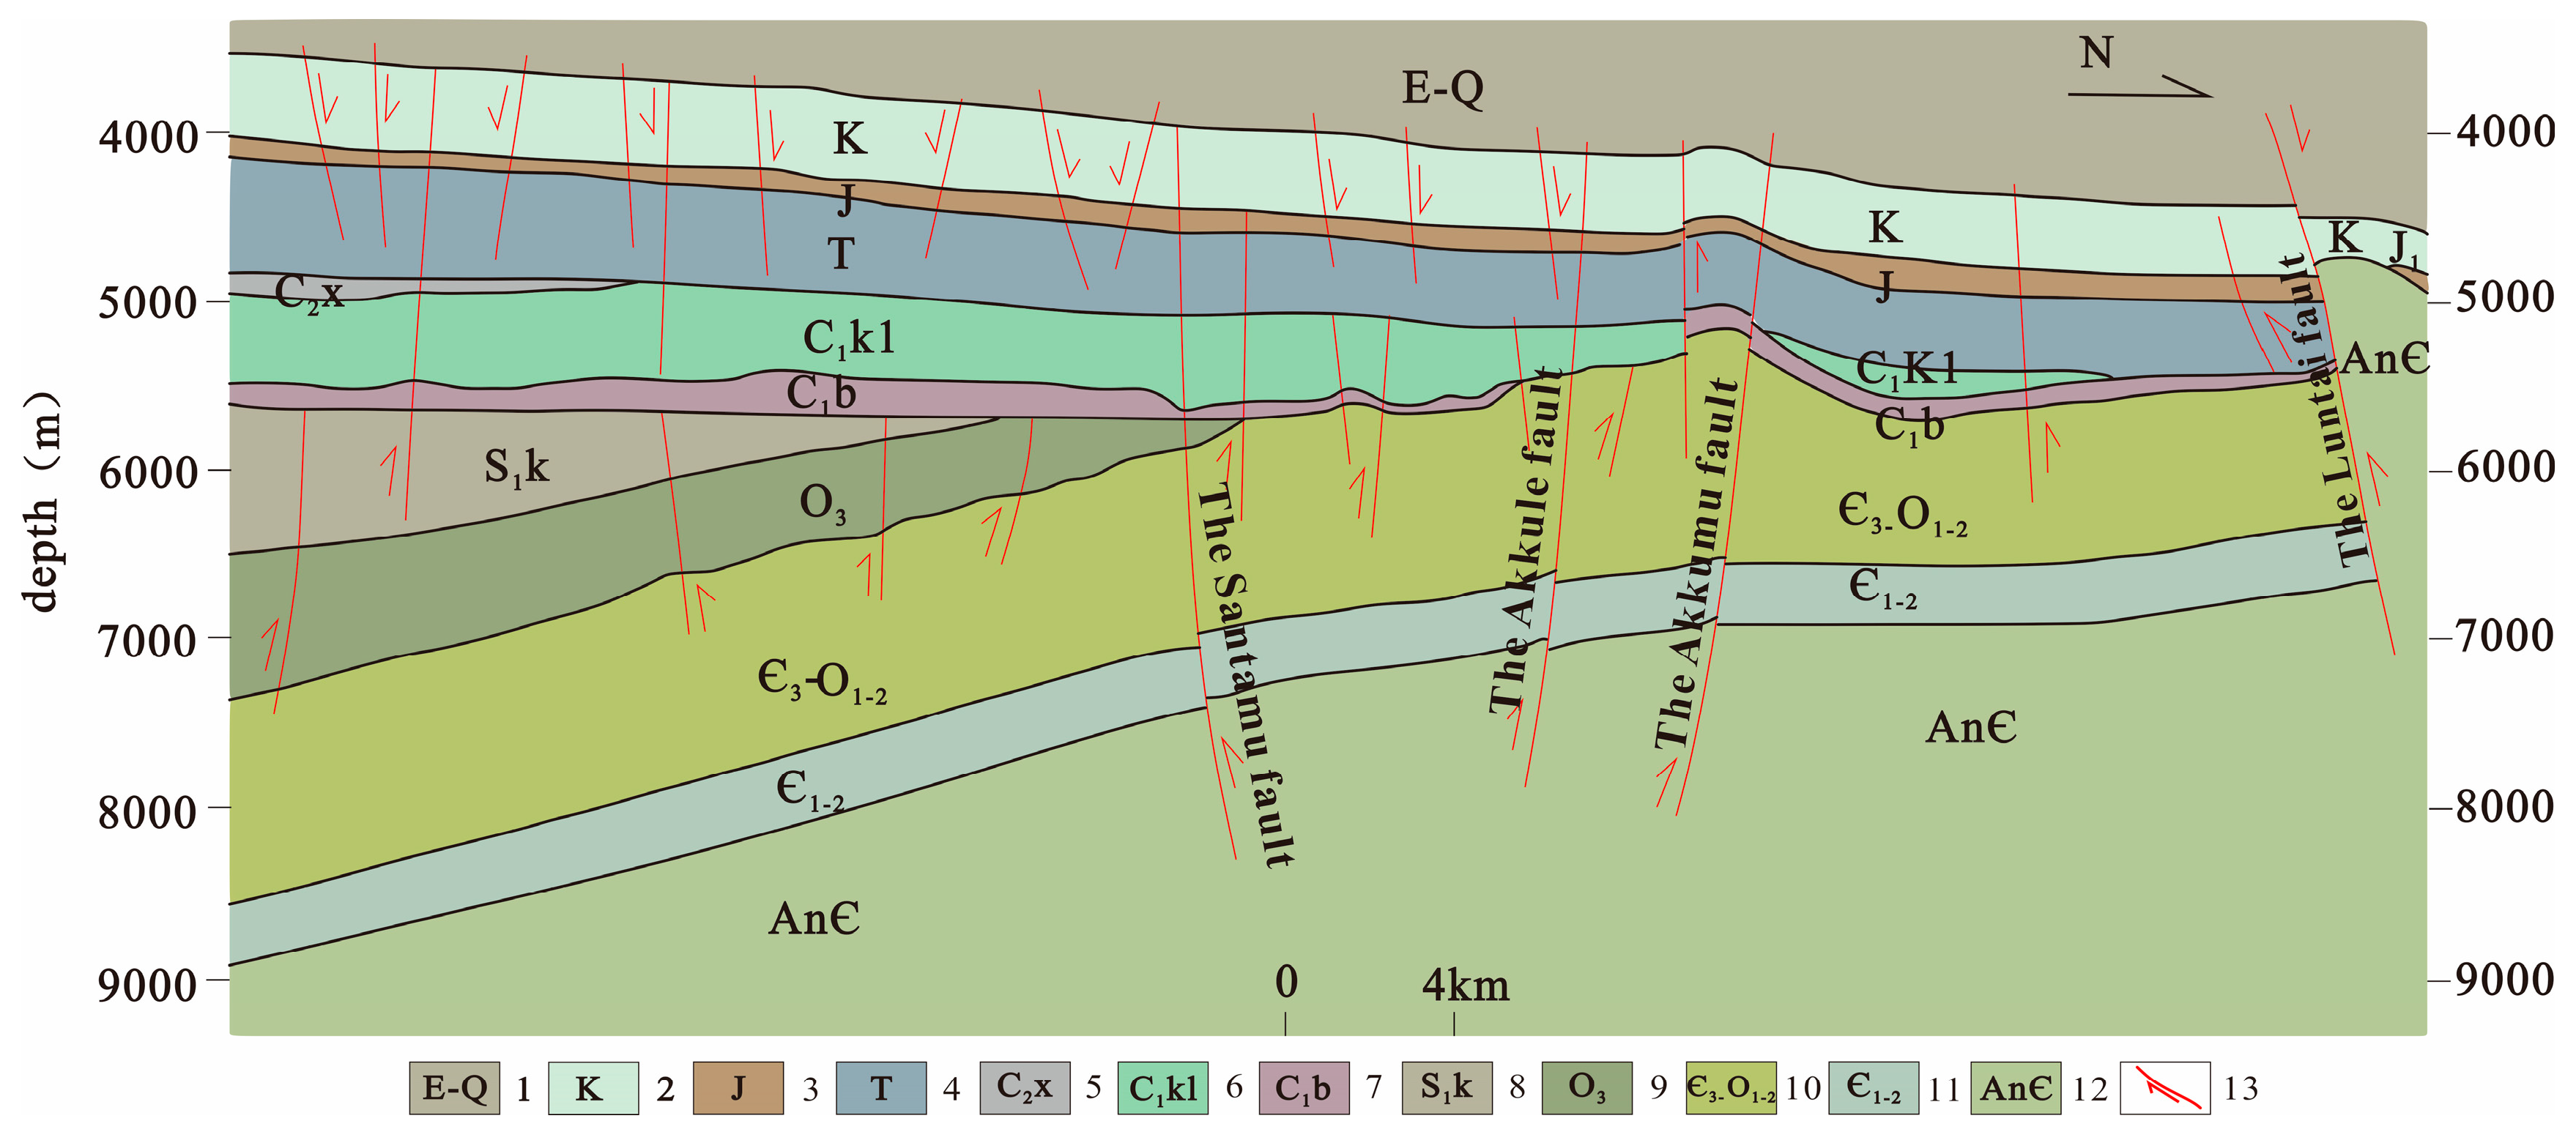
2.2. Geological Landform and Fracture Tectonic Characteristics of the Study Area

The study area is located in the Shuntogule low uplift belt in the central part of the Tarim Basin. To the north, it borders the Shaya Uplift, to the south, it connects with the Karez Uplift, to the east, it faces the Manggai Depression, and to the west, it is adjacent to the Awati Depression [46]. The study area is situated in an inland arid and desertified closed drainage basin covered by deserts throughout the year. The Tarim River flows from northwest to southeast through the study area. The average precipitation is low, and the evaporation is much greater than the precipitation. Within the Shuntogule low uplift, a large number of strike−slip fault systems have developed. To the east of the Shunbei No. 5 strike−slip fault zone, a northeast to southwest trending strike−slip fault system is developed, mainly including the No. 1, 4, 8, and 12 strike−slip fault zones. To the west, a northwest to southeast trending strike−slip fault system is present, mainly including the No. 7, 9, and 11 strike−slip fault zones (Figure 2). Due to tectonic compression, the northern part of the Kuqa Basin uplifted and folded at the end of the Neogene, while the southern part (the Shaya area) experienced significant subsidence. The Xianshan Late period formed a graben−type fault zone in the southern part of the Kuqa Basin (the Shaya area) [26] (Figure 3), which may control the formation of secondary depressions in the southern region during the late Neogene period.
Previous studies suggest that the ancient salt lake remnants and salt–weathering products in the northern part of the Kuqa Basin were largely transported to the southern part (the Shaya area) of the graben–type secondary depression and that deep fluids may also migrate along the graben–type fault zones [32]. Among them, the exploration of oil and gas in the No. 1, 5, 7, 4, and 8 strike−slip fault zones in this region has achieved breakthroughs [46]. This demonstrates the tremendous potential for potassium salt mineralization in the study area. Based on this, the current research has arranged three deep penetration geochemical profiling lines in this area, aiming to provide clues for the exploration of potassium salt deposits in the region.

3. The Collection and Analysis of Samples

By studying the materials of predecessors and conducting remote sensing interpretations, the distribution characteristics of fault structures in the study area were determined. This research work deployed three deep penetration geochemical profiles along the tectonic fault zone in the working area (Figure 2). The starting coordinates of the No. 1 profile are 82°34′31.80″, 40°15′51.82″, and the ending coordinates are 82°41′30.76″, 40°15′52.26″. The sampling depth ranges from 0.67 to 4 m, with an average depth of 1.74 m. The starting coordinates of the No. 2 profile are 82°39′5.32″, 40°31′57.95″, and the ending coordinates are 82°44′56.44″, 40°31′56.37″. The sampling depth ranges from 1.02 to 4 m, with an average depth of 2.28 m. The starting coordinates of the No. 3 profile are 83°28′47.95″, 40°16′19.84″, and the ending coordinates are 83°37′23.62″, 40°16′9.48″. The sampling depth ranges from 1.45 to 3.96 m, with an average depth of 2.02 m. A total of 150 underground brine samples were collected, including 43 samples from the first profile group, 47 samples from the second profile group, and 60 samples from the third profile group. Each sample is about 0.5 kg.
Sample Collection Method: Samples were collected using a portable groundwater−sampling device (Figure 4). Deploy two survey lines, P1 and P2, on the fifth fault zone, and one survey line, P3, on the fourth fault zone. The sampling points near the fault zone are spaced at 125 m, with a relatively high density, while the sampling points far from the fault zone are spaced at 250 m, with a reduced density. Place the brine samples into plastic bottles that have been cleaned with brine and simultaneously record the stratigraphic position and depth information of the brine. Seal the obtained brine water samples and return them to the laboratory for sample processing.
The testing work for all brine samples was completed at the Testing Center of the Nonferrous Geology Survey Bureau of the Xinjiang Uygur Autonomous Region. The analysis and testing of major ions (K+, Na+, Ca2+, Mg2+, Cl, SO42−, HCO3) and trace ions (Br) in underground brine, as well as cross–checks of all results, were conducted. The major ions (K+, Ca2+, Na+, Mg2+) were determined by inductively coupled plasma emission spectrometry; the major ion (Cl) was determined by nitric acid potentiometric titration; the major ion (SO42−) was determined by a conventional gravimetric method; the major ion (HCO3) was determined by hydrochloric acid titration; and the trace ion (Br) was determined by atomic absorption spectrometry.

4. Analysis Results

The analysis results of the major and trace ions in the samples are shown in Table 1, Table 2 and Table 3. The K+ concentration in Line 1 ranges from 0.06 to 0.17 g/L, with an average of 0.1 g/L. The Na+ concentration is between 0.85 and 7.44 g/L, with an average of 3.44 g/L. The Ca2+ concentration is between 0.02 and 0.47 g/L, with an average of 0.20 g/L. The Mg2+ concentration is between 0.08 and 0.6 g/L, with an average of 0.35 g/L. The Cl concentration is between 1.19 and 11.32 g/L, with an average of 4.87 g/L. The SO42− concentration is between 0.28 and 4.59 g/L, with an average of 2.45 g/L. The Br concentration is between 0.03 and 0.7 mg/L, with an average of 0.42 mg/L.
The K+ content in line No. 2 ranges from 0.06 to 0.22 g/L, with an average of 0.11 g/L. The Na+ content is between 3.29 and 7.63 g/L, with an average of 5.12 g/L. The Ca2+ content is from 0.46 to 0.81 g/L, with an average of 0.64 g/L. The Mg2+ content is between 0.45 and 0.73 g/L, with an average of 0.57 g/L. The Cl content is from 5.44 to 11.6 g/L, with an average of 7.83 g/L. The SO42− content ranges from 2.97 to 5.7 g/L, with an average of 4.23 g/L. The Br content is between 0.17 and 1.31 mg/L, with an average of 0.43 mg/L.
The salinity of Line 3 is overall low, with a value ranging from 9.41 to 26.16 g/L, with an average of 15.14 g/L. The potassium K+ content ranges from 0.04 to 0.16 g/L, with an average of 0.07 g/L. The sodium Na+ content ranges from 1.94 to 7.08 g/L, with an average of 3.64 g/L. The calcium Ca2+ content ranges from 0.34 to 0.88 g/L, with an average of 0.65 g/L. The magnesium Mg2+ content ranges from 0.32 to 0.76 g/L, with an average of 0.48 g/L. The chloride (Cl) content ranges from 3.36 to 12.87 g/L, with an average of 6.37 g/L. The sulfate (SO42−) content ranges from 2.53 to 5.28 g/L, with an average of 3.90 g/L. The bicarbonate (HCO3) content ranges from 0.02 to 0.07 g/L, with an average of 0.04 g/L. The bromide (Br) content ranges from 0.29 to 0.48 mg/L, with an average of 0.39 mg/L. The ion composition of most samples is dominated by Na+ and Cl, with the overall cation and anion distribution being characterized by Cl > SO42− > HCO3 and Na+ > Ca2+ > Mg2+ > K+. The overall salinity is low.

5. Discussion

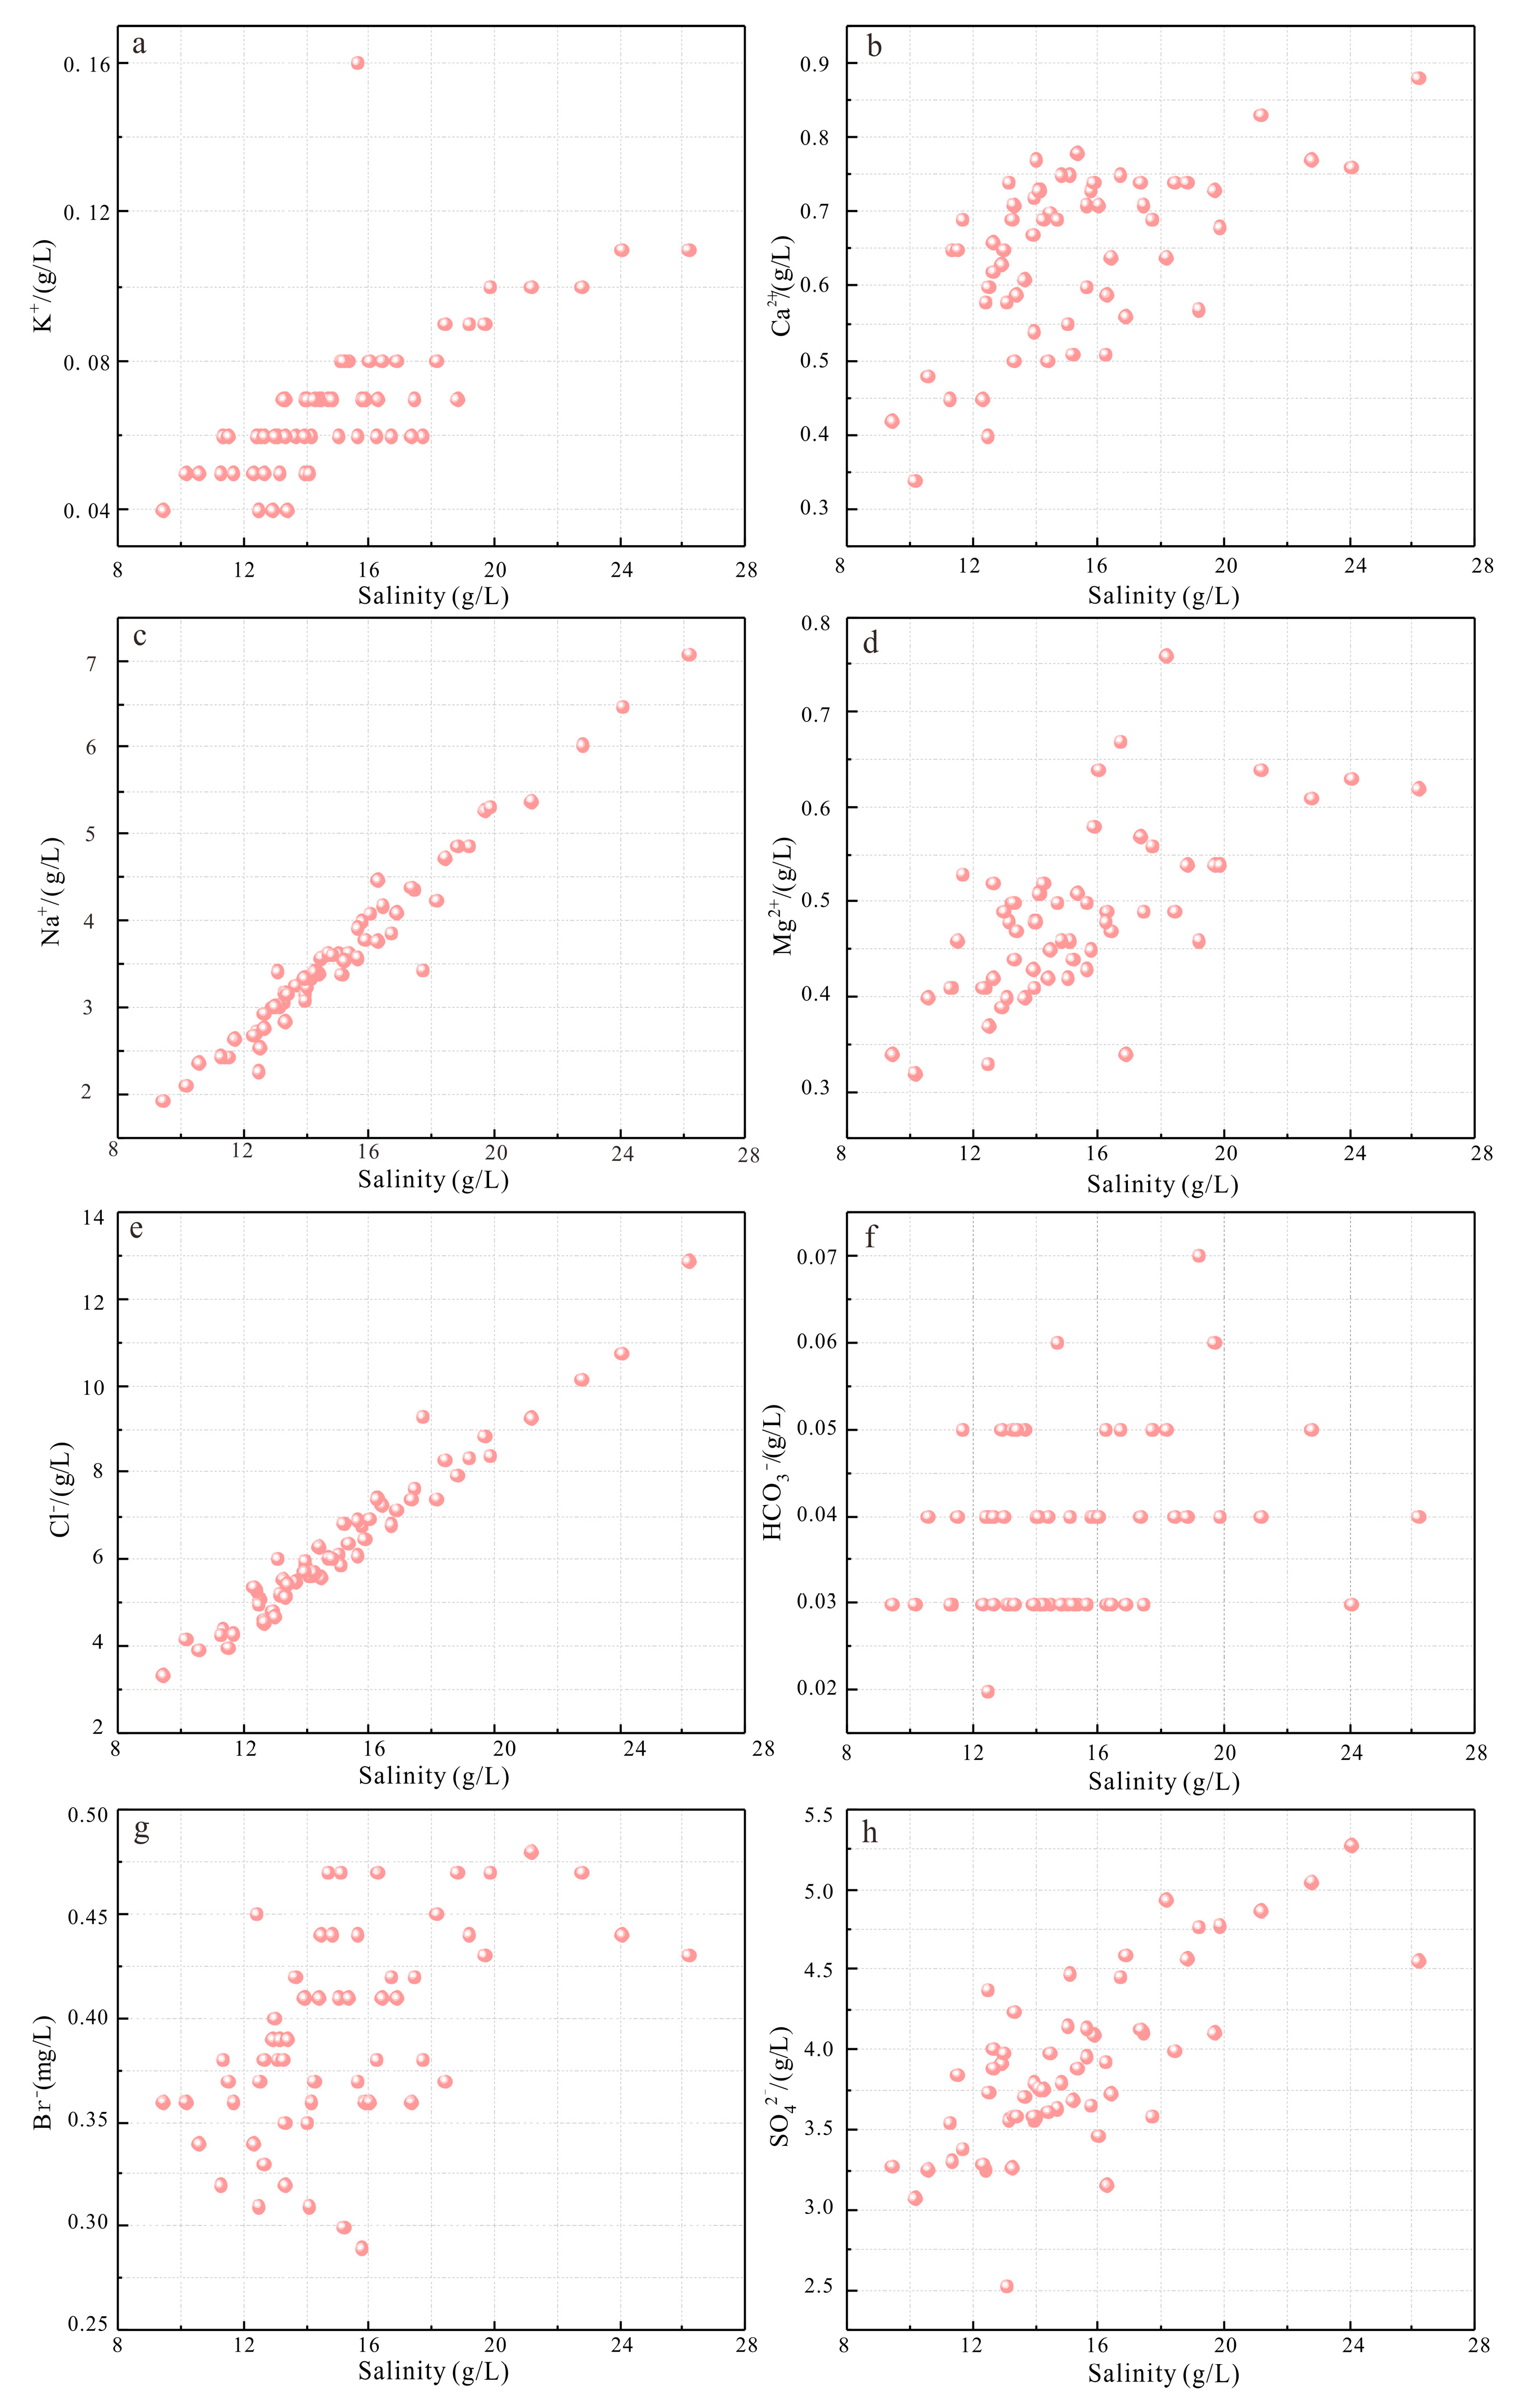
5.1. Elemental Geochemical Characteristics

Through the analysis of element contents and ratios in the surface line samples, anomalies can be identified and deep–seated information can be captured [24]. Figure 5 shows the variation in potassium, calcium, magnesium, and chlorine element ratios in three survey lines. The ratio of potassium to chloride, magnesium to chloride, and calcium to magnesium in some points of the three lines were significantly higher than other points.
Former scholars applied deep penetration geochemical methods to conduct application tests on the Qujia gold mine in the Jiaodong alluvial soil coverage area and its peripheral regions. The results show that the micro−fine particle Au concentration coefficient in the Qujia gold mine soil area is as high as 2.88, indicating a high degree of enrichment. The geochemical anomalies of gold, silver, and other elements have a good correspondence with the known hidden ore bodies, which can mutually verify each other and have an inherited relationship with the original geochemical information from drilling [47]. Former scholars used the micro–fine particle separation measurement method to study and analyze the mineralization element characteristics of the hidden ore vein No. X03 of the Jincheng. The micro–fine particle soil above the X03 hidden ore vein showed obvious anomalies in ore–forming elements such as Li and Be, and the anomaly range had a good correspondence with the known hidden ore body locations, which could mutually verify [48]. Former scholars conducted exploratory experiments on the application of deep penetration geochemical methods in the mineralization of hidden potassium salt in the Kuqa Basin of Xinjiang. It is believed that, through the analysis of element contents and ratios in surface line samples, anomalies can be identified and deep−seated information can be captured [24]. It is evident that deep–penetration geochemical methods have a certain indicative significance for various hidden ore deposits.
In summary, the deep penetration geochemical survey of this fault zone has shown that the potassium and other salt components at some sampling sites are significantly higher than those at other sites, indicating an abnormality in potassium at the deep level. This suggests that there may be deep potassium–rich brines rising and migrating along the deep major fault segment near the sampling points, providing the most direct basis for the layout of potassium prospecting wells.

5.2. The Indication of Main Trace Elements

According to the Sukharev hydrochemical classification, all groundwater is of the SO42−−Cl−Na+ type; the Piper trilinear diagram indicates a chloride−sodium type of water (Figure 6). Considering that the samples collected in this study are all groundwater existing in the soil at a depth of 1 to 4 m from the near surface, they are greatly influenced by atmospheric precipitation and the proportions of salts and clay in the soil. Therefore, the samples collected in this study may not accurately reflect the hydrochemical type of groundwater at deeper levels.
The samples collected in this study were all located along the fault zone, and previous research generally suggests that the springs and brine exposed in fault zones are mainly of the CaCl2 type. Examples include the brine from Death Valley and Bristol Dry Lake in the United States, the Atacama Salt Lake in Chile [49], and the deep−source spring water in the northern part of Qarhan Salt Lake in the Qaidam Basin, China [50]. Additionally, deep oilfield brine and formation brine are also mostly of the CaCl2 type, such as the oilfield brine from Dalaotan Salt Lake [51] and the deep brine in the Jiangling Depression [41]. Previous studies on the hydrochemical types of surface salt spring water in the Kuqa Basin have shown that the water is characterized by being rich in Ca2+ and poor in Mg2+ and SO42−, leading to the general consensus that the salt spring water in the Kuqa Basin is mainly of the CaCl2 type [40,52,53]. Therefore, the deep underground brine represented by the samples in this study is likely of the CaCl2 type.
Modern seawater and surface river water are often of the Na−Cl−SO4,Ca−HCO3, or Na−CO3 type [54], which is clearly different from the hydrochemical types of the salt spring water and underground brine in the Kuqa Basin. This may indicate that the potash−rich salt spring water in the Kuqa Basin has characteristics of deep−source water or circulation water exposed through faults.
Scatter plots are used to analyze the correlation between the mass concentrations of K+, Na+, Ca2+, Mg2+, Cl, SO42−, HCO3, Br, and salinity in the brine samples from Line 3.
Potassium ions (K+): There is a significant positive correlation between the mass concentration of potassium ions and salinity, as shown in Figure 7a. Calcium ions (Ca2+): With the increase in salinity, the mass concentration of calcium ions in brine shows an upward trend, as depicted in Figure 7b. As the salinity of the brine increases, there is a clear upward trend in the mass concentrations of calcium and chloride ions, demonstrating an excellent positive correlation trend, as illustrated in Figure 7c,e. This suggests that the dissolution of rock salt may be the main source of solutes in the brine. Magnesium ions (Mg2+): There is a significant positive correlation between the mass concentration of magnesium ions and salinity, as shown in Figure 7d. Bicarbonate ions (HCO3): The mass concentration of bicarbonate ions is relatively low, generally between 0.03 and 0.05 g/L, and its correlation with salinity is not significant, as depicted in Figure 7f. Bromide ions (Br): The relationship between the mass concentration of bromide ions and salinity shows a “V” shape. When the salinity increases from 8 g/L to approximately 20 g/L, the mass concentration of bromide ions increases with the increase in salinity, and then it decreases with the further increase in salinity, as shown in Figure 7g. Sulfate ions (SO42−): There is a significant positive correlation between the mass concentration of sulfate ions and salinity, as shown in Figure 7h.
Cl usually does not undergo mineralization effects and is the most stable component in the solution; therefore, when freshwater and brine are mixed in a certain proportion, the ratio of ions does not undergo significant changes [55]. However, Cl will continuously accumulate during the evaporation of water bodies. The spatial distribution differences in the Na+/Cl molar ratio and Cl concentration in the collected samples are not significant, indicating that the brackish water generally undergoes the same evaporation process (Figure 8a). However, the brine from Line 2 and Line 3 may have experienced a gradually enhanced evaporation process compared to the brine from Line 1.
The abundance of the trace element Br in the crust is 2.15 × 10⁻⁴, and it primarily exists in a dispersed state in nature [56]. Generally, Br does not form minerals independently but accumulates in residual fluids as brine concentration increases, with some Br substituting for Cl in chloride salt minerals. Consequently, chloride salt minerals precipitated during the late stage of brine evaporation and concentration, such as sylvite (KCl) and carnalite (KMgCl3·6H2O), contain a higher Br content. Therefore, a higher Br content in the residual fluids or salt minerals indicates a higher degree of brine concentration and better conditions for potassium mineralization [57]. However, the Br content in the potassium–rich saltwater from the Kuqa Basin is generally low, with most samples being below the Br content of seawater (61.0 mg/L) [58], which is consistent with the low Br feature of the ancient salt rock in the Tarim Basin of Xinjiang [39] (Figure 8a).
The seawater that forms salt mines precipitates various salts as it evaporates. According to the order of salt precipitation, carbonates, gypsum salts, and halite are present in the sediments. If the brine is concentrated to a late stage, the sediments may also contain easily soluble salts like potassium halite, sylvite, water–soluble magnesium sulfate, and even halite. In the residual mother solution, elements that are difficult to form minerals from alone and the most soluble salt components, such as Br, K+, B3+, will become increasingly enriched. Moreover, the total concentrations of components like Br, Mg2+, K+, Br in the original sedimentary brine are generally higher than those in the leachate brine. Due to the stability of Cl in the solution, it is little affected by metamorphism, so the relative concentrations of various coefficients show a regular evolution, and this proportion of ions will not change due to dilution. The potassium chloride coefficient is considered a direct indicator for finding potassium [52,59]. In the potassium–chlorine coefficient diagram, the majority of the samples along the three survey lines show a K+ × 103/Cl ratio lower than the value of K+ × 103/Cl after the evaporation and concentration of lake water (Figure 9a). However, some individual samples have a higher K+ × 103/Cl ratio than the K+ × 103/Cl value after the evaporation and concentration of lake water, suggesting that these individual samples may not be the result of natural evaporation and concentration. The coefficients cNa+/cCl (molar concentration ratio) and Br × 103/C1 in seawater have the greatest stability [55]. Seawater deposits are characterized by a cNa+/cCl ratio of approximately 0.87 and a Br × 103/C1 ratio of 0.33. When the cNa+/cCl ratio is between 0.87 and 0.99 or higher, and the Br × 103/C1 ratio is between 0.87 and 0.08 or lower, it indicates rock salt leachate brine; when the cNa+/cCl ratio is less than 0.87 and the Br × 103/C1 ratio is greater than 0.33, it indicates sedimentary metamorphic brine [55]. The average value of the halide concentration ratio cNa+/cCl in this brine sample collection is approximately 0.97 (Figure 9b), and the Br × 103/C1 value is about 0.07. Therefore, it is considered that the cause is the leaching of rock salt. This is consistent with previous studies by others using the K+/Br ratio, which confirm that the brine water in the Kuqa Basin is mainly the result of the leaching of rock salt [60].
To validate the hydrochemical evidence, the groundwater brines were projected onto the metastable phase diagram of the Na+, K+, Mg2+//Cl−H2O Quaternary system at 25 °C (Figure 10a) and onto the metastable phase diagram of the Na+, K+, Mg2+//Cl, SO42−−H2O quinary system at 25 °C (Figure 10b). From the metastable phase diagram of the Na+, K+, Mg2+//Cl, SO42−−H2O Quaternary system (Figure 10a), it can be seen that all the brine samples were projected into the halite phase region and were enriched at the high–Na terminal, indicating that the brackish water should be filtered by halite. When the brine from the Kuqa Basin was projected onto the Na+, K+, Mg2+//Cl, SO42−−H2O quinary system metastable phase diagram (Figure 10b), the brine samples were concentrated in the anhydrite−free phase region and the evolutionary trajectory appeared nearly as a complete line, with the outermost edge approaching the potassium anhydrite phase region. Overall, it suggests that the system is still in the early stage of potassium halite deposition.
It is evident that the analysis results of the ternary metastable phase diagram of Na+, K+, Mg2+//Cl, SO42−−H2O and the quinary metastable phase diagram of Na+, K+, Mg2+//Cl, SO42−−H2O are essentially consistent with the explanations of the changes in ion concentrations and hydrochemical characteristic coefficients mentioned above. In summary, the evidence suggests that, during the groundwater flow process, the underground brine mainly dissolves rock salt from the strata.

6. Mineralization Model

Generally speaking, based on a relatively stable tectonic background and under arid climatic conditions, the saline lake brine evolves towards continuous evaporation and concentration, leading to the formation of potash deposits in the later stages of saline lake evolution.
The Kuqa Basin has undergone a complex tectonic evolution. During the Paleogene period, influenced by marine transgression, a large amount of salt was deposited in the Baicheng sub−depression. Since the Miocene, due to the intense tectonic movements of the Central Himalayas, the western part of the Kuqa Basin uplifted and the salt lake deposits shifted from west to east. Since the end of the Miocene, the northern part of the Kuqa Basin experienced folding and uplift due to tectonic compression, while the southern part (the Shaya area) underwent significant subsidence [26]. During the late Yanshan period, a graben fault zone formed in southern Kuqa [60], possibly controlling the formation of secondary depressions in the southern region during the late Neogene. Former scholars suggested that the salt spring water in the western Kuqa Basin is of a potash salt leaching origin based on a high K/Br ratio [59]. Former scholars found that the salt spring water in the Qiulitage and Kelasu–Yiqikeli anticline zones has distinct characteristics of deep calcium chloride−type brine [40]. The hydrogen and oxygen isotope composition of the salt spring water indicates that it was significantly affected by evaporation, with δ18O shifts due to water–rock interactions. Former scholars discovered Ca–Cl type salt spring water in the Qiulitage anticline zone of the Kuqa Basin formed by leaching potash salt from the strata, and it showed the characteristics of a fault zone [53]. The current samples also indicate that the underground brine is of a rock salt leaching origin.
In summary, it is believed that the residual brine and saline weathering products from the ancient salt lakes in the northern Kuqa Basin have been transported to the southern sedimentary basin, undergoing the “metasomatic transfer” of salts [32]. They have accumulated in the graben–type secondary basins in the southern Shaya area. Meanwhile, under the action of uplift forces, deep fluids replenish the salt lake, and, after further evaporation and concentration, salt deposits featuring potash mineralization occur (Figure 11).

7. Conclusions

(1)
The sample salinity ranges from 9.41 to 26.16 g/L. The potassium content is between 0.04 and 0.22 g/L, indicating potential resource value. Some sampling points showed significantly higher potassium and other salt component concentrations compared to other points, indicating a potassium anomaly at depth. This suggests the possible upward migration of deep potassium–rich brine along the major deep fault segments near the sampling points, providing direct evidence for the placement of potassium well locations.
(2)
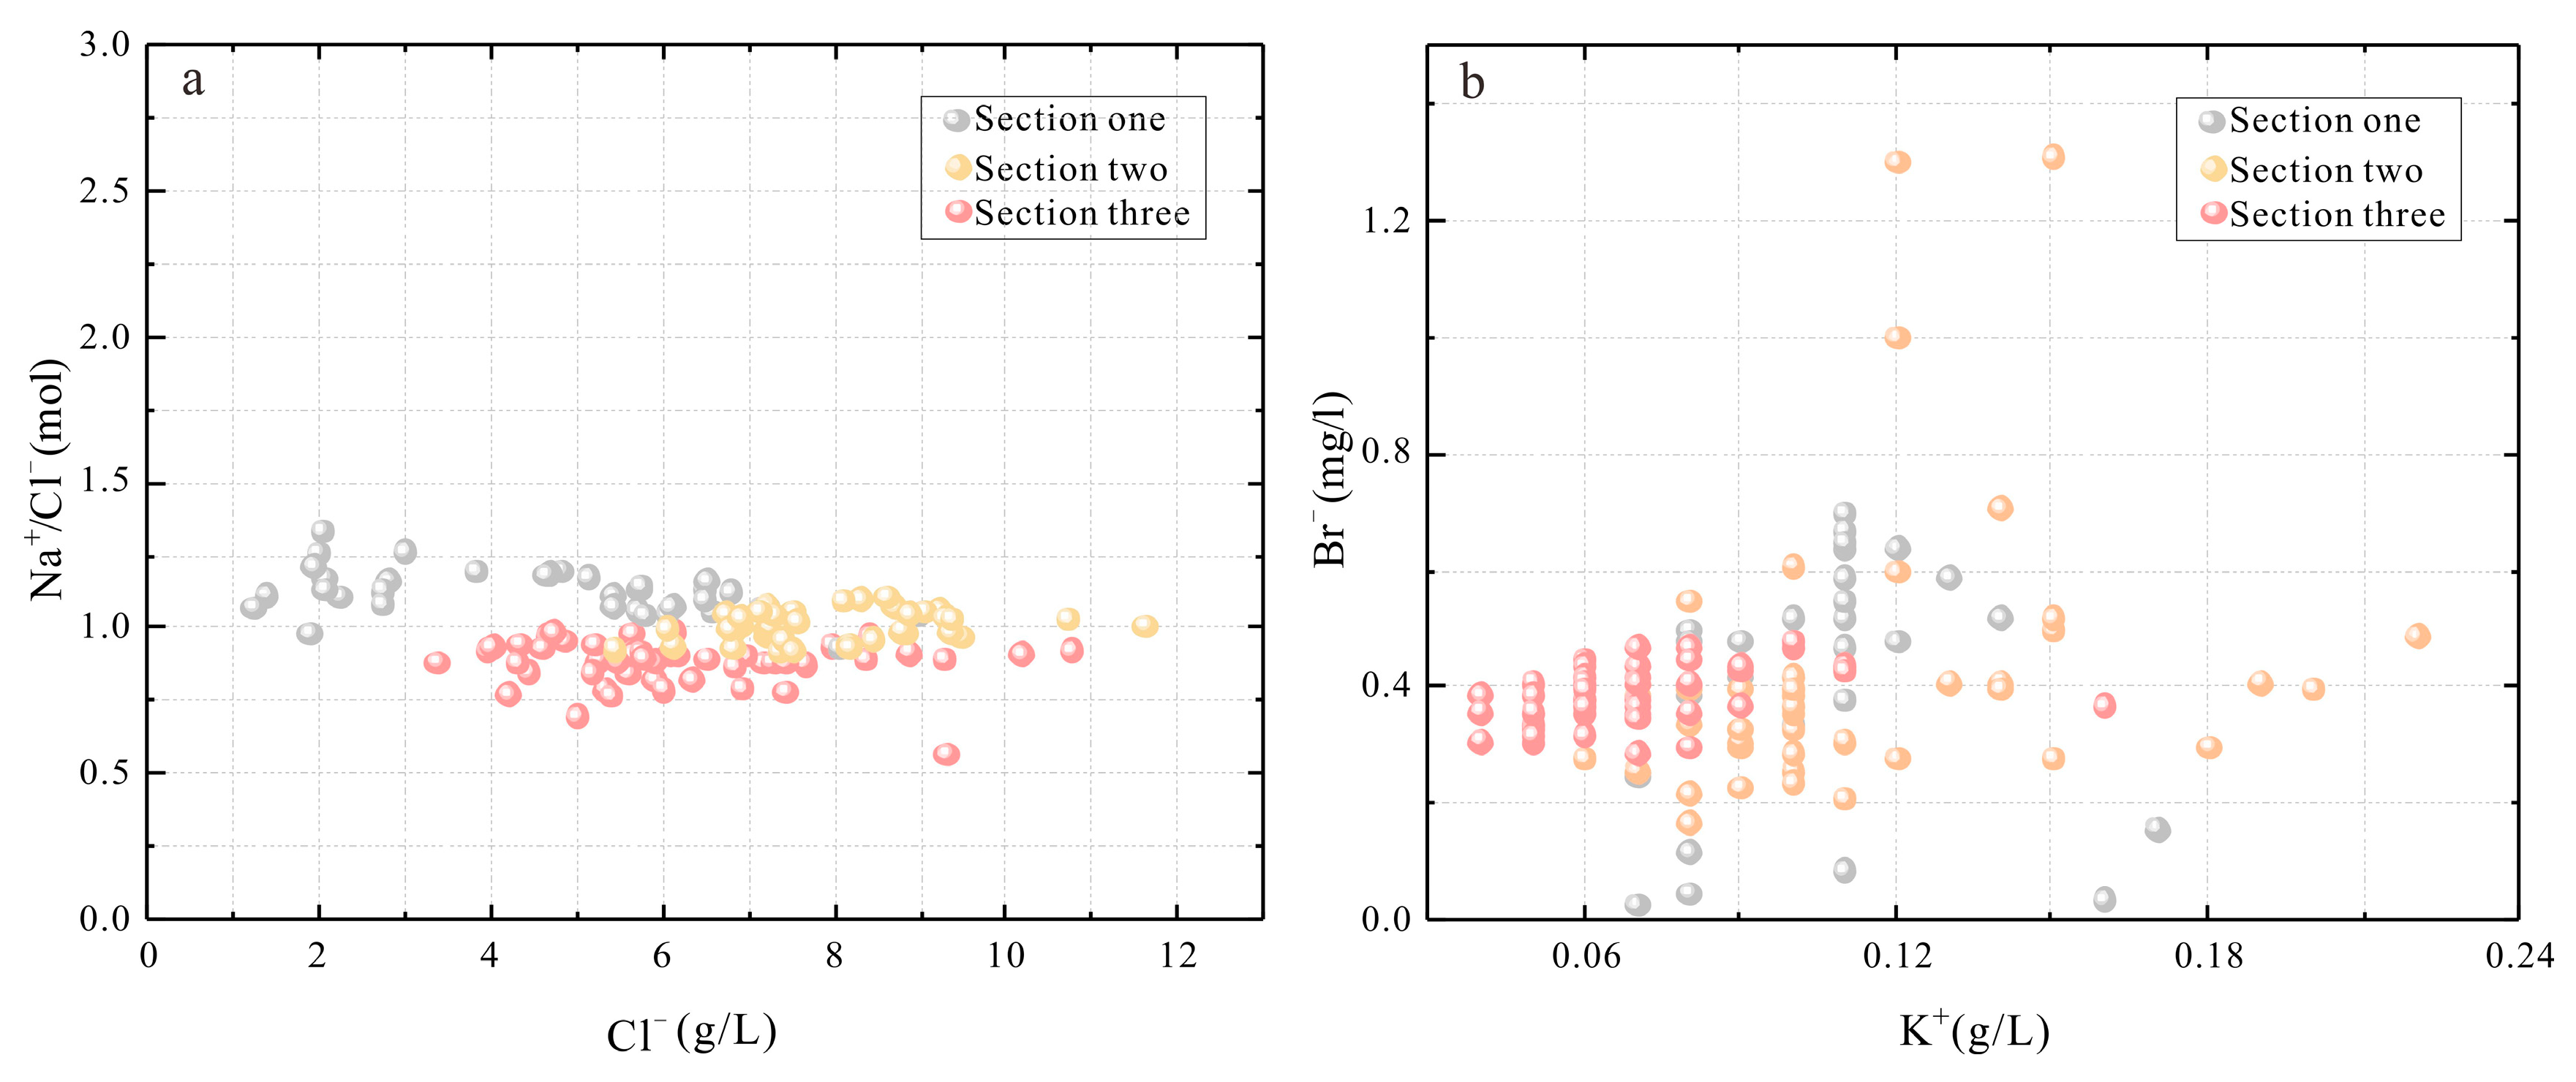
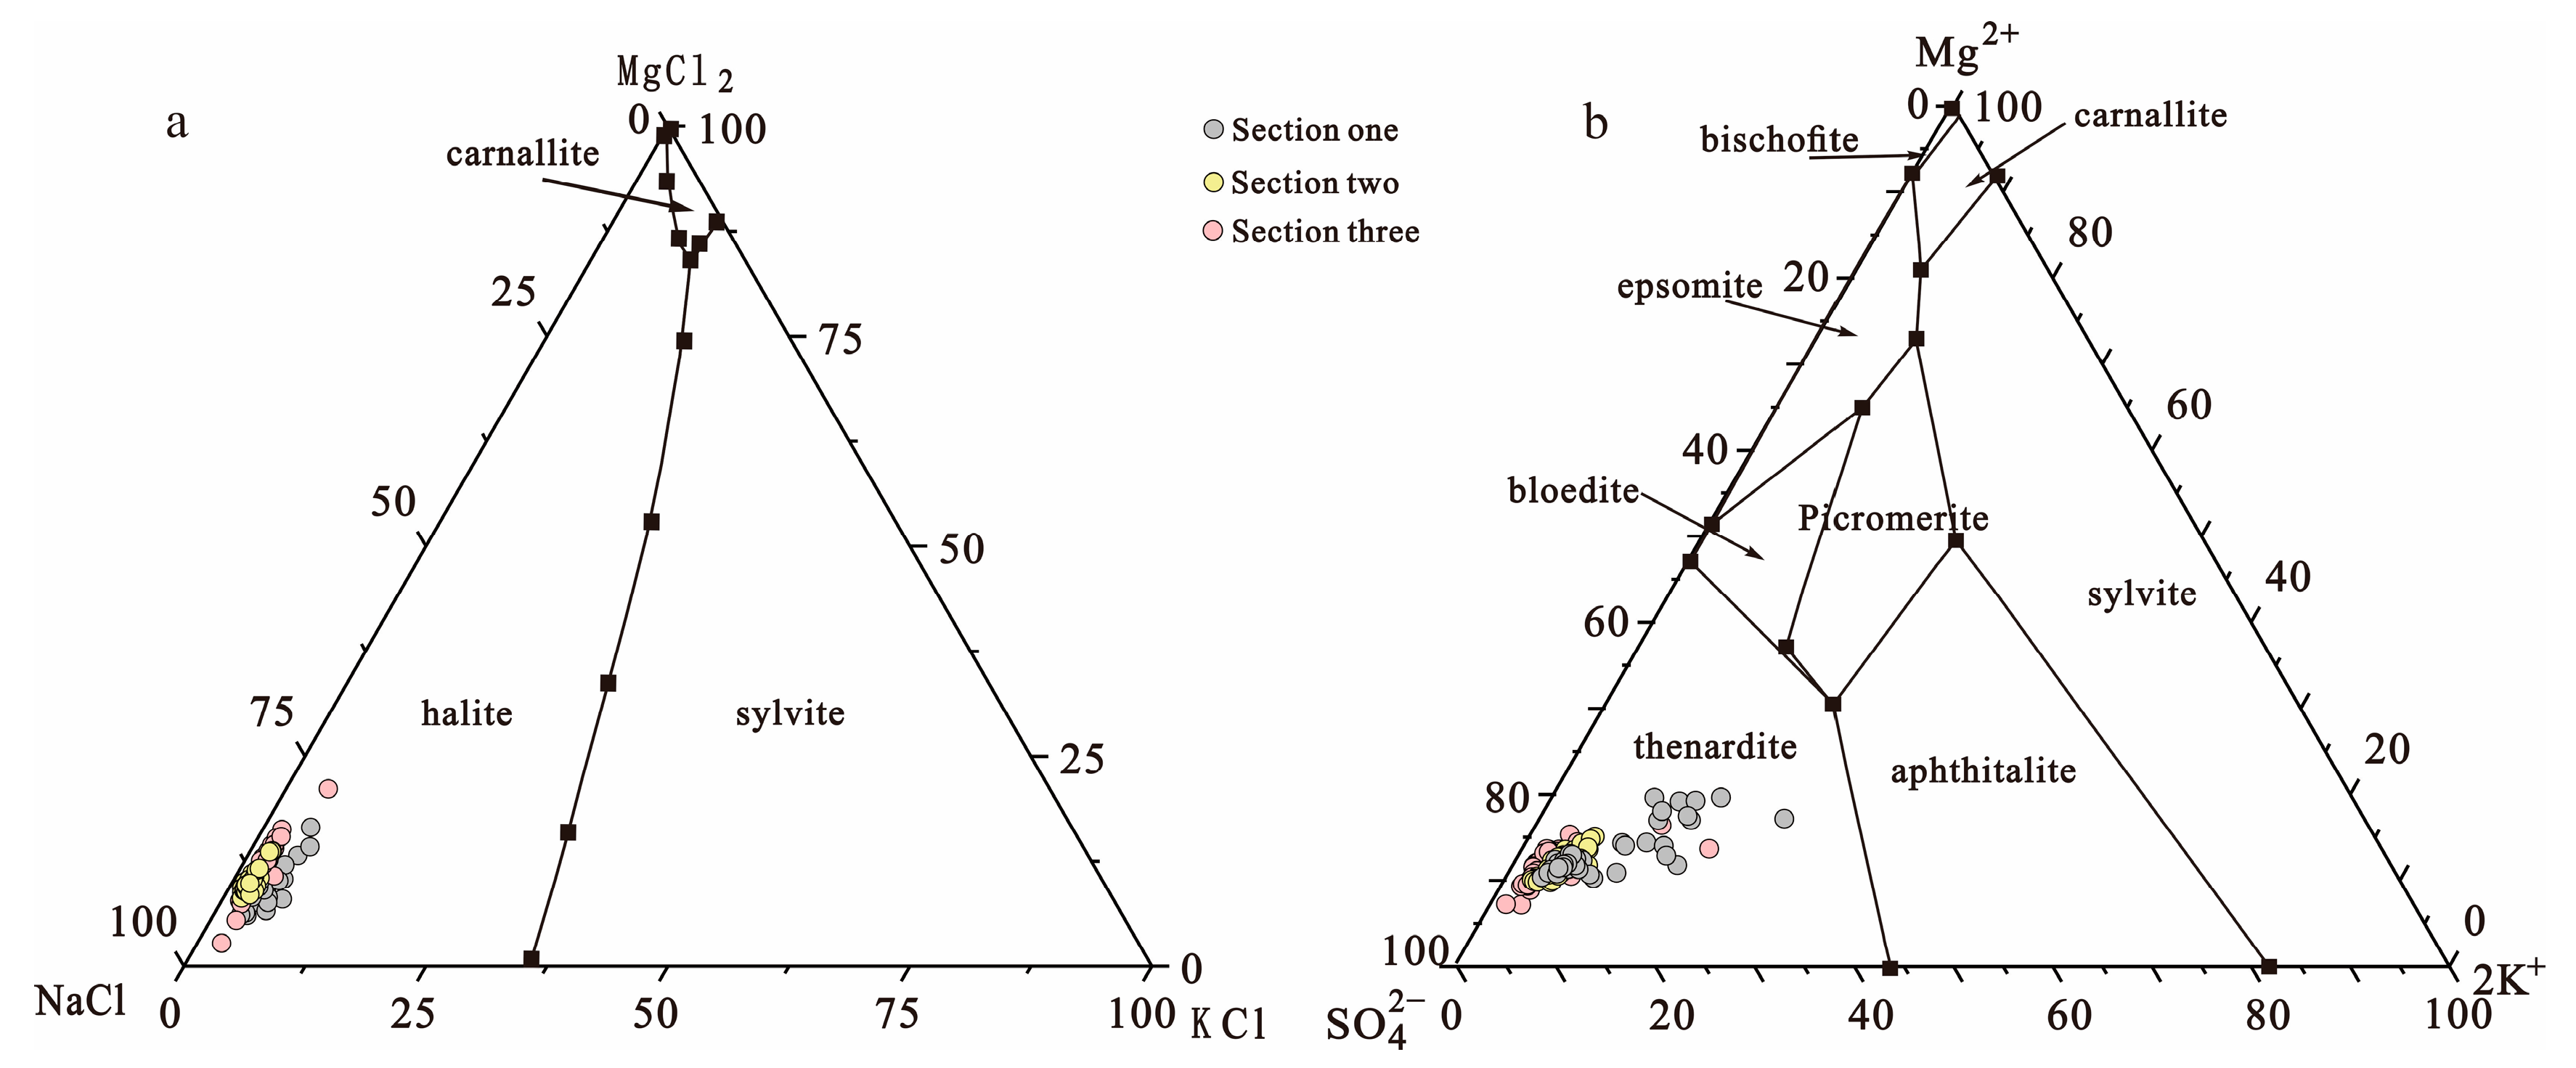
The hydrochemical characteristic coefficients suggest that the spring water has a high nNa+/nCl value, low K+ × 103/Cl, and nK+/nBr value features. According to the Quaternary system phase diagram and the biquinary system phase diagram, the brine should be rock salt leached and may suggest that the shallow brine underground is still in the initial stage of potash salt sedimentation.
(3)
The residual brine and salt–weathering products of the ancient salt lake undergo a “transferral mineralization” of salts, gathering in the graben–type secondary depression in the southern part of the Shaya region. At the same time, deep fluid rises to recharge the salt lake, and, after further evaporation and concentration, salt deposits are formed.

Author Contributions

Conceptualization, methodology, data analysis, data collection, and writing—original draft preparation, J.L. and W.H.; conceptualization, Y.Z. and C.L.; software, F.Y.; formal analysis, S.Z.; investigation, G.Y. All authors have read and agreed to the published version of the manuscript.

Funding

This paper was supported by the Major Science and Technology Projects of Xinjiang Uyghur Autonomous Region (2022A03009-3). The National 305 Project Office of the People’s Government of Xinjiang Uygur Autonomous Region and the "Tianchi Talent" Plan of Xinjiang Uygur Autonomous Region.

Data Availability Statement

Data are contained within the article.

Acknowledgments

Throughout the research process, we received support and assistance from many leaders and colleagues. We would also like to express our gratitude to the anonymous reviewers for their valuable suggestions for improving the article.

Conflicts of Interest

The authors declare no conflicts of interest.

References

  1. Liu, C.L.; Lv, F.X. Brief introduction of the National 973 Project “Research on the Law and Prediction of Marine Potassium Formation in China’s Continental Blocks”. Acta Geol. Sin. 2015, 89, I0001–I0002. [Google Scholar]
  2. Bao, R.H.; Yan, W.D.; Jiang, Y.; Zhou, Q.Z. Risk analysis of potash supply in China. Chem. Fertil. Ind. 2018, 45, 58–62. [Google Scholar]
  3. Wang, X.X.; Xu, S.F.; Zhang, B.M. Deep-penetrating geochemistry for sandstone-type uranium deposits in the Turpan-Hami basin, North-Western China. Appl. Geochem. 2011, 26, 2238–2246. [Google Scholar] [CrossRef]
  4. Wang, X.Q.; Zhang, B.M.; Lin, X.; Xu, S.F.; Yao, W.S.; Ye, R. Geochemical challenges of diverse regolith­covered terrains for mineral exploration in China. Ore Geol. Rev. 2016, 73, 417–431. [Google Scholar]
  5. Ye, R.; Zhang, B.M.; Wang, Y. Mechanism of the migration of gold in desert regolith coverover a concealed gold deposit. Geochem. Explor. Environ. Anal. 2015, 15, 62–71. [Google Scholar] [CrossRef]
  6. Anand, R.R. Regolith-landform processes and geochemical exploration for basemetal deposits in regolith-dominated terrains of the MtIsa region, Northwest Queensland, Australia. Ore Geol. Rev. 2016, 73, 451–474. [Google Scholar] [CrossRef]
  7. Noble, R.R.P.; Lau, I.C.; Anand, R.R.; Pinchand, G.T. Refining fine fraction soil extraction methods and analyse is for mineral exploration. Geochmistry Explor. Environ. Anal. 2019, 20, 113–128. [Google Scholar] [CrossRef]
  8. Noble, R.R.P.; Morris, P.A.; Anand, R.R.; Lau, I.C.; Pinchand, G.T. Application of Ultrafine fraction soil extraction and analysis for mineral exploration. Geochem. Explor. Environ. Anal. 2020, 20, 129–154. [Google Scholar] [CrossRef]
  9. Wang, Q.; Wang, X.Q.; Liu, H.L.; Tian, M.; Zhang, B.Y.; Li, R.H.; Yang, D.P.; Xiong, Y.X. Targeting deep-seated gold deposits: A study from the Qujia gold deposit, Shandong Province, China. Appl. Geochem. 2021, 130, 104982. [Google Scholar] [CrossRef]
  10. Antropova, L.V. New methods of regional exploration for blind mineralization: Application in the UssR. J. Geochem. Explor. 1992, 43, 157–166. [Google Scholar] [CrossRef]
  11. Zlotnicki, J.; Sasai, Y.; Toutain, J.P. Combined electromagnetic, geochemical and thermal surveys of taal volcano during the period 2005–2006. Bull. Volcanol. 2009, 71, 29–47. [Google Scholar] [CrossRef]
  12. Stragliani, W.M.; Doelman, P.; Salomons, W.; Schulin, R. Chemical time bombs: Predicting the unpredictable. Environment 1991, 22, 4–30. [Google Scholar] [CrossRef]
  13. Malmqvist, L.; Kristiansson, K. Experiment evidence for an as cending micro-flow of geogas in ground. Earth Planet. Sci. Lett. 1984, 70, 407–416. [Google Scholar] [CrossRef]
  14. Cameron, E.M.; Hamilton, S.M.; Leybourne, M.I.; Hall, G.E.; McClenaghan, M.B. Finding deeply-buried deposits using geochemistry. Geochem. Explor. Environ. Anal. 2004, 4, 7–32. [Google Scholar] [CrossRef]
  15. Ryss, Y.S.; Goldberg, I.S. The partial extraction of metals method in mineral exploration. Method Tech. 1973, 84, 5–19. [Google Scholar]
  16. Wang, X.Q. Deep penetration exploration geochemistry. Geophys. Geochem. Explor. 1998, 22, 166–169. [Google Scholar]
  17. Kristiansson, K.; Malmqvist, L. Evidence for nondiffusive transport of 222 86 Rn in the ground and a new physical model for the transport. Geophysics 1982, 47, 1444. [Google Scholar] [CrossRef]
  18. Clark, J.R. Enzyme-induced leaching of B-horizon soils for mineral exploration in areas of glacial overburden. Trans. Inst. Min. Metall. Sect. B Appl. Earth Sci. 1993, 102, 19–29. [Google Scholar]
  19. Mann, A.; Reimann, C.; De, P.; Caritat, N.; Turner, M. Mobile Metal Ion(R) analysis of European agricultural soils: Bioavailability, weathering, geogenic patterns and anthropogenic anomalies. Geochem. Explor. Environmen Anal. 2015, 15, 99–112. [Google Scholar] [CrossRef]
  20. Wang, Q.X.; Zhang, B.M.; Yao, W.S. Geochemical exploration: From nanoscale to global-scale patterns. Earth Sci. Front. 2014, 21, 65–74. [Google Scholar]
  21. Wang, Q.Y.; Cheng, H.C.; Zhu, M.H.; Yan, X.H.; Li, J. The application of geochemical soil survey to the qaganqulu Ag-Pb-Zn polymetallic ore district in Dong Ujmqn Banner lnner Mongolia. Geophys. Geochem. Explor. 2009, 33, 652–656. [Google Scholar]
  22. Liu, H.L.; Zhang, B.M.; Liu, D.S.; Wang, X.Q.; Zhang, Z.H.; Han, Z.X. The application of soil geochemical measurement method to the Huaniushan Pb-Zn deposit, Gansu Privince. Geophys. Geochem. Explor. 2023, 97, 291–305. [Google Scholar]
  23. Yang, Y.C.; Li, W.J.; He, J.P.; Zhang, J.H.; Zhou, C.X.; Lv, J.L. Application of geochemical soil survey in the Gongpoquan gold deposit at Mazongshan, Gansu Province. Geol. Explor. 2017, 53, 715–730. [Google Scholar]
  24. Bo, Y.; Liu, C.L.; Cao, Y.T. Fault belt geochemical deep-penetration theories and techniques for potassium prospecting. Miner. Depos. 2016, 35, 1281–1292. [Google Scholar]
  25. Liu, C.; Wang, L.; Yan, M.; Zhao, Y.; Cao, Y.; Fang, X.; Shen, L.; Wu, C.; Lv, F.; Ding, T. The Mesozoic-Cenozoic tectonic settings, paleogeography and evaporitic sedimentation of Tethyan blocks within China: Implications for potash formation. Ore Geol. Rev. J. Compr. Stud. Ore Genes. Ore Explor. 2018, 102, 406–425. [Google Scholar] [CrossRef]
  26. Liu, C.L.; Cao, Y.T.; Xu, Y.; Jiao, P.C.; Yao, F.J. Potash formation and target area prediction of Paleogene and Neogene salt lake in Kuqa basin, Xinjiang. Acta Geol. Sinca 2024, 98, 941–956. [Google Scholar]
  27. Liu, C.L.; Cao, Y.T.; Yang, H.J.; Jiao, P.C.; Gu, Q.W. Discussion on Paleogene-Neogene environmental change of salt lakes in Kuqa foreland basin and its potash-forming effect. Acta Geosci. Sin. 2013, 34, 547–558. [Google Scholar]
  28. Wang, X.Y.; Yin, H.W.; Deng, X.L.; Wei, Z. Strontium isotope characteristics and the origin of Cenozoic salt deposits in Kuqa depression. J. Nanjing Univ. 2015, 51, 1068–1074. [Google Scholar]
  29. Deng, X.L.; Wei, Z.; Zhao, Y.H. Discovery and geological significance of Paleogene potassium in Tarim Basin. Acta Mineral. Sin. 2013, 33, 755–756. [Google Scholar]
  30. Xu, Y.; Cao, Y.; Liu, C. Mid-Eocene sea surface cooling in the easternmost proto-Paratethys sea: Constraints from quantitative temperatures in halite fluid inclusions. Int. J. Earth Sci. 2021, 110, 1713–1727. [Google Scholar] [CrossRef]
  31. Xu, Y.; Cao, Y.; Liu, C. Whether the Middle Eocene Salt-Forming Brine in the Kuqa Basin Reached the Potash-Forming Stage: Quantitative Evidence from Halite Fluid Inclusions. Geofluids 2021, 2021, 5574772. [Google Scholar] [CrossRef]
  32. Liu, C.L.; Jiao, P.C.; Chen, Y.Z. Preliminary study on post-depositional potassium transfer mineralization effect in multi-stage evaporite deposits of Tarim Basin. Miner. Depos. 2010, 29, 383–384. [Google Scholar]
  33. Liu, C.L.; Jiao, P.C.; Wang, M.L. A tentative discussion on exploration model for potash in basins of China. Miner. Depos. 2010, 29, 581–592. [Google Scholar]
  34. Bally, A.W.; Snelson, S. Realms of subsidence. Can. Soc. Pet. Geol. Mem. 1980, 6, 9–94. [Google Scholar]
  35. Graham, S.A.; Hendrix, M.S.; Wang, L.B. Collision success or basin of western China: Impact of tectonic in heritance on sand composition. Geol. Soc. Am. Bull. 1993, 105, 323–324. [Google Scholar] [CrossRef]
  36. Lu, H.F.; Howell, D.G.; Jia, D.; Cai, S.; Wu, S.M.; Chen, C.M. Rejuvenation of the Kuqa fore-land basin, northern flank of the Tarim Basin, Northern China. Int. Geol. Rev. 1994, 36, 1151–1158. [Google Scholar]
  37. Yu, H.B.; Qi, J.F.; Yang, X.Z.; Liu, Q.Y.; Cao, S.J.; Fan, S.; Sun, T.; Yang, X.Y. The mesozoic tectonic palaeogeographic analysis in Kuqa depression of Tarim Basin. Geol. J. China Univ. 2016, 22, 657–669. [Google Scholar]
  38. Zhang, L.J.; Li, D.L.; Sun, Y.S.; Chen, M. Analysis characteristics of sedimenyary reservorir between cretaceous and palaeogene in the Western part of the Kuqa depression. Natueal Gas Geosci. 2006, 17, 355–360. [Google Scholar]
  39. Tan, H.B.; Ma, W.D.; Ma, H.Z.; Zhang, X.Y.; Cao, C.D. Hydrochemical Characteristics of brines and Application to locating potassium in western Tarim Basin. Geochimica 2004, 33, 152–158. [Google Scholar]
  40. Bo, Y.; Cao, Y.T.; Liu, C.L.; Gao, C.; Jiao, P.C. Chemical characteristics and origin of saline springs and their significance to potash prospecting in the Kuqa Basin, Xinjiang. Acta Geol. Sin. 2015, 89, 1936–1944. [Google Scholar]
  41. Liu, C.L. Characteristics and formation of potash deposits in continental rift basins: A review. Acta Geosci. Sin. 2013, 34, 515–527. [Google Scholar]
  42. Xu, Y.; Cao, Y.T.; Liu, C.L.; Jiao, P.C. Provenance and degree of evaporation and concentration of eocene salt lake in the Kuqa Basin. Acta Geol. Sin. 2018, 92, 1617–1629. [Google Scholar]
  43. Xu, Y.; Liu, C.L.; Jiao, P.C.; Chen, Y.Z.; Cao, Y.T. Geochemical characteristics and potash formation analysis of paleocene-eocene evaporites in Kuqa depression of Xinjiang: A case study of borehole KL4. Acta Pet. Mineral. 2017, 36, 755–764. [Google Scholar]
  44. Xu, Y.; Zhang, Y.M.; Cao, Y.T. Chlorine isotopic characteristics of the Middle Eocene rock salt in the Kuqa basin and their implications for potash formation. Acta Geol. Sin. 2021, 95, 3492–3500. [Google Scholar]
  45. Hu, P.; Yan, Q.S.; Lao, W.C. The Kuqa Basin rock salt and brine geochemical characteristics and metallogenic potential. Sichuan Nonferrous Met. 2012, 4, 38–42. [Google Scholar]
  46. Li, H.Y.; Han, J.; Chen, P.; Li, Y.; Bo, X.Q. Deformation and favorable area evaluation of Shunbei No. 4 Strikr-Slip fault zone in Tarim Basin. Xinjiang Pet. Geol. 2023, 44, 127–135. [Google Scholar]
  47. Liu, H.L.; Wang, X.Q.; Zhang, B.M.; Zhang, B.J.; Wang, Q.; Yang, D.P.; Xiong, Y.X.; Zhou, J. Indication of deep-penetrating geochemistry for hidden gold deposit in alluvial soil area in Jiaodong. Acta Geosci. Sin. 2023, 97, 1683–1700. [Google Scholar]
  48. Lu, Y.X.; Zhang, B.M.; Liu, H.L.; Chi, Q.H.; Dou, B.; Liu, F.T.; Wang, Q.; Xie, M.J.; Hu, Y.Y.Y. Indication of deep-penetrating geochemical exploration techniques for concealed rare metal ore: A case study of X03 vein in Jiajika lithium ore. Acta Geol. Sin. 2023, 97, 291–305. [Google Scholar]
  49. Lowenstein, T.K.; Risacher, F. Closed Basin Brine Evolution and the Influence of Ca-Cl Inflow Waters: Death Valley and Bristol Dry Lake California, Qaidam Basin, China, and Salar de Atacama, Chile. Aquat. Geochem. 2009, 15, 71–94. [Google Scholar] [CrossRef]
  50. Lowenstein, T.K.; Spencer, R.J.; Zhang, P.X. Origin of ancient potash evaporites-clues from the modern nonmarine Qaidam Basin of western China. Science 1989, 245, 1090–1092. [Google Scholar] [CrossRef]
  51. Fan, Q.S.; Ma, H.Z.; Tan, H.B.; Li, Y.W.; Xu, J.X. Characteristics of brines and potassium-prospecting researches in western Qaidam basin. Acta Geosci. Sin. 2007, 28, 446–455. [Google Scholar]
  52. Bo, Y.; Liu, C.L.; Jiao, P.C.; Chen, Y.Z.; Cao, Y.T. Saline spring hydrochemical characteristics and indicators for potassium exploration in southwestern and northern Tarim Basin, Xinjiang. Acta Geosci. Sin. 2013, 34, 594–602. [Google Scholar]
  53. Shan, J.J.; Wang, M.X.; Li, J.S.; Shan, F.S.; Fan, X.S.; Wei, H.C.; Qin, Z.J.; Yuan, Q.; Zhang, X.R.; Li, Q.K. Hydrochemical characteristics of potassium-rich saline spring and its implications for sylvine deposits in the Kuqa basin, Xinjiang. Acta Geol. Sin. 2019, 93, 1180–1188. [Google Scholar]
  54. Drever, J.I. The Geochemistry of Natural Waters, 2nd ed.; Prentice Hall: Upper Saddle River, NJ, USA, 1988. [Google Scholar]
  55. Lin, Y.T.; Yao, Y.C.; Kang, Z.H.; Wang, N.J. Study on the geochemical characteristics and resource significance of the highmineralized potassium-rich brine in the Sichuan Xuan da salt basin. J. Salt Lake Res. 2004, 12, 8–17. [Google Scholar]
  56. Fan, Q.S.; Ma, H.B.; Tan, H.B.; Xu, J.X.; Li, Y.W. Characteristics and origin of brines in Western Qaidam Bssin. Geochimica 2007, 36, 601–611. [Google Scholar]
  57. Cai, C.F.; Mei, B.W.; Li, W. The hydrogeochemistry of oil-fields in Tarim basin. Geochimica 1996, 6, 614–623. [Google Scholar]
  58. Chen, Y.H. Sequence of salt separation and regularity of some trace elements distribution during isothermal evaporation (25 °C) of the Huanghai sea water. Acta Geosci. Sin. 1983, 57, 379–390. [Google Scholar]
  59. Tan, H.B.; Ma, H.Z.; Ma, W.Z.; Dong, Y.P.; Zhang, X.Y.; Xu, J.X. Research on geological and geochemical characteristics of Paleo-Salt rock and its potash ore formation in Western Tarim Basin. Bull. Mineral. Petrol. Geochem. 2004, 23, 194–199. [Google Scholar]
  60. Tang, L.J.; Qi, L.X.; Xiu, H.J.; Yu, L.; Li, M.; Xie, D.Q.; Yang, Y.; Wan, G.M. Poly-phase differential fault movement and hydrocarbon accumlation of the Tarim Basin, NW China. Acta Petrol. Sin. 2012, 28, 2569–2583. [Google Scholar]
Figure 1. Geological map of the Kuqa Basin.
Water 17 00298 g001
Figure 2. Distribution of fault structures and sampling locations in the southern subsidence zone of Shaya. 1: Strike–slip fault; 2: thrust fault; 3: presumed fault; 4: geological limit; 5: sampling line.
Water 17 00298 g002
Figure 3. North–South Fault Profile of the Shaya Area. 1: Paleogene–Quaternary. 2: Cretaceous. 3: Permian. 4: Xiaohaizi Formation, middle Carboniferous. 5: Early Carboniferous Creetage Formation. 6: Early Carboniferous Bashsogon Formation. 7: Early Silurian. 8: Ordovician. 9: Late Cambrian to early Middle Ordovician. 10: Early and middle Cambrian. 11: Early and middle Cambrian. 12: Cambrian substratum. 13: Fault.
Water 17 00298 g003
Figure 4. Sampling map of underground brine in Kuqa Basin.
Water 17 00298 g004
Figure 5. Variation in element content ratios along three measurement lines. a: Line one. b: Line two. c: Line three.
Water 17 00298 g005
Figure 6. Piper map of the chemical composition of underground brine in the southern margin of the Kuqa Basin.
Water 17 00298 g006
Figure 7. Scatter plot of brine element variation along Survey Line 3. a: The relationship between K+ and salinity. b: The relationship between Ca2+ and salinity. c: The relationship between Na+ and salinity. d: The relationship between Mg2+ and salinity. e: The relationship between Cl and salinity. f: The relationship between HCO3 and salinity. g: The relationship between Br and salinity. h: The relationship between SO42− and salinity.
Water 17 00298 g007
Figure 8. Relationship between the Na+/Cl molar ratio and the Cl concentration (a) and the relationship between the Br and the K+ concentration (b) of underground brine in the Kuqa Basin.
Water 17 00298 g008
Figure 9. Comparison of the hydrochemical characteristics of brine in the Kuqa Basin with the evaporation curves of Qinghai Lake water and Yellow Sea water. a: relationship between the lg(K+× 103/C1) and the lg(C1) concentration. b: relationship between the nNa+/nCl and the C1 concentration.
Water 17 00298 g009
Figure 10. Quasi−stable phase diagram of the Na+, K+, Mg2+//Cl, SO42−−H2O Quaternary system in the Kuqa Basin brine at 25 °C (a) and the quasi−stable phase diagram of the Na+, K+, Mg2+//Cl, SO42−H2O quinary system (b).
Water 17 00298 g010
Figure 11. Schematic diagram of deep brine rising along fractures in the Shaya subsidence zone.
Water 17 00298 g011
Table 1. Chemical composition of underground brine in Line 1 of the Kuqa Basin, Xinjiang.
Sample NumberK+ (g/L)Na+ (g/L)Ca2+ (g/L)Mg2+ (g/L)Cl (g/L)SO42− (g/L)Br (mg/L)
Maximum value0.17 7.44 0.47 0.60 11.32 4.59 0.70
Minimum value0.06 0.85 0.02 0.08 1.19 0.28 0.03
Mean value0.10 3.44 0.20 0.35 4.87 2.45 0.42
Standard deviation0.02 1.65 0.14 0.16 2.48 1.36 0.20
Sample number43 43 43 43 43 43 43
Table 2. Chemical composition of underground brine in Line 2 of the Kuqa Basin, Xinjiang.
Sample NumberK+ (g/L)Na+ (g/L)Ca2+ (g/L)Mg2+ (g/L)Cl (g/L)SO42− (g/L)Br (mg/L)
Maximum value0.22 7.63 0.81 0.73 11.60 5.70 1.31
Minimum value0.06 3.29 0.46 0.45 5.44 2.97 0.17
Mean value0.11 5.12 0.64 0.57 7.83 4.23 0.43
Standard deviation0.04 0.88 0.11 0.07 1.17 0.65 0.23
Sample number47 47 47 47 47 47 47
Table 3. Chemical composition of underground brine in Line 3 of the Kuqa Basin, Xinjiang.
Sample NumberK+ (g/L)Na+ (g/L)Ca2+ (g/L)Mg2+ (g/L)Cl (g/L)SO42− (g/L)HCO3 (g/L)TDS (g/L)Br (mg/L)
Maximum value0.16 7.08 0.88 0.76 12.87 5.28 0.07 26.16 0.48
Minimum value0.04 1.94 0.34 0.32 3.36 2.53 0.02 9.41 0.29
Mean value0.07 3.64 0.65 0.48 6.37 3.90 0.04 15.14 0.39
Standard deviation0.02 1.04 0.11 0.09 1.78 0.53 0.01 3.28 0.05
Sample number60 60 60 60 60 60 60 6060
Disclaimer/Publisher’s Note: The statements, opinions and data contained in all publications are solely those of the individual author(s) and contributor(s) and not of MDPI and/or the editor(s). MDPI and/or the editor(s) disclaim responsibility for any injury to people or property resulting from any ideas, methods, instructions or products referred to in the content.

