Article

Nursery Runoff Treatment by Novel Biochar-Amended Bioretention Systems

by
Nicholas Richardson
,
Natchaya Luangphairin
,
Ananda S. Bhattacharjee
,
Mahmood H. Nachabe
and
Sarina J. Ergas
*
Department of Civil & Environmental Engineering, University of South Florida, Tampa, FL 33620, USA
*
Author to whom correspondence should be addressed.
Water 2025, 17(3), 330; https://doi.org/10.3390/w17030330
Submission received: 24 December 2024 / Revised: 19 January 2025 / Accepted: 21 January 2025 / Published: 24 January 2025
(This article belongs to the Section Water, Agriculture and Aquaculture)

Abstract

:
Extensive fertilization and irrigation in commercial plant nurseries generates runoff containing high levels of nutrients. Biochar-amended bioretention systems with internal water storage zones (IWSZs) have been shown to enhance total nitrogen removal from urban runoff. However, their effectiveness for treatment of nursery runoff and the role of biochar in the IWSZ remain understudied. The goal of this research was to investigate nitrogen transformations in pilot-scale bioretention systems treating nursery runoff with varying biochar-amendment strategies: (a) throughout both the unsaturated zone and the IWSZ (CBA), (b) only in the unsaturated zone (PBA). Variables investigated included hydraulic loading rate (HLR; 0.11, 0.22, and 0.55 cm/min), IWSZ depth (44 and 69 cm), and the presence of plants (Muhlenbergia capillaris). The presence of biochar in the IWSZ (CBA) enabled significantly greater nitrogen removal (p = 0.031) compared to PBA. CBA had improved hydraulic efficiency by mitigating short-circuiting (34% increase in mean retention time) and likely enhanced performance by promoting nutrient uptake and microbial activity. Three times the above ground plant biomass was observed in CBA vs. PBA (0.73 kg in CBA vs. 0.23 kg in PBA). The highest nitrogen removal efficiency (84%) was achieved in the planted CBA unit at an HLR of 0.22 cm/min and IWSZ depth of 69 cm. A spreadsheet-based tool, utilizing a logarithmic regression model for CBA (R2 = 0.88 for TIN, 0.86 for NOx) and PBA (R2 = 0.50 for TIN, 0.60 for NOx), was developed for system design to achieve nitrogen removal targets. The greater variability in the PBA-fitted model (lower R2) compared to CBA (higher R2, better fit) suggests biochar’s ability to mitigate short-circuiting and improve hydraulic performance.

1. Introduction

The horticulture industry—which includes greenhouse, nursery, and floriculture production—is a vital contributor to the U.S. economy, with combined wholesale and retail sales generating a total output of $30 billion, >200,000 jobs, and $16 billion in value-added benefits [1]. Fertilizer application is essential to produce marketable plants; however, rainfall and irrigation can wash fertilizers from plant containers, leaching nitrogen and other nutrients into drainage ditches and retention ponds [2,3,4]. This results in ground and surface water quality impairment, eutrophication, fish kills, and economic loss [5]. In response, the US state of Florida requires farmers to adopt best management practices (BMPs) to limit nutrient discharges into nearby water bodies. Consequently, runoffs must comply with numeric water quality criteria [2,6] and total maximum daily load limits (TMDLs) [7,8]. Nursery plant production managers must, therefore, consider optimizing their operations with the most cost-effective BMPs.
Conventional nature-based solutions (NBSs) that rely on sedimentation, filtration, biodegradation, and plant uptake have had limited success in achieving complete nitrogen removal from agricultural runoff [9]. For example, constructed wetlands are effective for treating nursery runoff (70.7–94.7% N removal) but require significant land area and cost [10,11]. Although floating wetlands are less expensive to implement, they require regular maintenance and have achieved variable nitrogen removal rates (12.9–82.9%) depending on the plant species used [12]. Vegetated buffer strips and algal turf scrubbers present additional options; however, their effectiveness can be inconsistent depending on system hydraulics, vegetation type, and soil characteristics [13,14,15]. Larson et al. [16] highlighted the challenges buffer strips face in handling high nutrient loads, reporting that high influent concentrations in dairy farm runoffs resulted in an increase in chemical oxygen demand (COD), total Kjeldahl nitrogen (TKN), ammonia (NH4+), and nitrate (NO3) (11–45 mg/L) leaching from the buffer strips [16]. As a result, attention has shifted towards smaller-scale, high-throughput BMPs, such as bioretention systems, for effectively managing agricultural runoff.
Bioretention is a type of NBS that has been used to manage both urban and agricultural runoff [17]. Conventional bioretention systems are constructed with the following layers (from bottom to top): (i) a gravel drainage layer; (ii) porous filtration medium; and (iii) topsoil, mulch, or compost as a surface layer, with or without plants. Bioretention systems can be modified by raising the outlet pipe to provide alternating unsaturated and saturated zones to promote nitrification and denitrification [18]. The elevated outlet creates an internal water storage zone (IWSZ) at the bottom of the system where runoff is retained during the antecedent dry period (ADP) between irrigation events, which allows more time for denitrification. The saturated conditions in the IWSZ limit oxygen transfer, which promotes the anoxic conditions needed for denitrification [5]. An electron donor, such as woodchips, compost, or elemental sulfur, can be added to the IWSZ to promote denitrification of carbon-limited runoff [5,19]. In stormwater studies, modified bioretention systems improve the removal of NH4+, nitrate-nitrite (NOx), and dissolved organic N (DON) and provided better performance in delaying peak flows than conventional systems [20,21,22].
Biochar is a low-cost material, produced by pyrolysis of organic feedstocks (such as wood, animal waste, or plant matter) in a controlled, oxygen-limited environment [23]. The high specific surface area (SA) and microporosity enable biochar to adsorb and trap contaminants. Biochar’s high cation exchange capacity (CEC) improves its ability to retain positively charged ions, such as NH4+. In crop studies, biochar improves soil quality by retaining moisture, nutrients, and organic carbon, enhancing microbial activity, nitrogen fixation, and plant growth [24,25]. Biochar addition in the unsaturated zone can improve nitrification by retaining NH4+ during the wetting period, allowing more time for nitrification during the ADP between irrigation events when the pores of the filtration media fill with air. Biochar amendment to saturated woodchip biofilters has also been shown to improve NO3 removal during intense runoff events by lowering dissolved oxygen, increasing biomass density, and enhancing water retention, resulting in denitrification rates five times higher than conventional systems [26,27,28].
Several variables affect bioretention performance, including hydraulic loading rate (HLR) and the presence of vegetation. The HLR is the influent runoff flow rate divided by the cross-sectional area of the bioretention system. For a given flow rate, the higher the HLR the less land area is needed for the BMP but the shorter the hydraulic residence time (HRT) in the system. A short HRT results in less time for the microbes to react with the substrate [21]. Adding vegetation to bioretention systems provides additional pathways for nutrient removal through plant uptake and increased microbial activity in the rhizosphere [29,30,31,32]. Henderson et al. [30] investigated the effect of plants in bioretention systems under three different soil types (gravel, sand, and sandy loam); vegetated systems achieved 85–94% TP and 63–77% TN removal, compared with 31–90% TP and −12–25% TN removal in unvegetated systems [30]. Conversely, Muerdter et al. [33] and Skorobogatove et al. [34] reported that plant roots can negatively impact the media by forming macropores, potentially causing short-circuiting, which can lead to non-uniform breakthrough and poorly treated runoff. However, more research is needed to fully understand how interactions between the filtration medium and plants affect nutrient removal in modified bioretention systems.
Research is also limited on the effect of the IWSZ outlet height on nitrogen transformations in bioretention systems [17]. An increased IWSZ depth (higher outlet heights) increases the saturated zone HRT but reduces the depth of the unsaturated zone, which is needed for oxygen-dependent nitrification. Mai and Huang [20] found that an increased IWSZ height improved N-removal and runoff capacity [20,35,36], while other researchers reported a minimal impact or even nitrate leaching [37,38]. These contradictions highlight the need for further study, including how interactions between IWSZ depth, biochar amendment, and plants [39] affect bioretention performance under varying loading conditions.
This study makes several novel contributions to our understanding of biochar-amended bioretention. First, it is the first study to explore biochar-amended bioretention for treatment of commercial nursery runoff. This is important, due to the large contribution of nursery runoff to agricultural nutrient loads and differences in N speciation, concentration, and loading rates between nursery runoff and other non-point N sources (e.g., urban or dairy farm runoff). Second, this research provides new insights into the performance of modified bioretention systems with different design configurations that have not previously been investigated, specifically with and without biochar in the IWSZ and with different IWSZ depths. Lastly, by applying statistical methods to assess the impact of these configurations on nutrient removal, a predictive model was developed.
Therefore, the goal of this research was to investigate nitrogen transformations in pilot-scale bioretention systems treating nursery runoff with varying biochar-amendment strategies: (a) biochar addition throughout both the unsaturated and IWSZ (CBA) and (b) biochar only in the unsaturated zone (PBA). Variables investigated included HLR, IWSZ depth, and the presence of plants (Muhlenbergia capillaris). Conservative tracer studies were used to investigate hydraulic efficiency. A spreadsheet-based tool, utilizing a logarithmic regression model, was developed for system design to achieve nitrogen removal targets.

2. Materials and Methods

2.1. Site Description

Holmberg Farms, located in Lithia, FL, is a large commercial nursery specializing in the cultivation and distribution of citrus trees, flowering plants, and fruit plants. Runoff from greenhouses at the facility was captured via a culvert and treated in two pilot-scale bioretention systems. The selected greenhouses (~5 ha) were primarily used to grow citrus trees. The potting medium included a controlled-release fertilizer (Florikan, Bowling Green, FL, USA). Trees were irrigated using overhead spray irrigation systems two to three times per week. Additional details about the site and methodology can be found as outlined by Richardson [40].

2.2. Porous Medium Materials

Proprietary high permeability sand media (HPS) was donated by a stormwater management company. The biochar used in this study was donated by Biochar Now (Berthoud, CO, USA). Biochar and HPS were washed with tap water to remove dust and soil and sieved with a #8 sieve using a RO-TAP™ Sieve Shaker to achieve particles > 0.22 cm. The sieved HPS had a porosity of 0.44 cm3/cm3, hydraulic conductivity of 0.01 cm/s, and a uniform coefficient of 3.20. The cumulative particle size distribution at 10% (d10), 50% (d50), and 60% (d60) for HPS were 0.112 cm, 0.326 cm, and 0.357cm, respectively. The biochar used in this study was derived from pine woodchip feedstock that was pyrolyzed at 550 °C. The biochar was characterized for pH, hydraulic conductivity (K), bulk density (BD), porosity (n), moisture content (MC), electrical conductivity (EC), grain size distribution (GSD), CEC, surface area (SA), and pore size distribution (PSD) by Rahman et al. [28] using the American Society of Testing Materials (ASTM) protocols. Briefly, the biochar had a bulk density of 0.19 g/cm3, SA of 136 ± 45.51 m2/g and a CEC of 13.63 cmol/kg. Its high pore volume of 0.13 cm3/g included 0.061 cm3/g and 0.062 cm3/g mesopore volume. Biochar had a porosity of 0.50 cm3/cm3, hydraulic conductivity of 0.007 cm/s, uniformity coefficient of 3.51, and d10, d50, and d60 of 0.100 cm, 0.319 cm, and 0.352 cm, respectively. Oak woodchips were obtained from a local tree service and were hand sorted to achieve particle sizes between 2 and 10 cm. Gravel was obtained from Sefner Rock & Gravel (Tampa, FL, USA).

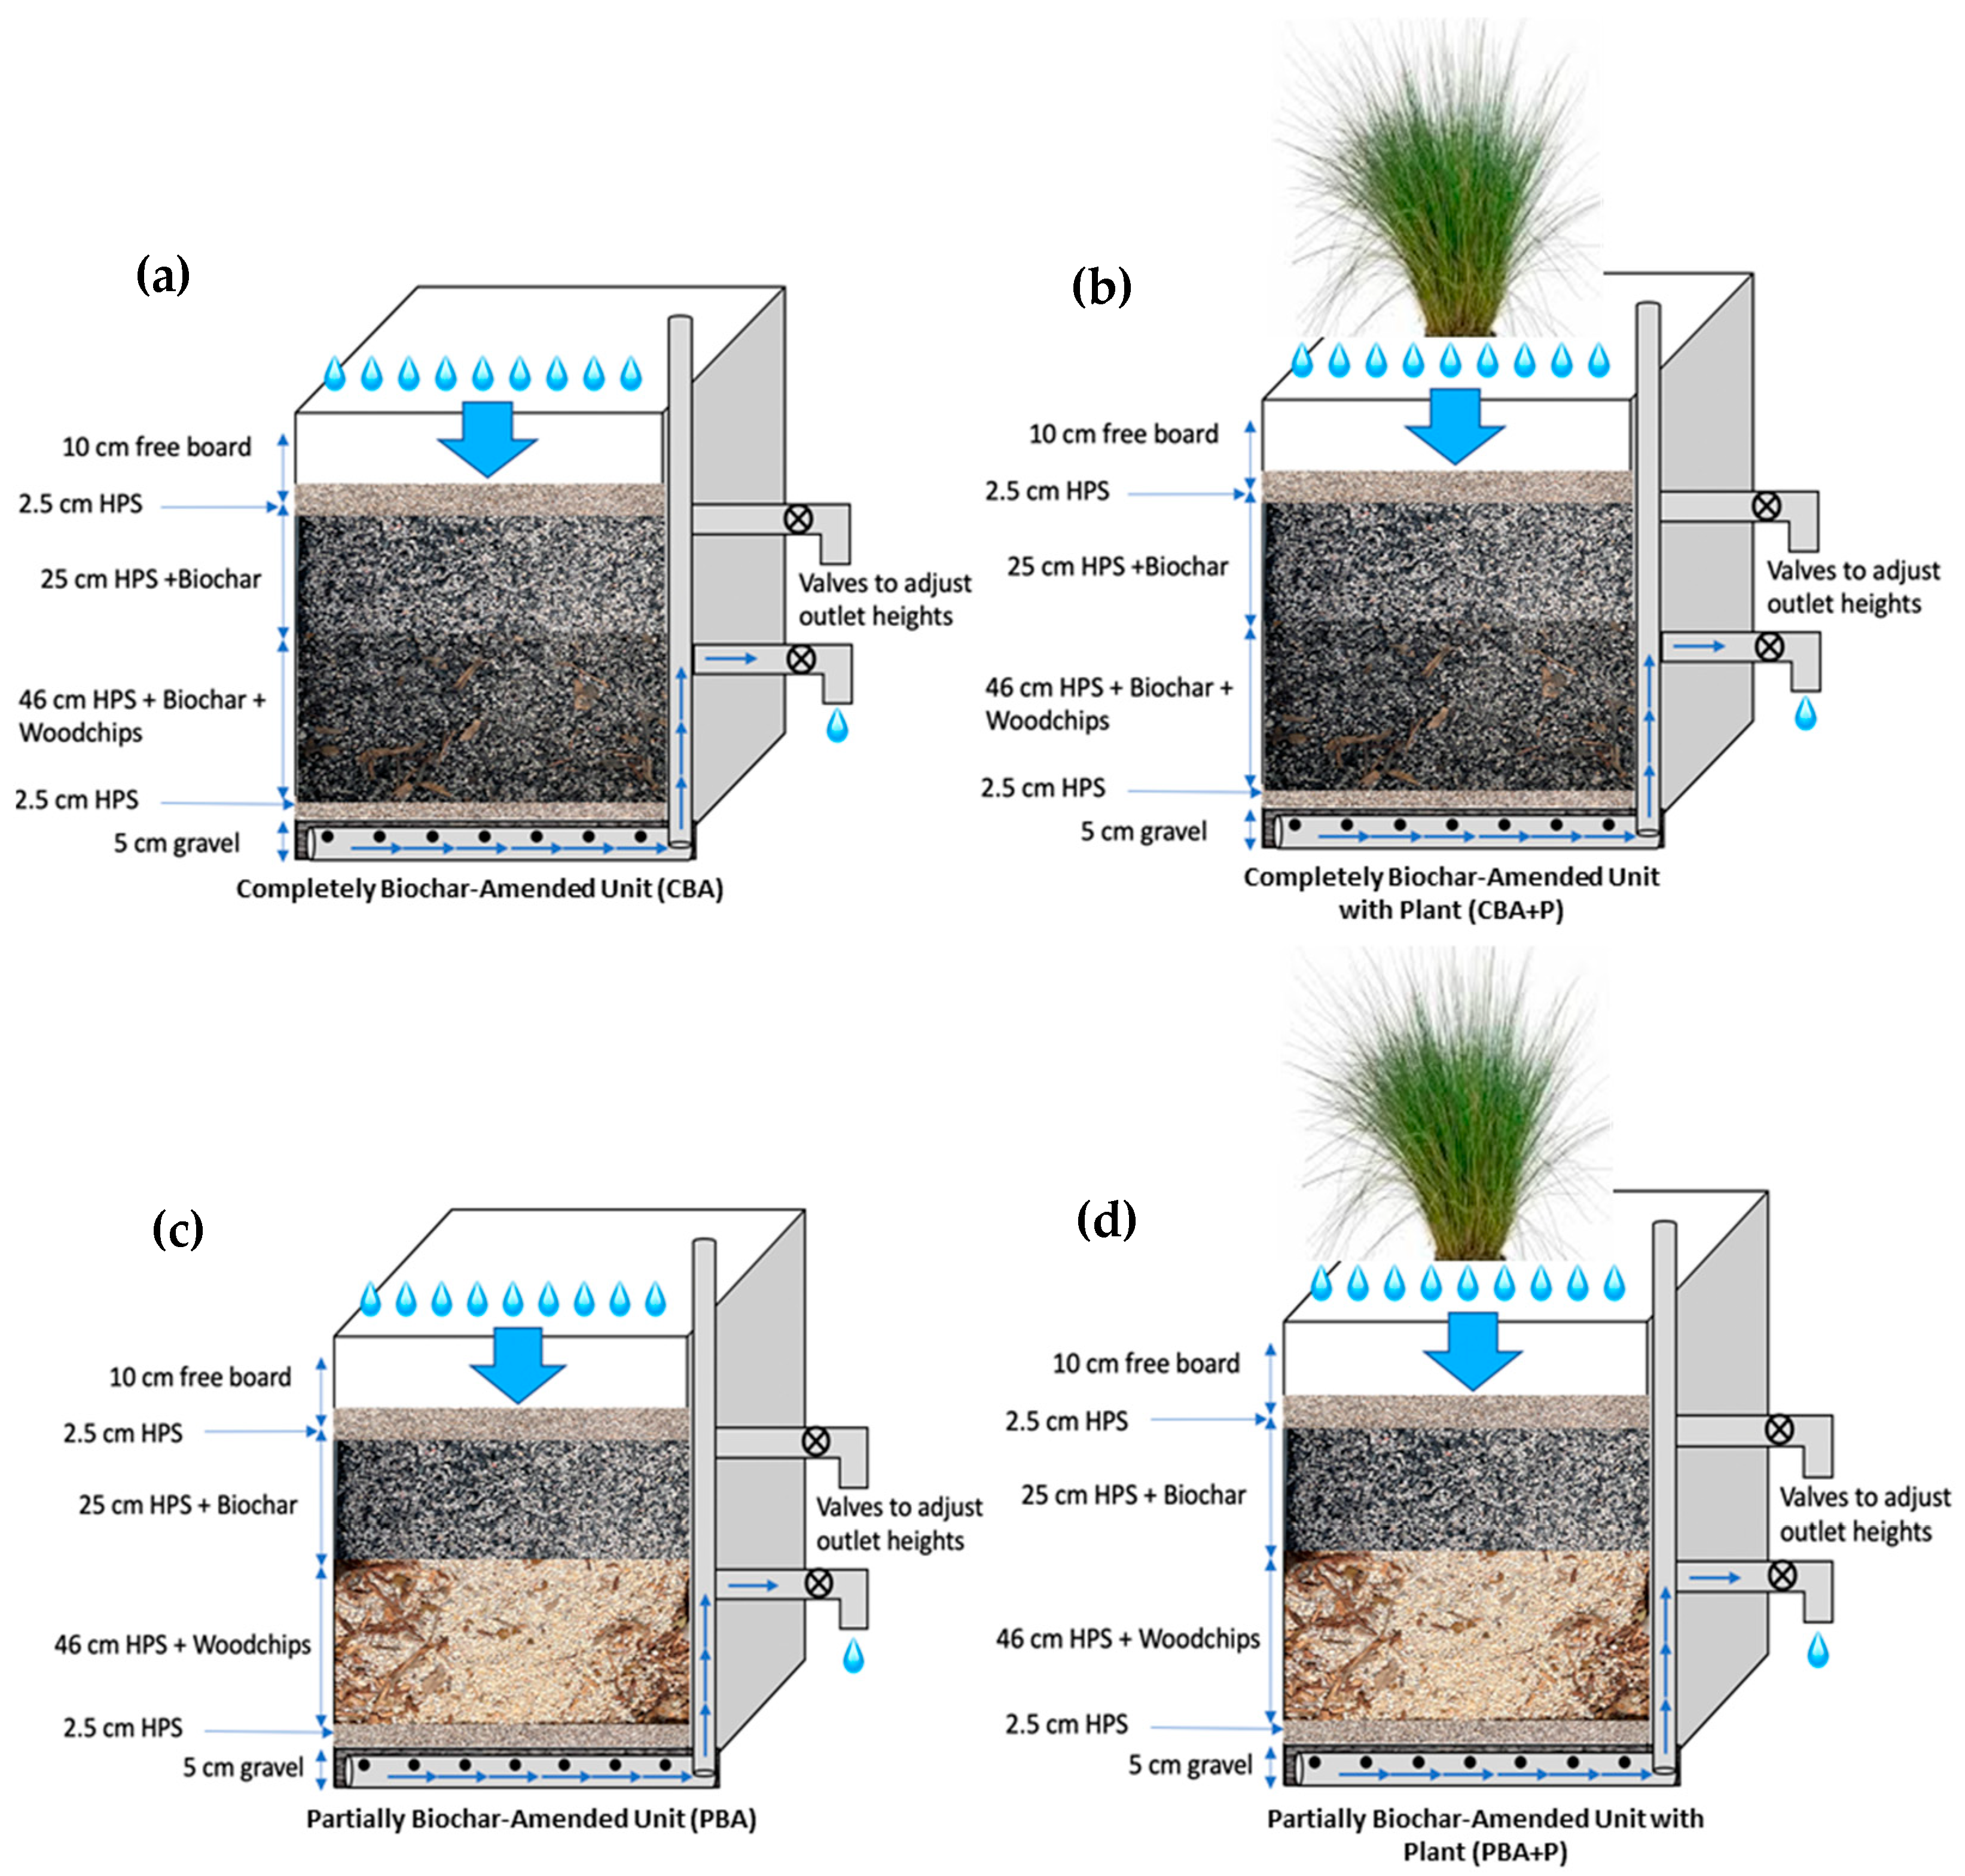
2.3. Pilot-Scale Bioretention Systems

Schematics of the two pilot-scale bioretention units before and after planting are shown in Figure 1. The two 340 L molded polyethylene tanks (0.9 m × 0.6 m × 0.6 m) were purchased from United States Plastics Corp. (Lima, OH, USA) (Figure S1). The outlet was configured with an underdrain and “upturned elbow” using 2.5 cm internal diameter PVC pipes. The upturned elbow was configured with ball valves to allow testing of varying outlet elevations; the lower outlet was 44 cm high, and the upper outlet was 69 cm high.
The completely biochar-amended unit (CBA) had biochar in both the IWSZ and unsaturated layer. The CBA unit consisted of the following layers (from bottom to top): 5 cm gravel drainage layer, 2.5 cm HPS separation layer, 46 cm HPS + biochar + woodchips (2:2:1 by volume), 25 cm HPS + biochar, 2.5 cm HPS, and 10 cm free board (Figure 1a). The partially biochar-amended unit (PBA) had biochar amendment only in the unsaturated layer. The PBA unit consisted of the following layers (from bottom to top): 5 cm gravel drainage layer, 2.5 cm HPS separation layer, 46 cm HPS + woodchips (4:1 by volume), 25 cm HPS + biochar, 2.5 cm HPS, and 10 cm free board (Figure 1c). Gravel and separation layers at the bottom of the system were designed to prevent clogging in the outlet pipes. The HPS layer at the top was used to prevent biochar from floating to the surface.
Auxiliary equipment included a screen, pump, and float switch (Danner Manufacturing, Inc., Islandia, NY, USA), powered by a Jackery (Freemont, CA, USA) power supply and solar panels. The float switch, power supply, and solar panels allowed for automatic operation of the bioretention systems when irrigation was initiated. The system was equipped with a float valve at the feed pipe to manage overflow, along with protective housing for the electrical components using a Husky professional heavy-duty storage container (Pacific, MO, USA) to protect against weather and insects.
The target HLR was calculated using Equation (1), assuming that the bioretention surface area would be designed as a percentage of the greenhouse area. The runoff flow rate (44 L/s) was based on the results of an influent runoff characterization study [40]. The irrigated greenhouse area was 49,000 m2 (~5 ha). This resulted in target HLRs of 0.11 cm/min, 0.22 cm/min, and 0.55 cm/min for bioretention areas of 5%, 2.5%, and 1% of the greenhouse area, respectively.
H L R = Q A = 44 L s 49,000   m 2 %   o f   a r e a 100 m 3 1000   L 100   c m m 60   s 1   m i n
After construction, the systems were fed nursery runoff for 1 month prior to sampling to acclimate microbial communities. The study investigated the effects of HLR (low, medium, high), outlet elevation (lower, upper), and plant presence on nutrient removal (Table S1). Each variable was tested in triplicate. During each event (Events 1–18), influent runoff and effluent samples from both systems (CBA and PBA) were collected every 30 min for 180 min, resulting in 21 samples per event. Events 1–3 operated at lower HLR, lower outlet height, and no plants; Events 4–6 operated at medium HLR, lower outlet height, and no plants; Events 7–9 operate at high HLR, lower outlet height, and no plants; Events 10–12 operated at high HLR, upper outlet height, and no plants; Events 13–15 operated at high HLR, lower outlet height, with plants; Events 16–18 operated at lower HLR, upper outlet height, with plants. Note that Event 2 data were excluded from data analysis due to interruptions in bioretention operations caused by rain.
Two Muhlenbergia capillaris (Muhly grass) plants, from Holmberg Farms (Lithia, FL, USA), where the project was located, were transplanted to convert the CBA and PBA units to CBA + P and PBA + P (Figure 1b,d). The significance of plant presence was studied during Events 13–18. Muhly Grass is a native Florida perennial with distinctive fluffy stalks that attract wildlife and thrive under sandy or rock soil and favorable light and moisture conditions [41]. Known for its adaptability, low maintenance requirements, and rapid growth rate, Muhly grass can reach up to 4 feet tall and wide, making it an excellent choice for bioretention systems [39,41]. After planting, the plants were given six weeks to become established before monitoring began.

2.4. Tracer Studies

Tracer studies were performed to investigate the influence of biochar amendment and outlet elevation on HRT. Experiments were carried out on both bioretention systems at both outlet heights (54 cm vs. 79 cm) with a constant HLR, and without Muhly grass. To begin the tracer study, a 1 L slug of 20 g/L potassium chloride (KCl) solution was sprayed onto the bioretention surface. Runoff was subsequently fed to the systems until the effluent conductivity was equal to the influent conductivity. Effluent conductivity was measured every 5 min, while influent conductivity was measured every 30 min and linearized to values every 5 min. Analysis of the tracer data was conducted following the method described by Crittenden et al. [42]. The SI includes Equations (S1)–(S13) used to carry out the calculations; additional details can be found in the study of Richardson [40].

2.5. Sample Collection and Water Quality Analysis

Samples were transported on ice to the University of South Florida (Tampa, FL, USA) Environmental Engineering laboratory for testing. All analytical methods followed Standard Method protocols [43]. Concentrations of NO2, NO3, and NH4+ were measured after filtration through 0.45 μm membrane filters (Fisher Scientific, Waltham, MA, USA) using a Metrohm 850 Ion Chromatography System (Herisau, Switzerland). Total inorganic nitrogen (TIN) was calculated as the sum of NO2-N, NO3-N, and NH4+-N. NOx-N was calculated as the sum of NO3-N and NO2-N. COD concentrations were measured using Lovibond (Amesbury, UK) test kits and a Lovibond spectrophotometer. pH and Alkalinity were measured using calibrated Orion 5-Star meter and probe (Thermo Scientific, Beverly, MA, USA). Dissolved oxygen (DO) and conductivity concentrations were measured in the field using a YSI ProQuatro multiparameter meter (Yellow Springs, OH, USA). Method Detection Limits (MDLs) were determined using Standard Method protocols [43] and can be found in the study of Richardson [40].

2.6. Data Analysis

Nutrient loading rate (NLR; mg/L-min) and Nutrient removal rate (NRR; mg/L-min) and % Load Reductions were calculated using Equations (2)–(5).
E B C T = V e m p t y Q
N L R = C 0 E B C T
N R R = C 0 C i E B C T
%   L o a d   R e d u c t i o n = 1 1 n Q i C i , n t 1 n Q i C 0 , n t 100 %
where EBCT is the empty bed contact time (min), Vempty is the total volume of the empty filter bed (L), Q is the influent flow rate (L/min), and C0 and Ci are the influent and effluent concentrations (mg/L). It is important to note that EBCT represents a simplified measure of contact time, as it considers the total volume of the filter bed without accounting for the media void space. The % Load Reduction represents the cumulative reduction (%) across all time points over the duration of the study. Due to the porous media’s high hydraulic conductivity, the systems were assumed to reach steady state quickly, with influent and effluent flow rates ( Q i ) considered equal to each other during each monitoring event. The subscript n represents sample number. The Δt values were the time between sample collection.
Statistical analysis was conducted using R (version 4.4.2, R Foundation for Statistical Computing, Vienna, Austria). A one-way analysis of variance (ANOVA) with a significance threshold of 95% (α = 0.05) was employed to identify significant differences in % Load Reductions across varying configurations and bioretention units. For statistical comparisons between configurations, a sample size (n) of 12 was used. For comparisons between systems (CBA vs. PBA), an n value of 34 was used.
To develop the regression model, outlier removal was addressed using Tukey’s interquartile range (IQR) method [44], retaining only NLR and NRR data points within the first quartile (Q1, representing the 25th percentile) and the third quartile (Q3, representing the 75th percentile) resulting in IQR = Q3 − Q1, where IQR measures the spread of the middle 50% of the data. This method ensured the robustness of the models by minimizing the impact of extreme values, which are defined as outliers < Q 1 ( 1.5 × I Q R ) or outliers > Q 3 + 1.5 × I Q R . The strength of the regression model was measured using R2, which indicates how well the model explains the variation in the data. A higher R2 value means the model fits the data better. This was used to compare models and select the one that best fits the data.

3. Results and Discussion

3.1. Tracer Studies and Hydraulic Performance

During irrigation, runoff was generated slowly after irrigation commenced, reached a steady flow rate of approximately 44 L/s between 75 and 220 min and decreased rapidly once irrigation ended (Figure S2). Pollutant loading rates, calculated by multiplying the flow rate and concentration, steadily increased over time and then decreased at the end of the event (Figure S3). The observed flow and nutrient loading results are typical of irrigated container plants, where drainage increases over time as pots become saturated, while nutrient leaching follows a “first flush” behavior, with the highest concentrations at the beginning of the event [45]. The flow rate value was scaled down using Equation (1), assuming a bioretention surface area of 5%, 2.5%, or 1% of the irrigated greenhouse area, leading to HLRs of 0.11 cm/min, 0.22 cm/min, and 0.55 cm/min, respectively.
Conservative tracer studies revealed key hydraulic differences (Table 1 and Figure 2) between bioretention systems with and without biochar in the IWSZ (Figures S4–S7). The CBA unit had a longer mean retention time (MRT) of 70 min compared with 46 min for the PBA unit, likely due to biochar’s microporosity reducing flow and hydraulic conductivity [46]. Parameters t10, t50, and t90 indicate the time that 10%, 50%, and 90% of the tracer mass exited the system. Short-circuiting was lower in the CBA unit (t50/MRT = 0.89) compared to the PBA unit (t50/MRT = 0.74), indicating reduced preferential flow, likely due to biochar’s macropores. The Morrill Dispersion Index (MDI) and “n” values for the tanks in series (TIS) model describe mixing and short-circuiting in the units [42]. When the units operated with the lower outlet, uniform flow in CBA was supported by lower MDI and standard deviation and a higher TIS n value. Differences between units were less pronounced when the effluent exited the upper outlet (Table 1). Raising the outlet height significantly increased the MRT at an equalized HLR (MRT multiplied by HLR). The MRT multiplied by the HLR experienced a 154% increase from 22 cm to 34 cm for the CBA unit and a 234% increase from 13 cm to 31 cm for the PBA unit. This indicates that MRT depends more on IWSZ residence time than time spent in the unsaturated layer. The results underscore biochar’s role in improving hydraulic efficiency and the impact of outlet height on retention and treatment efficiency. Influent and effluent specific conductivities and supporting data are shown in Tables S1–S4.

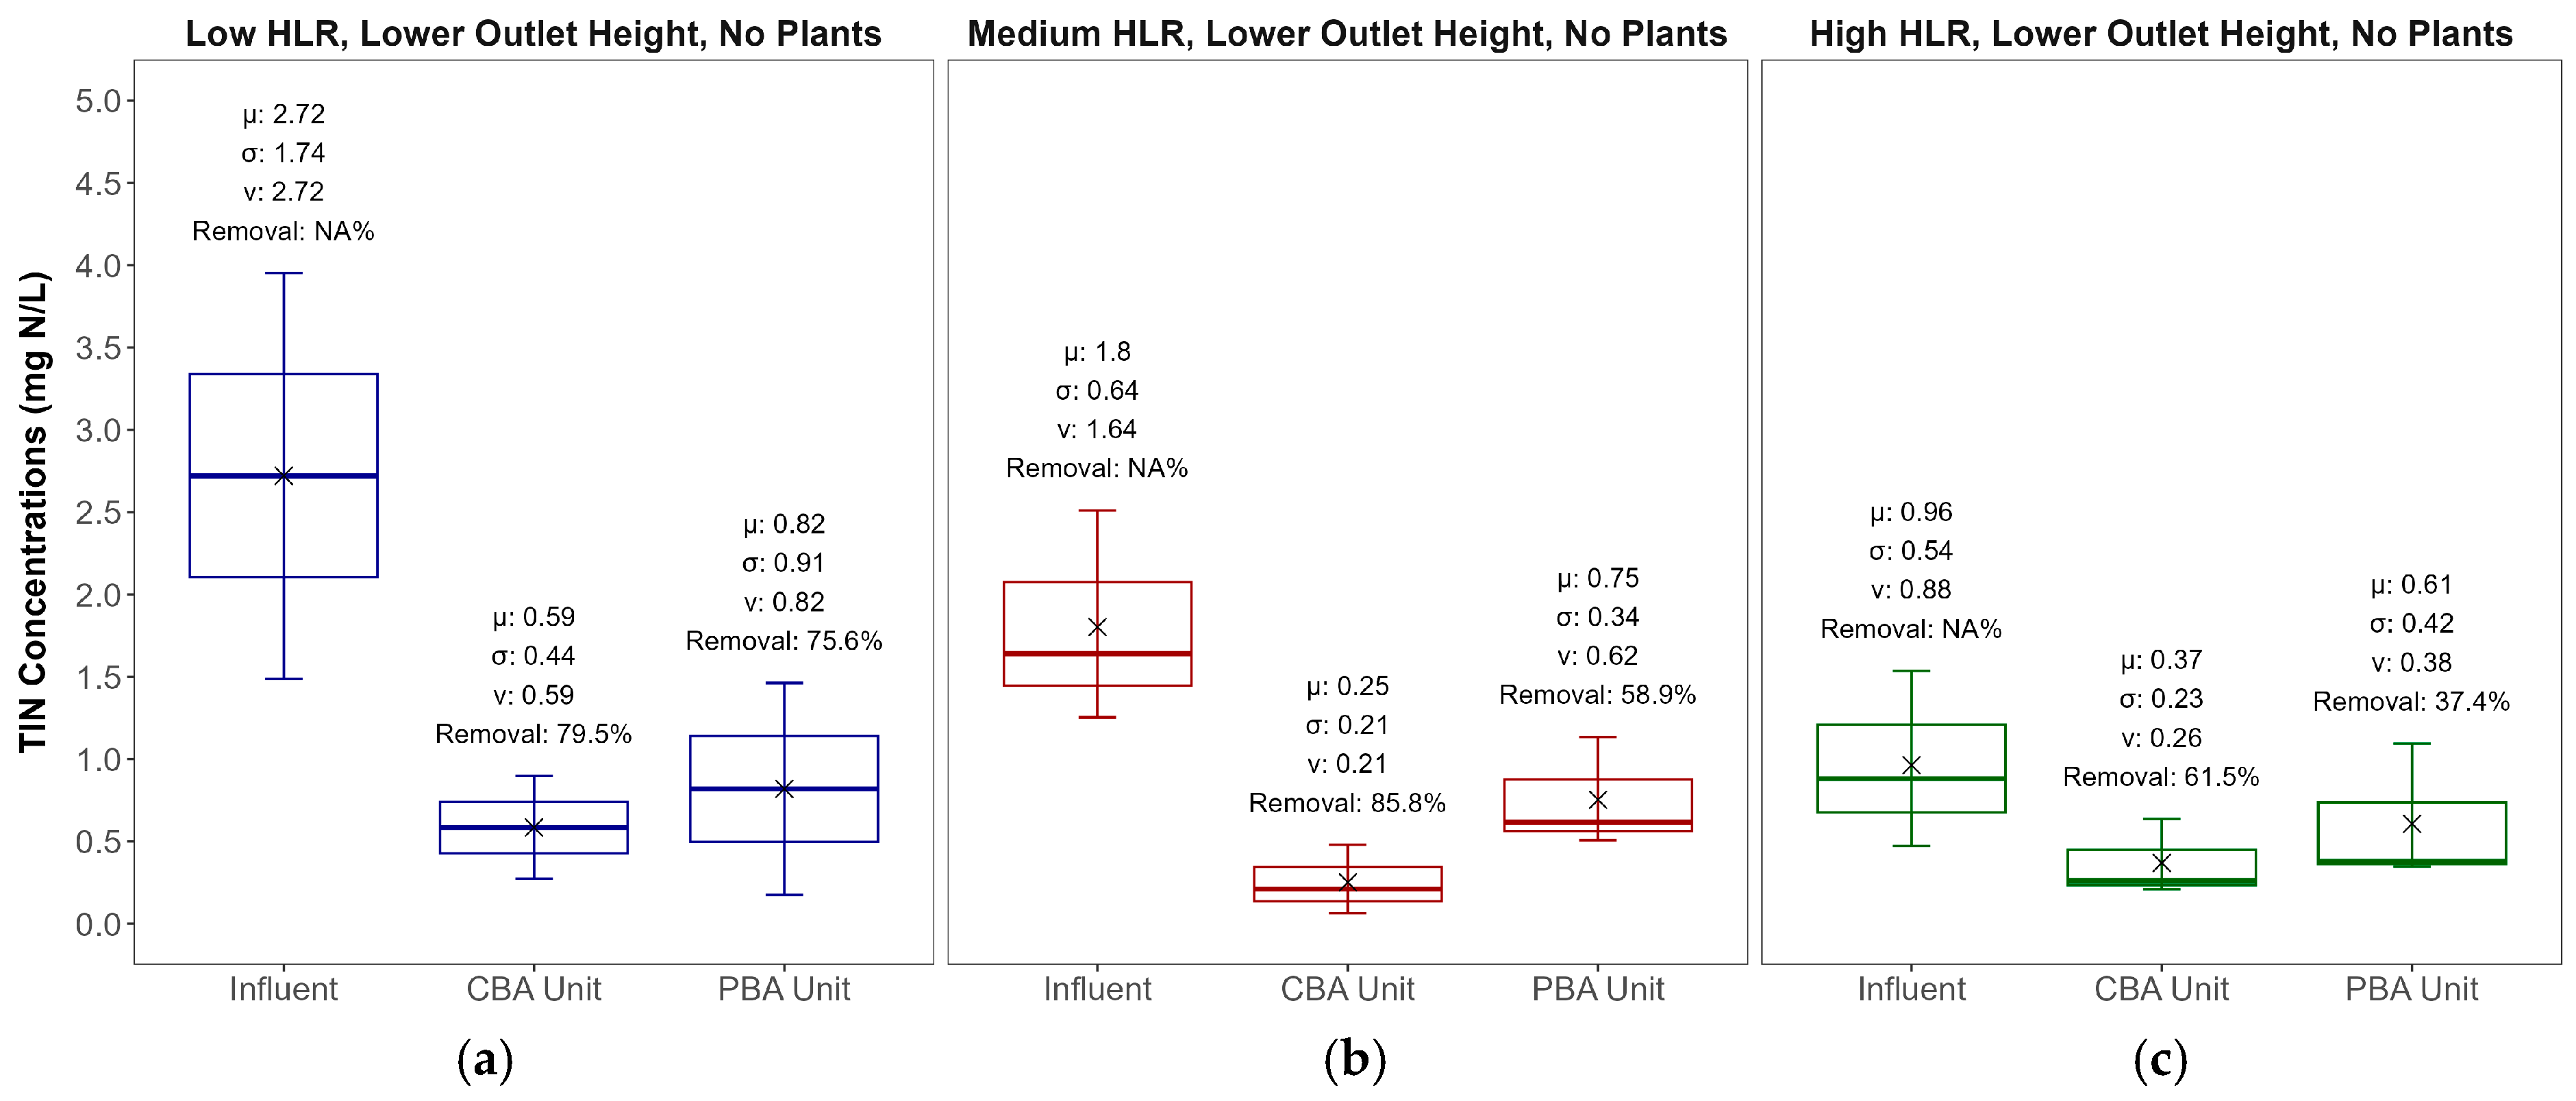
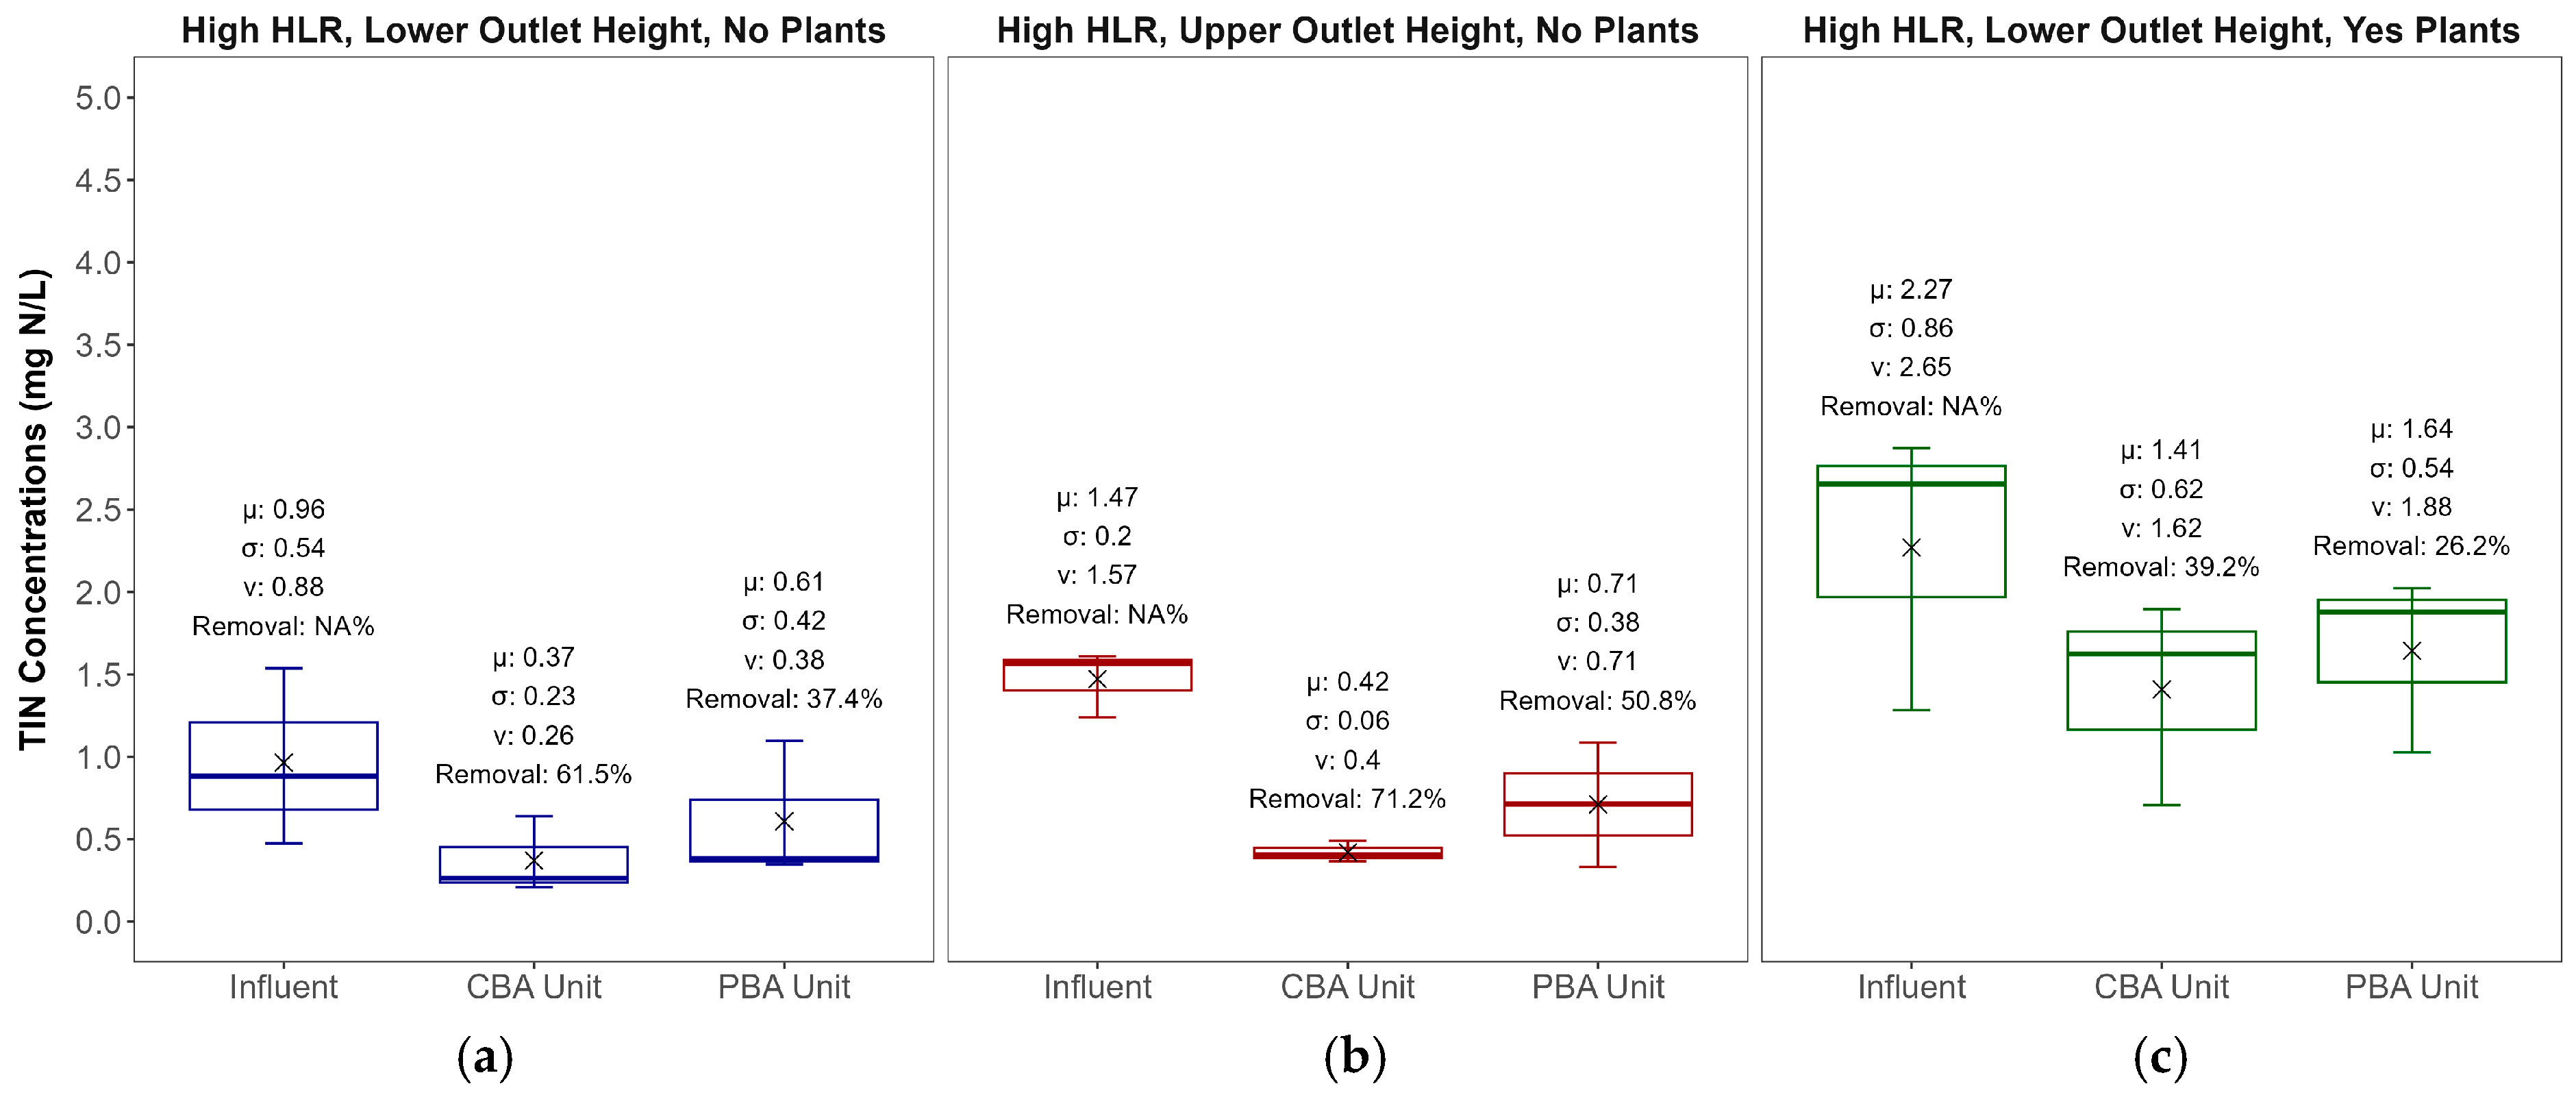
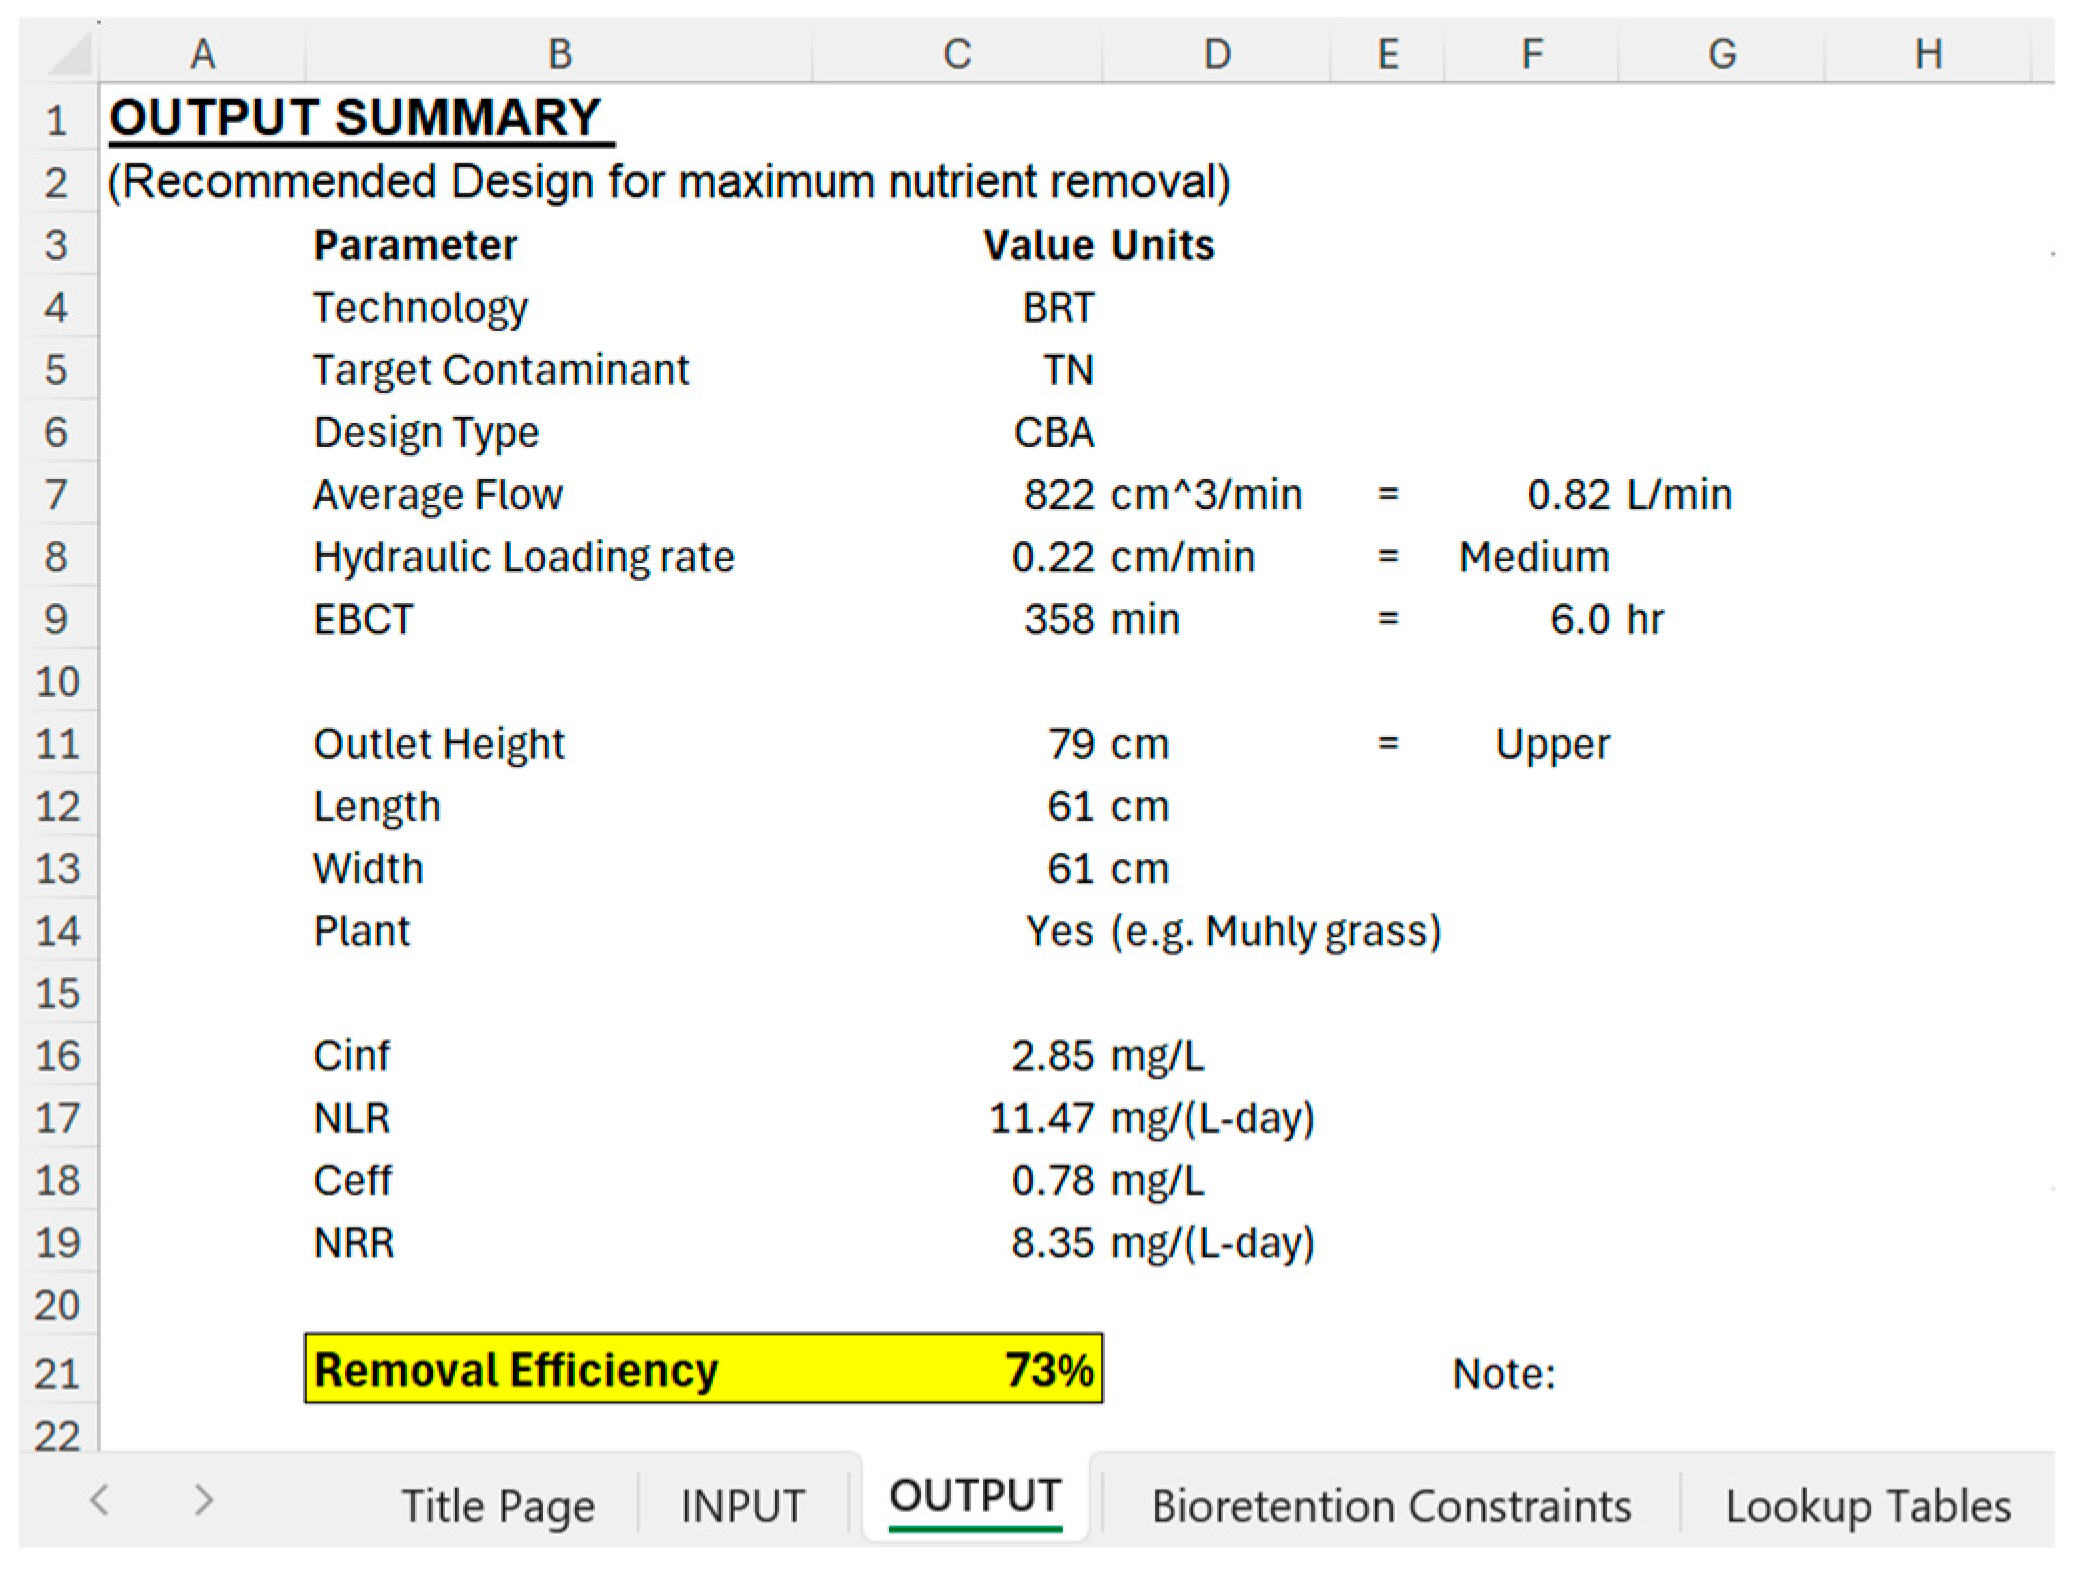
3.2. Nitrogen Removal

The flow-weighted average influent TIN concentration in the nursery runoff was 2.84 mg N/L, consisting of 0.18 mg/L of NH4+-N, 0.06 mg/L of NO2-N, and 2.55 mg/L of NO3-N. NO3 was the dominant inorganic nitrogen species across all events, making up 84% of influent TIN throughout the study (Table 2). Nitrate is the dominant form of N in controlled-release fertilizers (CRFs) and is highly mobile in soils [47,48].
Average flow-weighted effluent concentrations and removal efficiencies (Table 2) show consistent TIN and NOx-N removal, as has been reported for other woodchip-amended bioretention system studies [49]. The box and whisker plots in Figure 3, Figure 4 and Figure 5 illustrate the distribution of influent and effluent concentrations for the CBA and PBA units. These plots compare different biochar-amendment strategies, outlet elevations, and plant presence, and they are annotated with the mean (μ), standard deviation (σ), median (ν), and % Load Reductions. On average, TIN removal rates were 12 g/m3-day for the CBA unit and 10 g/m3-day for the PBA unit, showing that biochar amendment in the IWSZ can significantly enhance nitrogen removal rates, most likely by increasing retention times, reducing short-circuiting, and supporting microbial activity (Table 2, p = 0.031). The presence of biochar in the IWSZ of the CBA unit also reduced effluent DO concentrations (see Figures S8 and S9) compared with the PBA unit (Figure S10), which further promotes denitrification. During some events, a slight increase in effluent NO2 concentrations was observed, indicating either partial nitrification (NH4+ → NO2) or partial denitrification (NO3 → NO2). Higher export of NH4+ during some events was likely due to ammonification of organic N. Alkalinity increased across all events for both units, consistent with denitrification. An increase in effluent COD was observed in 17% of events for the CBA unit and 72% for the PBA unit, possibly due to organic carbon leaching from woodchips.
HLR was a critical factor affecting TIN removal, as shown in Figure 3 and Figure S11. Lower HLR leads to a longer HRT. This extended HRT provides more time for mass transfer and degradation of the substrate loads. Significant differences in TIN removal were observed between low and high HLR events (p = 0.022) and medium and high HLR events (p = 0.046), with lower HLR achieving greater load reductions, while no significant difference was found between low and medium HLR events (p > 0.05). There was a small but not significant (p > 0.05) increase in TIN removal when the systems were configured with the upper outlet elevation (Figure 4). These findings suggest that decreasing the HLR and increasing the depth of the IWSZ can improve TIN removal by extending residence time in the IWSZ and promoting denitrification pathways. Based on these results, subsequent testing prioritized a medium HLR and an upper outlet height.

3.3. Effect of Plants

As shown in Figure 4 and Figure 5, the addition of Muhly Grass to the bioretention systems influenced TIN removal in both systems. Before planting, systems operating at high HLR (0.55 cm/min) and low outlet height achieved 61.5% TIN removal for CBA and 37.4% for PBA. After planting, TIN removal initially decreased to 39.2% for CBA + P and 26.2% for PBA + P, an unexpected outcome, likely due to leaching of a residual controlled-release fertilizer from the root systems. Sarazen et al. [32] emphasized the need for monitoring to prevent nutrient leaching after plant and media establishment. Additional monitoring of the bioretention systems with plants continued throughout Events 16–18 for the two bioretention systems operating at the “optimal” design of a medium HLR of 0.22 cm/min, upper outlet height, and with established plants (Figure 5). Under these conditions, the systems were able to achieve the highest overall TIN load reductions of 83.70% for CBA + P and 78.6% for PBA + P. Biochar addition to the IWSZ also dramatically enhanced plant growth in the CBA + P system, with an above-ground biomass of 0.73 kg compared to 0.23 kg in the unamended PBA + P system. Previously published studies have reported that biochar increases the height and biomass of plants such as Sesbania cannabina [50,51], Medicago sativa, Amaranthus caudatus, and Zea mays [52]. Visual observations also indicated greater root development in the CBA + P system (Figure 6). The greater root development is attributed to biochar’s ability to increase soil organic carbon [53], moisture retention, and nutrient availability [54] and enhance soil structure [55]. This makes biochar addition in the CBA + P system conducive to microbial growth and activity in the rhizosphere by promoting plant growth [56].

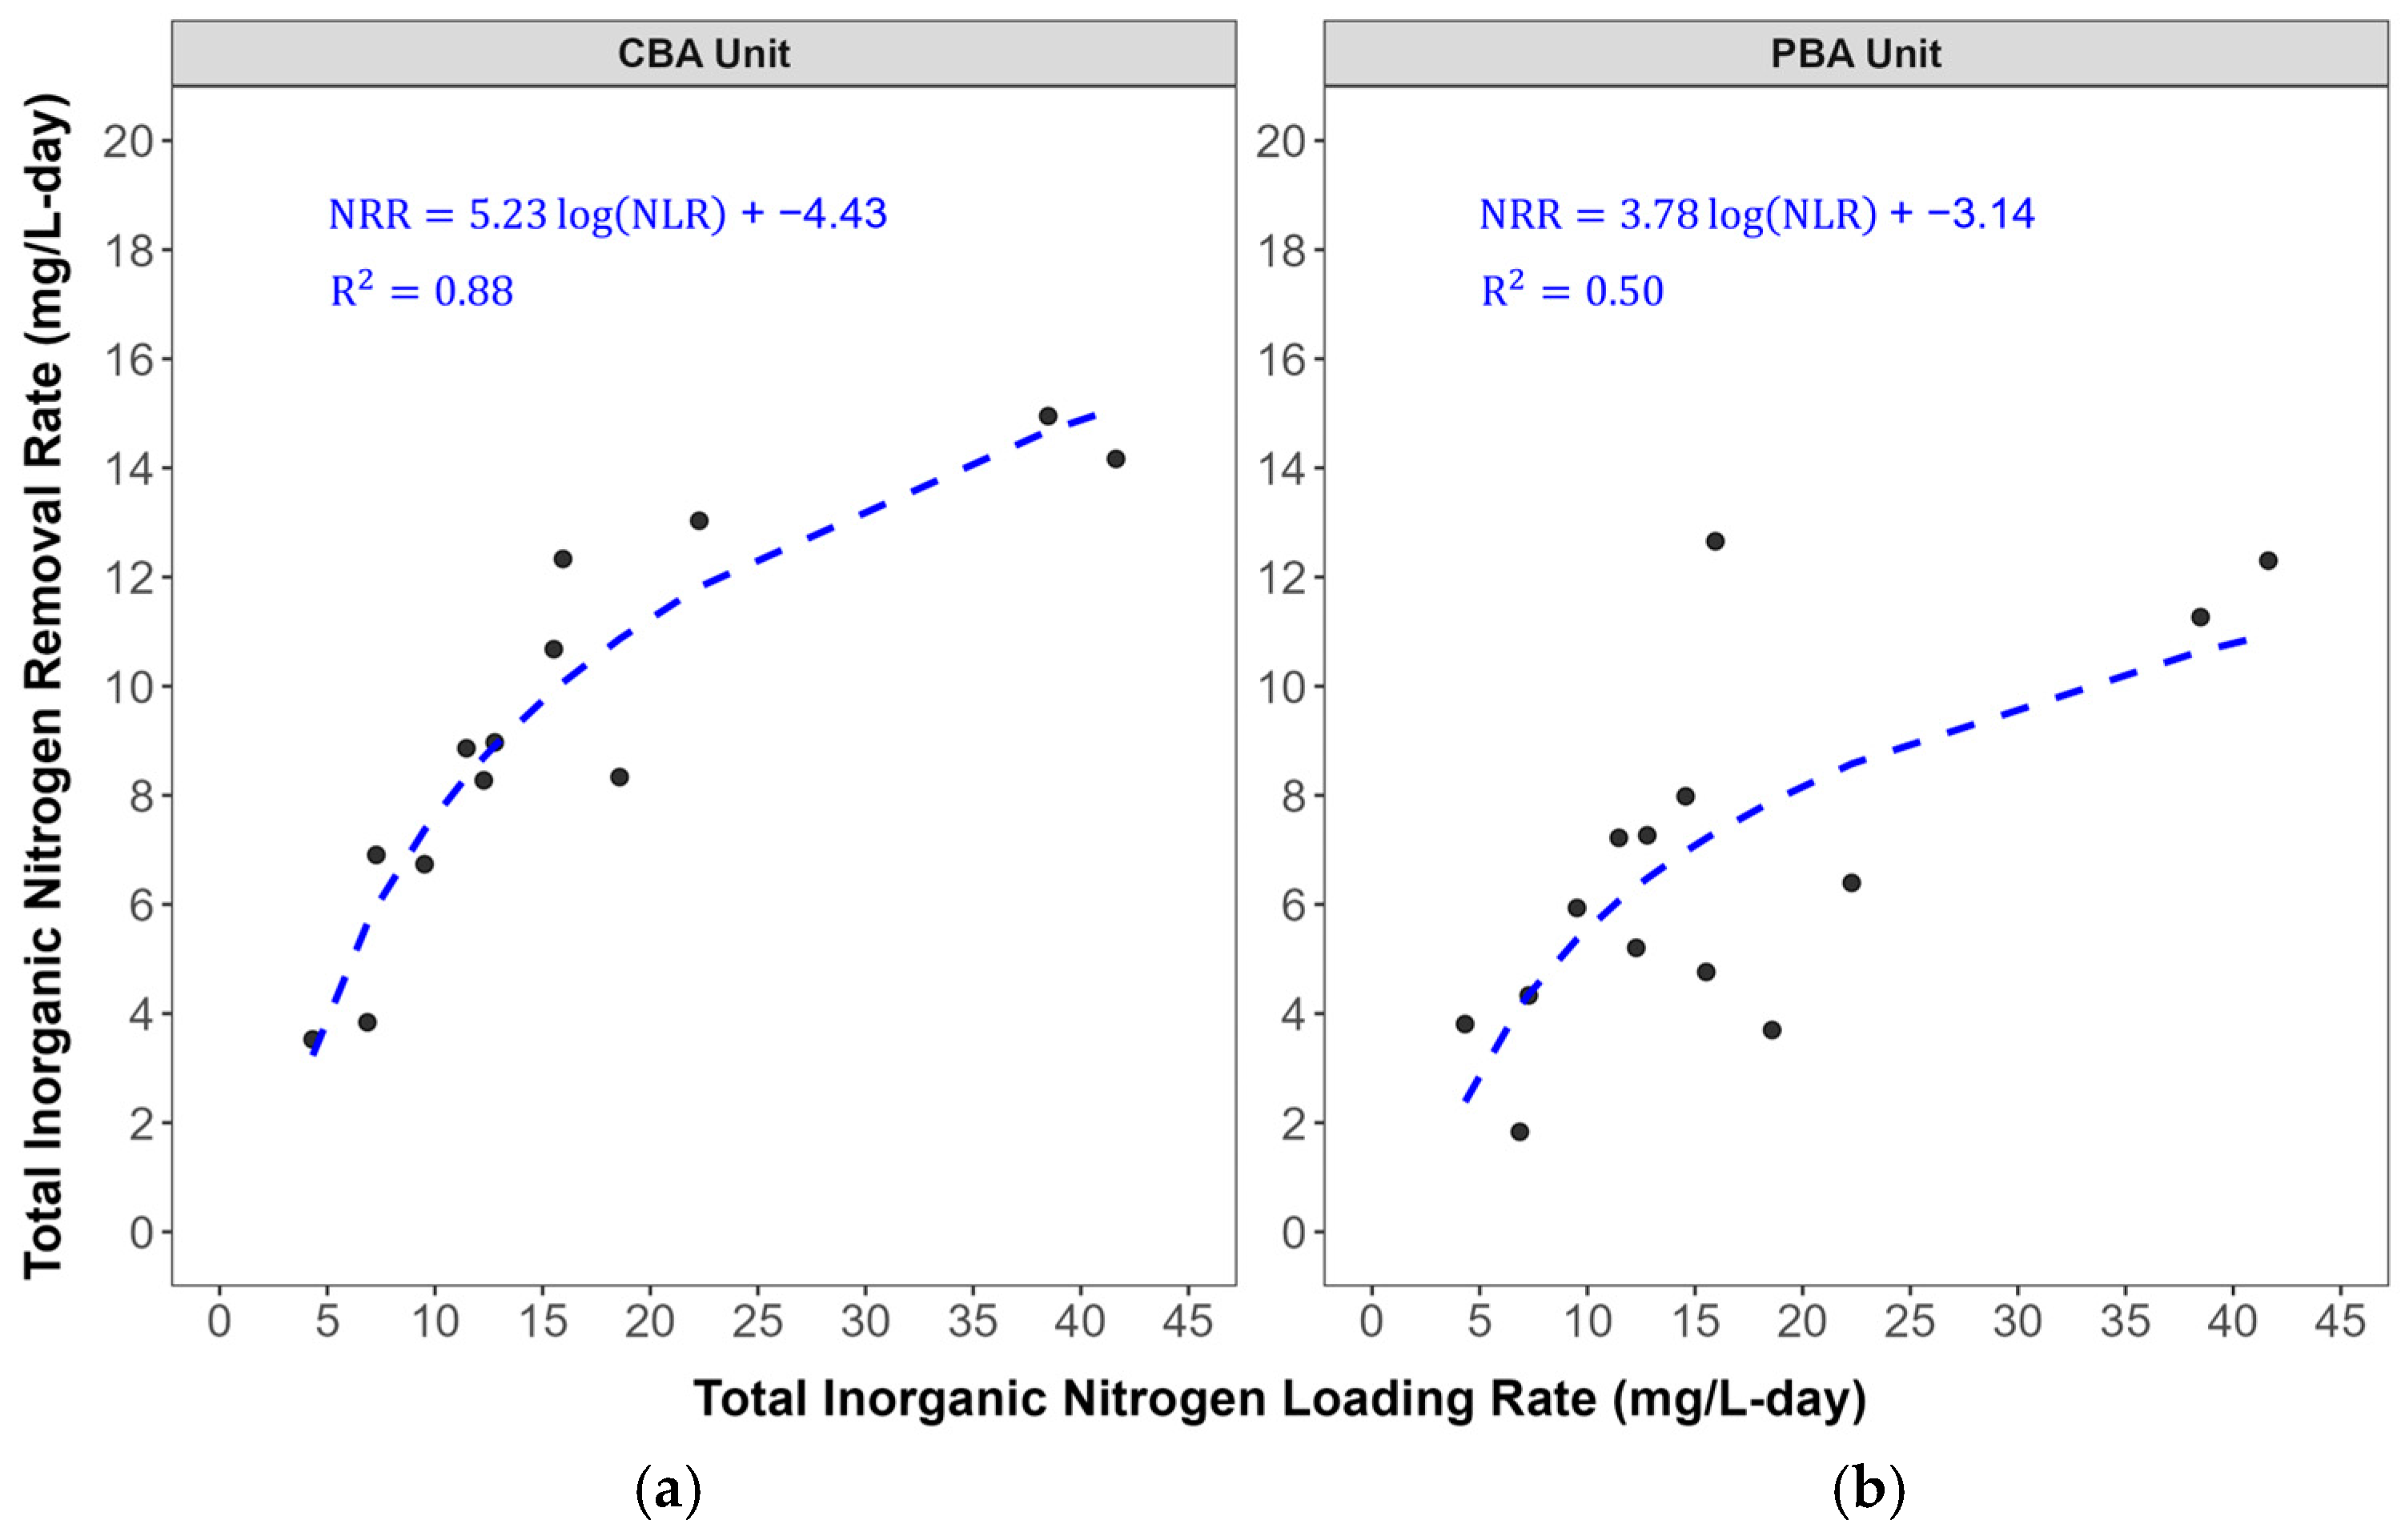
3.4. Regression Model

The logarithmic regression model, combined with Tukey’s outlier removal method achieved the highest overall R2, indicating the best fit among the tested models. It was selected because it more accurately captures the relationship between NLR and NRR (Figure 7 and Figure 8). Other tested models included standard linear regression with outlier removal methods, such as Cook’s distance, robust regression, and Windsorized regression, did not perform as well with lower R2 (Figure S12). The model dataset consisted of 17 points, representing the average values for each event from a total of 18 events, excluding Event 2 due to interruptions in runoff and bioretention operations caused by rain. For TIN removal, the IQR method excluded three outliers for the CBA unit (final N = 16), while all 17 points were retained for the PBA unit. No outliers were removed for NOx-N in either unit. The CBA unit demonstrated a strong correlation between NLR and NRR, with R2 values of 0.88 for TIN and 0.86 for NOx-N (Figure 7 and Figure 8).
In contrast, the PBA unit showed greater variability, with lower R2 values of 0.50 for TIN and 0.60 for NOx-N. This variability may have been due to short-circuiting, where the influent bypasses the media, potentially causing the poor fit between the model and experimental results. These findings further support the hypothesis that biochar amendment in the IWSZ enhances hydraulic efficiency by mitigating short-circuiting and improving the overall system performance.
The results reveal that while NLR initially increases removal efficiency due to higher substrate mass transfer and utilization rates, the system eventually saturates, causing the removal rate to plateau. Increasing the outlet height to deepen the IWSZ may mitigate these effects by extending the residence time and promoting denitrification pathways. Incorporating plants further supported nitrogen removal through nutrient uptake and increased microbial activity. For high loading conditions, expanding the bioretention system volume or depth may be necessary to sustain efficiency to accommodate a higher runoff volume.
A spreadsheet-based tool was developed for preliminary design of a bioretention system tailored to treat runoffs from commercial nurseries with similar water quality characteristics as the demonstration site. The tool incorporates logarithmic regression models derived from this study. Default nutrient concentrations were derived from experimental averages in this study [40]. Using runoff volume and nutrient concentrations, the tool uses the model to estimate NLR and predicts NRR. Farmers can customize inputs such as bioretention system size and biochar inclusion to calculate the required surface area and nitrogen removal efficiency. This user-friendly spreadsheet tool streamlines nutrient management for irrigation runoff, providing a practical solution for improving water quality. Figure 9 and Figure 10 illustrate the tool’s input parameters and output results.

3.5. Cost Estimation

Bioretention systems are increasingly adopted as sustainable and effective stormwater management solutions for both agricultural and urban areas to mitigate runoff and improve water quality [17]. The installation of a bioretention system typically involves several stages, including design and engineering, plant selection, soil preparation, and ongoing maintenance. For agricultural applications, examples include a ditch diversion bioreactor (35 × 7.9 × 0.9 m) installed in November 2015 on a private farm (soybean, lima bean, or sweet corn–spinach) in Caroline County, Maryland, US. This system treated a 35-hectare (ha) drainage area at a total cost of $27,000, equivalent to $770/ha of treated area [57]. Another example used three in-line, in-ditch woodchip bioreactors (two at 27 × 1.1 × 0.7 m and one at 38 × 1.1 × 0.7 m) installed in December 2015 on a corn–wheat–soybean farm in Somerset County, Maryland, US. These bioreactors treated a 6.6-hectare area at a total cost of $18,000, or $2700/ha [57]. Generally, installation costs for subsurface drainage woodchip bioreactors in agricultural areas range from less than $5000 to $27,000 [58]. In urban settings, bioretention construction costs typically range from $5000 to $10,000 for larger areas or $33/m2 to $162/m2, depending on site-specific factors such as soil type. For example, costs vary from $17 to $33/m2 for highly permeable soils and $43/m2 to $65/m2 for slowly permeable soils [59,60].
Assuming the effective incorporation of biochar into modified bioretention systems requires 20% (PBA) to 40% biochar by volume (CBA). If a bioretention system has a total media volume of 100 m3 to treat a 1-hectare drainage area, and the density of biochar is approximately 0.19 g/cm3 (0.21 tons/m3) as used in this study, then about 20 m3 (4.2 tons) to 40 m3 (8.4 tons) of biochar would be needed. Biochar typically cost between $200–$1000 per ton, averaging around $400/ton but varying depending on quality [61]. At an average cost of $350/ton for wood biochar [62], this would result in an additional biochar cost ranging from $1470 to $2940 amended to the bioretention system, depending on the specific design and biochar pricing. Compared with other BMPs, biochar-amended bioretention systems are considered to have a more constant cost with relatively lower construction cost. For example, the initial construction cost for a free water surface constructed wetland averaged about $18,200/ha for systems treating less than 3785 m3/day, with operating costs ranging from $0.026/m3 to $0.08/m3 treated [63].

3.6. Limitations

This study has multiple limitations. The bioretention units were set up in closed tanks rather than open systems in the field. A slipstream from the main flow of the greenhouse runoff was pumped at a constant HLR during each event rather than having the flow vary over time. Influent runoff was distributed across the top of each unit more evenly than typical full-scale systems in the field. By performing so, potential short cutting and poor performance may have been prevented. In addition, operational issues, such as clogging of the effluent piping, and the growth of invasive vegetation, are more easily controlled with the pilot-scale units. It is unknown how performance would be affected if these issues occurred in field scale systems.

4. Conclusions

Nitrogen removal was investigated in modified biochar-amended bioretention systems for treatment of nursery runoff. Two pilot-scale units were set up to treat runoff from a commercial citrus nursery. Both units included biochar in the unsaturated zone to capture NH4+ and enhance nitrification. One of the units also had biochar and woodchips added to the IWSZ media (CBA) and the other unit contained a mixture of sand and woodchips in the IWSZ (PBA). Variables investigated included HLR, upturned outlet elevation, and the presence of vegetation (Muhly Grass).
Biochar amendment in the IWSZ resulted in several benefits to bioretention performance. Conservative tracer studies showed that biochar in the IWSZ improved hydraulic efficiency by mitigating short-circuiting (34% increase in mean retention time). Total inorganic nitrogen removal efficiency was significantly higher in CBA (p = 0.031) compared to PBA. After planting with Muhly Grass, the CBA unit had three times the above-ground plant biomass growth (0.73 kg in CBA vs. 0.23 kg in PBA), which likely enhanced performance by promoting nutrient uptake and rhizosphere microbial activity. During the final events, the highest nitrogen removal efficiency (84%) was achieved in the planted CBA unit, at a HLR of 0.22 cm/min and an IWSZ depth of 69 cm.
A spreadsheet-based tool, utilizing a logarithmic regression model for CBA (R2 = 0.88 for TIN, 0.86 for NOx) and PBA (R2 = 0.50 for TIN, 0.60 for NOx), was developed for system design to achieve nitrogen removal targets. The greater variability in the PBA-fitted model (lower R2) compared to CBA supports biochar’s ability to mitigate short-circuiting and improve hydraulic performance. The model formed the basis of a spreadsheet-based bioretention design tool that can be used by farmers to achieve nitrogen reduction targets. This is the first study to investigate the use of bioretention for treatment of nursery runoff and the effects of biochar addition to the IWSZ on hydraulic efficiency and nitrogen removal.

Supplementary Materials

The following supporting information can be downloaded at: https://www.mdpi.com/article/10.3390/w17030330/s1, Figure S1: Photographs of bioretention units; Table S1: experimental design details; Equations (S1)–(S13): Equations used for analysis of tracer data; Figures S2 and S3: runoff characterization results details; Figures S4–S7: tracer results details, Table S2: Tracer flow rates; Tables S3–S6: Detailed tracer study data; Figures S8–S10: Influent and effluent concentrations for irrigation event 8; Figure S11: TIN load reduction summary; Figure S12: regression model details and code.

Author Contributions

Conceptualization, M.H.N., S.J.E. and N.R.; methodology, M.H.N., S.J.E., N.R. and A.S.B.; formal analysis, N.R. and N.L.; investigation, N.R., N.L. and A.S.B.; resources, M.H.N. and S.J.E.; data curation, N.R., N.L. and A.S.B.; writing—original draft preparation, N.R. and N.L.; writing—review and editing, M.H.N., S.J.E. and A.S.B.; visualization, N.R. and N.L.; supervision, M.H.N. and S.J.E.; project administration, M.H.N. and S.J.E.; funding acquisition, M.H.N. and S.J.E. All authors have read and agreed to the published version of the manuscript.

Funding

This research was funded by the Florida Department of Agriculture and Consumer Services Office of Agricultural Water Policy (Contact Number 028514), the U.S. Environmental Protection Agency (Assistance Agreement No. 84009001), and the National Science Foundation (NSF) under Grant No. 1930451. Any opinions, findings, conclusions, or recommendations expressed in this publication are those of the author(s) and do not necessarily reflect the view of FDAC, U.S. EPA, NSF, or state regulating agencies.

Data Availability Statement

The EXCEL tool and original data presented in the study are openly available at https://github.com/natchayal/FDACS_Bioretention_project, accessed on 8 August 2024.

Acknowledgments

The authors would like to thank and acknowledge Stephanie Rodriguez, Olta Tarko, and Vicky Lopez for support in the field and laboratory; Jiayi Hua for assisting with the cost estimation; and staff at Holmberg Farms for their assistance with this project.

Conflicts of Interest

The authors declare no conflicts of interest.

References

  1. Hall, C.R.; Hodges, A.W.; Khachatryan, H.; Palma, M.A. Economic Contributions of the Green Industry in the United States in 2018. J. Environ. Hort. 2020, 38, 73–79. [Google Scholar]
  2. U.S. Environmental Protection Agency (USEPA). Numeric Nutrient Criteria for the State of Florida: Withdrawing the Federal Actions. Available online: https://www.epa.gov/sites/default/files/2015-07/documents/factsheet-withdrawl-2014.pdf (accessed on 15 November 2024).
  3. Wang, C.; Miao, Q.; Wei, Z.; Guo, Y.; Li, J.; Fan, Z.; Hu, Y.; Zhang, H.; Sun, J.; Cui, Z. Nutrient Runoff and Leaching under Various Fertilizer Treatments and Pedogeographic Conditions: A Case Study in Tobacco (Nicotiana tabacum L.) Fields of the Erhai Lake Basin, China. Eur. J. Agron. 2024, 156, 127170. [Google Scholar] [CrossRef]
  4. U.S. Environmental Protection Agency (USEPA). Sources and Solutions: Agriculture. Available online: https://www.epa.gov/nutrientpollution/sources-and-solutions-agriculture (accessed on 8 January 2025).
  5. Rahman, M.Y.A.; Richardson, N.; Nachabe, M.H.; Ergas, S.J. Treatment of Dairy Farm Runoff in Vegetated Bioretention Systems Amended with Biochar. Water 2024, 16, 1347. [Google Scholar] [CrossRef]
  6. U.S. Environmental Protection Agency (USEPA). National Strategy for the Development of Regional Nutrient Criteria. Available online: https://www.epa.gov/sites/default/files/2018-10/documents/nutrient-strategy-1998.pdf (accessed on 15 November 2024).
  7. U.S. Environmental Protection Agency (USEPA). Office of Water Fact Sheet: Introduction to Clean Water Act (CWA) Section 303(d) Impaired Waters Lists. Available online: https://nepis.epa.gov/Exe/ZyPURL.cgi?Dockey=P1008DPU.TXT (accessed on 15 November 2024).
  8. Putnam, A.H. Water Quality/Quantity Best Management Practices for Florida Nurseries. Available online: https://www.fdacs.gov/content/download/37570/file/nurseryBMP-lores.pdf (accessed on 15 November 2024).
  9. Biswal, B.K.; Vijayaraghavan, K.; Adam, M.G.; Lee Tsen-Tieng, D.; Davis, A.P.; Balasubramanian, R. Biological Nitrogen Removal from Stormwater in Bioretention Cells: A Critical Review. Crit. Rev. Biotechnol. 2022, 42, 713–735. [Google Scholar] [CrossRef] [PubMed]
  10. Taylor, M.D.; White, S.A.; Chandler, S.L.; Klaine, S.J.; Whitwell, T. Nutrient Management of Nursery Runoff Water Using Constructed Wetland Systems. Hort. Tech. 2006, 16, 610–614. [Google Scholar] [CrossRef]
  11. Huett, D.O.; Morris, S.G.; Smith, G.; Hunt, N. Nitrogen and Phosphorus Removal from Plant Nursery Runoff in Vegetated and Unvegetated Subsurface Flow Wetlands. Water Res. 2005, 39, 3259–3272. [Google Scholar] [CrossRef] [PubMed]
  12. Spangler, J.T.; Sample, D.J.; Fox, L.J.; Owen, J.S.; White, S.A. Floating Treatment Wetland Aided Nutrient Removal from Agricultural Runoff Using Two Wetland Species. Ecol. Eng. 2019, 127, 468–479. [Google Scholar] [CrossRef]
  13. Mulbry, W.; Kondrad, S.; Pizarro, C.; Kebede-Westhead, E. Treatment of Dairy Manure Effluent Using Freshwater Algae: Algal Productivity and Recovery of Manure Nutrients Using Pilot-Scale Algal Turf Scrubbers. Bioresour. Technol. 2008, 99, 8137–8142. [Google Scholar] [CrossRef]
  14. Prosser, R.S.; Hoekstra, P.F.; Gene, S.; Truman, C.; White, M.; Hanson, M.L. A Review of the Effectiveness of Vegetated Buffers to Mitigate Pesticide and Nutrient Transport into Surface Waters from Agricultural Areas. J. Environ. Manag. 2020, 261, 110210. [Google Scholar] [CrossRef]
  15. Lambrechts, T.; François, S.; Lutts, S.; Muñoz-Carpena, R.; Bielders, C.L. Impact of Plant Growth and Morphology and of Sediment Concentration on Sediment Retention Efficiency of Vegetative Filter Strips: Flume Experiments and VSMOD Modeling. J. Hydrol. 2014, 511, 800–810. [Google Scholar] [CrossRef]
  16. Larson, R.A.; Safferman, S.I. Field Application of Farmstead Runoff to Vegetated Filter Strips: Surface and Subsurface Water Quality Assessment. J. Environ. Qual. 2012, 41, 592–603. [Google Scholar] [CrossRef] [PubMed]
  17. Osman, M.; Wan Yusof, K.; Takaijudin, H.; Goh, H.W.; Abdul Malek, M.; Azizan, N.A.; Ab. Ghani, A.; Sa’id Abdurrasheed, A. A Review of Nitrogen Removal for Urban Stormwater Runoff in Bioretention System. Sustainability 2019, 11, 5415. [Google Scholar] [CrossRef]
  18. Donaghue, A.G.; Morgan, N.; Toran, L.; McKenzie, E.R. The Impact of Bioretention Column Internal Water Storage Underdrain Height on Denitrification Under Continuous and Transient Flow. Water Res. 2022, 214, 118205. [Google Scholar] [CrossRef]
  19. Ergas, S.J.; Sengupta, S.; Siegel, R.; Pandit, A.; Yao, Y.; Yuan, X. Performance of Nitrogen-Removing Bioretention Systems for Control of Agricultural Runoff. J. Environ. Eng. 2010, 136, 1105–1112. [Google Scholar] [CrossRef]
  20. Mai, Y.; Huang, G. Hydrology and Rainfall Runoff Pollutant Removal Performance of Biochar-Amended Bioretention Facilities Based on Field-Scale Experiments in Lateritic Red Soil Regions. Sci. Total Environ. 2021, 761, 143252. [Google Scholar] [CrossRef] [PubMed]
  21. Lopez-Ponnada, E.V.; Lynn, T.J.; Ergas, S.J.; Mihelcic, J.R. Long-Term Field Performance of a Conventional and Modified Bioretention System for Removing Dissolved Nitrogen Species in Stormwater Runoff. Water Res. 2020, 170, 115336. [Google Scholar] [CrossRef]
  22. Jiang, C.; Li, J.; Li, H.; Li, Y. Experiment and Simulation of Layered Bioretention System for Hydrological Performance. J. Water Reuse Desalin. 2019, 9, 319–329. [Google Scholar] [CrossRef]
  23. Anil Kumar, M.; Moradeeya, P.G.; Manikanda Bharath, K.; Jakulin Divya Mary, P.; Giridharan, K.S. Pyrolytic Conversion of Heterogenic Natural Waste Biomass from Rural Communities with Concomitant Valorization. In Circular Bioeconomy Perspectives in Sustainable Bioenergy Production; Baskar, G., Ashokkumar, V., Rokhum, S.L., Moholkar, V.S., Eds.; Energy, Environment, and Sustainability; Springer Nature: Singapore, 2024; pp. 259–287. ISBN 978-981-9725-22-9. [Google Scholar]
  24. Lehmann, J.; Rillig, M.C.; Thies, J.; Masiello, C.A.; Hockaday, W.C.; Crowley, D. Biochar Effects on Soil Biota—A Review. Soil Biol. Biochem. 2011, 43, 1812–1836. [Google Scholar] [CrossRef]
  25. Omondi, M.O.; Xia, X.; Nahayo, A.; Liu, X.; Korai, P.K.; Pan, G. Quantification of Biochar Effects on Soil Hydrological Properties Using Meta-Analysis of Literature Data. Geoderma 2016, 274, 28–34. [Google Scholar] [CrossRef]
  26. Peng, Y.; Deng, S.; Kong, Z.; Yuan, Y.; Long, H.; Fang, J.; Ma, H.; Shao, Z.; He, Q.; Chai, H. Biochar and Woodchip Amended Bioreactor Extending Reactive Volume for Enhanced Denitrification in Stormwater Runoff. J. Water Process Eng. 2022, 46, 102541. [Google Scholar] [CrossRef]
  27. Berger, A.W.; Valenca, R.; Miao, Y.; Ravi, S.; Mahendra, S.; Mohanty, S.K. Biochar Increases Nitrate Removal Capacity of Woodchip Biofilters During High-Intensity Rainfall. Water Res. 2019, 165, 115008. [Google Scholar] [CrossRef] [PubMed]
  28. Rahman, Y.A. Biochar Amended Bioretention Systems for Nutrient and Fecal Indicator Bacteria Removal from Urban and Agricultural Runoffs. Ph.D Thesis, University of South Florida, Tampa, FL, USA, 2021. [Google Scholar]
  29. Glaister, B.J.; Fletcher, T.D.; Cook, P.L.M.; Hatt, B.E. Co-Optimisation of Phosphorus and Nitrogen Removal in Stormwater Biofilters: The Role of Filter Media, Vegetation and Saturated Zone. Water Sci. Technol. 2014, 69, 1961–1969. [Google Scholar] [CrossRef]
  30. Henderson, C.; Greenway, M.; Phillips, I. Removal of Dissolved Nitrogen, Phosphorus and Carbon from Stormwater by Biofiltration Mesocosms. Water Sci. Technol. 2007, 55, 183–191. [Google Scholar] [CrossRef] [PubMed]
  31. Osman, M.; Takaijudin, H.; Massoudieh, A.; Goh, H.W. Effects of Vegetation and Saturated Zone in Cascaded Bioretention on Enhancing Nutrient Removal. Environ. Eng. Res. 2022, 28, 220154. [Google Scholar] [CrossRef]
  32. Sarazen, J.; Hurley, S.; Faulkner, J. Nitrogen and Phosphorus Removal in a Bioretention Cell Experiment Receiving Agricultural Runoff from a Dairy Farm Production Area During Third and Fourth Years of Operation. J. Environ. Qual. 2023, 52, 149–160. [Google Scholar] [CrossRef]
  33. Muerdter, C.P.; Wong, C.K.; LeFevre, G.H. Emerging Investigator Series: The Role of Vegetation in Bioretention for Stormwater Treatment in the Built Environment: Pollutant Removal, Hydrologic Function, and Ancillary Benefits. Environ. Sci. Water Res. Technol. 2018, 4, 592–612. [Google Scholar] [CrossRef]
  34. Skorobogatov, A.; He, J.; Chu, A.; Valeo, C.; Van Duin, B. The Impact of Media, Plants and Their Interactions on Bioretention Performance: A Review. Sci. Total Environ. 2020, 715, 136918. [Google Scholar] [CrossRef]
  35. Kim, H.; Seagren, E.A.; Davis, A.P. Engineered Bioretention for Removal of Nitrate from Stormwater Runoff. Water Environ. Res. 2003, 75, 355–367. [Google Scholar] [CrossRef]
  36. Dietz, M.E. Modified Bioretention for Enhanced Nitrogen Removal from Agricultural Runoff. J. Environ. Eng. 2016, 142, 06016007. [Google Scholar] [CrossRef]
  37. Passeport, E.; Hunt, W.F.; Line, D.E.; Smith, R.A.; Brown, R.A. Field Study of the Ability of Two Grassed Bioretention Cells to Reduce Storm-Water Runoff Pollution. J. Irrig. Drain Eng. 2009, 135, 505–510. [Google Scholar] [CrossRef]
  38. Ullom, D.; Jayakaran, A.D.; Gardner, C.M. Nitrogen Removal in Bioretention Systems with Hydraulic Outlet Controls. J. Sustain. Water Built Environ. 2024, 10, 04024004. [Google Scholar] [CrossRef]
  39. Barrett, M.E.; Limouzin, M.; Lawler, D.F. Effects of Media and Plant Selection on Biofiltration Performance. J. Environ. Eng. 2013, 139, 462–470. [Google Scholar] [CrossRef]
  40. Richardson, N. Nutrient Removal of Biochar Amended Modified Bioretention Systems Treating Nursery Runoff. Master’s Thesis, University of South Florida, Tampa, FL, USA, 2024. [Google Scholar]
  41. Florida Native Plant Society (FNPS). Muhlenbergia Capillaris. Available online: https://www.fnps.org/plant/muhlenbergia-capillaris (accessed on 8 January 2025).
  42. Crittenden, J.C.; Trussell, R.R.; Hand, D.W.; Howe, K.J.; Tchobanoglous, G.; Ward, B.; Borchardt, J.H. (Eds.) Principles of Reactor Analysis and Mixing. In Stantec’s Water Treatment: Principles and Design; Wiley: Hoboken, NJ, USA, 2022; pp. 287–390. ISBN 978-1-119-81996-7. [Google Scholar]
  43. American Public Health Association; American Water Works Association; Water Environment Federation. Standard Methods for the Examination of Water and Wastewater, 24th ed.; Lipps, W.C., Braun-Howland, E.B., Baxter, T.E., Eds.; APHA Press: Washington, DC, USA, 2023. [Google Scholar]
  44. Hoaglin, D. John W. Tukey and Data Analysis. Stat. Sci. 2003, 18, 311–318. [Google Scholar] [CrossRef]
  45. Yazdi, M.N.; Sample, D.J.; Scott, D.; Owen, J.S.; Ketabchy, M.; Alamdari, N. Water Quality Characterization of Storm and Irrigation Runoff from a Container Nursery. Sci. Total Environ. 2019, 667, 166–178. [Google Scholar] [CrossRef]
  46. Zhang, J.; Chen, Q.; You, C. Biochar Effect on Water Evaporation and Hydraulic Conductivity in Sandy Soil. Pedosphere 2016, 26, 265–272. [Google Scholar] [CrossRef]
  47. Cabrera, R.I. Comparative Evaluation of Nitrogen Release Patterns from Controlled-Release Fertilizers by Nitrogen Leaching Analysis. HortScience 1997, 32, 669–673. [Google Scholar] [CrossRef]
  48. Tindall, J.A.; Petrusak, R.L.; McMahon, P.B. Nitrate Transport and Transformation Processes in Unsaturated Porous Media. J. Hydrol. 1995, 169, 51–94. [Google Scholar] [CrossRef]
  49. Lopez-Ponnada, E.V.; Lynn, T.J.; Peterson, M.; Ergas, S.J.; Mihelcic, J.R. Application of Denitrifying Wood Chip Bioreactors for Management of Residential Non-Point Sources of Nitrogen. J. Biol. Eng. 2017, 11, 16. [Google Scholar] [CrossRef]
  50. Zheng, H.; Wang, X.; Chen, L.; Wang, Z.; Xia, Y.; Zhang, Y.; Wang, H.; Luo, X.; Xing, B. Enhanced Growth of Halophyte Plants in Biochar-amended Coastal Soil: Roles of Nutrient Availability and Rhizosphere Microbial Modulation. Plant Cell Environ. 2018, 41, 517–532. [Google Scholar] [CrossRef] [PubMed]
  51. Cui, Q.; Xia, J.; Yang, H.; Liu, J.; Shao, P. Biochar and Effective Microorganisms Promote Sesbania Cannabina Growth and Soil Quality in the Coastal Saline-Alkali Soil of the Yellow River Delta, China. Sci. Total Environ. 2021, 756, 143801. [Google Scholar] [CrossRef]
  52. Murtaza, G.; Rizwan, M.; Usman, M.; Hyder, S.; Akram, M.I.; Deeb, M.; Alkahtani, J.; AlMunqedhi, B.M.; Hendy, A.S.; Ali, M.R.; et al. Biochar Enhances the Growth and Physiological Characteristics of Medicago Sativa, Amaranthus Caudatus and Zea Mays in Saline Soils. BMC Plant Biol. 2024, 24, 304. [Google Scholar] [CrossRef] [PubMed]
  53. Gross, A.; Bromm, T.; Glaser, B. Soil Organic Carbon Sequestration after Biochar Application: A Global Meta-Analysis. Agronomy 2021, 11, 2474. [Google Scholar] [CrossRef]
  54. Silva, I.C.B.D.; Basílio, J.J.N.; Fernandes, L.A.; Colen, F.; Sampaio, R.A.; Frazão, L.A. Biochar from Different Residues on Soil Properties and Common Bean Production. Sci. Agric. 2017, 74, 378–382. [Google Scholar] [CrossRef]
  55. Wang, D.; Fonte, S.J.; Parikh, S.J.; Six, J.; Scow, K.M. Biochar Additions Can Enhance Soil Structure and the Physical Stabilization of C in Aggregates. Geoderma 2017, 303, 110–117. [Google Scholar] [CrossRef]
  56. Zhao, Y.; Wang, X.; Yao, G.; Lin, Z.; Xu, L.; Jiang, Y.; Jin, Z.; Shan, S.; Ping, L. Advances in the Effects of Biochar on Microbial Ecological Function in Soil and Crop Quality. Sustainability 2022, 14, 10411. [Google Scholar] [CrossRef]
  57. Christianson, L.E.; Collick, A.S.; Bryant, R.B.; Rosen, T.; Bock, E.M.; Allen, A.L.; Kleinman, P.J.A.; May, E.B.; Buda, A.R.; Robinson, J.; et al. Enhanced Denitrification Bioreactors Hold Promise for Mid-Atlantic Ditch Drainage. Agric. Environ. Lett. 2017, 2, 170032. [Google Scholar] [CrossRef]
  58. Christianson, L.E.; Cooke, R.A.; Hay, C.H.; Helmers, M.J.; Feyereisen, G.W.; Ranaivoson, A.Z.; McMaine, J.T.; McDaniel, R.; Rosen, T.R.; Pluer, W.T.; et al. Effectiveness of Denitrifying Bioreactors on Water Pollutant Reduction from Agricultural Areas. Trans. ASABE 2021, 64, 641–658. [Google Scholar] [CrossRef]
  59. Florida Field Guide to Low Impact Development, Bioretention Basins/Rain Gardens. Available online: https://buildgreen.ifas.ufl.edu/Fact_sheet_Bioretention_Basins_Rain_Gardens.pdf (accessed on 15 November 2024).
  60. Jarett, A. Rain Gardens (BioRetention Cells)—A Stormwater BMP. Available online: https://extension.psu.edu/rain-gardens-bioretention-cells-a-stormwater-bmp (accessed on 15 November 2024).
  61. Micah, E.; Hunt, J.; Remucal, J.; Sanchez, D.L. Biochar Carbon Credit Market Analysis: Examining the Potential for Coupled Biochar and Carbon Credit Production from Wildfire Fuel Reduction Projects in the Western U.S.; Blue Forest Conservation: San Francisco, CA, USA, 2022; p. 11. Available online: https://pacificbiochar.com/wp-content/uploads/BiocharCarbonCreditAnalysis-BFReports20221.pdf (accessed on 15 November 2024).
  62. Sorensen, R.B.; Lamb, M.C. Return on Investment from Biochar Application. Crop Forage Turfgrass Manag. 2018, 4, 1–6. [Google Scholar] [CrossRef]
  63. Crites, R.; Ogden, M. Cost of Constructed Wetlands Systems. Available online: https://brownandcaldwell.com/papers-and-reports/cost-of-constructed-wetlands-systems/ (accessed on 14 January 2025).
Figure 1. Schematic diagrams for the (a) completely biochar-amended (CBA) unit, (b) completely biochar-amended unit with plants (CBA + P), (c) partially biochar-amended (PBA) unit, and (d) partially biochar-amended unit with plants (PBA + P).
Water 17 00330 g001
Figure 2. Cumulative tracer mass fraction exported vs. Θ for bioretention systems configured at their lower outlets.
Water 17 00330 g002
Figure 3. Box and whisker plots comparing effluent TIN concentrations for CBA and PBA units across varying HLR: (a) low, (b) medium, and (c) high.
Water 17 00330 g003
Figure 4. Box and whisker plots comparing effluent TIN concentrations for CBA and PBA units across varying outlet height (IWSZ depth). Figure (a,b) are without plant amendment. Figure (c) is with plant amendment. A comparison of Figure (a,c) allows an assessment of the effects of Muhly Grass on TIN removal.
Water 17 00330 g004
Figure 5. Box and whisker plot comparing effluent TIN concentrations for CBA and PBA operating at optimal configuration of medium HLR, upper outlet height, and Muhly Grass addition (after plant acclimatization).
Water 17 00330 g005
Figure 6. Image of roots of Muhly Grass from the (a) CBA unit (above-ground biomass = 0.73 kg) and (b) PBA unit (above-ground biomass = 0.23 kg). Shoes included for scale.
Water 17 00330 g006
Figure 7. Logarithmic regression model for total inorganic nitrogen removal for the (a) CBA unit and (b) PBA unit.
Water 17 00330 g007
Figure 8. Logarithmic regression model for nitrate + nitrite (NOx) removal for the (a) CBA unit and (b) PBA unit.
Water 17 00330 g008
Figure 9. Spreadsheet tool user input tab.
Water 17 00330 g009
Figure 10. Spreadsheet tool output tab showing recommended design for bioretention system and total inorganic nitrogen removal efficiency.
Water 17 00330 g010
Table 1. Tracer study data revealing key hydraulic differences between CBA and PBA bioretention systems.
ParametersCBA Lower OutletPBA Lower OutletCBA Upper OutletPBA Upper Outlet
HLR (cm/min)0.310.290.560.50
MRT (min)70466062
MDI (t90/t10)3.56.73.02.4
t50/MRT0.890.740.850.89
Standard Deviation (min)32332723
TIS n5.83.06.18.4
Mass Recovered (%)99.998.0104102
Note(s): HLR = hydraulic loading rate; MRT = mean retention time; MDI = Morrill Dispersion Index; TIS = tanks in series.
Table 2. Overall average influent and effluent concentrations and corresponding removal percentages for runoff events 1 and 3–18.
CBAPBA1 p-Value
ParameterAverage
Influent
Average
Effluent
Average
% Removal
Average
Effluent
Average
% Removal
CBA vs. PBA
Δ
TIN (mg/L)2.84 ± 2.510.71 ± 0.4870.15 ± 17.581.63 ± 1.3854.59 ± 20.730.031 *
NH4+-N (mg/L)0.18 ± 0.140.30 ± 0.17−150.70 ± 252.480.13 ± 0.08−58.62 ± 141.28NS
NO2N (mg/L)0.06 ± 0.040.11 ± 0.06−121.13 ± 190.270.22 ± 0.23−191.78 ± 167.54NS
NO3N (mg/L)2.55 ± 2.520.30 ± 0.3385.33 ± 15.581.28 ± 1.1961.96 ± 18.520.002 **
2 NOxN (mg/L)2.62 ± 2.420.42 ± 0.36 78.93 ± 17.111.50 ± 0.0857.41 ± 18.29NS
COD (mg/L)32.55 ± 6.3727.61 ± 5.0713.16 ± 11.8033.52 ± 6.38−21.89 ± 44.720.032 *
Alkalinity
(mg/L as
CaCO3)
123.46 ± 18.20152.80 ± 50.05−20.36 ± 19.69124.10 ± 30.19−17.46 ± 11.48NS
pH7.81 ± 0.177.20 ± 0.207.76 ± 2.787.25 ± 0.247.39 ± 3.27NS
3 DO (mg/L)4.97 ± 0.820.78 ± 0.2083.46 ± 2.800.35 ± 0.6077.55 ± 7.04NS
Note(s): 1 ANOVA p-value significance: * p < 0.05, ** p < 0.01, NS = not significant, with CBA achieving higher removal rates. 2 Nitrate-nitrite (NOx-N) represents the combined measurement of NO3-N plus NO2-N or TIN minus NH3-N. 3 Dissolved oxygen (DO) was only measured for events 8–12.
Disclaimer/Publisher’s Note: The statements, opinions and data contained in all publications are solely those of the individual author(s) and contributor(s) and not of MDPI and/or the editor(s). MDPI and/or the editor(s) disclaim responsibility for any injury to people or property resulting from any ideas, methods, instructions or products referred to in the content.

