
The Role of Household Heterogeneity on Unplanned Water Demand Shifts


Abstract
:1. Introduction
2. Materials and Methods
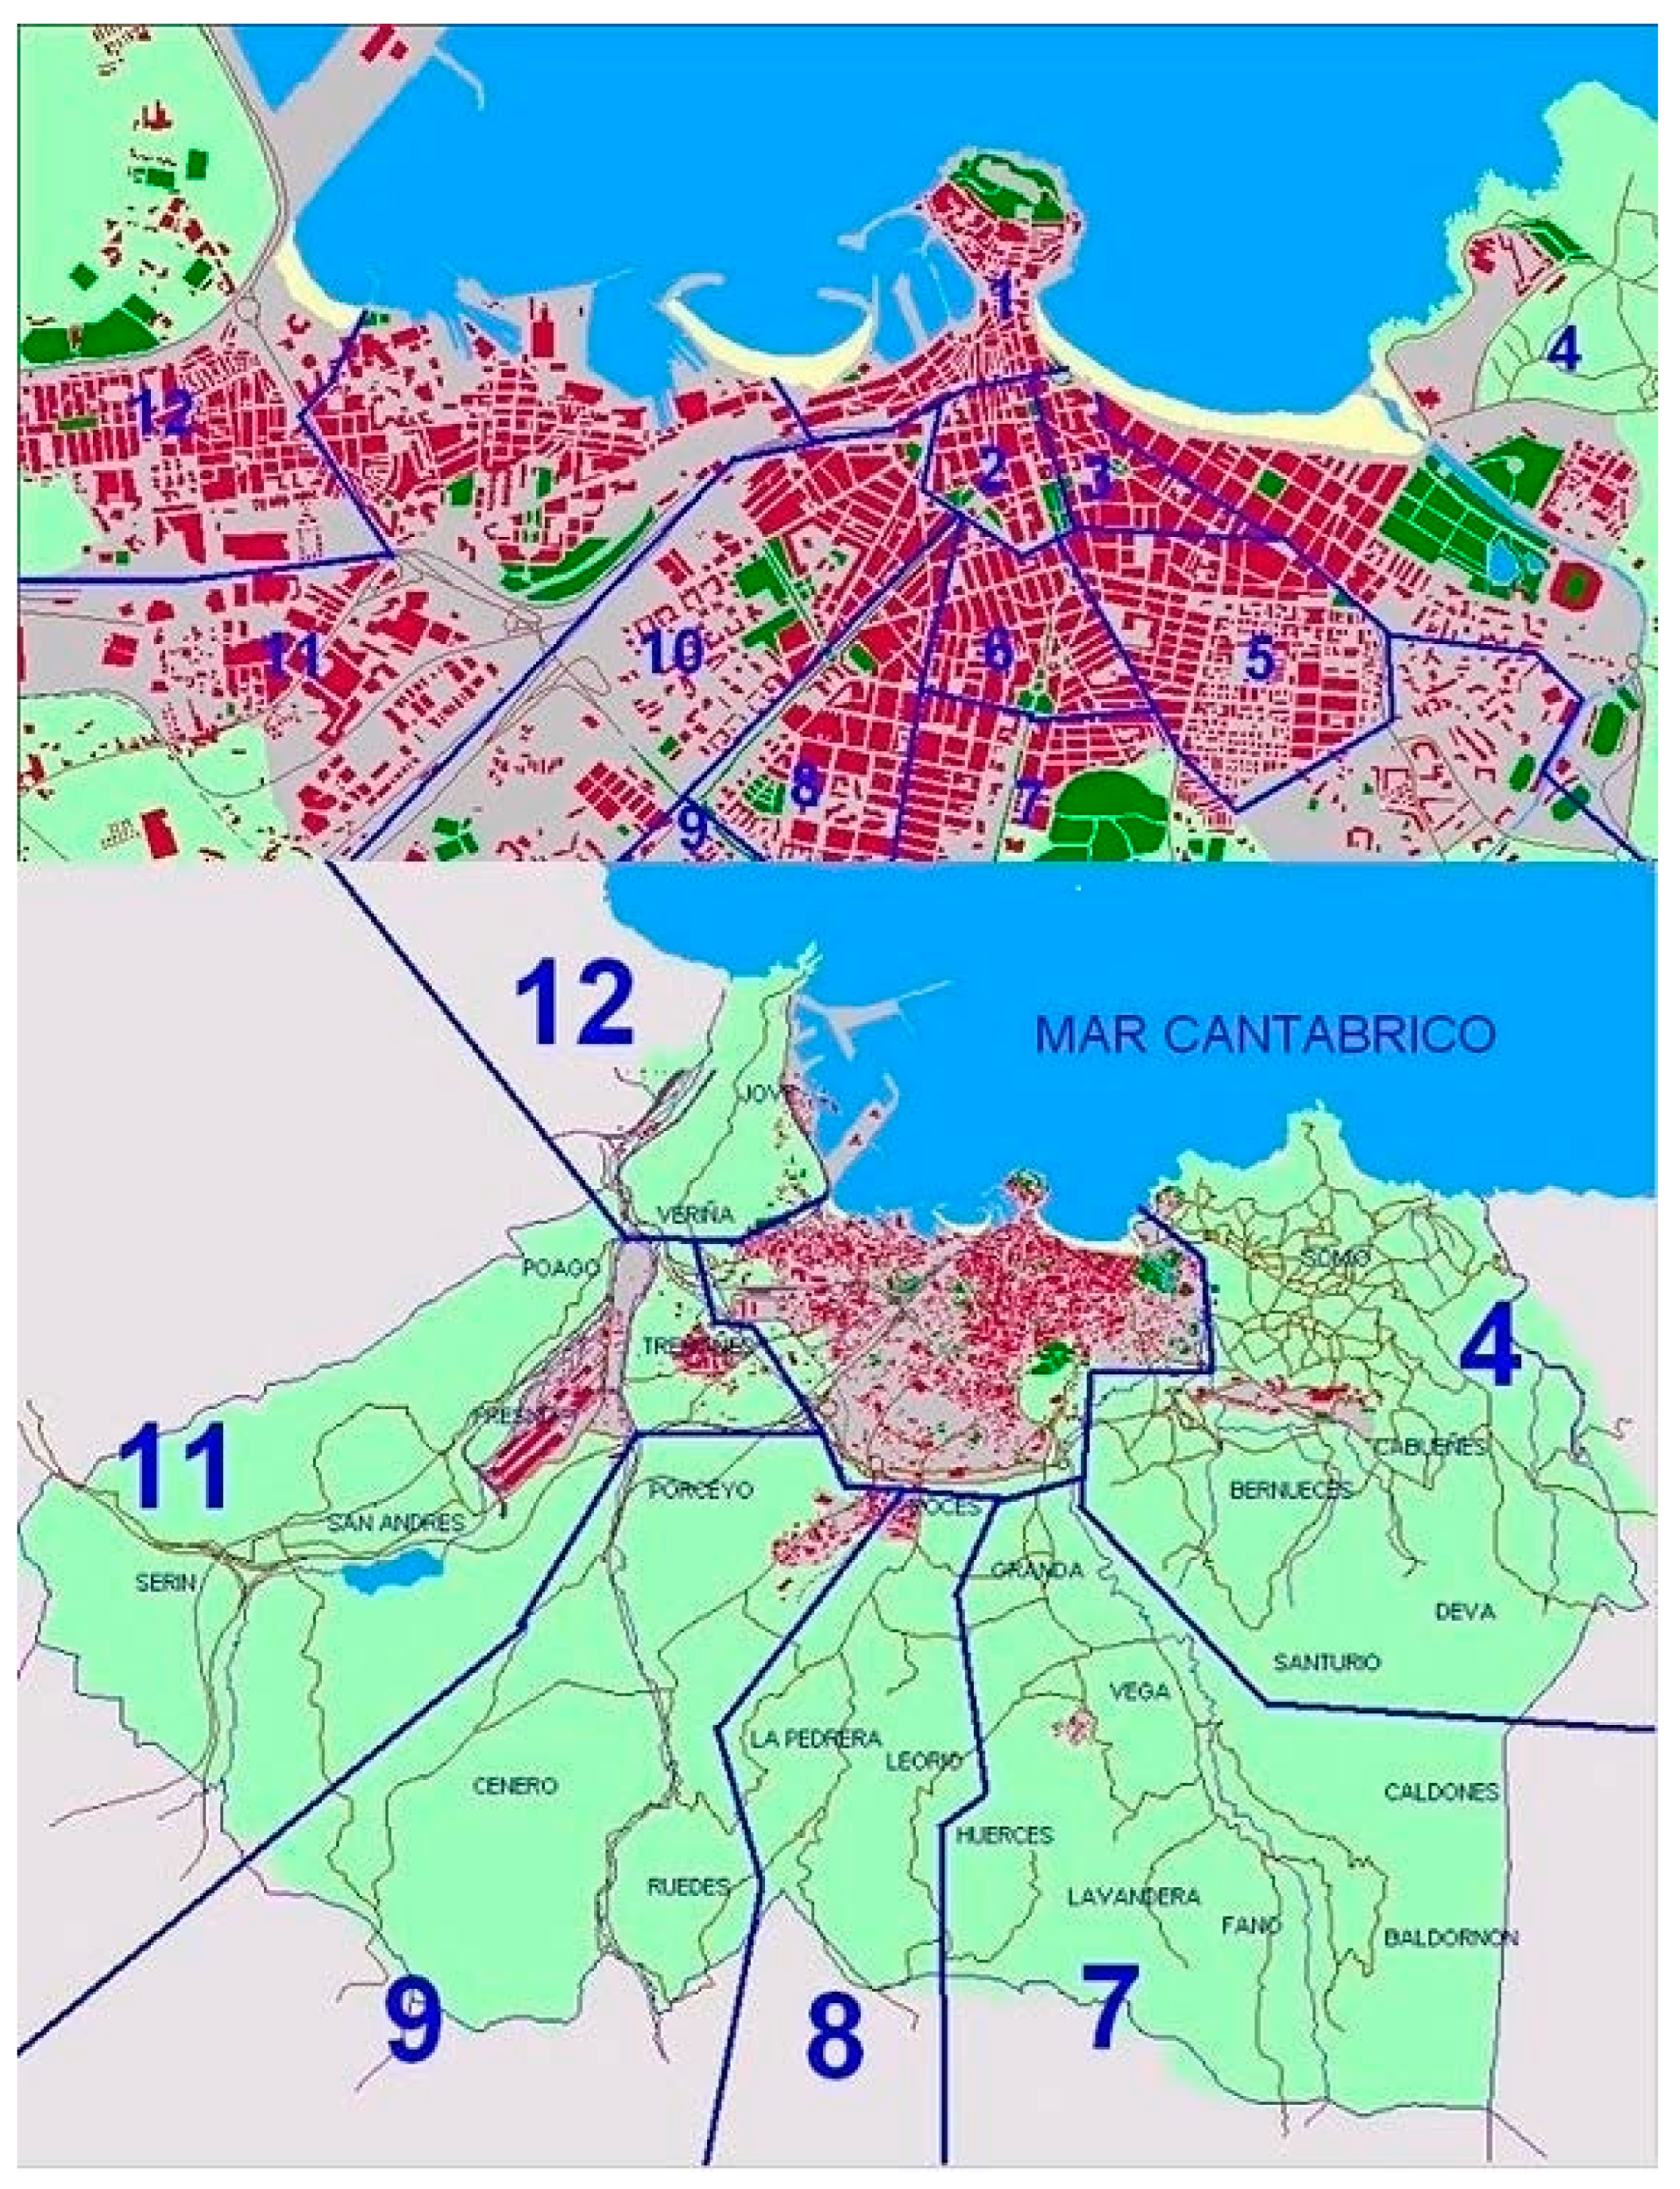
2.1. Area of Study and Context
2.2. Variables
2.3. Methods
3. Results
4. Discussion and Conclusions
Author Contributions
Funding
Data Availability Statement
Conflicts of Interest
Appendix A

| Reference | City/Region | Type of Data | Methods | Main Results |
|---|---|---|---|---|
| Irwin et al. (2021) [3] | Henderson (Nevada, US) | Water consumption of 98,099 users (residential: 96,303; commercial: 1730; schools: 66), 2017–2020 (five water bills per year and user). Available data by type of user | Water consumption model, DID | Substantial decreases in water usage among commercial users and schools were registered, while residential users increased their consumption. Average net water increases ranked from 47.8 to 478.3 million gallons |
| Nemati and Dat Tran (2022) [12] | Six states (US) | Daily water consumption from 2018 to 2020 at customer level (the number of customers was not reported) | Water consumption model- FE | Overall increase in water consumption ranked between 3.08% and 13.65% |
| Almulhim and Aina (2022) [13] | Dammam Metropolitan Area (Saudi Arabia) | Self-reported water habits from 810 respondents in a web-based survey conducted between February and May 2021. Interviews with managers and government officials | Statistical analysis and multiple regression analysis | Water consumption increased by more than 50% during the lockdown. Working from home was a key driver for the increase in water usage |
| Bera et al. (2022) [14] | Several regions (India) | Self-reported water habits from 1850 respondents in a web-based survey conducted from 18 August to 8 September 2020 | Statistical and plot analysis | The results suggest significant increases in some water usage habits (hand and clothes washing and bathing frequency) during the COVID-19 crisis |
| Balacco et al. (2020) [15] | Five towns in Puglia (Italy) | Daily water consumption from 1 January, to 30 April, in 2019 and 2020 at town level | Plot analysis of instantaneous flows, daily cumulated volume, and daily water volume percentage change over time | Different patterns were detected depending on the town. Most of them reduced their daily water volume |
| Rizvi et al. (2021) [16] | Dubai (United Arab Emirates) | Hourly and daily water consumption in multiple residential buildings, comparing two different periods: 2 May to 6 June 2019 and 13 April to 1 May 2020 | Statistical and plot analysis of residential water usage profiles | The COVID-19 health crisis led to significant increases in water usage at the residential level, with over a 30% increase during the Ramadan period |
| Bakchan et al. (2022) [17] | Austin (Texas, US) | Daily water consumption from January 2013 to December 2020 in 9 pressure areas | Water consumption model- FE | Negative change of water usage during the stay home-work safe period |
| Fritsche et al. (2022) [18] | Michigan (US) | Daily water consumption from 2026 to 2020 in 75 member partners at Great Lakes Water Authority | Statistical analysis and correlations | Variety of impacts was observed |
| Balacco (2023) [19] | Five towns in Puglia region (Italy) | Daily water consumption from 2019 to 2021 at town level | Plot analysis of daily volume over time | Different patterns were detected depending on the town. In some of them, daily water volume remained unchanged |
| Lüdtke et al. (2021) [20] | Harburg area provided by a water utility (Germany) | Aggregated hourly and daily water consumption for three different periods: between 1 January and 25 June 2018 and between 25 December, 2018 + 2019 and 25 June, 2019 + 2020 | Water consumption model estimated through a linear mixed regression | The authors found a 14% increase in daily residential water consumption, with higher morning and evening demand peaks during the day |
| Evangelista et al. (2022) [21] | Soccavo district of Naples (Italy) | Daily water consumption from 1 January 2019 to 31 December 2020 at meter level (637 residential meters) | Plot analysis of daily and weekly average patterns | Total residential water volume increases ranked from 1.3% to 5.8% depending on the period. Daily patterns registered substantial changes |
| Menneer et al. (2021) [33] | Camborne and Redruth area of Cornwall (UK) | Hourly water consumption of 280 households living in remote and rural areas in spring 2020 compared with spring 2019. Face-to-face surveys were conducted from 2017 to 2018 | Daily and hourly water consumption patterns model: plot analysis and mixed linear regression | Hourly water usage increased by 17%, while a one-hour delay in peak morning usage was detected |
| Cominato et al. (2022) [34] | Joinville (Brazil) | Hourly and daily water consumption in 14 social housing buildings (280 apartments), comparing pre-pandemic period (1 March 2019 and 16 March 2020) and the pandemic period (17 March 2020 to 31 May 2021) | Hourly and daily consumption before and after social-distancing government decree was compared using plot analysis, non-parametric paired Wilcoxon test, and water consumption model Prais-Winsten OLS regression | Water consumption registered a small significant increase during the COVID-19 period. Hourly patterns also changed |
| Abu-Bakar et al. (2021) [78] | Several regions in South and East England (UK) | Weekly residential water consumption at an hourly resolution of 11,528 households from January to May 2020 | Plot analysis of weekly consumption and cluster analysis based on hourly patterns | Households are clustered into 4 groups depending on their diurnal and night-time patterns |
| Kalbusch (2020) [79] | Joinville (Brazil) | Daily water consumption of 1178 users (residential: 913; commercial: 159; industrial: 58; public consumer units: 48) comparing the pre-pandemic period (21 February to 16 March 2020) to the pandemic period (17 March to 12 April 2020). Available data by type of user | Daily consumption before and after social-distancing government decree was compared using non-parametric paired Wilcoxon test and water consumption model using a Prais-Winsten OLS regression | Water usage by the commercial, industrial and public sectors decreased (53%), while an increase (11%) was observed in the residential sector |
| Dziminska et al. (2021) [80] | Bydgoszcz (Poland) | Hourly water consumption of 3 similar apartment buildings within the same housing estate from 16 May 2019 to 6 October 2020 | Analysis of hourly water patterns using plot and cluster analysis | Three synthetic patterns of hourly water consumption were detected based on the division into business days and days free from work and holidays |
| Kazak et al. (2021) [81] | Wrocław (Poland) | Monthly water consumption for 10 groups of users in 23 District Metered Area (DMA) zones from January 2018 to April 2020 | Visual analytics approach to observe changes in water usage patterns | Restrictions caused by COVID-19 did not change total water consumption. However, some transfers between different groups of users were observed |
| Talib et al. (2023) [82] | Dubai (United Arab Emirates) | Monthly water consumption of over 200 communities from July 2017 to December 2020 | Water consumption model using several machine learning models. Plot analysis | Water consumption increased by 20% in 2020 |
| Tleuken et al. (2021) [83] | Almaty, Shymkent, and Atyrau (Kazakhstan) | Yearly and monthly water consumption from January 2011 to April 2021 for different residential building types in different areas of these cities | Statistical and plot analysis | Residential water consumption increased during the COVID-19 crisis, but the increase was not statistically significant |
| Li et al. (2021) [84] | California (US) | Water consumption of 395 water retailers from 2014 to 2020. Available data by type of user | Water consumption model, OLS | Total urban water usage in April 2020 declined by 7.9% compared with previous years (from 2014) |
References
- Mekonnen, M.M.; Hoekstra, A.Y. Four billion people facing severe water scarcity. Sci. Adv. 2016, 2, e1500323. [Google Scholar] [CrossRef]
- IPCC. Climate Change 2022: Impacts, Adaptation, and Vulnerability. Contribution of Working Group II to the Sixth Assessment Report of the Intergovernmental Panel on Climate Change; Pörtner, H.-O., Roberts, D.C., Tignor, M., Poloczanska, E.S., Mintenbeck, K., Alegría, A., Craig, M., Langsdorf, S., Löschke, S., Möller, V., et al., Eds.; Cambridge University Press: Cambridge, UK; New York, NY, USA, 2022; p. 3056. [Google Scholar]
- Irwin, N.B.; McCoy, S.J.; McDonough, I.K. Water in the time of corona (virus): The effect of stay-at-home orders on water demand in the desert. J. Environ. Econ. Manag. 2021, 109, 102491. [Google Scholar] [CrossRef] [PubMed]
- García-Valiñas, M.Á.; Suárez-Fernández, S. Are Economic Tools Useful to Manage Residential Water Demand? A Review of Old Issues and Emerging Topics. Water 2022, 14, 2536. [Google Scholar] [CrossRef]
- UN. How COVID-19 Is Changing the World: A Statistical Perspective; Technical Report; Committee for the Coordination of Statistical Activities (CCSA): New York, NY, USA, 2021; Volume III. [Google Scholar]
- Cserháti, I. “Business is unusual”–remote work after COVID-19. Köz-Gazdaság 2020, 15, 38–53. [Google Scholar] [CrossRef]
- Hayter, S. Business as Unusual’: How COVID-19 Could Change The Future of Work. UN News: Economic Development, 27 May 2020. [Google Scholar]
- Parungao, A. The Future of Remote Work After COVID-19: 3 Common Predictions, 2020. Available online: https://www.ekoapp.com/blog/the-future-of-remote-work-after-covid-19-3-common-predictions (accessed on 12 February 2024).
- Marani, M.; Katul, G.G.; Pan, W.K.; Parolari, A.J. Intensity and frequency of extreme novel epidemics. Proc. Natl. Acad. Sci. USA 2021, 118, e2105482118. [Google Scholar] [CrossRef] [PubMed]
- Jones, K.E.; Patel, N.G.; Levy, M.A.; Storeygard, A.; Balk, D.; Gittleman, J.L.; Daszak, P. Global trends in emerging infectious diseases. Nature 2008, 451, 990–993. [Google Scholar] [CrossRef] [PubMed]
- Daszak, P.; Cunningham, A.A.; Hyatt, A.D. Anthropogenic environmental change and the emergence of infectious diseases in wildlife. Acta Trop. 2001, 78, 103–116. [Google Scholar] [CrossRef] [PubMed]
- Nemati, M.; Tran, D. The Impact of COVID-19 on Urban Water Consumption in the United States. Water 2022, 14, 3096. [Google Scholar] [CrossRef]
- Almulhim, A.I.; Aina, Y.A. Understanding household water-use behavior and consumption patterns during COVID-19 lockdown in Saudi Arabia. Water 2022, 14, 314. [Google Scholar] [CrossRef]
- Bera, A.; Das, S.; Pani, A.; Bera, B.; Shit, P.K. Assessment of household water consumption during COVID-19 pandemic: A cross-sectional web-based study in India. Sustain. Water Resour. Manag. 2022, 8, 78. [Google Scholar] [CrossRef]
- Balacco, G.; Totaro, V.; Iacobellis, V.; Manni, A.; Spagnoletta, M.; Piccinni, A.F. Influence of COVID-19 spread on water drinking demand: The case of Puglia Region (Southern Italy). Sustainability 2020, 12, 5919. [Google Scholar] [CrossRef]
- Rizvi, S.; Rustum, R.; Deepak, M.; Wright, G.B.; Arthur, S. Identifying and analyzing residential water demand profile; including the impact of COVID-19 and month of Ramadan, for selected developments in Dubai, United Arab Emirates. Water Supply 2021, 21, 1144–1156. [Google Scholar] [CrossRef]
- Bakchan, A.; Roy, A.; Faust, K.M. Impacts of COVID-19 social distancing policies on water demand: A population dynamics perspective. J. Environ. Manag. 2022, 302, 113949. [Google Scholar] [CrossRef] [PubMed]
- Fritsche, J.R.; Whitby, P.; Griffin, E.; Norton, J.W., Jr.; Alfahham, N.; Kuhns, T.; Bell, K.Y. Changes in water demand resulting from pandemic mitigations in Southeast Michigan. AWWA Water Sci. 2022, 4, e1286. [Google Scholar] [CrossRef]
- Balacco, G.; Martellotta, A.M.N.; Iacobellis, V.; Piccinni, A.F. Two years of COVID restrictions: A lesson from water demand data. Water Supply 2023, 23, 948–959. [Google Scholar] [CrossRef]
- Lüdtke, D.U.; Luetkemeier, R.; Schneemann, M.; Liehr, S. Increase in daily household water demand during the first wave of the COVID-19 pandemic in Germany. Water 2021, 13, 260. [Google Scholar] [CrossRef]
- Evangelista, S.; Nardi, M.; Padulano, R.; Di Cristo, C.; Del Giudice, G. Effect of the COVID-19 Lockdown on Domestic Water Consumption by Smart Water Network Data Filtering. Environ. Sci. Proc. 2022, 21, 54. [Google Scholar] [CrossRef]
- Berglund, E.Z.; Thelemaque, N.; Spearing, L.; Faust, K.M.; Kaminsky, J.; Sela, L.; Goharian, E.; Abokifa, A.; Lee, J.; Keck, J.; et al. Water and wastewater systems and utilities: Challenges and opportunities during the COVID-19 pandemic. J. Water Resour. Plan. Manag. 2021, 147, 02521001. [Google Scholar] [CrossRef]
- Sowby, R.B.; Lunstad, N.T. Considerations for studying the impacts of COVID-19 and other complex hazards on drinking water systems. J. Infrastruct. Syst. 2021, 27, 02521002. [Google Scholar] [CrossRef]
- Taušová, M.; Čulková, K.; Kudelas, D.; Gabániová, Ľ.; Koščo, J.; Mehana, I. Evaluation of water resources through efficiency index and water productivity in EU. Energies 2022, 15, 9123. [Google Scholar] [CrossRef]
- Carlevaro, F.; Schlesser, C.; Binet, M.E.; Durand, S.; Paul, M. Econometric modeling and analysis of residential water demand based on unbalanced panel data. Прикладная Экoнoметрика 2007, 4, 81–100. [Google Scholar]
- Binet, M.E.; Carlevaro, F.; Paul, M. Estimation of residential water demand with imperfect price perception. Environ. Resour. Econ. 2014, 59, 561–581. [Google Scholar] [CrossRef]
- Nordin, J.A. A proposed modification of Taylor’s demand analysis: Comment. Bell J. Econ. 1976, 719–721. [Google Scholar] [CrossRef]
- Arbués, F.; Garcıa-Valiñas, M.Á.; Martınez-Espiñeira, R. Estimation of residential water demand: A state-of-the-art review. J. Socio-Econ. 2003, 32, 81–102. [Google Scholar] [CrossRef]
- Brent, D.A.; Ward, M.B. Price perceptions in water demand. J. Environ. Econ. Manag. 2019, 98, 102266. [Google Scholar] [CrossRef]
- INE. Indicadores de Estructura de la Población; Instituto Nacional de Estadística: Madrid, Spain, 2022. [Google Scholar]
- INE. Encuesta Continua de Hogares; Instituto Nacional de Estadística: Madrid, Spain, 2020. [Google Scholar]
- Menneer, T.; Qi, Z.; Taylor, T.; Paterson, C.; Tu, G.; Elliott, L.R.; Morrissey, K.; Mueller, M. Changes in domestic energy and water usage during the UK COVID-19 lockdown using high-resolution temporal data. Int. J. Environ. Res. Public Health 2021, 18, 6818. [Google Scholar] [CrossRef]
- Cominato, C.; Sborz, J.; Kalbusch, A.; Henning, E. Water demand profile before and during COVID-19 pandemic in a Brazilian social housing complex. Heliyon 2022, 8, e10307. [Google Scholar] [CrossRef]
- Gaudin, S.; Griffin, R.C.; Sickles, R.C. Demand specification for municipal water management: Evaluation of the Stone-Geary form. Land Econ. 2001, 77, 399–422. [Google Scholar] [CrossRef]
- Martínez-Espiñeira, R.; Nauges, C. Is all domestic water consumption sensitive to price control? Appl. Econ. 2004, 36, 1697–1703. [Google Scholar] [CrossRef]
- Madhoo, Y.N. Policy and nonpolicy determinants of progressivity of block residential water rates–a case study of Mauritius. Appl. Econ. Lett. 2009, 16, 211–215. [Google Scholar] [CrossRef]
- García-Valiñas, M.A.; Martínez-Espiñeira, R.; González-Gómez, F. Affordability of residential water tariffs: Alternative measurement and explanatory factors in southern Spain. J. Environ. Manag. 2010, 91, 2696–2706. [Google Scholar] [CrossRef]
- Dharmaratna, D.; Harris, E. Estimating residential water demand using the Stone-Geary functional form: The case of Sri Lanka. Water Resour. Manag. 2012, 26, 2283–2299. [Google Scholar] [CrossRef]
- Clarke, A.J.; Colby, B.G.; Thompson, G.D. Household water demand seasonal elasticities: A stone-geary model under an increasing block rate structure. Land Econ. 2017, 93, 608–630. [Google Scholar] [CrossRef]
- Hung, M.F.; Chie, B.T.; Huang, T.H. Residential water demand and water waste in Taiwan. Environ. Econ. Policy Stud. 2017, 19, 249–268. [Google Scholar] [CrossRef]
- Roibas, D.; Garcia-Valiñas, M.A.; Fernandez-Llera, R. Measuring the Impact of Water Supply Interruptions on Household Welfare. Environ. Resour. Econ. 2019, 73, 159–179. [Google Scholar] [CrossRef]
- Hotchkiss, J.L.; Pitts, M.M. Female labour force intermittency and current earnings: Switching regression model with unknown sample selection. Appl. Econ. 2005, 37, 545–560. [Google Scholar] [CrossRef]
- Di Falco, S.; Veronesi, M.; Yesuf, M. Does adaptation to climate change provide food security? A micro-perspective from Ethiopia. Am. J. Agric. Econ. 2011, 93, 829–846. [Google Scholar] [CrossRef]
- Boto-García, D.; Leoni, V. Distance traveled in times of pandemic: An endogenous switching regression approach. Tour. Econ. 2023, 29, 571–595. [Google Scholar] [CrossRef]
- Worthington, A.C.; Hoffman, M. An empirical survey of residential water demand modelling. J. Econ. Surv. 2008, 22, 842–871. [Google Scholar] [CrossRef]
- Nauges, C.; Whittington, D. Estimation of water demand in developing countries: An overview. World Bank Res. Obs. 2010, 25, 263–294. [Google Scholar] [CrossRef]
- Reynaud, A. Modelling household water demand in Europe–insights from a cross-country econometric analysis of EU-28 countries. Insights A Cross-Ctry. Econom. Anal. EU 2015, 28. [Google Scholar]
- Wooldridge, J.M. Econometric Analysis of Cross Section and Panel Data; MIT Press: Cambridge, MA, USA, 2010. [Google Scholar]
- Wooldridge, J.M. Control function methods in applied econometrics. J. Hum. Resour. 2015, 50, 420–445. [Google Scholar] [CrossRef]
- Pérez-Urdiales, M.; García-Valiñas, M.A.; Martínez-Espiñeira, R. Responses to changes in domestic water tariff structures: A latent class analysis on household-level data from Granada, Spain. Environ. Resour. Econ. 2016, 63, 167–191. [Google Scholar] [CrossRef]
- Schleich, J.; Hillenbrand, T. Determinants of residential water demand in Germany. Ecol. Econ. 2009, 68, 1756–1769. [Google Scholar] [CrossRef]
- Hoyos, D.; Artabe, A. Regional differences in the price elasticity of residential water demand in Spain. Water Resour. Manag. 2017, 31, 847–865. [Google Scholar] [CrossRef]
- Jarvis, C.I.; Van Zandvoort, K.; Gimma, A.; Prem, K.; Klepac, P.; Rubin, G.J.; Edmunds, W.J. Quantifying the impact of physical distance measures on the transmission of COVID-19 in the UK. BMC Med. 2020, 18, 124. [Google Scholar] [CrossRef] [PubMed]
- Zhang, J.; Litvinova, M.; Liang, Y.; Wang, Y.; Wang, W.; Zhao, S.; Wu, Q.; Merler, S.; Viboud, C.; Vespignani, A.; et al. Age profile of susceptibility, mixing, and social distancing shape the dynamics of the novel coronavirus disease 2019 outbreak in China. medRxiv 2020. [Google Scholar] [CrossRef]
- Agthe, D.E.; Billings, R.B. Equity, price elasticity, and household income under increasing block rates for water. Am. J. Econ. Sociol. 1987, 46, 273–286. [Google Scholar] [CrossRef]
- Rizaiza, O.S.A. Residential water usage: A case study of the major cities of the western region of Saudi Arabia. Water Resour. Res. 1991, 27, 667–671. [Google Scholar] [CrossRef]
- Nauges, C.; Thomas, A. Privately operated water utilities, municipal price negotiation, and estimation of residential water demand: The case of France. Land Econ. 2000, 76, 68–85. [Google Scholar] [CrossRef]
- García, S.; Reynaud, A. Estimating the benefits of efficient water pricing in France. J. Resour. Energy Econ. 2004, 26, 1–25. [Google Scholar] [CrossRef]
- García-Valiñas, M.A.; Athukorala, W.; Wilson, C.; Torgler, B.; Gifford, R. Nondiscretionary residential water use: The impact of habits and water-efficient technologies. Aust. J. Agric. Resour. Econ. 2014, 58, 185–204. [Google Scholar] [CrossRef]
- Jayarathna, L.; Rajapaksa, D.; Managi, S.; Athukorala, W.; Torgler, B.; Garcia-Valiñas, M.A.; Gifford, R.; Wilson, C. A GIS based spatial decision support system for analysing residential water demand: A case study in Australia. Sustain. Cities Soc. 2017, 32, 67–77. [Google Scholar] [CrossRef]
- González-Leonardo, M.; López-Gay, A.; Newsham, N.; Recaño, J.; Rowe, F. Understanding patterns of internal migration during the COVID-19 pandemic in Spain. Popul. Space Place 2022, 28, e2578. [Google Scholar] [CrossRef]
- Alda-Vidal, C.; Smith, R.; Lawson, R.; Browne, A.L. Understanding changes in household water consumption associated with COVID-19. Artesia Consulting: Bristol, UK, 2020. [Google Scholar]
- Wichman, C.J. Information provision and consumer behavior: A natural experiment in billing frequency. J. Public Econ. 2017, 152, 13–33. [Google Scholar] [CrossRef]
- Rajapaksa, D.; Gifford, R.; Torgler, B.; Garcia-Valiñas, M.; Athukorala, W.; Managi, S.; Wilson, C. Do monetary and non-monetary incentives influence environmental attitudes and behavior? Evidence from an experimental analysis. Resour. Conserv. Recycl. 2019, 149, 168–176. [Google Scholar] [CrossRef]
- Rathnayaka, K.; Malano, H.; Arora, M.; George, B.; Maheepala, S.; Nawarathna, B. Prediction of urban residential end-use water demands by integrating known and unknown water demand drivers at multiple scales II: Model application and validation. Resour. Conserv. Recycl. 2017, 118, 1–12. [Google Scholar] [CrossRef]
- Campos, M.A.S.; Carvalho, S.L.; Melo, S.K.; Gonçalves, G.B.F.R.; dos Santos, J.R.; Barros, R.L.; Morgado, U.T.M.A.; Lopes, E.d.S.; Reis, R.P.A. Impact of the COVID-19 pandemic on water consumption behaviour. Water Supply 2021, 21, 4058–4067. [Google Scholar] [CrossRef]
- Bich-Ngoc, N.; Teller, J. Potential effects of the COVID-19 pandemic through changes in outbound tourism on water demand: The Case of Liège (Belgium). Water 2020, 12, 2820. [Google Scholar] [CrossRef]
- Zvobgo, L.; Do, P. COVID-19 and the call for ‘Safe Hands’: Challenges facing the under-resourced municipalities that lack potable water access-A case study of Chitungwiza municipality, Zimbabwe. Water Res. X 2020, 9, 100074. [Google Scholar] [CrossRef]
- Sayeed, A.; Rahman, H.; Bundschuh, J.; Herath, I.; Ahmed, F.; Bhattacharya, P.; Tariq, M.R.; Rahman, F.; Joy, T.I.; Abid, M.T.; et al. Handwashing with soap: A concern for overuse of water amidst the COVID-19 pandemic in Bangladesh. Groundw. Sustain. Dev. 2021, 13, 100561. [Google Scholar] [CrossRef] [PubMed]
- Zhao, N.; You, F. Food-energy-water-waste nexus systems optimization for New York State under the COVID-19 pandemic to alleviate health and environmental concerns. Appl. Energy 2021, 282, 116181. [Google Scholar] [CrossRef]
- Carter, D.W.; Milon, J.W. Price knowledge in household demand for utility services. Land Econ. 2005, 81, 265–283. [Google Scholar] [CrossRef]
- Gaudin, S. Effect of price information on residential water demand. Appl. Econ. 2006, 38, 383–393. [Google Scholar] [CrossRef]
- Arbués, F.; García-Valiñas, M. Water Tariffs in Spain; Oxford Research Encyclopedias: Oxford, UK, 2020. [Google Scholar]
- Thaler, R.H. From cashews to nudges: The evolution of behavioral economics. Am. Econ. Rev. 2018, 108, 1265–1287. [Google Scholar] [CrossRef]
- Miranda, J.J.; Datta, S.; Zoratto, L. Saving water with a nudge (or two): Evidence from Costa Rica on the effectiveness and limits of low-cost behavioral interventions on water use. World Bank Econ. Rev. 2020, 34, 444–463. [Google Scholar] [CrossRef]
- Otaki, Y.; Honda, H.; Ueda, K. Historical self-comparison of water consumption as a water demand management tool. Water 2019, 11, 844. [Google Scholar] [CrossRef]
- Brent, D.A.; Lott, C.; Taylor, M.; Cook, J.; Rollins, K.; Stoddard, S. What causes heterogeneous responses to social comparison messages for water conservation? Environ. Resour. Econ. 2020, 77, 503–537. [Google Scholar] [CrossRef]
- Abu-Bakar, H.; Williams, L.; Hallett, S.H. Quantifying the impact of the COVID-19 lockdown on household water consumption patterns in England. NPJ Clean Water 2021, 4, 13. [Google Scholar] [CrossRef]
- Kalbusch, A.; Henning, E.; Brikalski, M.P.; de Luca, F.V.; Konrath, A.C. Impact of coronavirus (COVID-19) spread-prevention actions on urban water consumption. Resour. Conserv. Recycl. 2020, 163, 105098. [Google Scholar] [CrossRef] [PubMed]
- Dzimińska, P.; Drzewiecki, S.; Ruman, M.; Kosek, K.; Mikołajewski, K.; Licznar, P. The use of cluster analysis to evaluate the impact of COVID-19 pandemic on daily water demand patterns. Sustainability 2021, 13, 5772. [Google Scholar] [CrossRef]
- Kazak, J.K.; Szewranski, S.; Pilawka, T.; Tokarczyk-Dorociak, K.; Janiak, K.; Swiader, M. Changes in water demand patterns in a European city due to restrictions caused by the COVID-19 pandemic. Desalination Water Treat. 2021, 222, 1–15. [Google Scholar] [CrossRef]
- Talib, M.A.; Abdallah, M.; Abdeljaber, A.; Waraga, O.A. Influence of exogenous factors on water demand forecasting models during the COVID-19 period. Eng. Appl. Artif. Intell. 2023, 117, 105617. [Google Scholar] [CrossRef]
- Tleuken, A.; Tokazhanov, G.; Serikbay, A.B.; Zhalgasbayev, K.; Guney, M.; Turkyilmaz, A.; Karaca, F. Household Water and Energy Consumption Changes during COVID-19 Pandemic Lockdowns: Cases of the Kazakhstani Cities of Almaty, Shymkent, and Atyrau. Buildings 2021, 11, 663. [Google Scholar] [CrossRef]
- Li, D.; Engel, R.A.; Ma, X.; Porse, E.; Kaplan, J.D.; Margulis, S.A.; Lettenmaier, D.P. Stay-at-home orders during the COVID-19 pandemic reduced urban water use. Environ. Sci. Technol. Lett. 2021, 8, 431–436. [Google Scholar] [CrossRef] [PubMed]


| Variable | Name | Definition |
|---|---|---|
| Q | Water consumption | Bimonthly water consumption (m3/period) |
| IMgP | Income/marginal price | Bimonthly household income after fixed water charges, corrected by Nordin’s difference divided by price (€) |
| Memb | Household size | Number of family members |
| Seniors | Share of seniors | Proportion of members older than 65 (%) |
| Minors | Share of minors | Proportion of members younger than 18 (%) |
| Employed | Share of employed | Proportion of employed and self-employed members in the household (%) |
| Women | Share of women | Proportion of female members in the household (%) |
| Old_H | Old house | Dummy variable: 1 if the house/apartment is over 40 years old, 0 otherwise |
| Amenities | Index of outdoor amenities | Share of outdoor amenities (swimming pool and garden) |
| Dish | Dishwasher | Dummy variable: 1 if residence has a dishwasher |
| Eff_Dev | Index of efficient devices | Share of water-saving devices in residence |
| Eff_Appl | Index of efficient appliances | Share of water and energy-saving appliances in residence |
| Wat_Hab | Index of water-saving habits | Share of declared water-saving habits out of 13 possible habits |
| Unk_Cons | No consumption perception | Dummy variable: 1 if the respondent does not provide any estimation of his/her water consumption, 0 otherwise |
| Unk_Bill | No bill perception | Dummy variable: 1 if the respondent does not provide any estimation of his/her water bill, 0 otherwise |
| Out | No consumption | Dummy variable: 1 if household’s consumption in the period is 0, 0 otherwise |
| Water Consumption | Block 1 (≤30 m3) | Block 2 (30–50 m3) | Block 3 (>50 m3) |
|---|---|---|---|
| Before January 2020 | |||
| ≤30 m3 | €1.02234/m3 | ||
| 30–50 m3 | €1.10224/m3 | €1.29892/m3 | |
| >50 m3 | €1.18204/m3 | €1.37872/m3 | €1.549/m3 |
| From January 2020 onwards | |||
| ≤30 m3 | €1.05347/m3 | ||
| 30–50 m3 | €1.13337/m3 | €1.33984/m3 | |
| >50 m3 | €1.21317/m3 | €1.41964/m3 | €1.5985/m3 |
| PreCOVID (N = 17,927) | COVID (N = 6963) | PostCOVID (N = 1970) | ||||
|---|---|---|---|---|---|---|
| Variable | Mean | SD | Mean | SD | Mean | SD |
| Q | 16.958 | 16.917 | 18.079 | 18.167 | 17.349 | 17.828 |
| IMgP | 4274.339 | 2215.979 | 4077.931 | 1992.412 | 4087.728 | 1980.246 |
| Memb | 2.443 | 1.067 | 2.438 | 1.074 | 2.437 | 1.076 |
| Seniors | 0.292 | 0.413 | 0.281 | 0.409 | 0.282 | 0.41 |
| Minors | 0.105 | 0.183 | 0.107 | 0.184 | 0.106 | 0.184 |
| Employed | 0.43 | 0.371 | 0.438 | 0.372 | 0.438 | 0.373 |
| Women | 0.527 | 0.282 | 0.53 | 0.284 | 0.529 | 0.283 |
| Old_H | 0.485 | 0.5 | 0.48 | 0.5 | 0.482 | 0.5 |
| Amenities | 0.122 | 0.26 | 0.12 | 0.258 | 0.121 | 0.259 |
| Dish | 0.616 | 0.486 | 0.619 | 0.486 | 0.62 | 0.485 |
| Eff_Dev | 0.211 | 0.249 | 0.212 | 0.248 | 0.213 | 0.249 |
| Eff_Appl | 0.553 | 0.421 | 0.56 | 0.421 | 0.561 | 0.421 |
| Wat_Hab | 0.658 | 0.136 | 0.658 | 0.136 | 0.657 | 0.137 |
| Unk_Cons | 0.648 | 0.478 | 0.657 | 0.475 | 0.657 | 0.475 |
| Unk_Bill | 0.256 | 0.437 | 0.253 | 0.435 | 0.253 | 0.435 |
| Out | 0.016 | 0.127 | 0.018 | 0.131 | 0.022 | 0.148 |
| PreCOVID | COVID | PostCOVID | |
|---|---|---|---|
| IMgP | 0.001 *** | 0.000 | 0.001 * |
| (8.02) | (0.32) | (1.86) | |
| Memb | 4.753 *** | 5.293 *** | 5.272 *** |
| (30.77) | (21.98) | (11.71) | |
| Seniors | 1.729 *** | 1.828 *** | 1.467 |
| (3.96) | (2.68) | (1.16) | |
| Minors | −15.001 *** | −9.923 *** | −12.030 *** |
| (−18.29) | (−7.70) | (−5.02) | |
| Employed | −3.231 *** | −2.213 *** | −2.656 * |
| (−6.77) | (−2.99) | (−1.94) | |
| Women | −1.159 *** | −1.354 ** | −0.770 |
| (−2.84) | (−2.13) | (−0.65) | |
| Old_H | 1.972 *** | 1.184 *** | 1.694 ** |
| (7.29) | (2.80) | (2.16) | |
| Amenities | 16.457 *** | 17.162 *** | 17.165 *** |
| (28.12) | (18.90) | (10.19) | |
| Dish | 3.511 *** | 2.814 *** | 2.366 *** |
| (12.04) | (6.13) | (2.78) | |
| Eff_Dev | −1.880 *** | −2.450 *** | −2.340 |
| (−3.82) | (−3.16) | (−1.63) | |
| Eff_Appl | −1.702 *** | −1.569 *** | −0.178 |
| (−5.27) | (−3.09) | (−0.19) | |
| Wat_Hab | −6.339 *** | −6.648 *** | −7.043 *** |
| (−7.41) | (−4.96) | (−2.83) | |
| Unk_Cons | 0.704 *** | 0.118 | 1.224 |
| (2.69) | (0.29) | (1.60) | |
| Unk_Bill | −0.113 | 0.018 | 0.636 |
| (−0.41) | (0.04) | (0.79) | |
| Out | −14.627 *** | −15.487 *** | −13.982 *** |
| (−15.62) | (−11.41) | (−6.22) | |
| Control Function | −0.005 *** | −0.004 *** | −0.004 *** |
| (−27.68) | (−15.05) | (−9.55) | |
| Intercept | 3.313 *** | 9.808 *** | 4.916 * |
| (3.48) | (6.62) | (1.85) | |
| District and billing period effects | YES | YES | YES |
| Var(e.q) | 203.845 *** | 200.234 *** | |
| (106.93) | (94.57) | ||
| N | 15,919 | 6947 | 1967 |
| PreCOVID–COVID Test | PreCOVID–PostCOVID Test | |
|---|---|---|
| IMgP | 16.98 *** | 0.80 |
| (0.00) | (0.370) | |
| Memb | 3.67 * | 1.23 |
| (0.055) | (0.266) | |
| Seniors | 0.02 | 0.04 |
| (0.890) | (0.841) | |
| Minors | 11.40 *** | 1.43 |
| (0.00) | (0.232) | |
| Employed | 1.38 | 0.16 |
| (0.240) | (0.686) | |
| Women | 0.07 | 0.10 |
| (0.793) | (0.751) | |
| Old_H | 2.54 | 0.12 |
| (0.111) | (0.733) | |
| Amenities | 0.44 | 0.16 |
| (0.508) | (0.686) | |
| Dish | 1.69 | 1.68 |
| (0.193) | (0.195) | |
| Eff_Dev | 0.40 | 0.10 |
| (0.843) | (0.757) | |
| Eff_Appl | 0.05 | 2.43 |
| (0.822) | (0.119) | |
| Wat_Hab | 0.04 | 0.07 |
| (0.843) | (0.785) | |
| Unk_Cons | 1.49 | 0.43 |
| (0.222) | (0.511) | |
| Unk_Bill | 0.07 | 0.81 |
| (0.795) | (0.368) | |
| Out | 0.28 | 0.07 |
| (0.596) | (0.787) |
| Elasticities | PreCOVID | COVID | PostCOVID |
|---|---|---|---|
| Price | −0.205 *** | −0.012 | −0.134 * |
| (8.01) | (0.32) | (1.87) | |
| Household size | 0.696 *** | 0.760 *** | 0.788 *** |
| (27.51) | (19.39) | (10.25) |
Disclaimer/Publisher’s Note: The statements, opinions and data contained in all publications are solely those of the individual author(s) and contributor(s) and not of MDPI and/or the editor(s). MDPI and/or the editor(s) disclaim responsibility for any injury to people or property resulting from any ideas, methods, instructions or products referred to in the content. |
© 2025 by the authors. Licensee MDPI, Basel, Switzerland. This article is an open access article distributed under the terms and conditions of the Creative Commons Attribution (CC BY) license (https://creativecommons.org/licenses/by/4.0/).
Share and Cite
Balado-Naves, R.; García-Valiñas, M.Á. The Role of Household Heterogeneity on Unplanned Water Demand Shifts. Water 2025, 17, 363. https://doi.org/10.3390/w17030363
Balado-Naves R, García-Valiñas MÁ. The Role of Household Heterogeneity on Unplanned Water Demand Shifts. Water. 2025; 17(3):363. https://doi.org/10.3390/w17030363
Chicago/Turabian StyleBalado-Naves, Roberto, and María Á. García-Valiñas. 2025. "The Role of Household Heterogeneity on Unplanned Water Demand Shifts" Water 17, no. 3: 363. https://doi.org/10.3390/w17030363
APA StyleBalado-Naves, R., & García-Valiñas, M. Á. (2025). The Role of Household Heterogeneity on Unplanned Water Demand Shifts. Water, 17(3), 363. https://doi.org/10.3390/w17030363