
Field Testing of an Affordable Zero-Liquid-Discharge Arsenic-Removal Technology for a Small-Community Drinking Water System in Rural California

 ,
,  and
and
Abstract
:1. Introduction
2. Materials and Methods
2.1. Laboratory Scale ACAIE Batch Experiments
2.2. Pilot Scale ACAIE Treatment System
2.2.1. Source of Groundwater
2.2.2. Unit Processes
- (1)
- Electrolysis
- (2)
- Coagulation/Flocculation
- (3)
- Particle Separation
- (4)
- Sampling Plan and Wet Chemical Measurements
- (5)
- Faradaic Efficiency of Air Cathodes in H2O2 Production
3. Results and Discussions
3.1. Results from the Laboratory Testing of an ACAIE System with Allensworth Groundwater
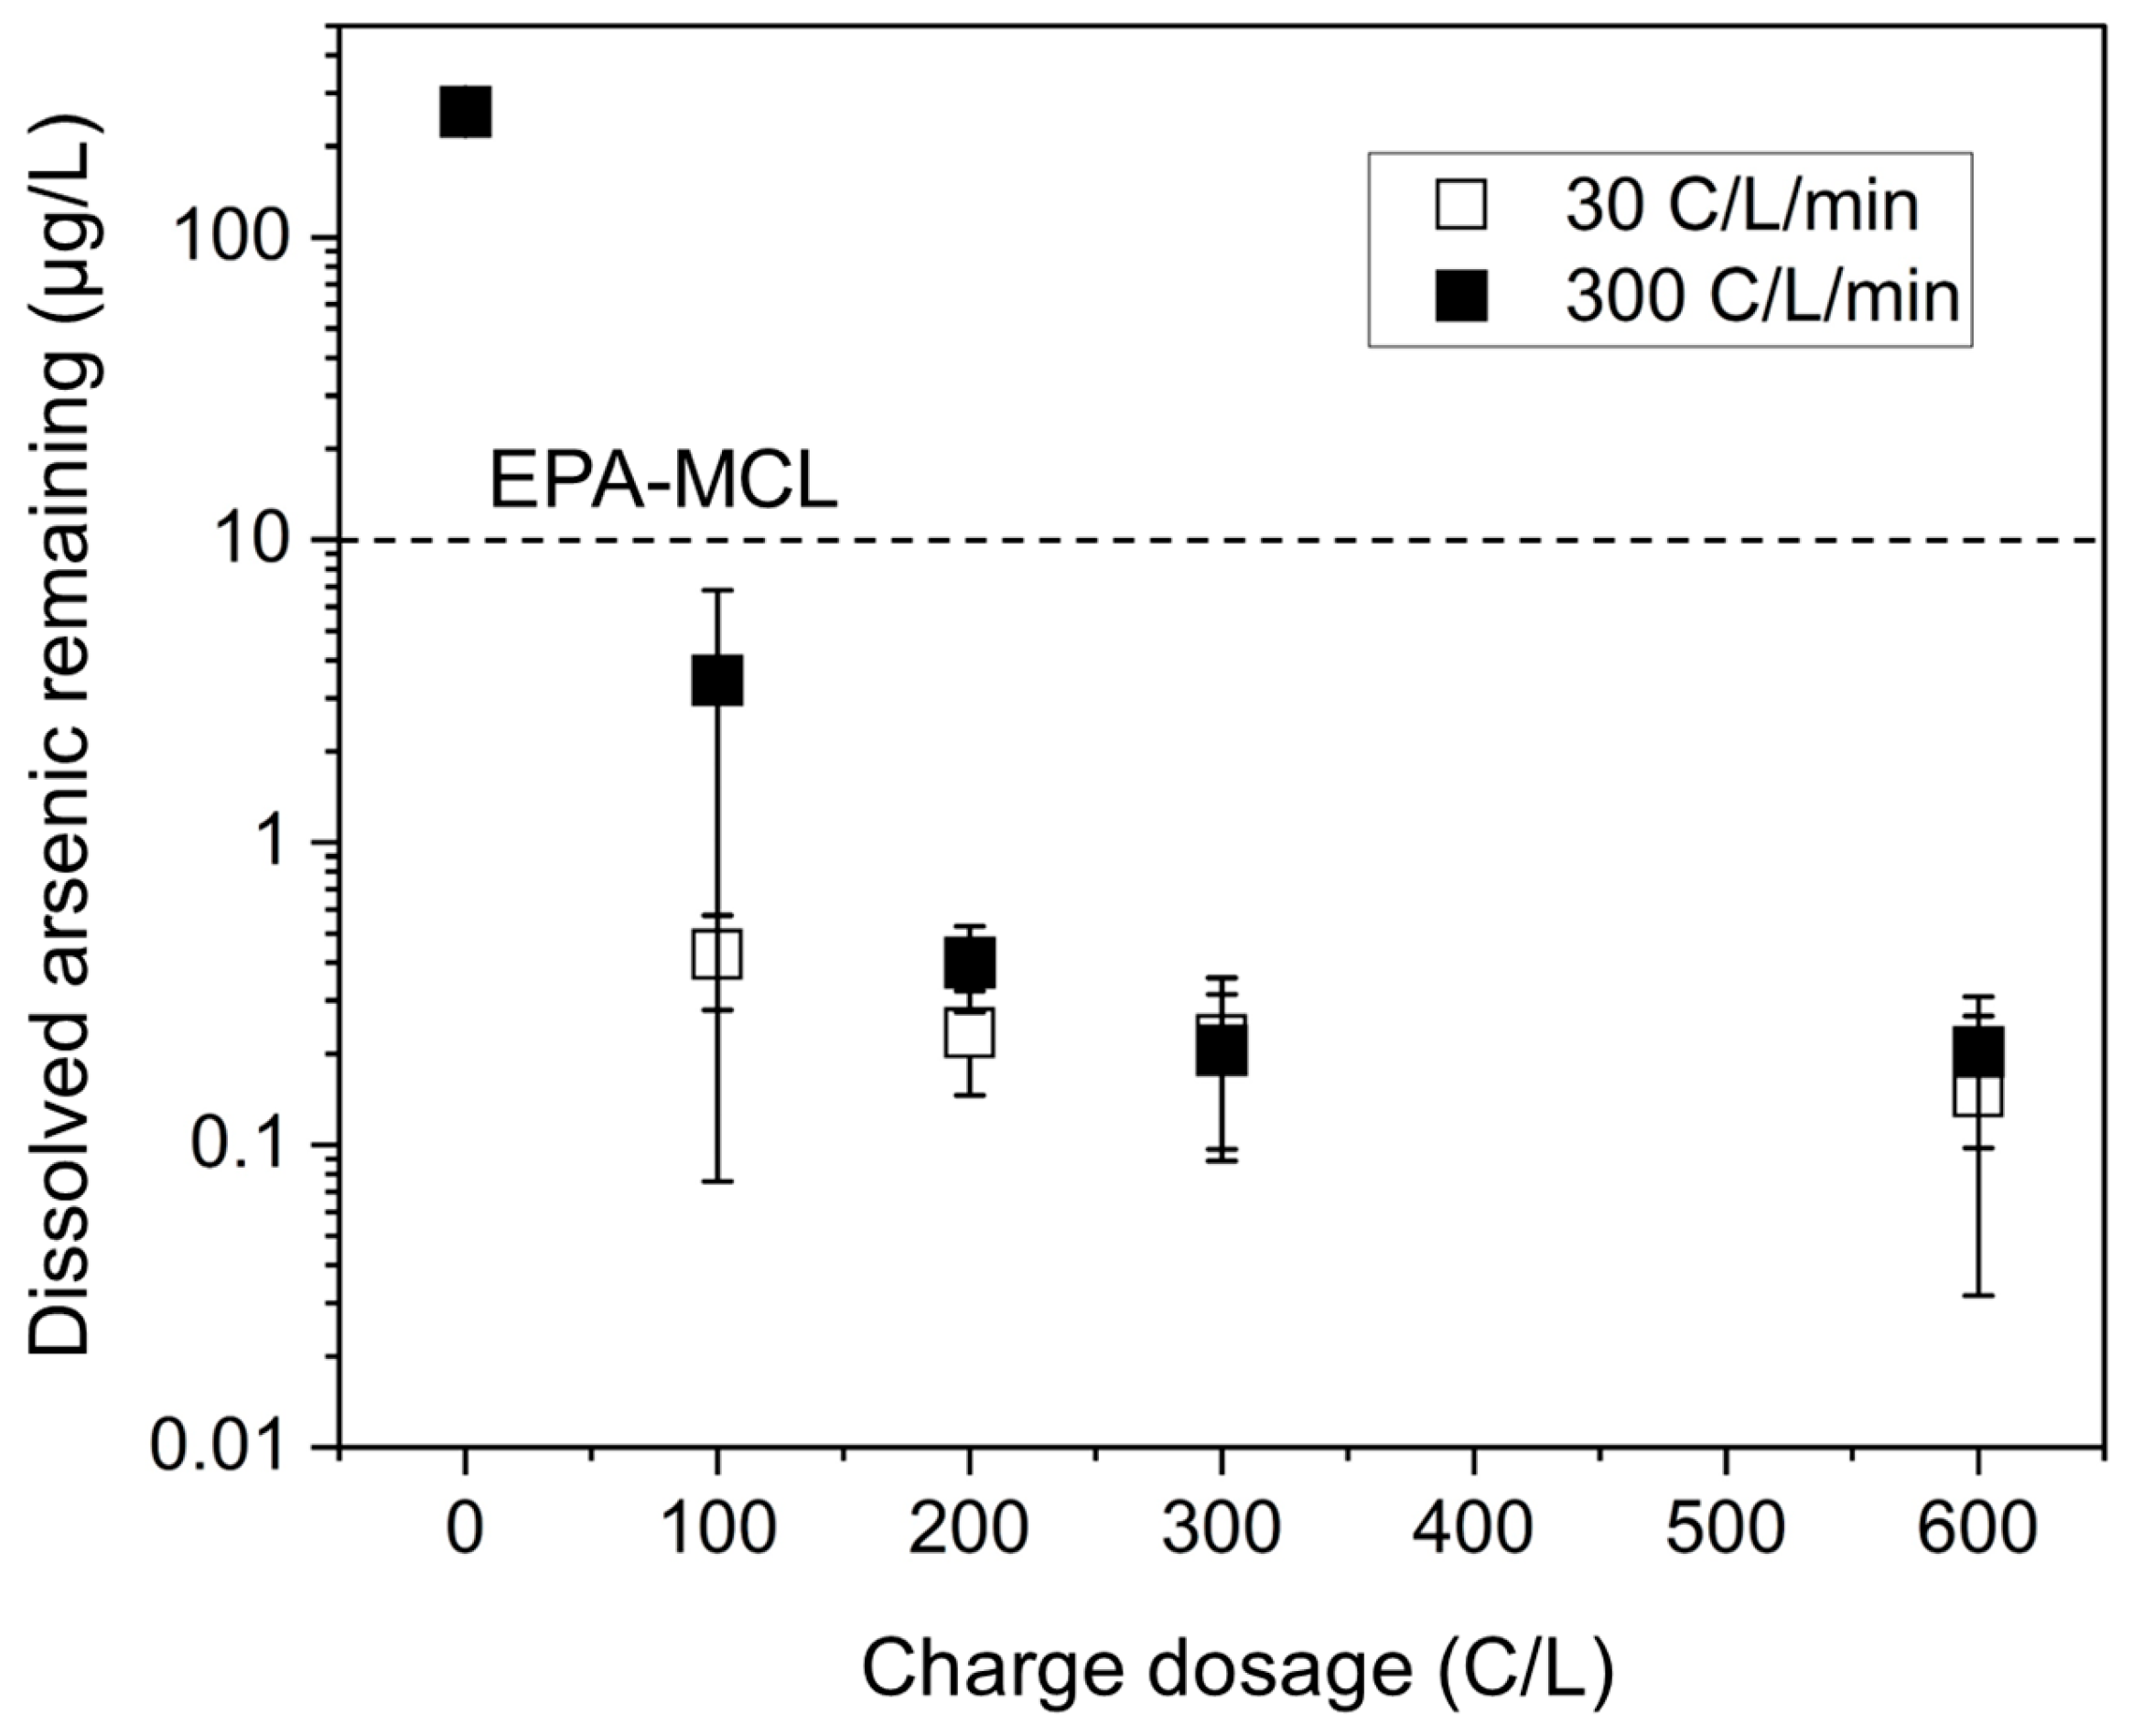
3.1.1. Minimum Charge Dosage for Arsenic Removal Below Safe Levels
3.1.2. Residual Hydrogen Peroxide
3.2. Results from Field Testing of Pilot Scale ACAIE System in Allensworth
3.2.1. Characteristics of the Treated Water
- (1)
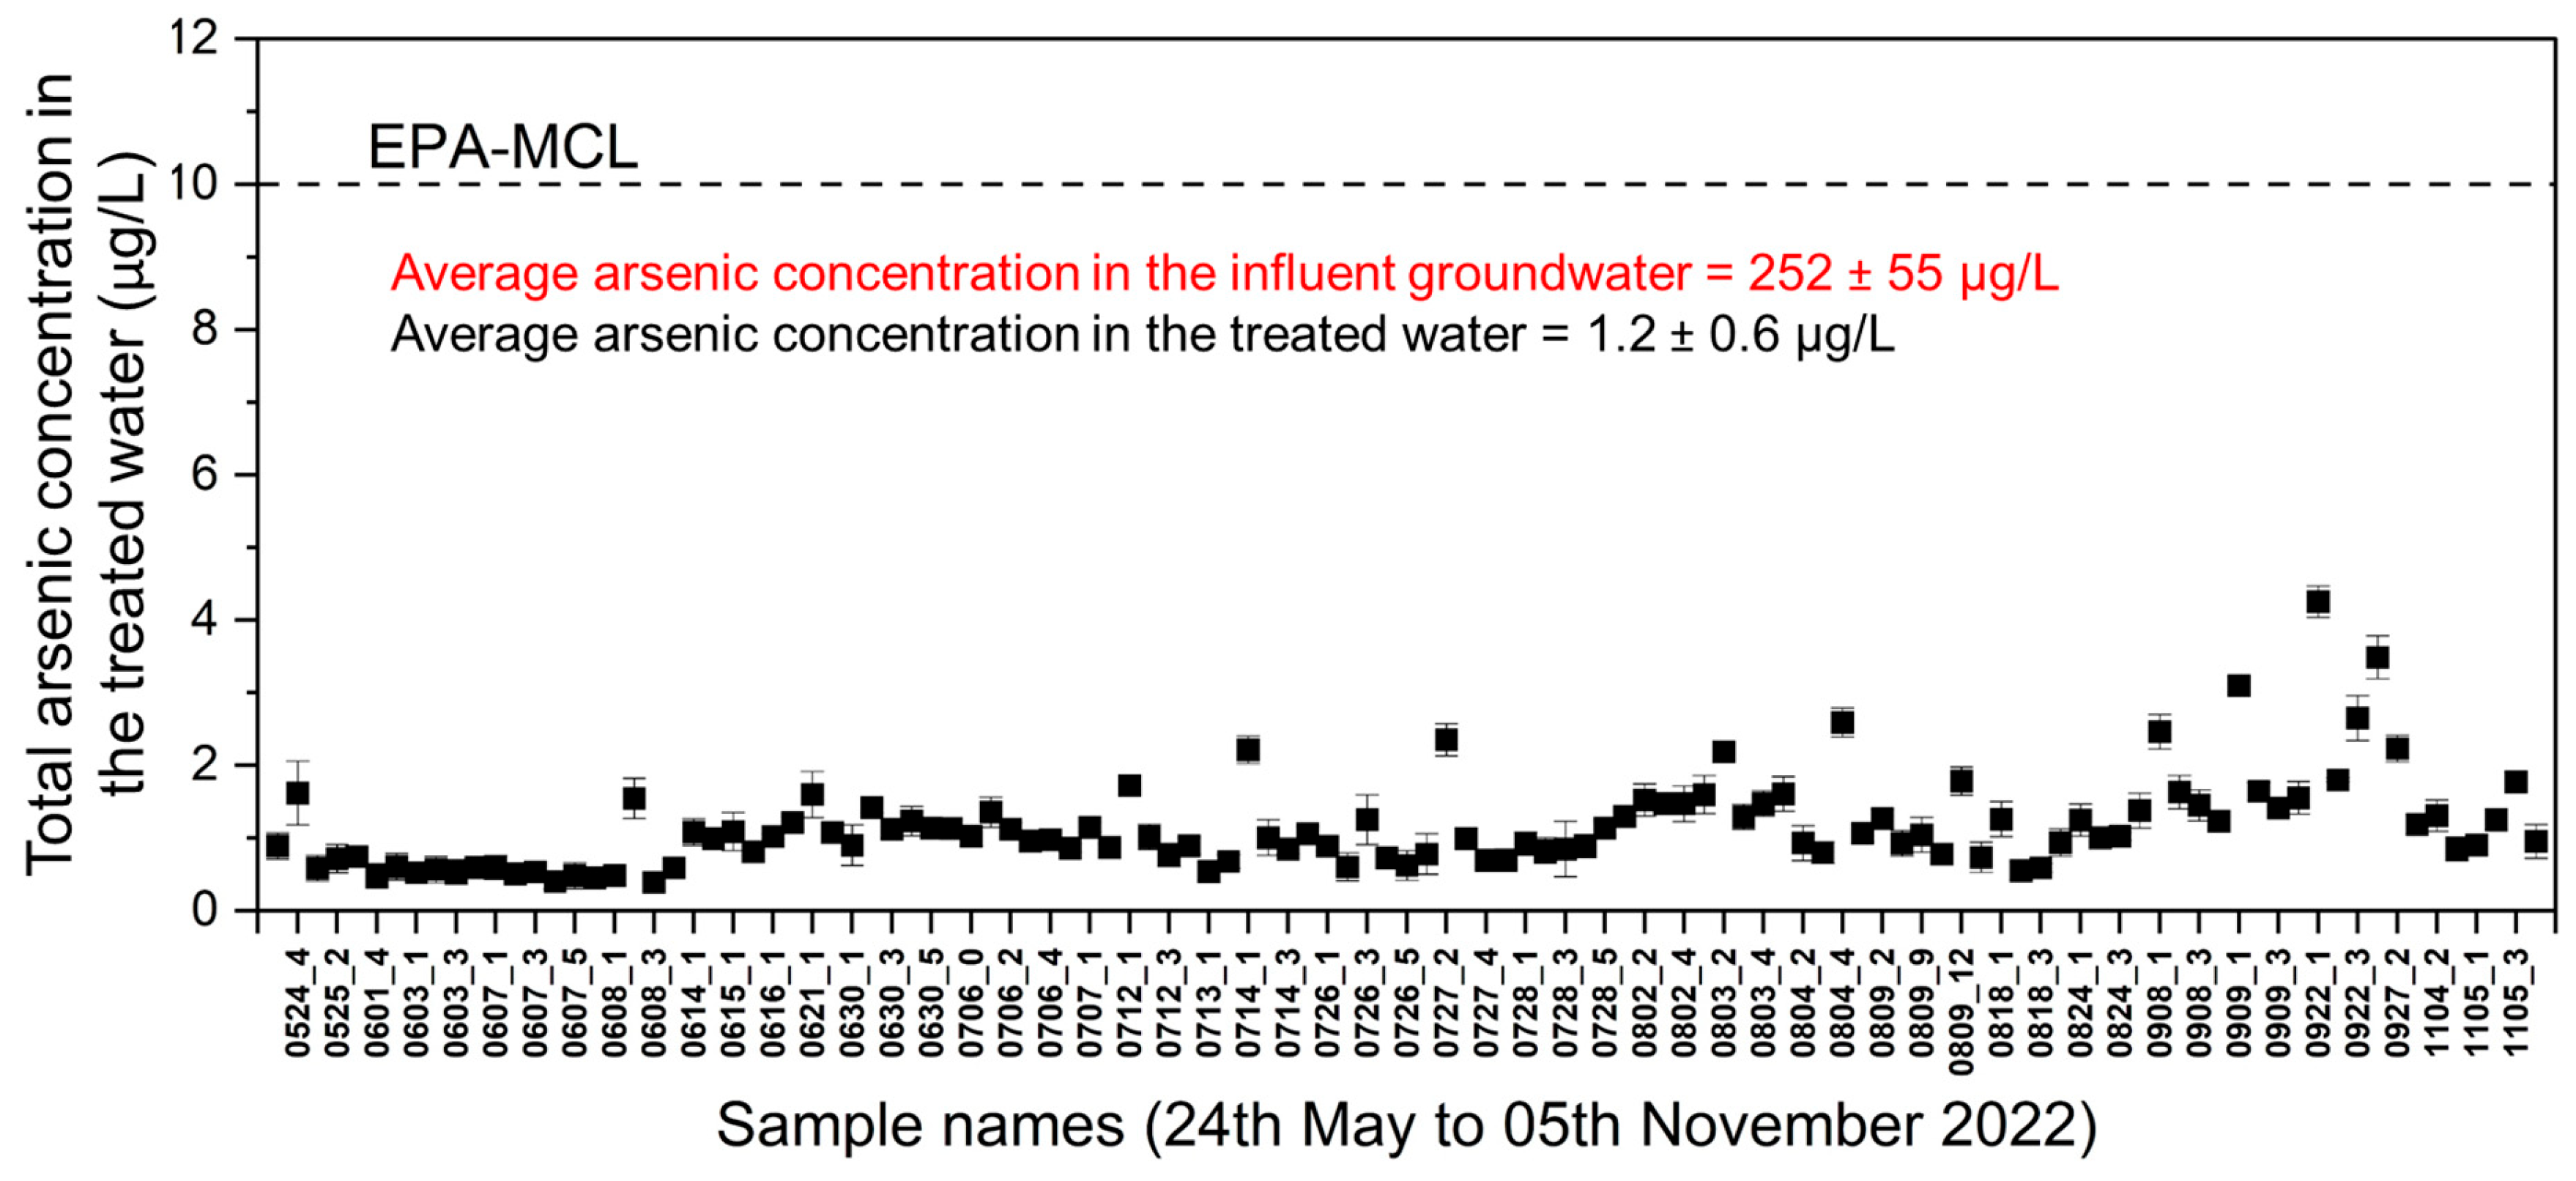
- Total arsenic
- (2)
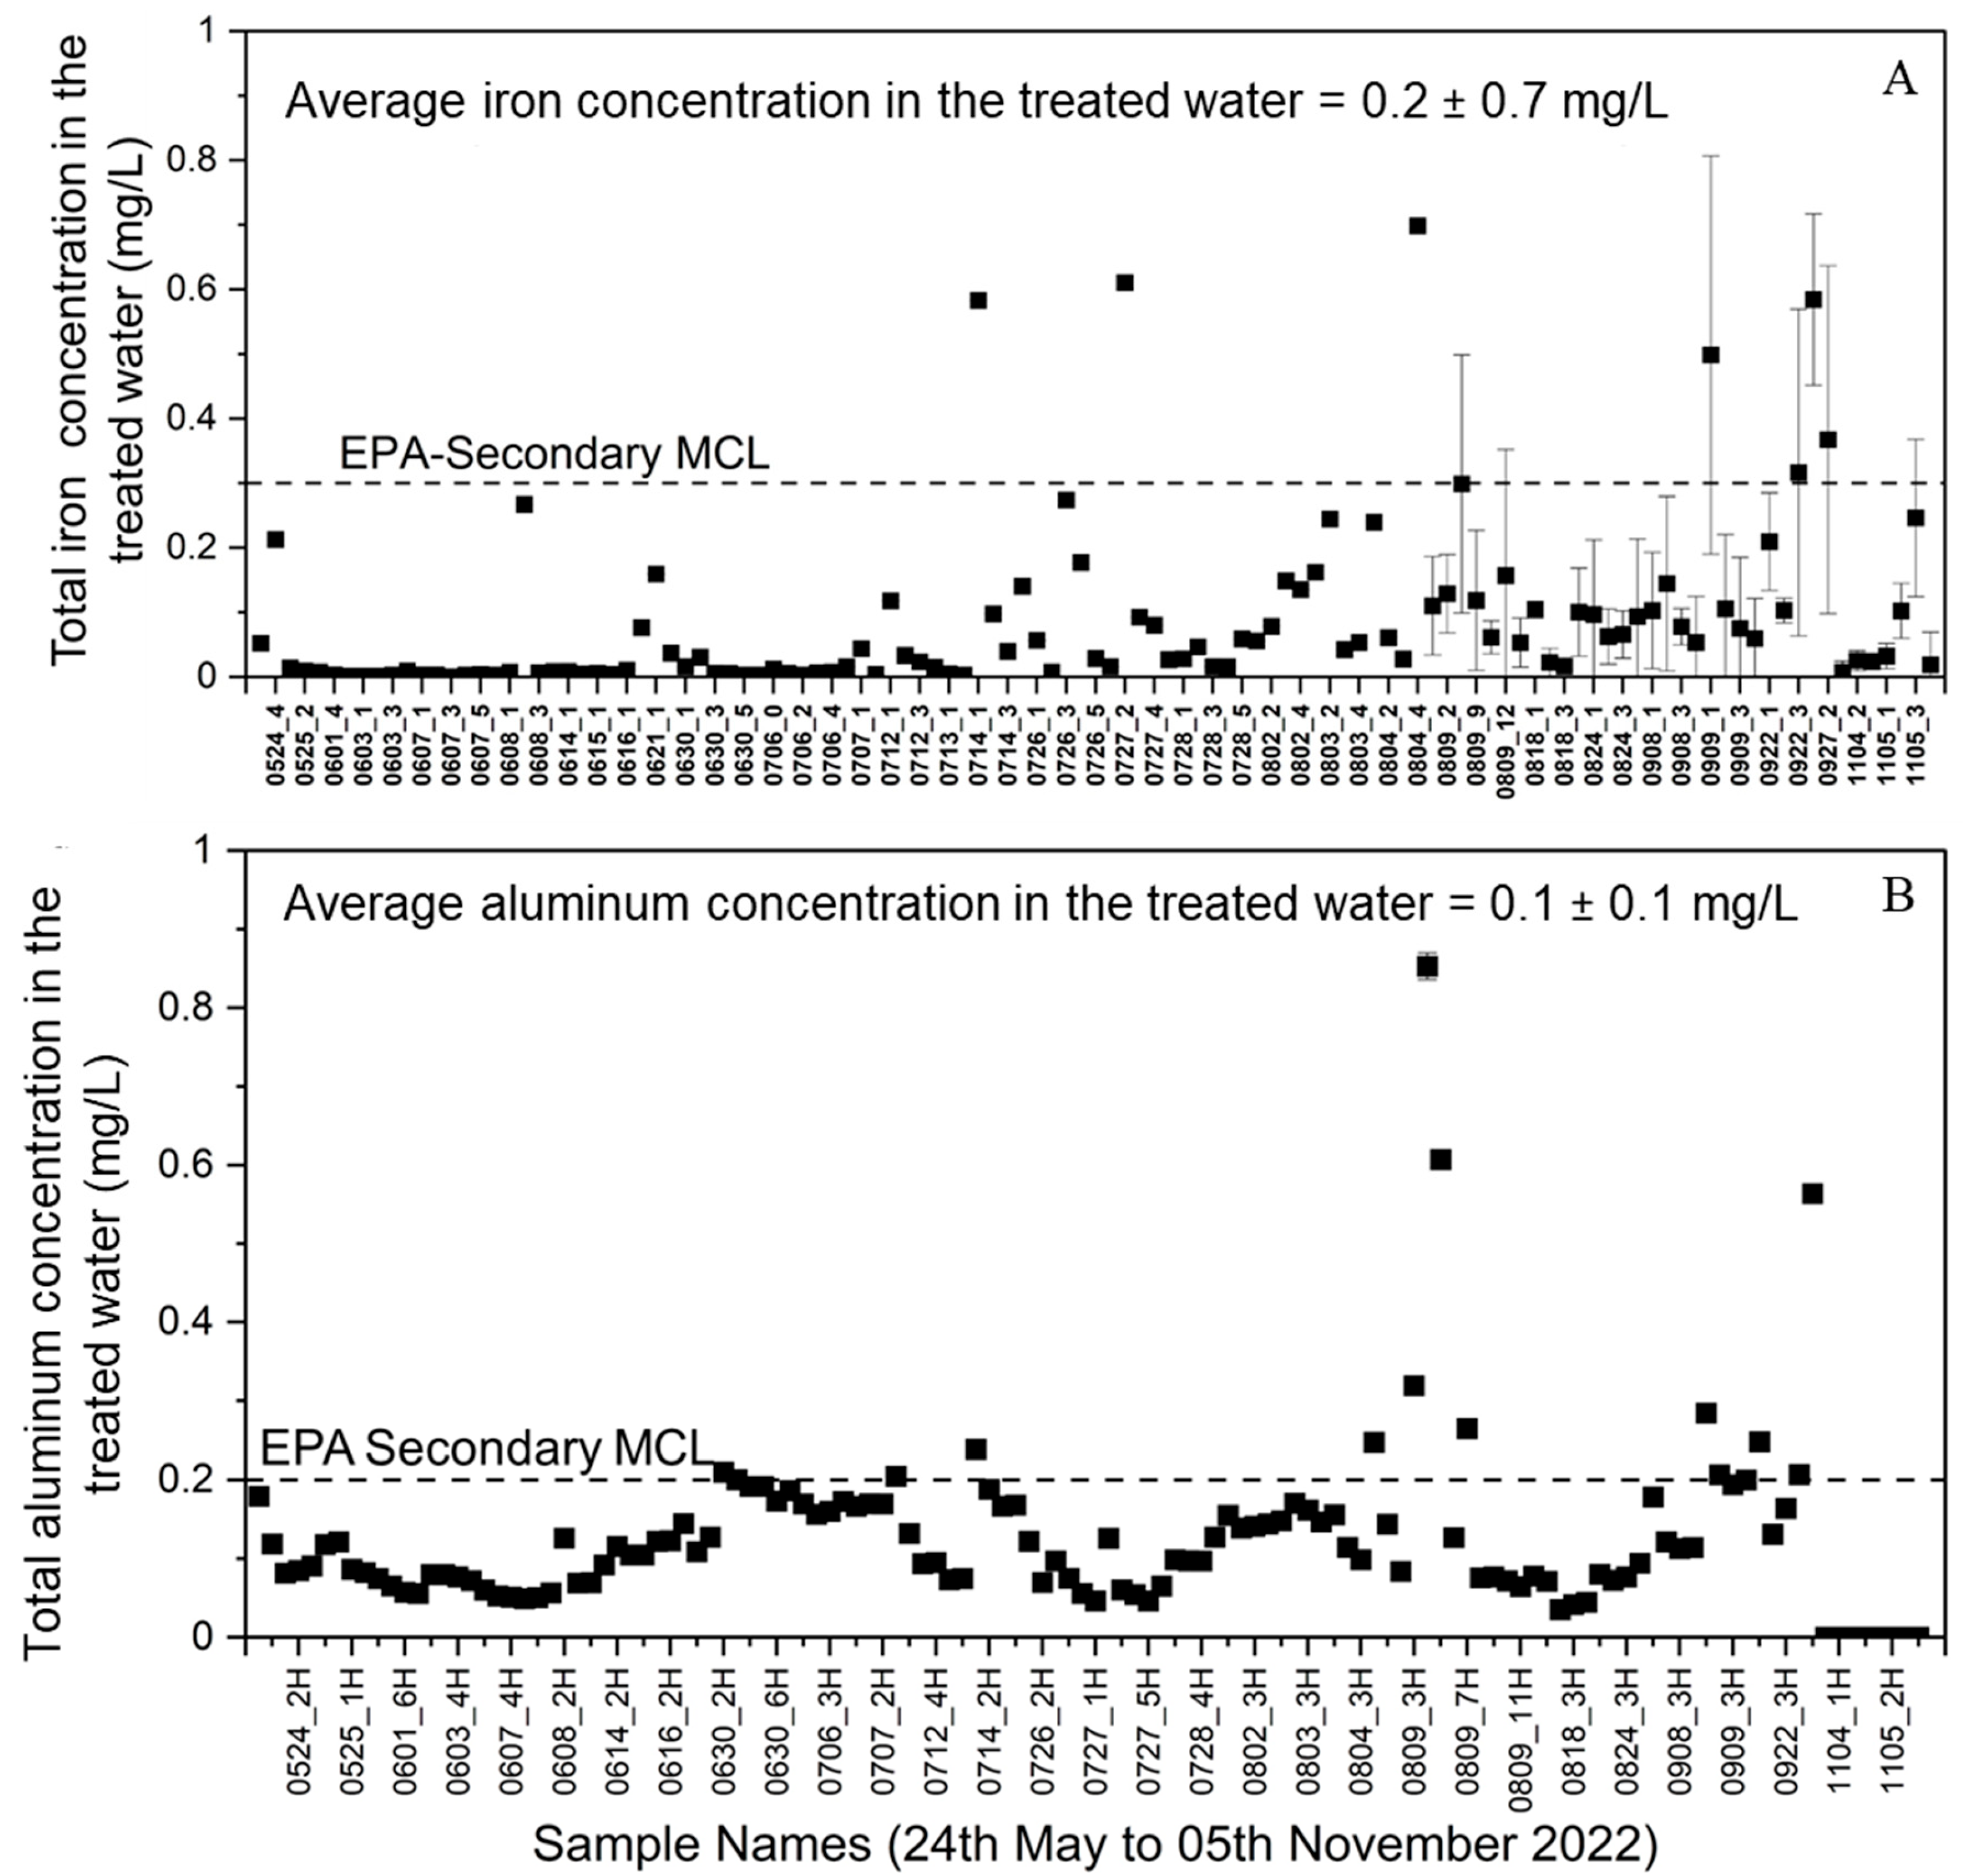
- Total iron and total aluminum contents
- (3)
- Bulk solution pH and dissolved oxygen
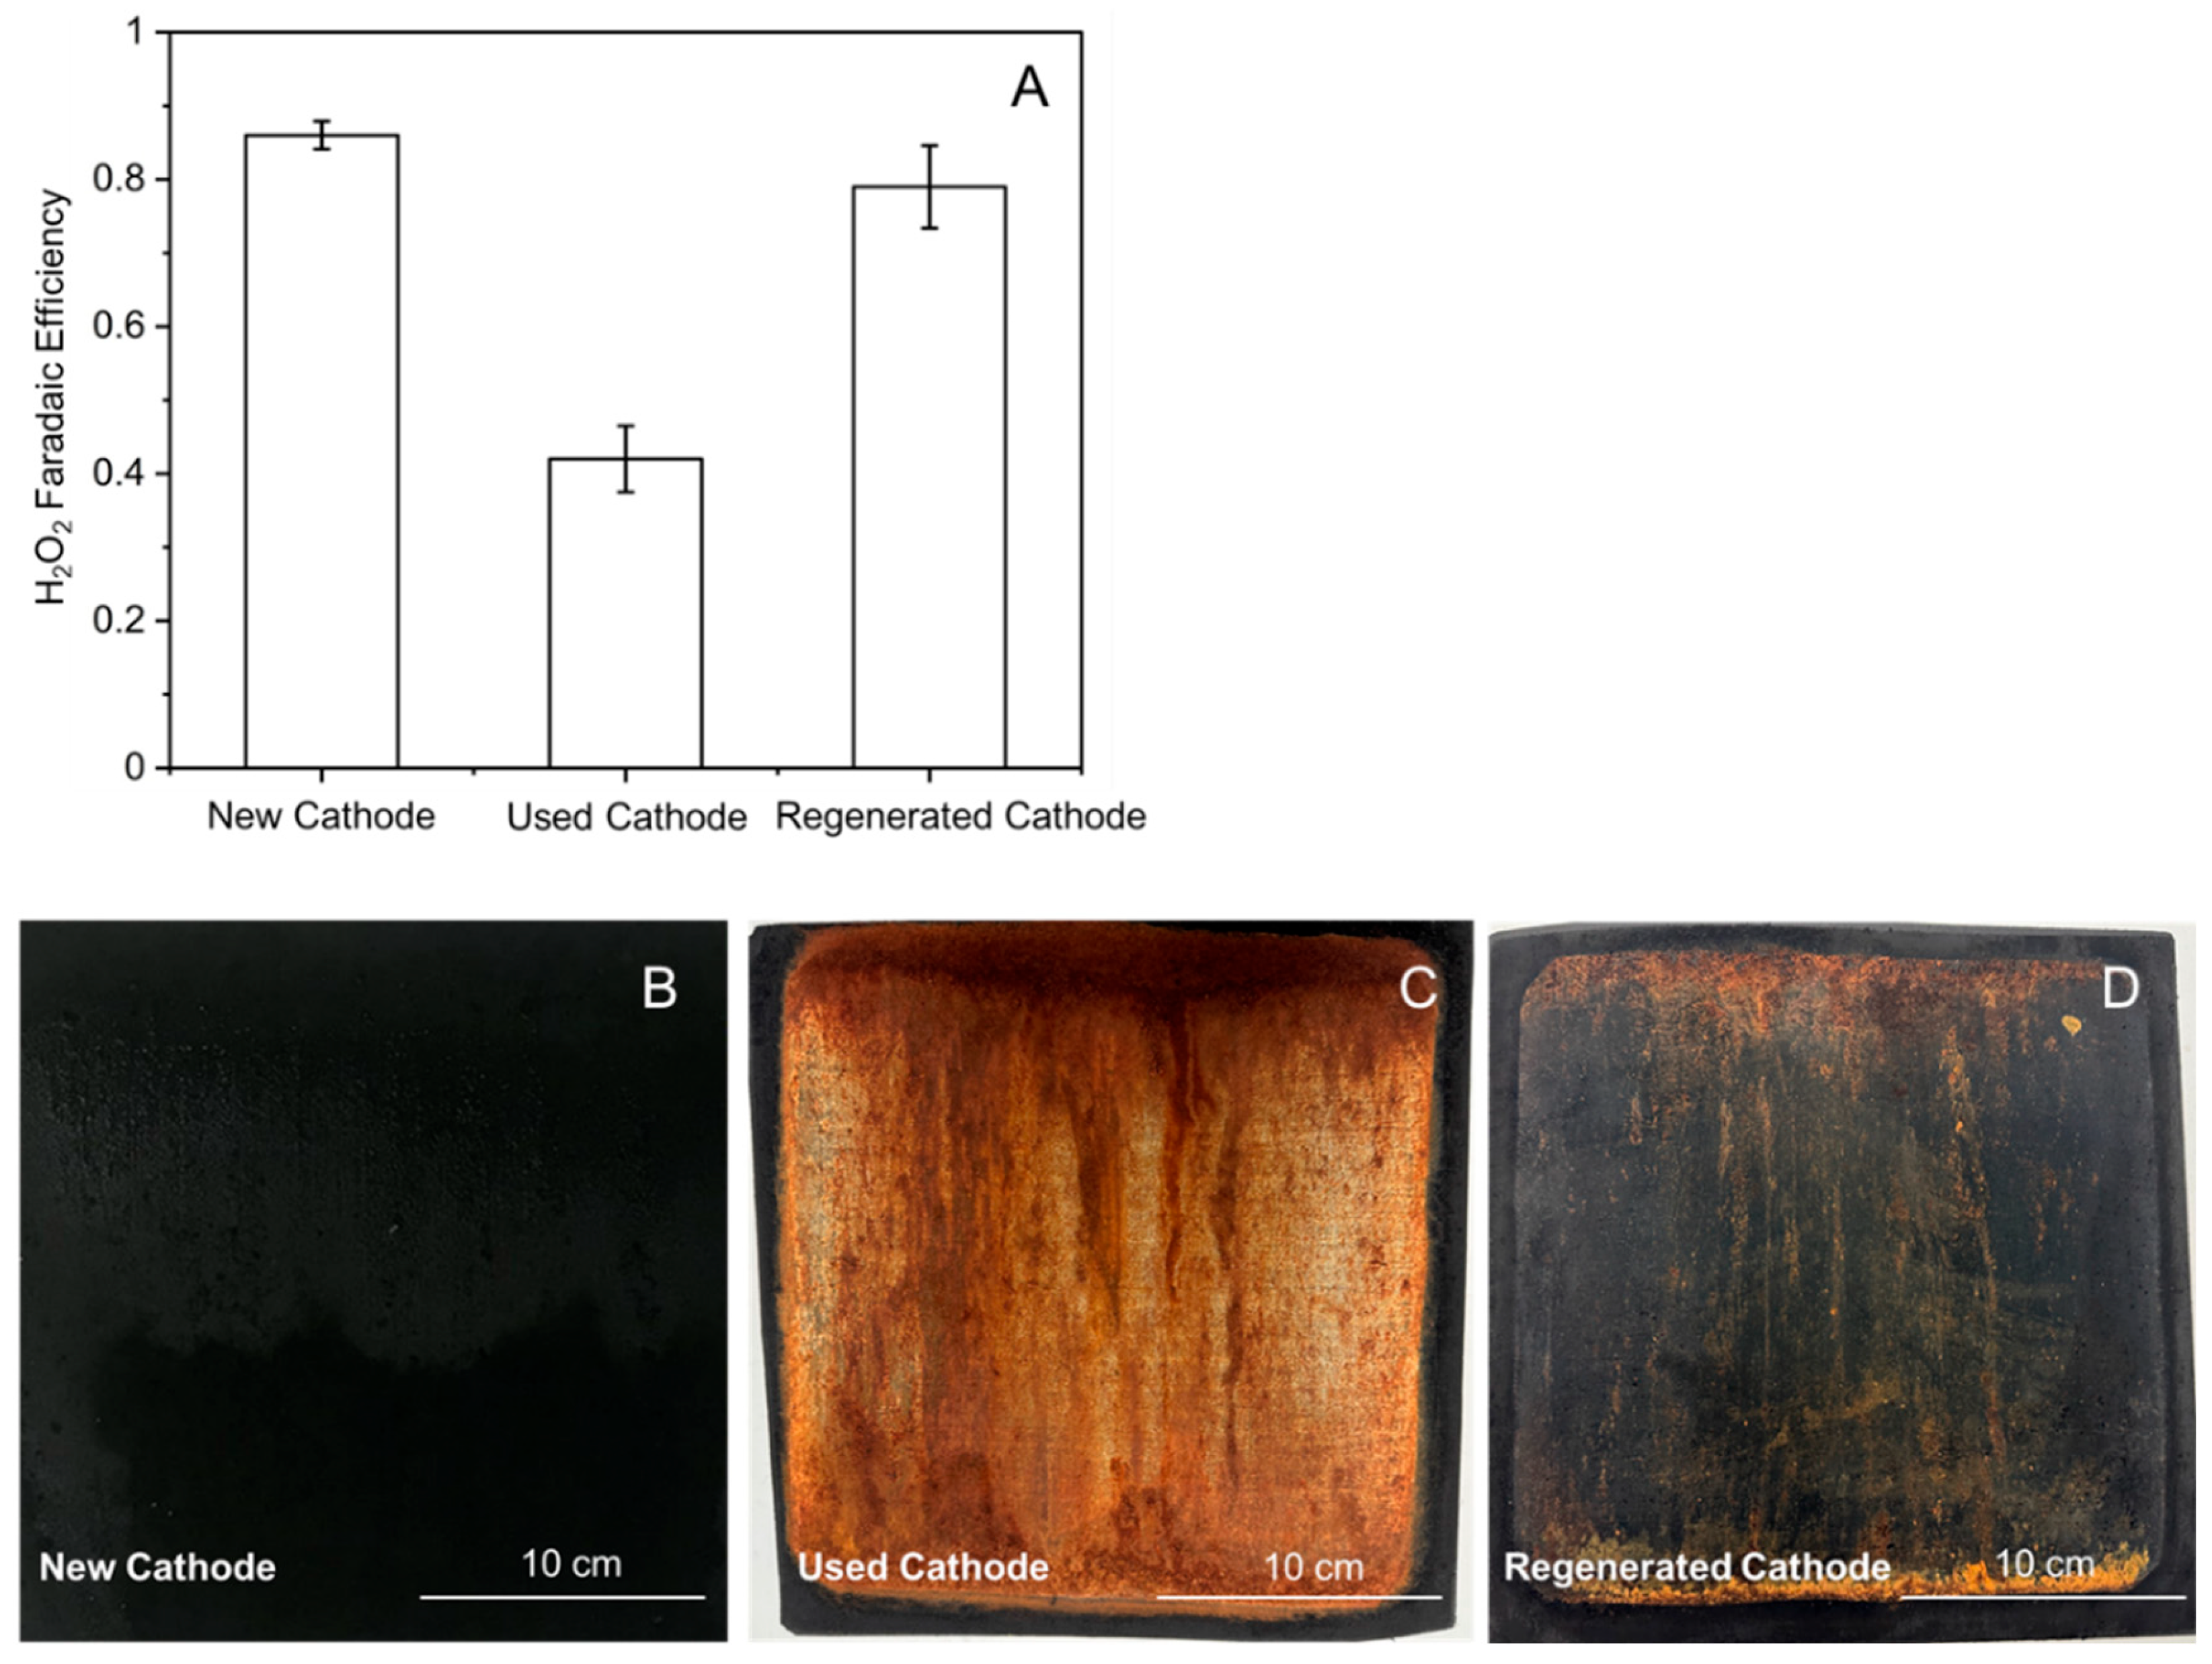
3.2.2. Air Cathode Performance in the Field
3.3. Economic Analysis of the ACAIE Community-Scale Plant
4. Concluding Remarks
Supplementary Materials
Author Contributions
Funding
Data Availability Statement
Acknowledgments
Conflicts of Interest
References
- WHO; UNICEF; World Bank. State of the World’s; WHO: Geneva, Switzerland; UNICEF: New York, NY, USA; World Bank: Washington, DC, USA, 2022; ISBN 9789280652901. [Google Scholar]
- Van der Gun, J. Groundwater and Global Change: Trends, Opportunities and Challenges; United Nations Educational, Scientific and Cultural Organization (UNESCO): Paris, France, 2012; ISBN 978-92-3-001049-2. [Google Scholar]
- Smith, R.; Knight, R.; Fendorf, S. Overpumping leads to California groundwater arsenic threat. Nat. Commun. 2018, 9, 2089. [Google Scholar] [CrossRef] [PubMed]
- Smith, A.H.; Lopipero, P.A.; Bates, M.N.; Steinmaus, C.M. Arsenic epidemiology and drinking water standards. Science 2002, 296, 2145–2146. [Google Scholar] [CrossRef] [PubMed]
- Podgorski, J.; Berg, M. Global threat of arsenic in groundwater. Science 2020, 368, 845–850. [Google Scholar] [CrossRef] [PubMed]
- Guo, J.; Cao, W.; Lang, G.; Sun, Q.; Nan, T.; Li, X.; Ren, Y.; Li, Z. Worldwide distribution, health risk, treatment technology, and development tendency of geogenic high-arsenic groundwater. Water 2024, 16, 478. [Google Scholar] [CrossRef]
- Chen, Q.Y.; Costa, M. Arsenic: A global environmental challenge. Annu. Rev. Pharmacol. Toxicol. 2021, 61, 47–63. [Google Scholar] [CrossRef]
- Balazs, C.L.; Morello-Frosch, R.; Hubbard, A.E.; Ray, I. Environmental justice implications of arsenic contamination in California’s San Joaquin Valley: A cross-sectional, cluster-design examining exposure and compliance in community drinking water systems. Environ. Health 2012, 11, 84. [Google Scholar] [CrossRef] [PubMed]
- Rempel, J.; Ray, I.; Hessl, E.; Vazin, J.; Zhou, Z.; Kim, S.; Zhang, X.; Ding, C.; He, Z.; Pellow, D. The human right to water: A 20-year comparative analysis of arsenic in rural and carceral drinking water systems in California. Environ. Health Perspect. 2022, 130, 97701. [Google Scholar] [CrossRef]
- Boyden, H.; Gillan, M.; Molina, J.; Gadgil, A.; Tseng, W. Community perceptions of arsenic contaminated drinking water and preferences for risk communication in California’s San Joaquin Valley. Int. J. Environ. Res. Public Health 2023, 20, 813. [Google Scholar] [CrossRef] [PubMed]
- Levin, R.; Villanueva, C.M.; Beene, D.; Cradock, A.L.; Donat-Vargas, C.; Lewis, J.; Martinez-Morata, I.; Minovi, D.; Nigra, A.E.; Olson, E.D. US drinking water quality: Exposure risk profiles for seven legacy and emerging contaminants. J. Expo. Sci. Environ. Epidemiol. 2024, 34, 3–22. [Google Scholar] [CrossRef] [PubMed]
- Wang, L.; Chen, A.S.; Sorg, T.J.; Supply, W. Costs of Arsenic Removal Technologies for Small Water Systems: U.S. EPA Arsenic Removal Technology Demonstration Program; EPA/600/R-11/090; National Risk Management Research Laboratory: Cincinnati, OH, USA, 2011. [Google Scholar]
- Chen, A.S.C.; Wang, L.; Sorg, T.J.; Lytle, D.A. Removing arsenic and co-occurring contaminants from drinking water by full-scale ion exchange and point-of-use/point-of-entry reverse osmosis systems. Water Res. 2020, 172, 115455. [Google Scholar] [CrossRef]
- Glade, S.; Bandaru, S.R.S.; Nahata, M.; Majmudar, J.; Gadgil, A. Adapting a drinking water treatment technology for arsenic removal to the context of a small, low-income California community. Water Res. 2021, 204, 117595. [Google Scholar] [CrossRef] [PubMed]
- Sorg, T.J.; Wang, L.; Chen, A.S.C. The costs of small drinking water systems removing arsenic from groundwater. J. Water Supply Res. Technol. 2015, 64, 219–234. [Google Scholar] [CrossRef]
- Nigra, A.E.; Chen, Q.; Chillrud, S.N.; Wang, L.; Harvey, D.; Mailloux, B.; Factor-Litvak, P.; Navas-Acien, A. Inequalities in public water arsenic concentrations in counties and community water systems across the united states, 2006–2011. Environ. Health Perspect. 2020, 128, 1–13. [Google Scholar] [CrossRef] [PubMed]
- Hering, J.G.; Katsoyiannis, I.A.; Theoduloz, G.A.; Berg, M.; Hug, S.J. Arsenic Removal from Drinking Water: Experiences with Technologies and Constraints in Practice. J. Environ. Eng. 2017, 143, 03117002. [Google Scholar] [CrossRef]
- California State Water Resources Control Board. State of California Drinking Water Program Annual Compliance Report, Calendar Year 2022; California State Water Resources Control Board: Sacramento, CA, USA, 2023. [Google Scholar]
- State Water Resources Control Board. Drinking Water Affordability Assessment: Informing the 2021–22 Safe & Affordable Drinking Water Fund Expenditure Plan; California State Water Resources Control Board: Sacramento, CA, USA, April 2021. Available online: https://www.waterboards.ca.gov/drinking_water/certlic/drinkingwater/documents/needs/2021_needs_assessment.pdf (accessed on 1 December 2024).
- Goddard, J.J.; Ray, I.; Balazs, C. Water affordability and human right to water implications in California. PLoS ONE 2021, 16, 3–5. [Google Scholar] [CrossRef] [PubMed]
- Ezra David Romero, K.K. They Built It, But Couldn’t Afford to Run It—Clean Drinking Water Fight Focuses on Gaps in Funding; Valley Public Radio: Clovis, CA, USA, 2017. [Google Scholar]
- Radjenovic, J.; Sedlak, D.L. Challenges and opportunities for electrochemical processes as next-generation technologies for the treatment of contaminated water. Environ. Sci. Technol. 2015, 49, 11292–11302. [Google Scholar] [CrossRef]
- Kumar, P.R.; Chaudhari, S.; Khilar, K.C.; Mahajan, S.P. Removal of arsenic from water by electrocoagulation. Chemosphere 2004, 55, 1245–1252. [Google Scholar] [CrossRef]
- Wan, W.; Pepping, T.J.; Banerji, T.; Chaudhari, S.; Giammar, D.E. Effects of water chemistry on arsenic removal from drinking water by electrocoagulation. Water Res. 2011, 45, 384–392. [Google Scholar] [CrossRef] [PubMed]
- Amrose, S.; Gadgil, A.; Srinivasan, V.; Kowolik, K.; Muller, M.; Huang, J.; Kostecki, R. Arsenic removal from groundwater using iron electrocoagulation: Effect of charge dosage rate. J. Environ. Sci. Health-Part A Toxic/Hazardous Subst. Environ. Eng. 2013, 48, 1019–1030. [Google Scholar] [CrossRef]
- Amrose, S.E.; Bandaru, S.R.S.; Delaire, C.; van Genuchten, C.M.; Dutta, A.; DebSarkar, A.; Orr, C.; Roy, J.; Das, A.; Gadgil, A.J. Electro-chemical arsenic remediation: Field trials in West Bengal. Sci. Total Environ. 2014, 488–489, 539–546. [Google Scholar] [CrossRef]
- Delaire, C.; Amrose, S.; Zhang, M.; Hake, J.; Gadgil, A. How do operating conditions affect As(III) removal by iron electrocoagulation? Water Res. 2017, 112, 185–194. [Google Scholar] [CrossRef] [PubMed]
- Müller, D.; Nina Stirn, C.; Veit Maier, M. Arsenic removal from highly contaminated groundwater by iron electrocoagulation-investigation of process parameters and iron dosage calculation. Water 2021, 13, 687. [Google Scholar] [CrossRef]
- Channa, N.; Gadhi, T.A.; Mahar, R.B.; Ali, I.; Sajjad, S.; Freyria, F.S.; Bonelli, B.; Widderich, S.; Frechen, F.-B. Efficient and Rapid Combined Electrocoagulation–Filtration of Arsenic in Drinking Water. Water 2024, 16, 1684. [Google Scholar] [CrossRef]
- Hernandez, D.; Boden, K.; Paul, P.; Bandaru, S.; Mypati, S.; Roy, A.; Amrose, S.; Roy, J.; Gadgil, A. Strategies for successful field deployment in a resource-poor region: Arsenic remediation technology for drinking water. Dev. Eng. 2019, 4, 100045. [Google Scholar] [CrossRef]
- Si, Y.; Li, G.; Zhang, F. Energy-Efficient Oxidation and Removal of Arsenite from Groundwater Using Air-Cathode Iron Electrocoagulation. Environ. Sci. Technol. Lett. 2017, 4, 71–75. [Google Scholar] [CrossRef]
- Bandaru, S.R.S.; van Genuchten, C.M.; Kumar, A.; Glade, S.; Hernandez, D.; Nahata, M.; Gadgil, A. Rapid and efficient arsenic removal by iron electrocoagulation enabled with in situ generation of hydrogen peroxide. Environ. Sci. Technol. 2020, 54, 6094–6103. [Google Scholar] [CrossRef] [PubMed]
- van Genuchten, C. Influence of Electrolyte Chemistry on the Structure and Reactivity of Iron(iii) Precipitates Generated by Iron(0) Electrocoagulation: Implications for Low-Cost Arsenic Treatment—ProQuest. Ph.D. Thesis, University of California Berkeley, Berkeley, CA, USA, 2013. [Google Scholar]
- Banerji, T.; Chaudhari, S. Arsenic removal from drinking water by electrocoagulation using iron electrodes- an understanding of the process parameters. J. Environ. Chem. Eng. 2016, 4, 3990–4000. [Google Scholar] [CrossRef]
- Barazesh, J.M.; Prasse, C.; Wenk, J.; Berg, S.; Remucal, C.K.; Sedlak, D.L. Trace Element Removal in Distributed Drinking Water Treatment Systems by Cathodic H2O2 Production and UV Photolysis. Environ. Sci. Technol. 2018, 52, 195–204. [Google Scholar] [CrossRef] [PubMed]
- Barazesh, J.M.; Hennebel, T.; Jasper, J.T.; Sedlak, D.L. Modular Advanced Oxidation Process Enabled by Cathodic Hydrogen Peroxide Production. Environ. Sci. Technol. 2015, 49, 7391–7399. [Google Scholar] [CrossRef] [PubMed]
- Dixit, S.; Hering, J.G. Comparison of arsenic (V) and arsenic (III) sorption onto iron oxide minerals: Implications for arsenic mobility. Environ. Sci. Technol. 2003, 37, 4182–4189. [Google Scholar] [CrossRef] [PubMed]
- Hug, S.J.; Leupin, O. Iron-catalyzed oxidation of arsenic (III) by oxygen and by hydrogen peroxide: pH-dependent formation of oxidants in the Fenton reaction. Environ. Sci. Technol. 2003, 37, 2734–2742. [Google Scholar] [CrossRef] [PubMed]
- Roy, M.; van Genuchten, C.M.; Rietveld, L.; van Halem, D. Groundwater-native Fe (II) oxidation prior to aeration with H2O2 to enhance As (III) removal. Water Res. 2022, 223, 119007. [Google Scholar] [CrossRef]
- Si, Y.; Zhang, F.; Hong, C.; Li, G.; Zhang, H.; Liu, D. Effect of current density on groundwater arsenite removal performance using air cathode electrocoagulation. Front. Environ. Sci. Eng. 2021, 15, 112. [Google Scholar] [CrossRef]
- Koutzaris, S.; Xanthopoulou, M.; Laskaridis, A.; Katsoyiannis, I.A. H2O2-Enhanced As (III) Removal from Natural Waters by Fe (III) Coagulation at Neutral pH Values and Comparison with the Conventional Fe (II)-H2O2 Fenton Process. Sustainability 2022, 14, 16306. [Google Scholar] [CrossRef]
- Montefalcon, M.F.V.; Chiong, I.I.I.M.R.; Resurreccion, A.C.; Garcia-Segura, S.; Ocon, J.D. Arsenic removal by advanced electrocoagulation processes: The role of oxidants generated and kinetic modeling. Catalysts 2020, 10, 928. [Google Scholar] [CrossRef]
- Kumar, A.; Nidheesh, P.V.; Kumar, M.S. Composite wastewater treatment by aerated electrocoagulation and modified peroxi-coagulation processes. Chemosphere 2018, 205, 587–593. [Google Scholar] [CrossRef] [PubMed]
- King, D.W.; Farlow, R.J.M.C. Role of carbonate speciation on the oxidation of Fe (II) by H2O2. Mar. Chem. 2000, 70, 201–209. [Google Scholar] [CrossRef]
- Roberts, L.C.; Hug, S.J.; Ruettimann, T.; Billah, M.M.; Khan, A.W.; Rahman, M.T. Arsenic removal with iron (II) and iron (III) in waters with high silicate and phosphate concentrations. Environ. Sci. Technol. 2004, 38, 307–315. [Google Scholar] [CrossRef] [PubMed]
- Kwan, W.P.; Voelker, B.M. Rates of hydroxyl radical generation and organic compound oxidation in mineral-catalyzed fenton-like systems. Environ. Sci. Technol. 2003, 37, 1150–1158. [Google Scholar] [CrossRef]
- Valentine, R.L.; Wang, H.C.A. Iron Oxide Surface Catalyzed Oxidation of Quinoline by Hydrogen Peroxide. J. Environ. Eng. 1998, 124, 31–38. [Google Scholar] [CrossRef]
- Pham, A.L.T.; Doyle, F.M.; Sedlak, D.L. Kinetics and efficiency of H2O2 activation by iron-containing minerals and aquifer materials. Water Res. 2012, 46, 6454–6462. [Google Scholar] [CrossRef]
- U.S EPA National Primary Drinking Water Regulations. Available online: https://www.epa.gov/ground-water-and-drinking-water/national-primary-drinking-water-regulations (accessed on 1 December 2024).
- Ahmad, A.; van der Wens, P.; Baken, K.; de Waal, L.; Bhattacharya, P.; Stuyfzand, P. Arsenic reduction to <1 µg/L in Dutch drinking water. Environ. Int. 2020, 134, 105253. [Google Scholar] [PubMed]
- Ahmad, A.; Bhattacharya, P. Arsenic in drinking water: Is 10 μg/L a safe limit? Curr. Pollut. Rep. 2019, 5, 1–3. [Google Scholar] [CrossRef]
- Benjamin, M.M.; Lawler, D.F. Water Quality Engineering: Physical/Chemical Treatment Processes; John Wiley & Sons: Hoboken, NJ, USA, 2013. [Google Scholar]
- Müller, S.; Behrends, T.; van Genuchten, C.M. Sustaining efficient production of aqueous iron during repeated operation of Fe (0)-electrocoagulation. Water Res. 2019, 155, 455–464. [Google Scholar] [CrossRef]
- Weiss, S.F.; Christensen, M.L.; Jørgensen, M.K. Mechanisms behind pH changes during electrocoagulation. AIChE J. 2021, 67, e17384. [Google Scholar] [CrossRef]
- Benjamin, M.M. Water Chemistry; Waveland Press: Long Grove, IL, USA, 2014; ISBN 1478627018. [Google Scholar]
- Davies, S.H.R.; Morgan, J.J. Manganese(II) oxidation kinetics on metal oxide surfaces. J. Colloid Interface Sci. 1989, 129, 63–77. [Google Scholar] [CrossRef]
- Van Genuchten, C.M.; Peña, J. Mn(II) Oxidation in Fenton and Fenton Type Systems: Identification of Reaction Efficiency and Reaction Products. Environ. Sci. Technol. 2017, 51, 2982–2991. [Google Scholar] [CrossRef]
- Funes, A.; De Vicente, J.; Cruz-Pizarro, L.; De Vicente, I. The influence of pH on manganese removal by magnetic microparticles in solution. Water Res. 2014, 53, 110–122. [Google Scholar] [CrossRef]
- Opitz, J.; Alte, M.; Bauer, M.; Peiffer, S. Quantifying iron removal efficiency of a passive mine water treatment system using turbidity as a proxy for (particulate) iron. Appl. Geochem. 2020, 122, 104731. [Google Scholar] [CrossRef]


| Category | Item | Total (in USD) |
|---|---|---|
| Electrical | Power Supplies | 3010.00 |
| Electrical | Power Strips, Electrical Wires, and Air Conditioning Units | 745.00 |
| Plumbing | Hoses, CPVC Piping and Fittings, Flow Meters, and Check Valves | 1368.64 |
| Plumbing | Submersible Pumps | 392.00 |
| Structure | Supports for ACAIE Reactors, Flocculation, and Storage Tanks | 110.00 |
| Treatment | Treated Water Storage Tank | 4000.00 |
| Treatment | Flocculation Tank, Holding Tank, Post-electrolysis Tank, and Settling Tanks | 657.00 |
| Treatment | In-line Static Mixer and Dosing Pump | 456.52 |
| Treatment | Sand Filter, Micron Filters, and Filter Housing | 2937.22 |
| Treatment | ACAIE Reactors | 425.00 |
| USD 14,101.38 |
| Item | Cost (USD) | Unit | Count | USD/year |
|---|---|---|---|---|
| Iron anodes | 37 | USD/plate | 60 | 2220 |
| Air Cathodes | 100 | USD/cathode | 20 | 2000 |
| Electricity | 0.20 | USD/kWh | 7200 | 1440 |
| Aluminum sulfate | 2.0 | USD/kg Al2(SO4)3 | 46 | 90 |
| Variable annual cost | 5750 |
Disclaimer/Publisher’s Note: The statements, opinions and data contained in all publications are solely those of the individual author(s) and contributor(s) and not of MDPI and/or the editor(s). MDPI and/or the editor(s) disclaim responsibility for any injury to people or property resulting from any ideas, methods, instructions or products referred to in the content. |
© 2025 by the authors. Licensee MDPI, Basel, Switzerland. This article is an open access article distributed under the terms and conditions of the Creative Commons Attribution (CC BY) license (https://creativecommons.org/licenses/by/4.0/).
Share and Cite
Bandaru, S.R.S.; Smesrud, L.; Majmudar, J.; Hernandez, D.; Wickliff, P.; Tseng, W.; Gadgil, A. Field Testing of an Affordable Zero-Liquid-Discharge Arsenic-Removal Technology for a Small-Community Drinking Water System in Rural California. Water 2025, 17, 374. https://doi.org/10.3390/w17030374
Bandaru SRS, Smesrud L, Majmudar J, Hernandez D, Wickliff P, Tseng W, Gadgil A. Field Testing of an Affordable Zero-Liquid-Discharge Arsenic-Removal Technology for a Small-Community Drinking Water System in Rural California. Water. 2025; 17(3):374. https://doi.org/10.3390/w17030374
Chicago/Turabian StyleBandaru, Siva R. S., Logan Smesrud, Jay Majmudar, Dana Hernandez, Paris Wickliff, Winston Tseng, and Ashok Gadgil. 2025. "Field Testing of an Affordable Zero-Liquid-Discharge Arsenic-Removal Technology for a Small-Community Drinking Water System in Rural California" Water 17, no. 3: 374. https://doi.org/10.3390/w17030374
APA StyleBandaru, S. R. S., Smesrud, L., Majmudar, J., Hernandez, D., Wickliff, P., Tseng, W., & Gadgil, A. (2025). Field Testing of an Affordable Zero-Liquid-Discharge Arsenic-Removal Technology for a Small-Community Drinking Water System in Rural California. Water, 17(3), 374. https://doi.org/10.3390/w17030374