Article

Spatiotemporal Drought Analysis Using the Composite Drought Index (CDI) over Dobrogea, Romania

1
Faculty of Mathematics and Informatics, Ovidius University of Constanta, 900527 Constanta, Romania
2
Civil Engineering Faculty, Transilvania University of Brasov, 500036 Brasov, Romania
*
Author to whom correspondence should be addressed.
Water 2025, 17(4), 481; https://doi.org/10.3390/w17040481
Submission received: 30 December 2024 / Revised: 30 January 2025 / Accepted: 1 February 2025 / Published: 8 February 2025

Abstract

:
This paper discusses a study that examined the severity of droughts and their changes in the Dobrogea region in southeastern Romania between 2001 and 2021 and develops a high-resolution (1 km) Composite Drought Index (CDI) dataset. To explore the effectiveness of the index, we carried out a correlation analysis between the CDI, the Standardized Precipitation Index (SPI), and the Standardized Precipitation Evapotranspiration Index (SPEI), which shows a strong positive relationship among these indices. Analysis of the CDI time series reveals an increase in drought frequency for the study period, due to high temperature and below-normal rainfall. Most parts of the region were affected by moderate, severe, or extreme droughts, except for the years 2002–2005 and 2013. The worst drought events were in 2011, 2012, and 2020, when the region was under severe land surface temperature stress, with values up to 39.13 °C. The central and northern areas of the region had the longest period of drought, at 22 months, which started in 2018 and culminated in 2020 when extreme drought covered over 70% of the region. Another major event was in 2015 when 95% of the region experienced severe drought. These results show the potential of the CDI as one of the significant indices in the assessment of drought and provide useful insights into drought monitoring in the future. More than that, we consider that the GPM IMERG satellite product can be used in the implementation of Drought Management Plans in Dobrogea in order to calculate drought indices derived from remote sensing data.

1. Introduction

Drought is a prevalent natural calamity that has a substantial impact on human life, the environment, and agricultural productivity. According to an investigation launched by the World Meteorological Organization (WMO), the economic impact of drought in Europe over the past 30 years has been around EUR 30 to 100 billion [1,2,3]. The escalating frequency and intensity of global drought events, intensified by climate change, necessitates a re-evaluation of current drought management strategies. Facing such challenges and realizing the importance of prognosis for the upcoming period, the Communication “Addressing the challenge of water scarcity and droughts” was adopted by the European Commission in 2007 [4]. As part of the Water Blueprint, which was agreed earlier in November 2012, the European Commission was asked by the Environmental Council to evaluate and develop the “European policy concerning the water scarcity and drought”, which ended in November 2012 [5,6]. The EU Commission suggested including drought risk management in future RBMPs (River Basin Management Plans) beginning in 2013, acknowledging the little progress made in putting the 2007 instrument into practice. In this regard, the Integrated Drought Management Programme (IDMP) was initiated in 2013 by the World Meteorological Organization (WMO) and the Global Water Partnership (GWP). An examination of drought in the Central and East European (CEE) region and its inclusion in the initial RBMPs revealed that the region under investigation had a very poor Drought Management Plan (DMP) development [7]. The fifth report on the implementation of the Water Framework Directive (WFD) and the Floods Directive was released by the EU Commission in 2019. Among the suggestions it made to the Member States was the third RBMP, which was scheduled for adoption by the end of 2021. It should better address climate change’s effects on water availability, as well as make greater use of DMPs.
According to the United Nations Office for Disaster Risk Reduction (UNDRR) [8], drought as a natural hazard is a hydrometeorological hazard. From an operational point of view, in 1997, the American Meteorological Society [9] classified the definitions into four categories: hydrological, agricultural, meteorological, and socio-economic. For each of them, there are numerous indices. In 2023, more than 150 indices were used in drought analysis [10], and approximately half of them were investigated [11]. A manual of indices was realized by the WMO and GWP in 2016 [12]. The PDSI—Palmer Drought Severity Index introduced in [13] may be the easiest to use. Calculated using a water budget and on homogeneous soil regions, PDSI is recommended for use only in the USA [9]. At the same time, this index is not the best solution for use in arid and subhumid climates. To eliminate these disadvantages, Mc Kee introduced the SPI—Standardized Precipitation Index [14]. Using the Gamma distribution function applied to a long series of observed rainfall, followed by normalization, this index has the following advantages: it requires fewer data, helps determine the severity of drought, and offers early warning of it. However, this index does not take into consideration other climate parameters. To overcome this disadvantage, Vicente-Serrano proposed a new index, the SPEI—Standardized Precipitation Evapotranspiration Index [15], which followed the identical algorithm as the SPI, but added temperature and based its computation on the water deficit (difference between precipitation and potential evapotranspiration). Due to the large number of drought characterization indices and the generation of new ones, participants in the 2009 Inter-regional Workshop on Drought Early Warning Systems in Lincoln, Nebraska, USA, recognized that no single drought index fits every scenario. Additionally, they concluded that the SPI should be used to describe worldwide meteorological dryness [16].
Drought can be assessed through drought indices using meteorological stations or remote sensing (RS)-based datasets. With the advent of satellite imagery and RS, a new class of drought indices can be developed since the new technique provides real-time information, with precision from a few hundred meters to a few kilometers. The importance of RS technologies in real-time or near-real-time drought monitoring has been emphasized in recent decades of research, underlining their critical role in providing timely and accurate data for drought management [17]. RS-based drought indices can be classified into several groups. First, there are indices used for monitoring soil water content (e.g., Normalized Multiband Drought Index—NMDI); next, the indices specifically designed to capture changes in vegetation associated with drought stress (e.g., Normalized Difference Vegetation Index—NDVI, Normalized Difference Drought Index—NDDI, Leaf Area Index—LAI). The indices within the third group allow for estimating soil moisture using surface and crop temperature (e.g., Crop Water Stress Index—CWSI). Indicators based on the land surface’s thermal stress are part of a different category (e.g., Temperature Condition Index—TCI). While no single indicator can definitively predict droughts, several factors and indicators can be considered together to assess the risk, especially since several types of droughts can occur simultaneously in an area. Therefore, several other indices were developed based on the NDVI-LST (Land Surface Temperature) relationship, which, in general, expresses a negative correlation (e.g., Vegetation Health Index—VHI, Drought Severity Index—DSI). The latest techniques used to develop remote sensing drought indices are due to advancements in microwave sensors, which allow for the assessment of global climate parameters as a substitute to ground measurements, such as rainfall (e.g., Climate Hazards Group InfraRed Precipitation with Station data—CHIRPS). Thus, NDVI, LST, and satellite rainfall data have been used to create a new generation of remote sensing indices (e.g., Scaled Drought Condition Index—SDCI). To provide an overall assessment of ecological drought conditions across various ecosystems, composite indices, like the Combined Drought Indicator (CDI) [18], have been developed by mixing various drought indices and data sources, such as precipitation, soil moisture, and vegetation indices. In its original solution, the CDI uses the SPI, Soil Moisture Anomaly (SMA), and fAPAR Anomaly (“fraction of incident solar radiation that is absorbed by land vegetation for photosynthesis”). The SPI is calculated based on daily or monthly precipitation registered to meteorological stations, SMA values are based on hydrological models, and fAPAR is a satellite-derived product. This index is used currently by Copernicus European Drought Observation (EDO) to estimate agricultural drought over Europe [18]. The spatial resolution is 5 km, and the temporal resolution is 10 days.
Romania is situated in the Central Southeastern part of the EU. The Romanian climate is temperate continental with different influences (e.g., the Atlantic in the western part and the Black Sea in the southeastern part of Romania). Mountains, hills, and plains are organized concentrically in tiers that make up our country’s landscape. Approximately 30% of Romania’s land area is considered desertified, having a climate that is arid, semiarid, or subhumid–dry [19]. The most impacted areas of Romania are in the south, southeast, and eastern parts, where the precipitation’s multiannual rate is 600 mm or less (the multiannual precipitation in the Dobrogea region is approximately 400 mm) and the temperature is increasing [20]. In recent works, the authors note a temperature increase from 0.3 °C [20] to 0.8 °C [21], and even 1.7 °C after 1997 [22]. As we mentioned in the previous paragraphs, even if the EU Commission strongly recommends introducing the DMP in the RBMPs, Romania, like other countries in the Eastern European area, failed to achieve this. Therefore, in 2015, the GWP for Central and Eastern Europe (GWPCEE) published a set of guidelines for developing DMPs. Additional documents were also released, e.g., the Handbook of Drought Indicators and Indices [8]. The important sub-steps in developing a DMP are (i) quantifying the effects of drought and identifying and assessing drought conditions and (ii) establishing a set of indicators appropriate for different types of droughts. The most important sub-step is to set the best appropriate drought index. To achieve this, important studies must be carried out in different areas, and, in Romania, different indices were tested in different regions [2,23,24,25,26,27]. Most studies use the SPI or de Martonne as a drought index. Hydrological drought is investigated using a comparison between precipitation and river discharge [27], analysis of low flow characteristics [28], or using the Standardized Flow Index (similar to the SPI) [22]. In recent work [29], the authors tested the “Synthetic Drought Hydrograph” to detect parameters related to hydrological drought characteristics.
As shown, the SPI requires a minimum 30-year precipitation dataset, which is not usually available. Moreover, not all regions have enough meteorological stations to provide the necessary data. Dobrogea is in this situation, with only 10 meteorological stations managed by the National Meteorological Administration. To overcome this disadvantage, indices derived from satellite data can be used.
Remote sensing data were used in Romania for different purposes such as the investigation of forest changes [30,31], to determine heat islands in Bucharest and other regions [32], and to estimate the risk of desertification in the southeastern part of Romania [33]. Recently, Angearu et al. [34] examined the DSI (Drought Severity Index) in Baragan Plain. For the areas located in the southeast part of Europe (including Romania), few bibliographic resources demonstrate the importance of satellite data for drought research [35]. Using the SPEI and NDVI, the relationship between drought occurrences and vegetative stress in Romania and the Republic of Moldova from 1998 to 2014 was investigated in [36]. The study focused on the growing season (April to October) and on the severe drought event of 2000–2001. The study in [37] analyzed the drought at the country level (including Dobrogea) during the period 1901–2021, using the SPEI. The results indicated an increased frequency and duration of moderate, severe, and extreme drought events over the last 120 years. Using the NDDI and fAPAR, spanning the years 2000–2015, the authors of [38] analyzed the severity and degree of drought in Dobrogea. The results showed that the whole region experienced a type of drought during this period, which affected agricultural areas more than the semi-natural areas or forests.
This paper’s major goal is to use high-resolution (1 km) and long-term (2001–2021) datasets to evaluate the performance of a Composite Drought Index (CDI) over the Dobrogea region. To compute the CDI, we used the algorithm proposed by Abdourahamane et al. [39]. The specific objectives are (i) to evaluate the performance of two global rainfall products (CHIRPS and GPM IMERG), used in the computation of the CDI to replace the precipitation measurements from meteorological stations; (ii) to estimate the NDVI and LST to calculate the CDI; (iii) to perform a complex correlation analysis between the CDI, SPI, and SPEI, and (iv) to carry out a spatiotemporal analysis of the CDI during the dry season in Dobrogea.

2. Materials and Methods
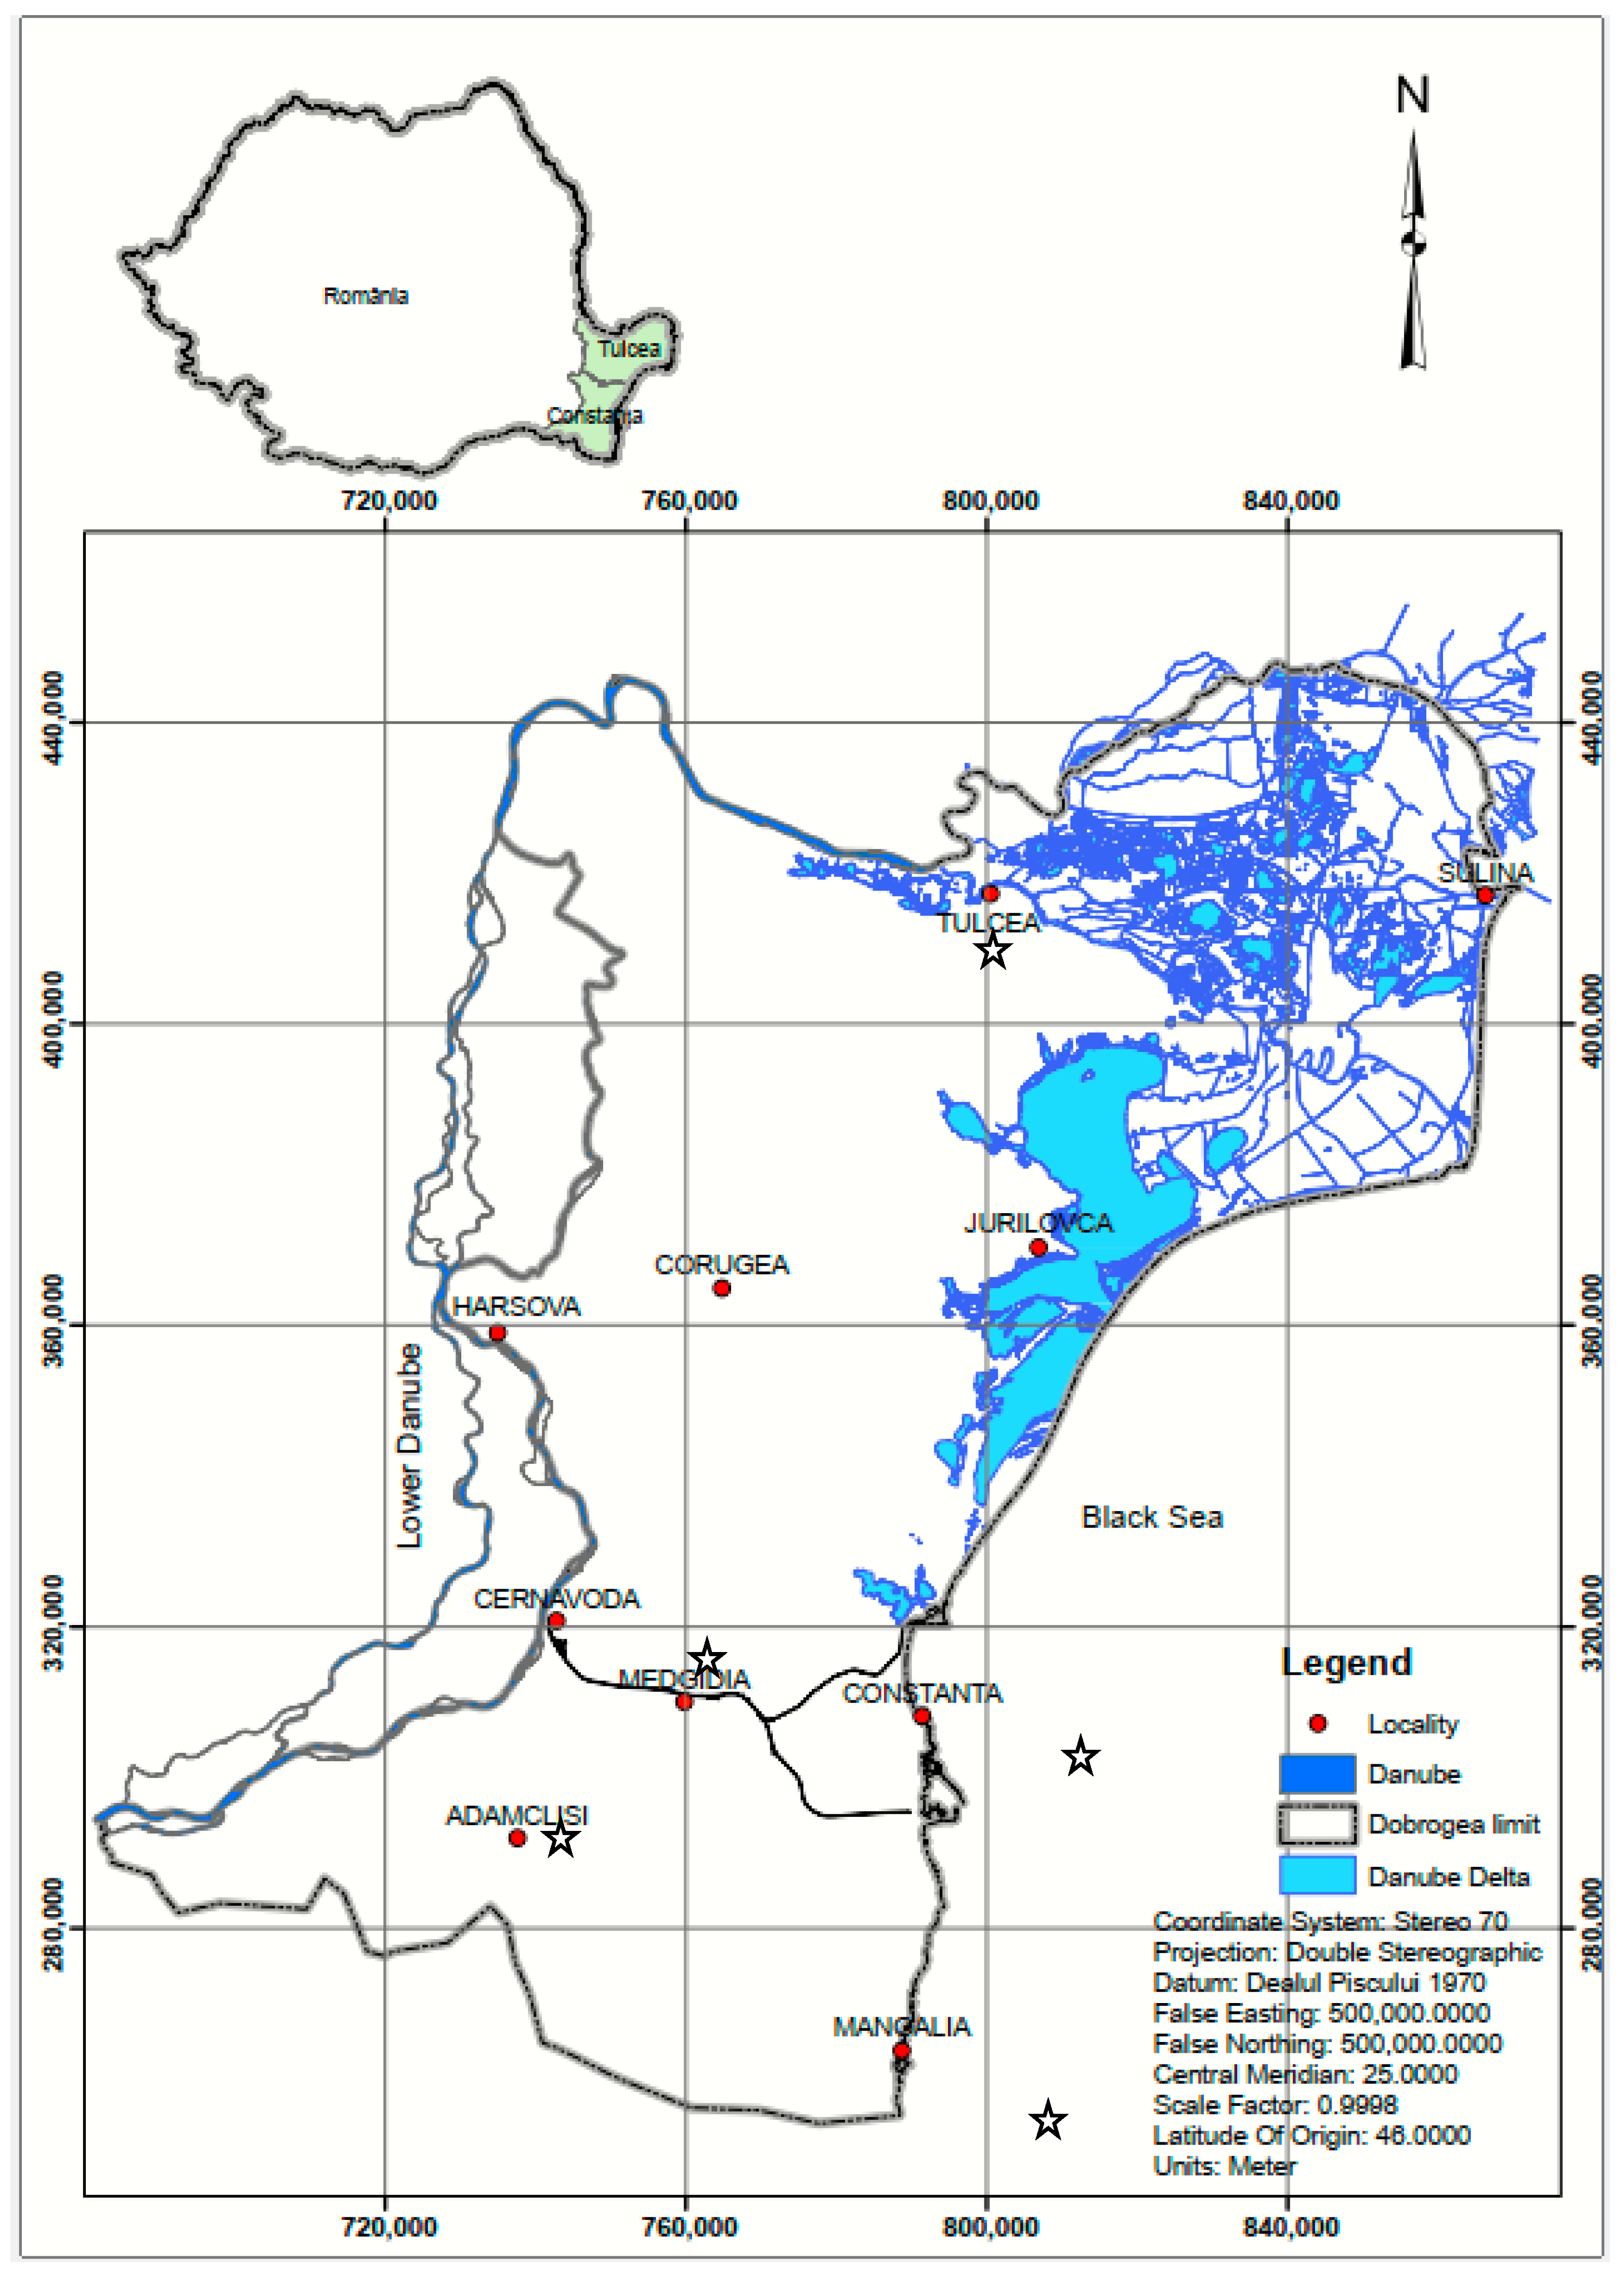
As was explained in the previous section, the WMO recommends using the SPI to estimate drought. Since ground measurements are not always available, we decided to use the CDI, which is one of the indices derived solely from RS data. The main disadvantage of the SPI is that it does not consider other climatic parameters besides precipitation, such as temperature. Unlike the SPI, the SPEI employs both precipitation and temperature. As the CDI is built on temperature and the NDVI, we decided to use the SPEI as well to inspect the reliability of the seasonal CDI.
The following diagram provides a description of the methodology that was proposed in this research (Figure 1).
The current study was carried out in the Dobrogea region (see Section 2.1); we used MODIS and global gridded precipitation products (GPM IMERG and CHIRPS) to extract LST, NDVI (see Section 2.2.1), and precipitation (see Section 2.2.2) data, respectively. Precipitation data measured at several meteorological stations (Section 2.2.4) in the Dobrogea region (Figure 2), provided by the National Agency of Meteorology, were used to verify the reliability of satellite precipitation. Then, monthly and seasonal (July to September) drought indices (CDI, SPI, and SPEI) were estimated for 20 years. For the SPI and SPEI, we computed two variants, derived from (a) satellite rainfall products and (b) ground measurements of precipitation and temperature, which were then used to examine the reliability of the CDI in different years.

2.1. Study Area

The approach illustrated in Figure 1 was implemented in the Dobrogea region. This region is located in the southeast of Romania and is bordered by the lower Danube to the west and north, the Black Sea to the east (Figure 2), and Bulgaria to the south.
The Romanian coastline stretches 275 km, dominated by the Danube Delta and the coastal lakes. The Danube Delta is situated in the northeastern part of Dobrogea, a unique ecosystem introduced in the UNESCO Word Heritage List (December 1991) after the area was recognized as a Biosphere Reserve (in September 1991). Dobrogea also benefits from the most varied relief, which rises from the Danube and the coast inland (467 m—Greci—Macin Mountain). The Macin Mountains, located in the National Park in the north of Dobrogea, represent the oldest geological structure in Romania, developed during the Hercynian orogeny. Hydrologically speaking, in Dobrogea, there are 2 large catchments, one of which is a tributary of the Danube River, and the other is connected to the Black Sea (the littoral basin) via a network of lakes along the coast. The two river basins include several small river systems, with low average flows (below 0.7 m3/s). Coastal lakes are divided into two parts: the North Unit (Danube Delta and Razim–Sinoe Lake) and the South Unit (the littoral). Generally, the lakes are used for fisheries (4 lakes from the Danube Delta and 6 lakes from the South Unit), leisure, and therapeutic activity (e.g., Techirghiol Lake). Some of these lakes are hypersaline (Techirghiol Lake) and/or brackish. The main characteristic of Razim–Sinoe Lake is (or rather was) the existence of “gates” that connected it to the Black Sea, which contributed to maintaining a unique ecosystem and a balanced water budget. The temperate climate, the water with low salinity, and the orientation of the beach to the east create excellent conditions for tourism; so, today, the coast is considered the Romanian Riviera due to investments in tourist infrastructure. The climate of Dobrogea is temperate, influenced by the Black Sea, the precipitation is under 450 mm/year, and the average temperature is around 11–12 °C [40,41]. According to [42,43], these weather features increase the risk of drought, all the more so as Dobrogea represents one of the Romanian regions most impacted by global warming [44,45].
Dobrogea (Scythia Minor in antiquity) has been an inhabited territory for over 2000 years; it still preserves the vestiges of the Greek colonies Histria, Callatis, and Tomis, and also the architectural monument, Tropaeum Traiani, built by the emperor Traian to mark the victory against the Dacians (104–106 AD). Due to the geographical particularities and the great potential of history, the Dobrogea region’s economy is based on tourism (including therapeutic tourism), fisheries, industry (especially energy and electricity), transportation (fluvial and maritime), and agriculture [39].
From hydraulic works used to improve fisheries in the Danube Delta, lakes, and canals to major landscape transformations, the territory of Dobrogea has been subject to major anthropogenic influences. With a total surface area of 15,485 m2 (including the Danube Delta), more than 80% of Dobrogea is used for agriculture. In 1850, the agronomic researcher Ion Ionescu de la Brad stated that “the plants suffer more of water than nourishment”. To improve the situation, in the 1945–1947 period, about 116,000 hectares of Dobrogea land were planned to be planted with wind-break forest protection. Unfortunately, only 3800 hectares were successfully planted and, after 10 years, massive deforestation was undertaken to increase the agricultural territory [46]. In the early 1970s, an extensive irrigation system was built to improve the conditions for agricultural development. It operated at full capacity until 1989 when the irrigated area had reached 581,500 hectares. After 1989, the irrigation capacity decreased enormously (under 20,000 hectares) as a result of the government policy of the 1990s, followed by abandonment and destruction of the irrigation infrastructure [46]. Nowadays, the drought phenomenon is a reality in the Dobrogea region [2,3,22,46,47,48,49] and a major risk to diminish part of natural resources such as lakes and the production of fisheries, agriculture, and electricity.

2.2. Datasets

The datasets for this research study were selected between January 2001 and December 2021, this being the period in which both types of satellite rainfall data, CHIRPS and GPM IMERG, are available (see Section 2.2.2). The effectiveness of satellite-based drought and precipitation indices was assessed using meteorological observations from ground stations. We focused our study on the dry season (July–September) [50] due to the low precipitation rates, which have a significant impact on drought in the Dobrogea area.
There are 10 main meteorological stations (Figure 2) in Dobrogea, administered by the National Administration of Meteorology (NAM), and they are grouped as follows: 4 on the Black Sea coast (Mangalia, Constanta, Jurilovca, and Sulina), 3 on the Danube banks (Cernavoda, Harsova, and Tulcea), and 3 inland (Adamclisi, Medgidia, and Corugea). For these stations, the NAM provided data starting from 1965 to 2021. There are other stations (such as Sf Gheorghe and Chilia), but they were set up later, and their data series does not cover the period mentioned above. However, it should be noted that Sulina station is located on a dam that extends 13 km into the sea. It is practically surrounded by water (the Danube and the Black Sea); therefore, we discarded this station for our study since the NDVI values are negative. The same situation can be found at Jurilovca weather station, which is located in the proximity of Razim–Sinoe Lake. Ultimately, for our study, we chose 5 stations out of 10 (Table 1) because, after a detailed analysis of all station datasets, we observed that some stations did not have the complete data series for the analyzed period (2001–2021). The stations selected cover all the areas mentioned above: 2 on the seacoast, 1 on the Danube banks, and 2 inland.
Table 1. Selected meteorological stations across Dobrogea.
Station UsedLongitude/Latitude
Constanta28.64/44.21
Tulcea28.82/45.19
Medgidia28.25/44.24
Mangalia28.58/43.82
Adamclisi27.96/44.09

2.2.1. NDVI and LST Datasets

The present study used MODIS satellite imagery to retrieve the data needed for further computations. Having a more frequent repeat cycle (1–2 days) than Landsat and high spatial resolutions (250 m, 500 m, and 1000 m), MODIS data are well-suited for large-scale drought monitoring. We resorted to the MOD21A1D.061 Terra product with 1000 m resolution to acquire daily LST, which was estimated as an average from all observations that were cloud-free and had good LST&Emissivity accuracy. The MOD13A2.061 Terra product, with a 1000 m spatial resolution, provided the vegetation index NDVI, its values being composited using the finest valid pixel value (low view angle, low clouds, the highest NDVI value) from the whole of the acquisitions within a 16-day interval. These NDVI and LST products can be used on the Google Earth Engine (GEE) platform [51].
NDVI values vary from +1.0 to −1.0. Here, we computed the average values to establish the monthly and seasonal (July to September) NDVI and LST for the 2001–2021 period (datasets named NDVI-1, LST-1 and NDVI-3, LST-3, respectively).

2.2.2. Precipitation Datasets

Two high-resolution satellite precipitation products were utilized—GPM IMERG and CHIRPS—in order to rate their accuracy against data from ground stations and then select the one with the best performance.
Climate Hazards Group InfraRed Precipitation with Station data (CHIRPS) is a daily gridded precipitation dataset [52] that provides high-resolution (0.05°), quasi-global (50° S–50° N) satellite, and observation-based precipitation data, over land, from 1981 to up until now. This consistent, long time series dataset is extremely useful in trend investigation and drought monitoring. The daily CHIRPS data (CHIRPS v.2.0 Final, Dataset Availability: 1 January 1981–1 January 2024) can be obtained from the GEE platform.
Global Precipitation Measurement (GPM) was launched in 2014 by NASA and JAXA, while Integrated Multi-Satellite Retrievals for GPM (GPM IMERG) is a precipitation algorithm developed by NASA that uses inter-calibrated estimates from the GPM constellation of precipitation-related satellites and other data (such as precipitation gauge analyses) to create a long (20+ years), global-scale, high-temporal (30 min) and high-spatial (0.1°) resolution satellite-based precipitation dataset. In this study, monthly GPM IMERG images were employed, spanning two decades (2001–2021), provided by GPM: Monthly Global Precipitation Measurement (GPM) vRelease 07 (Dataset Availability: 1 June 2000–17 January 2025), which is available on the GEE platform.
In the present study, to make all satellite datasets consistent, the CHIRPS and GPM IMERG images were spatially resampled to 1 km × 1 km (the spatial resolution of MODIS LST and NDVI products) using the bicubic method. Also, the daily CHIRPS and monthly GPM IMERG precipitation data were organized in monthly and seasonal data (July–September) by the arithmetic mean (datasets named CHIRPS-1, CHIRPS-3, IMERG-1, and IMERG-3, respectively), for a time span ranging from 2001 to 2021.

2.2.3. SPEI Dataset

The SPEI is an important drought indicator that uses precipitation and evapotranspiration data [15], thus being able to assess the end results of temperature increase on water demand. In the context of global warming, the SPEI enables monitoring and analysis of distinct drought types. The Global SPEI database offers information about drought conditions at a global scale, with a spatial resolution of 0.5°, a monthly temporal resolution, and 1- to 48-month timescales. The computation of the SPEI is based on the FAO Penman–Monteith estimation of potential evapotranspiration, which is considered a better method than the Thornthwaite PET one; this is why the SPEIbase is appropriate for most short-, medium-, or long-term analyses. In our study, we used the SPEI on a 3-month timescale (dataset named SPEI-3) for the dry season of the 2001–2021 period, after first spatially resampling the satellite images to 1 km × 1 km using the bicubic method. The SPEIbase Standardized Precipitation Evapotranspiration Index database, Version 2.9 is available through the GEE platform.

2.2.4. Ground Stations Datasets

As mentioned in Section 2.2, there is a limited number of meteorological stations across Dobrogea, and many of them have large gaps in the time series, which makes them unsuitable for further analysis. Hence, for the study period (2001–2021), the first step in the selection of ground stations was to ensure no data gaps in the time series of monthly precipitation. As a result of this selection criteria, 5 stations were retained (Figure 2 and Table 1), and their monthly precipitation time series were adopted for validation. The calculation of the in situ SPEI requires temperature value as well; therefore, another condition placed on the ground data was to have no gaps in the temperature dataset. As a result, of the 5 stations with complete precipitation datasets, 3 stations (Constanta, Tulcea, and Mangalia), with full precipitation and temperature datasets, were selected to be used in the in situ SPEI calculation.

2.3. Methods

2.3.1. Composite Drought Index (CDI)

The Composite Drought Index proposed in [39] was used in this study to understand the relationship between rainfall, temperature, and vegetation in the monitoring and evaluation of agricultural drought in Dobrogea area. Therefore, the satellite rainfall data, the MODIS NDVI, and LST were all used to calculate the CDI with a method that combines entropy and weighted Euclidian distance (Equation (1))
C D I = S i S i + S i +
where S i and S i + are the weighted Euclidian distance between the current condition and MDC (Maximum Driest Condition) and MWC (Maximum Wettest Condition), respectively (Equations (2)–(4)):
S i = k E w k ( r k i M D C k ) 2
S i + = k E w k ( r k i M W C k ) 2
M D C k = { max ( r k i ) , k { L S T } ; min ( r k i ) , k { N D V I , p r e c i p i t a t i o n } } M W C k = { min ( r k i ) , k { L S T } ; max ( r k i ) , k { N D V I , p r e c i p i t a t i o n } }
r k i = x k i i = 1 m x k i
where x k i is the value of the kth input variable (LST, NDVI, and precipitation), r k i is the normalized value (Equation (5)), and i is the time index (i = 1, 2, …, m).
E w k is the entropy weight of each input variable and varies from 0 to 1 (Equation (6))
E w k = D k j = 1 k D j
where
D k = 1 e k
For each variable, the entropy measure, e k , was computed by the following equation:
e k = i = 1 m r k i ln ( r k i ) ln m
The CDI, built only with satellite data, proved to be suitable for meteorological and agricultural drought monitoring in other regions, being useful, in particular, in the identification of moderate and mild drought events, which usually are not detected by the in situ drought indicators [39].
In this study, the computation of the CDI was performed with JavaScript on GEE platform. The obtained CDI range is between 0 and 1. CDI was assessed at 1- and 3-month (seasonal: July to September) timescales (CDI-1 and CDI-3, respectively), as they reveal moisture conditions on short- and medium-term and allow for the estimation of seasonal drought.
Based on the CDI, we classified the drought severity into seven levels: extreme, critical, severe, moderate, mild, near normal, and no drought (Table 2). According to the color identifier for each level defined in this table, we generated drought spatial distribution maps.

2.3.2. Standardized Precipitation Index (SPI)

The SPI, as proposed by [14], depicts the probability of rain in a certain period of time in a region. Since 1993, the SPI has been used to a great extent in recording and estimating the aspects of various drought types (meteorological, agricultural, hydrological) for 1-, 3-, 6-, 12-month, and longer timescales [53,54,55]. Compared to other drought indices, a large number of studies have attained robust results and greater performance [56,57], leading to the SPI being endorsed by the World Meteorological Organization as a worldwide tool to monitor different kinds of drought [16].
The SPI is able to detect the outset and end of drought events, and to measure the severity of drought, using its intensity. Table 3 shows the drought severity types, based on the interpretation of SPI values [14].
This study calculated 1- and 3-month timescales of the SPI, named SPI-1 and SPI-3, respectively, to monitor meteorological drought based on precipitation anomalies from 2001 to 2021, for the Dobrogea area. The input of the JavaScript code that runs on the GEE platform was satellite daily rainfall data, which were summed up to monthly (or 3-month) precipitation data. The SPI was estimated by using the following equation:
S P I = ( P P m ) / σ
where P represents the total rainfall of a period (mm); Pm is the historical mean precipitation of the period (mm); and σ is the historical standard deviation of precipitation of the period (mm).

2.3.3. Drought Severity, Duration, Frequency, Intensity, and Probability of Occurrence

Drought features include duration, severity, intensity, frequency, and probability of occurrence. Here, we used the runs theory proposed by [58] to estimate the drought characteristics. The runs theory defines a slice of the drought index set in which every single value is lower or higher than a designated threshold (K).
Drought duration (T) is the time interval between the outset (to) and end (te) of a drought occurrence based on the CDI ( C D I 0.4 , K = 0.4). In the present study, we chose to express drought severity by the longest drought duration [59]; therefore, severity (S) was computed as the sum of Sp parameters during the longest drought duration (Equations (10) and (11))
S = t o t e S p
S p = K C D I
Drought frequency is the number of drought occurrences at a particular level within a specific period. Drought intensity (I) was obtained by dividing S by the maximum drought duration, T (Equation (12)).
I = S T
To determine the probability of occurrence, P (%), of a specific drought event, we divided the number of classified drought month occurrences, mc, by the total number of drought events taking place, mt [60] (Equation (13)).
P = m c m t × 100 %

2.3.4. Validation of High-Resolution Rainfall Products

We checked the accuracy of the satellite precipitation datasets from 2001 to 2021, at annual timescales, using data from 5 independent weather stations in Dobrogea. Ground measurements and satellite rainfall estimations were averaged for each year of the study period. We applied the “nearest method” for spatial data extraction, namely, for each satellite precipitation product, we extracted the mean precipitation value at each weather station for each year using the spatial coordinates of that station; then, we used the mean precipitation value of the grid cell in which the meteorological station resides to compare with the corresponding in situ mean precipitation value for the corresponding year. Afterward, we applied several pairwise comparison statistics methods, e.g., Pearson’s correlation coefficient (r), root mean square error (RMSE), normalized root mean square error (NRMSE), and agreement, to quantitatively validate the satellite precipitation estimates against all in situ datasets (Table 4).

2.3.5. Performance Evaluation of Satellite Precipitation Products

In the present study, the SPI, attained from satellite rainfall time series, was used to verify the reliability of the CDI in different years; therefore, we validated it with in situ SPI estimation. We used the monthly precipitation datasets from 5 weather stations in Dobrogea, from 2001 to 2021, to calculate the 1-month SPI dataset (in situ SPI-1) by using the SPIGenerator [64]. These data were used as reference data. Then, we computed two variants of the satellite-based 1-month SPI, namely, SPI-1c and SPI-1i, using the gridded data provided by the high-resolution precipitation products CHIRPS and GPM IMERG, respectively. By performing a correlation analysis between these indices and the corresponding reference data (in situ SPI-1), we were able to investigate the applicability of each global precipitation product to the computation of the CDI. The product with the best performance was selected for the computation of the Composite Drought Index considered in this study.

2.3.6. Correlation Between the SPI and CDI

To validate composite drought indices, the SPI has often been used as a benchmark [65]. We used the monthly precipitation datasets from weather stations to calculate the seasonal (July–September) SPI dataset (in situ SPI-3), from 2001 to 2021, by running the SPIGenerator. Then, we conducted a Pearson correlation analysis and comparison of scatter plots, between CDI-3 and both the satellite-based and in situ SPI-3. Afterward, we analyzed the Pearson correlation between the monthly averaged CDI-1 and satellite-based SPI-1 during the driest and wettest years of the study period. Furthermore, we expanded our analysis with the correlation between CDI-3 and satellite-based SPI-3 for years corresponding to each type of drought event established by the CDI.

2.3.7. Correlation Between the SPEI and CDI

Apart from the SPI, the CDI was also correlated with the SPEI to analyze its robustness. We used the monthly precipitation and temperature datasets from the weather stations to calculate the seasonal SPEI dataset (in situ SPEI-3), from 2001 to 2021, by running the SPEI Calculator [66]. Then, in situ and satellite-based estimates of SPEI-3 were validated against the corresponding variant of SPI-3. After that, we carried out a correlation analysis for both the in situ and satellite-based CDI-3 with the appropriate SPEI-3 index by using scatter plots and the Pearson correlation coefficient.

3. Results

3.1. Annual Precipitation Evaluation of Two High-Resolution Precipitation Products at the Regional Scale

We compared the satellite precipitation with that recorded by the weather stations through the assessment of r, RMSE, NRMSE, and agreement (Table 5). The results were derived for annual precipitation from January 2001 to December 2021.
According to statistical results, the correlation coefficient (r) took values between 0.55 and 0.95, and the greatest values of 0.95 and 0.90, were attained with GPM IMERG, followed by CHIRPS (0.85). The lowest r of 0.55 was obtained with CHIRPS at Adamclisi station.
The lowest annual RMSE, a value of 6.12, was recorded with CHIRPS, followed closely by GPM IMERG, which attained an RMSE of 6.20 for the same station, i.e., Tulcea. GPM IMERG registered the highest RMSE of 11.73 next to CHIRPS (10.73). The agreement of both precipitation products with measured values was more than 70%, denoting the high correlation between both products and ground truth.
The r values for IMERG varied from 0.70 to 0.95, with a median of 0.80, and the average agreement value was 78%. As for CHIRPS, the median correlation coefficient and agreement were 0.70 and 80%, respectively.

3.2. Correlation Between 1-Month SPI-1 and In Situ SPI-1

This study carried out a Pearson correlation analysis between SPI-1c and SPI-1i, computed with gridded data provided by CHIRPS and GPM IMERG, respectively, and in situ SPI-1, to measure the performance of the satellite data. The Pearson correlation coefficient between SPI-1c and in situ SPI took values between 0.46 and 0.85, with a median of 0.65. Regarding SPI-1i and in situ SPI, the minimum, maximum, and median values of r were 0.62, 0.87, and 0.74, respectively. The coefficient of determination (Figure 3) values were close to a best-fit correlation at both ground stations, R2 = 0.75 (p-value = 0.0001), for SPI-1i. A strong positive relationship was also observed for SPI-1c, with R2 values of 0.72 and 0.63 (p-value = 0.0001).
The statistics indicate that SPI-1i exhibited a significant positive correlation with in situ SPI-1 from 2001 to 2021. These results, along with those from the validation of high-resolution precipitation products, encouraged us to select the GPM IMERG product for further computation, as its performance was higher, indicating that is dependable for use during low rainfall conditions [67].

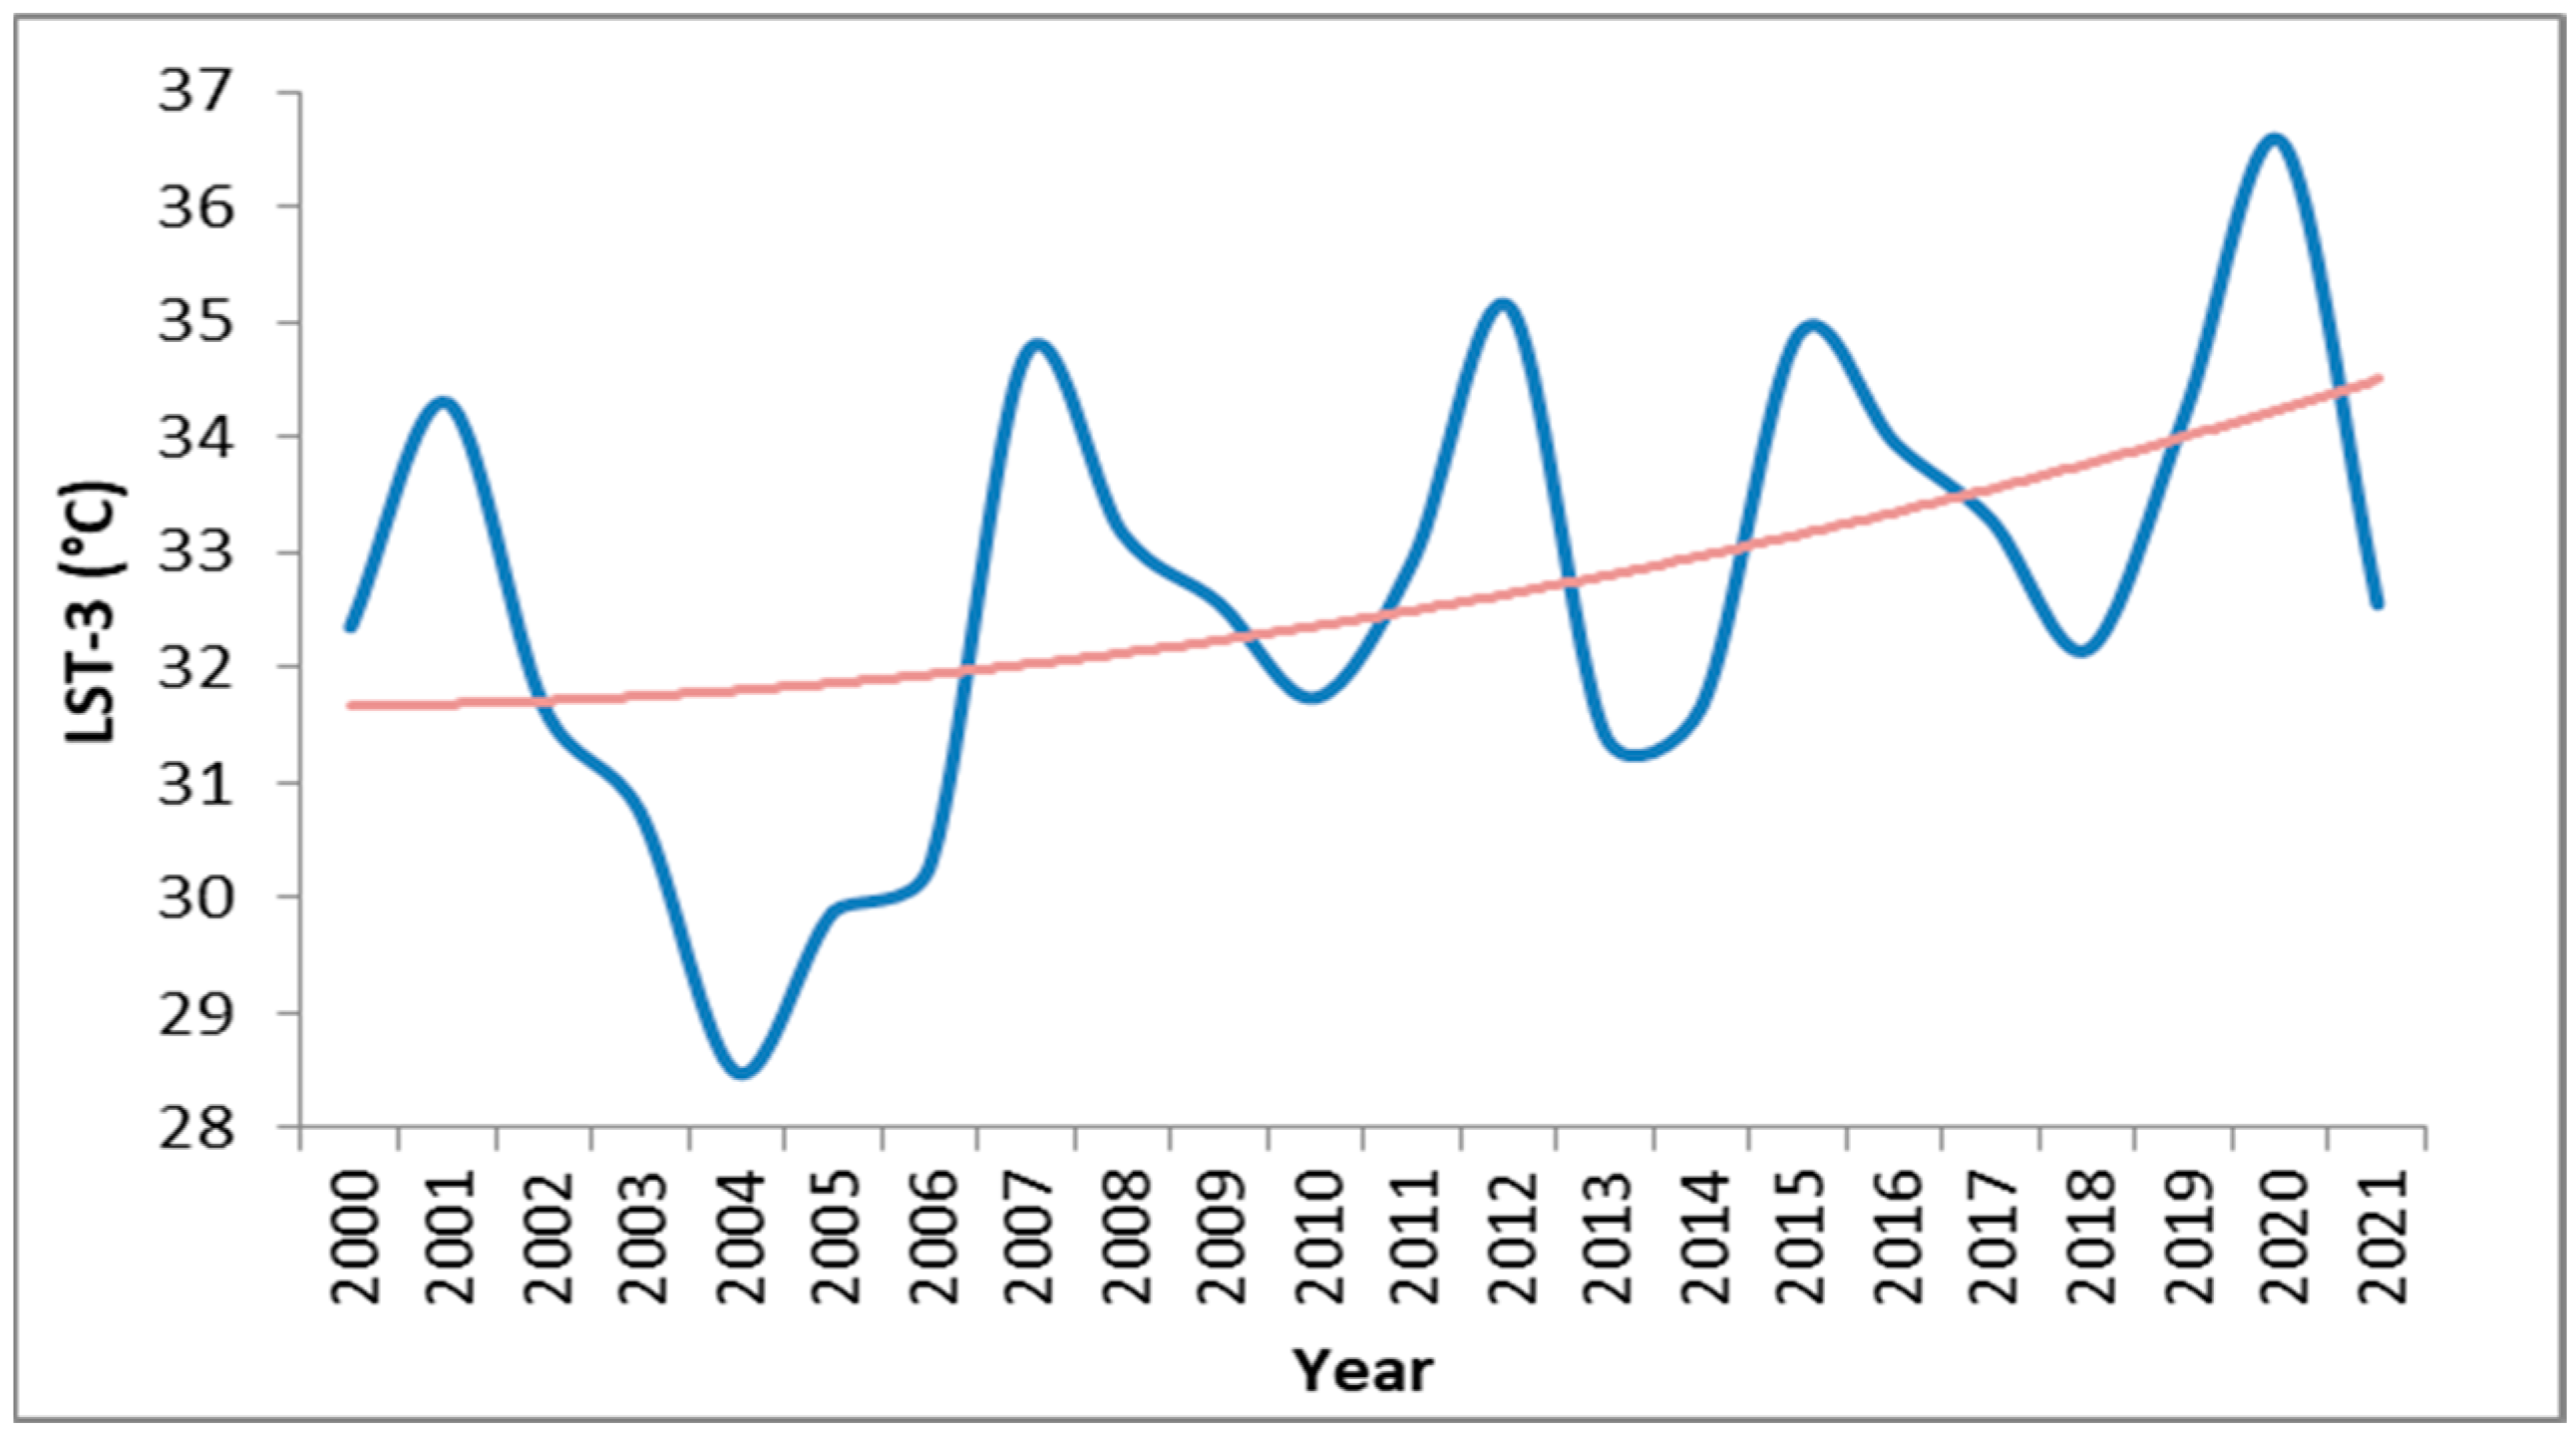
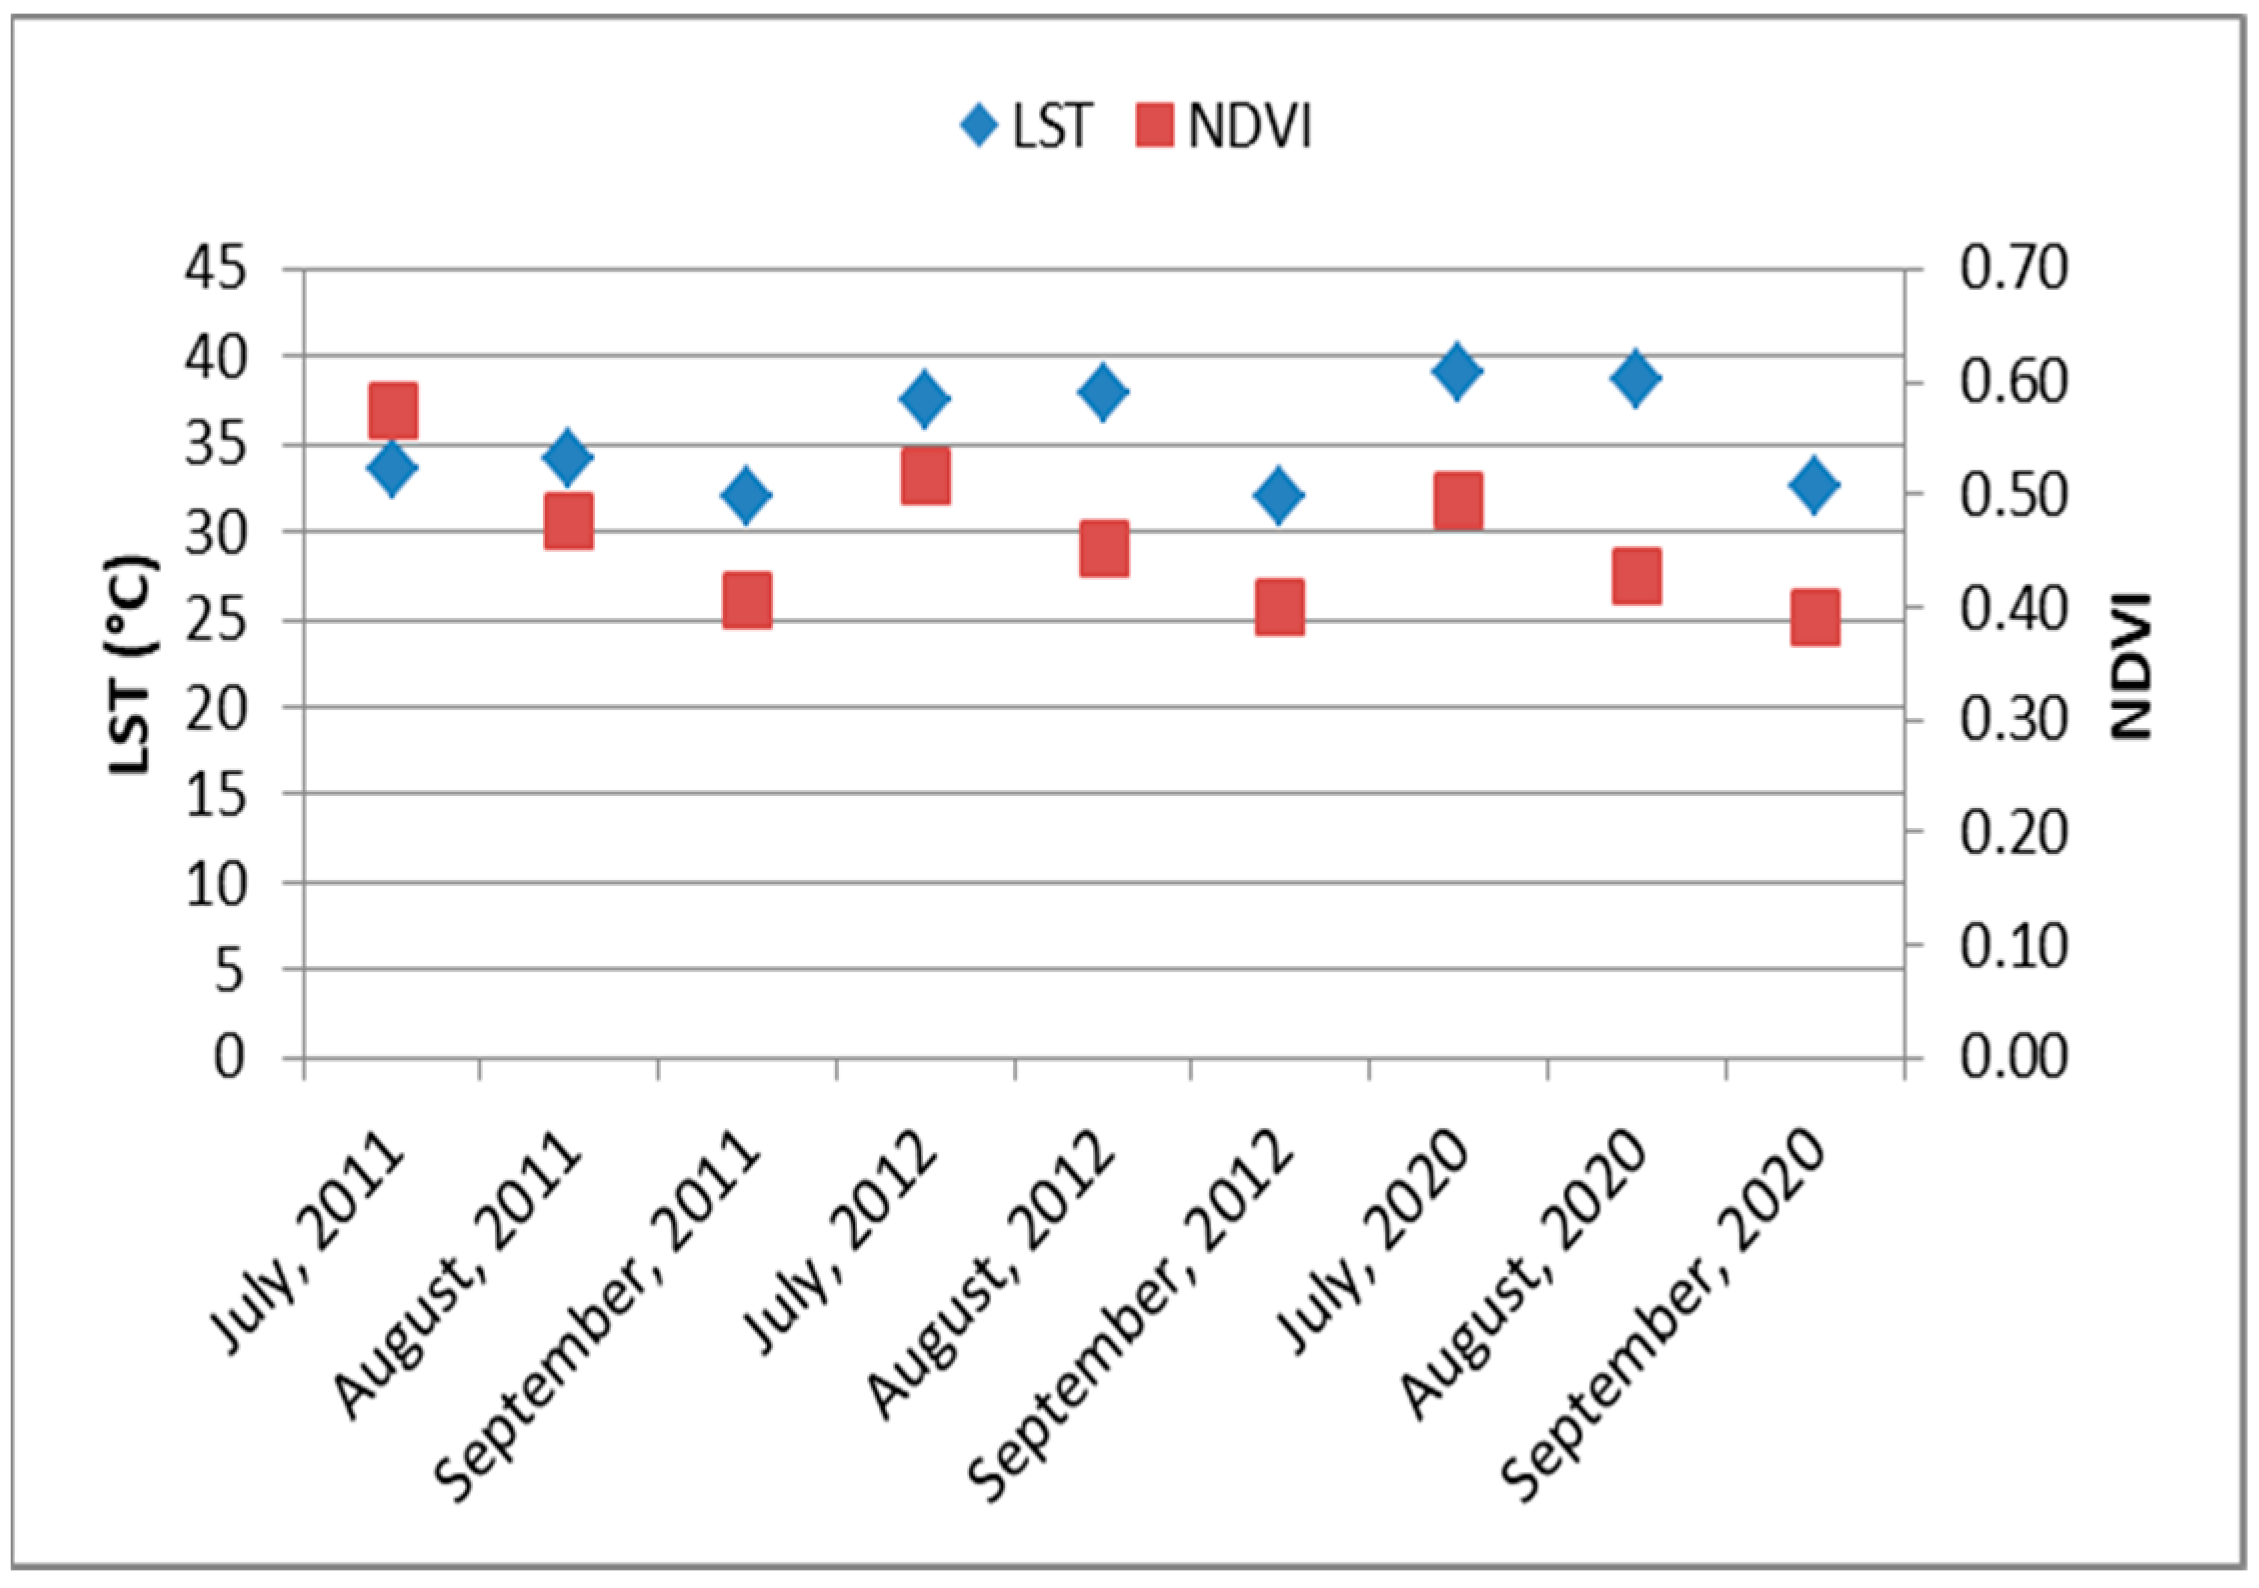
3.3. Temporal Dynamics of LST and the NDVI During the Dry Season

Generally, dry soil shows a high level of LST due to acute temperature and diminished soil moisture content. Figure 4 shows the long-term dry season mean LST over Dobrogea and reveals an ascending trend of LST during the study period, with a high average temperature of the dry season (>34 °C).
Seasonal changes in vegetation conditions over a vast region can be monitored with MODIS NDVI data [68]. Furthermore, these data can be used to identify drought phenomena due to their ability to sense soil surface moisture. The temporal analysis of mean seasonal NDVI for Dobrogea (Figure 5) shows good vegetative cover, with relatively high NDVI values (>0.43), and a descending trend for the period from 2001 to 2021. This could indicate that agricultural lands were under great stress due to high-level temperatures and irregular and below-normal rainfall.

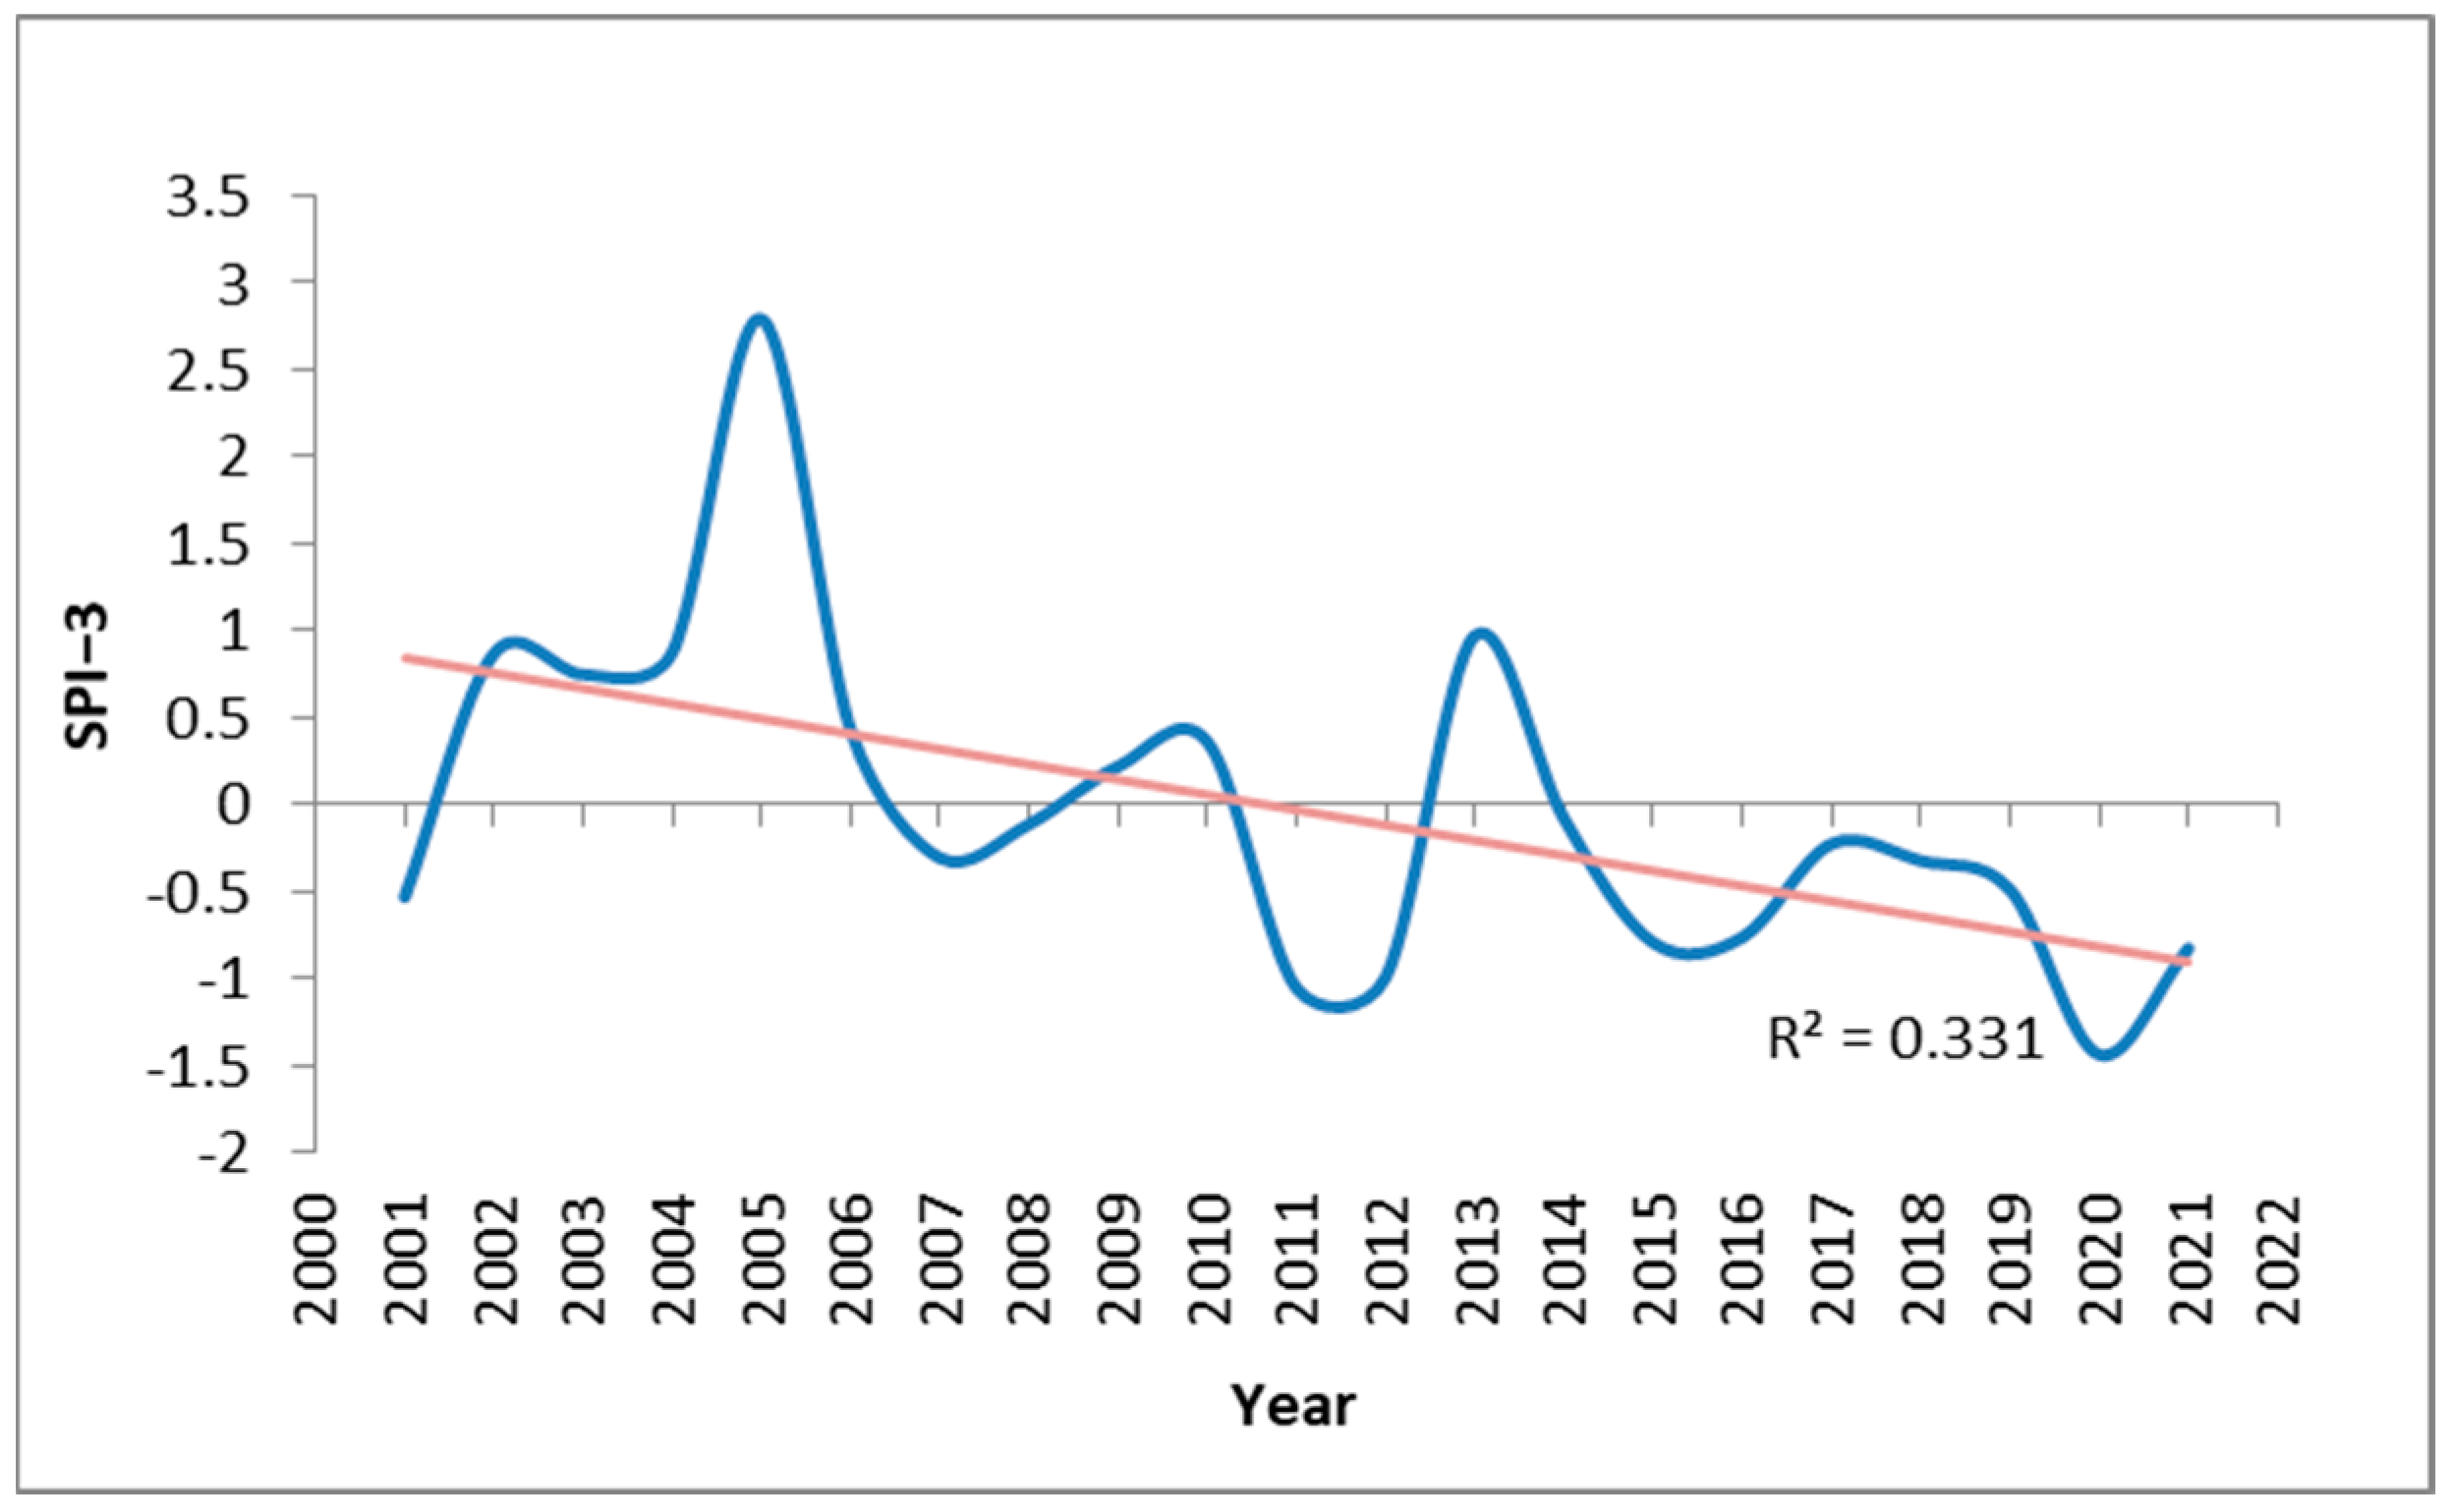
3.4. Spatiotemporal Dynamics of 3-Month SPI During the Dry Season

The spatiotemporal analysis of the seasonal (3-month) SPI for the dry season shows that drought and near-normal conditions were recurrent in most of the years of the study period. The time series of SPI-3 (Figure 6) during the 2001–2021 period had a significant downward trend (R2 = 0.33, p-value = 0.006). Thus, the Dobrogea area became less humid over the period of 2001 to 2021.
Due to the deficit rainfall in the years 2011, 2012, 2015, 2016, 2019, and 2021, different parts of Dobrogea (Figure 7) experienced severe to moderate dry conditions (−1.99 < SPI < −1). In the year 2020, a vast area of the region was exposed to severe dry conditions (−1.99 < SPI < −1.5), even extreme drought in the east (SPI < −2). During the years 2001, 2007, and 2008, moderate to severe droughts were indicated, whereas in 2017 and 2018, there were moderate to mild drought conditions in most of the area. In the year 2014, there were mild drought conditions in most parts of the zone, and near-normal to moderately wet conditions were met in 2006, 2009, 2010, and 2013. Extreme wet conditions (SPI > 2) were met only in 2005, whereas, for the rest of the period, the region experienced near-normal conditions (−0.99 to 0.99) to moderately wet conditions (1.0 to 1.49).

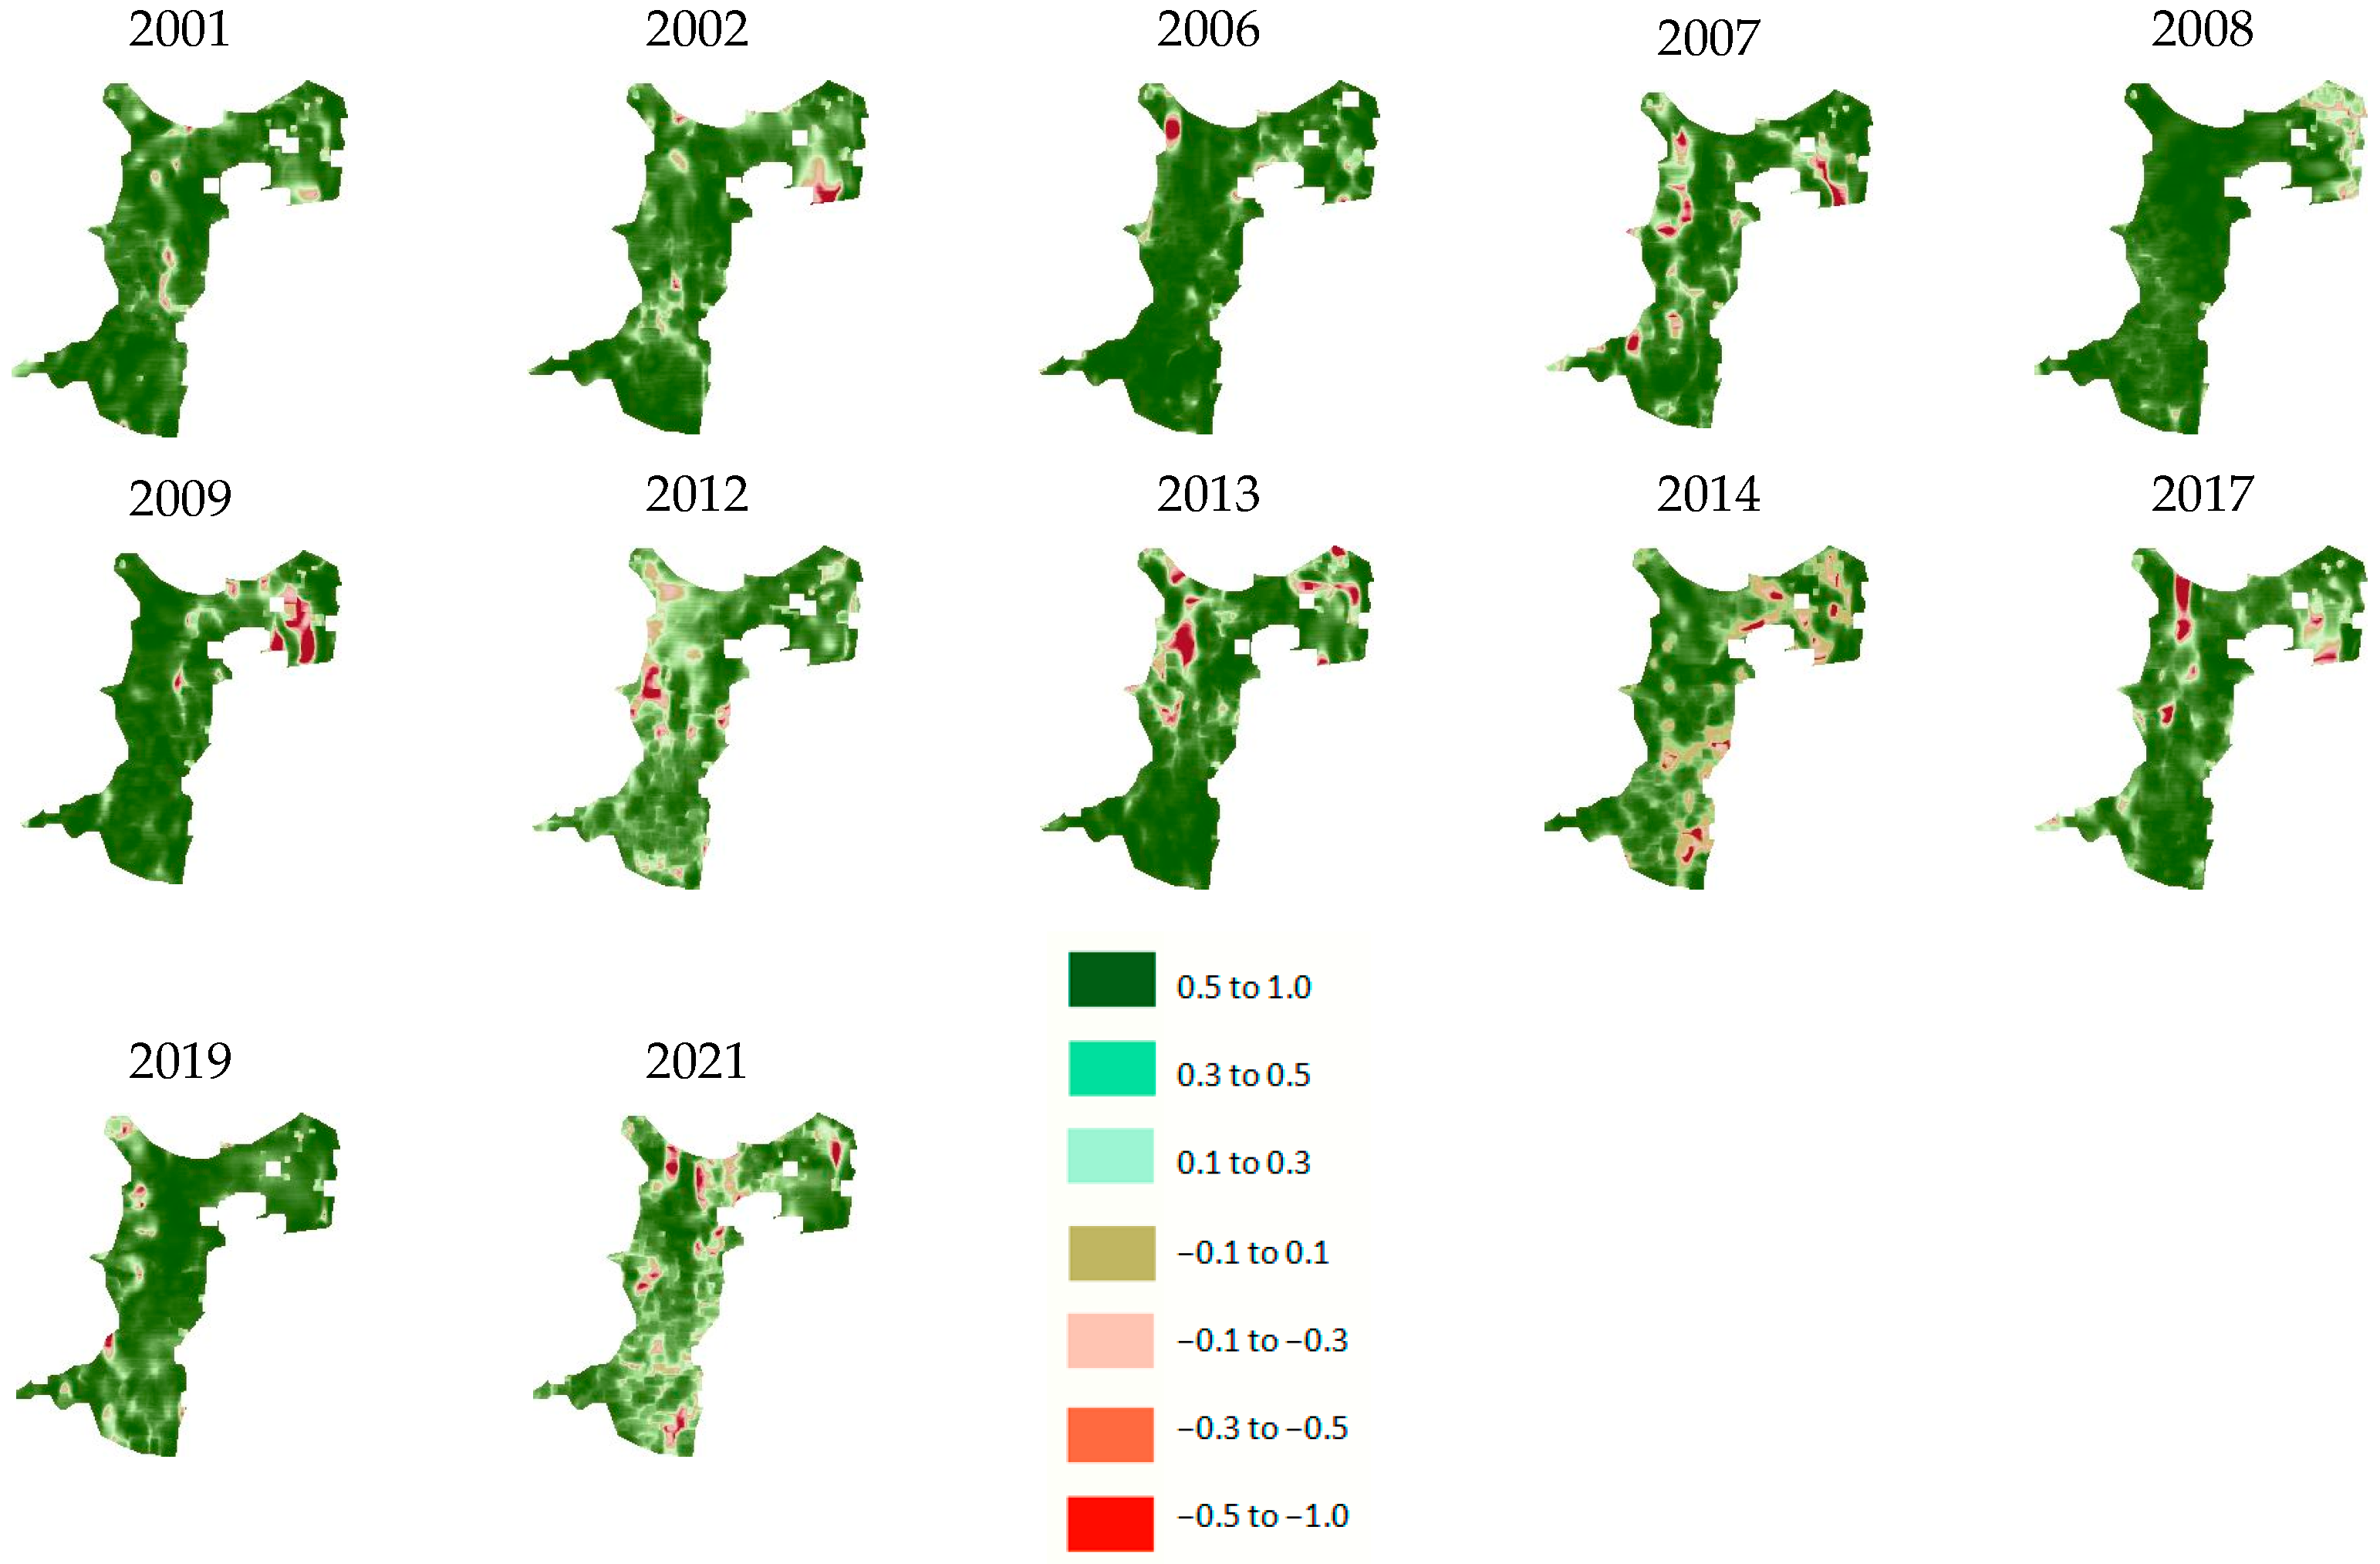
3.5. Spatiotemporal Dynamics of the CDI During the Dry Season

The analysis of the spatiotemporal dynamics of the CDI for the dry season revealed that the region experienced frequent agricultural droughts. The time series of CDI-3 (Figure 8) during the 2001–2021 period had a significant downward trend (R2 = 0.35, p-value = 0.004). These results indicated that during the study period, most parts of the region were exposed to some type of drought, except for the years 2002–2005 and 2013. These findings are consistent with other research on Dobrogea’s major drought events. As indicated in [37], in Romania, the period 1991–2021 was the driest since 1901, with an increase in the duration of moderate, severe, and extreme droughts being identified throughout the country, including Dobrogea. Normal wet conditions characterized the period 1997–2009 [35], which was followed by a dry period, from 2010 to 2021 [25,37]; the drought for this period had the highest degree of severity [37].
In the years 2011, 2012, and 2020, the region encountered the worst drought events (CDI < 0.1), and these years were followed by 2007, 2015, 2016, 2019, and 2021 (Table 6). The authors of [37] identified similar results at the country level, and those of [38] determined that Dobrogea experienced extreme drought in 2007, 2012, and 2015. As indicated in [69], the year 2019 was considered one of the warmest years of all the measurements made in Romania from 1900 to the present, with the drought developing rapidly and attaining the utmost intensity and spatial expanse by 2020. This was proven by the authors of [70], who showed that Nuntasi–Tuzla Lake completely dried up in August 2020 and partially in 2012. Based on the present study, critical to extreme drought conditions were met in large areas across the region (about 95% in 2020, and 35% in 2011 and 2012), whereas severe drought was encountered across 62% and 41% during the years 2011 and 2012, respectively. During these years, the region recorded high LST values (33.5 °C < LST < 39.13 °C), which shows that it was under severe temperature stress (Figure 9). In 2007, more than 77% of the region was affected by moderate drought, and in the years 2015, 2016, 2019, and 2021, an extensive part of the area (43% to 95%) experienced severe drought conditions (Figure 10). In Europe, the summer of 2015 was among the warmest and driest summers of the last seven decades [71], caused by high evapotranspiration rates and a great shortage of precipitation. The drought affected large areas of central and eastern Europe, including Dobrogea [38].
In the years 2017 and 2018, there were moderate to mild drought conditions in most of the region, whereas in 2001 and 2008, there were moderate to severe dry conditions in the southern, western, and central areas. In the year 2014, there were mild drought conditions in most of the region (61%); near-normal conditions were met in 2006, 2009, and 2010, except for a few areas in the west and south of the region (mild drought in about 23%, 35%, and 30% of the area, respectively). Unlike all other years, in 2005, the whole area benefited from extreme wet conditions (CDI = 0.95 on 90% of the region), and this was also clearly indicated through the SPI analysis (extreme wet conditions). Normal wet conditions were indicated in the years 2002–2004 and 2013, suggesting that the region was free from drought.
The analysis of spatial drought distribution, based on SPI and CDI data, reveals that the southern and central parts of Dobrogea are most exposed to drought; here, severe to extreme droughts occur most often. A similar observation was made in [38].

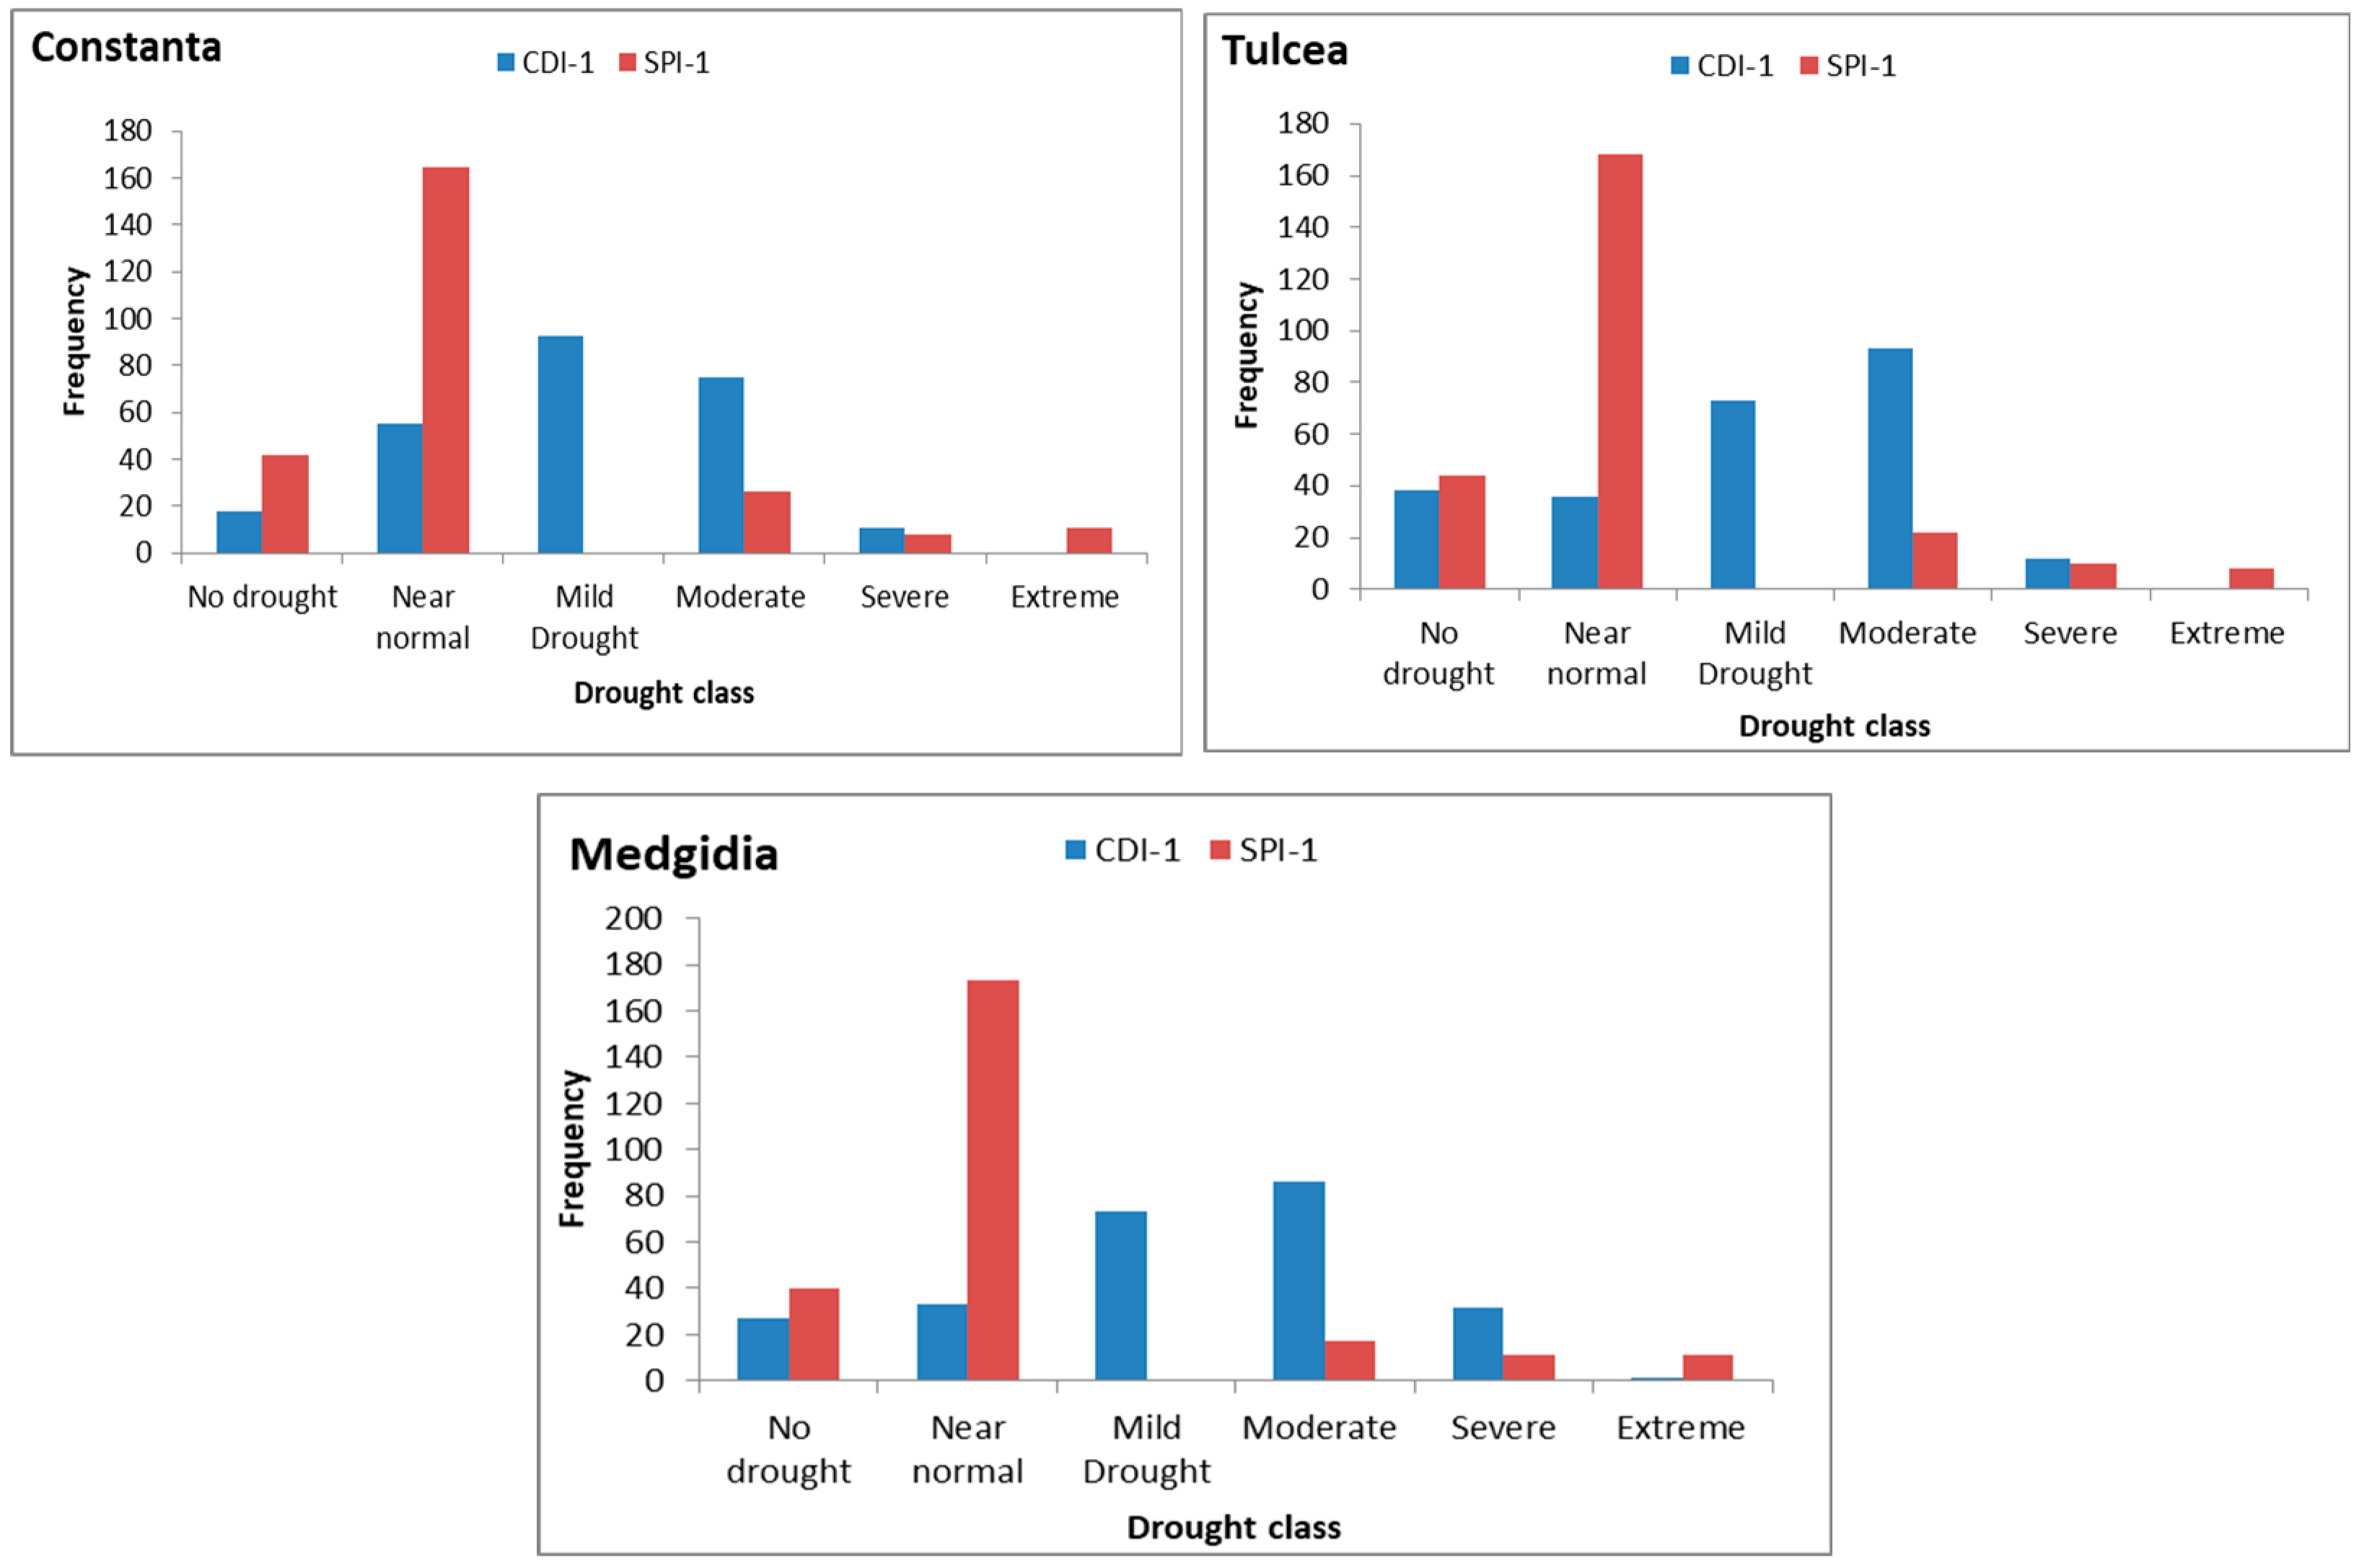
3.6. Correlation Between the CDI and SPI

The Pearson correlation analysis was implemented between CDI-3 and in situ SPI-3 for the dry season of the study period to establish their relationship and seasonal fluctuations in drought and precipitation. The results show that, for the years considered, CDI-3 had a strong positive correlation with in situ SPI-3 (Figure 11). The correlation coefficient (r) values varied from 0.55 to 0.85, with a median of 0.70.
The coefficient of determination (Figure 12) denoted an almost best-fit correlation at Tulcea ground station, R2 = 0.75 (p-value = 0.0001), and a positive correlation was also obtained in Constanta (R2 = 0.55, p-value = 0.0001), Mangalia (R2 = 0.51, p-value = 0.0002), and Medgidia (R2 = 0.40, p-value = 0.002), but the results are not a significantly linear fit. This could be explained by the fact that the short-term droughts in Dobrogea not only arise due to a lack of precipitation but are also induced by high temperatures and a high level of evapotranspiration.
Furthermore, we conducted a Pearson correlation analysis between CDI-1 and satellite-based SPI-1, considering their average for each month of the dry season, from July to September, during the driest year (2020) and the wettest year (2005). The results showed a significant positive correlation between CDI-1 and SPI-1 for the years and months considered, with a correlation coefficient of 0.81 and 0.71, respectively. In the dry year, poorly distributed rainfall affected healthy vegetation growth and enhanced the intensity of drought in the area. The strong positive correlation during the wet year indicated that the CDI responds well to vegetation conditions and the soil moisture content of a region.
We extended the analysis by computing the Pearson correlation between seasonal CDI-3 and satellite-based SPI-3 for the years corresponding to each drought class established for the CDI (Table 2): no drought (2002), mild (2006, 2009, 2013, 2014), moderate (2001, 2007, 2017), severe (2008, 2019, 2021), and critical to extreme (2012). The results (Figure 13) indicated a strong positive correlation between CDI-3 and SPI-3 during the selected years in most parts of Dobrogea, and the correlation values were close to 1 in some areas. Despite that, a strong negative correlation was detected in some parts of the north, northeast, and southeast.
The spatiotemporal analysis of seasonal CDI-3 and SPI-3 during the period from 2001 to 2021 indicated that the entire area of the Dobrogea was vulnerable to some type of drought in most of the years due to below-normal rainfall. The correlation analysis between the seasonal 1- and 3-month CDI and SPI, both in situ and satellite-based, for the study period revealed a strong positive linear relationship in most parts of Dobrogea between below-normal precipitation and drought intensity.

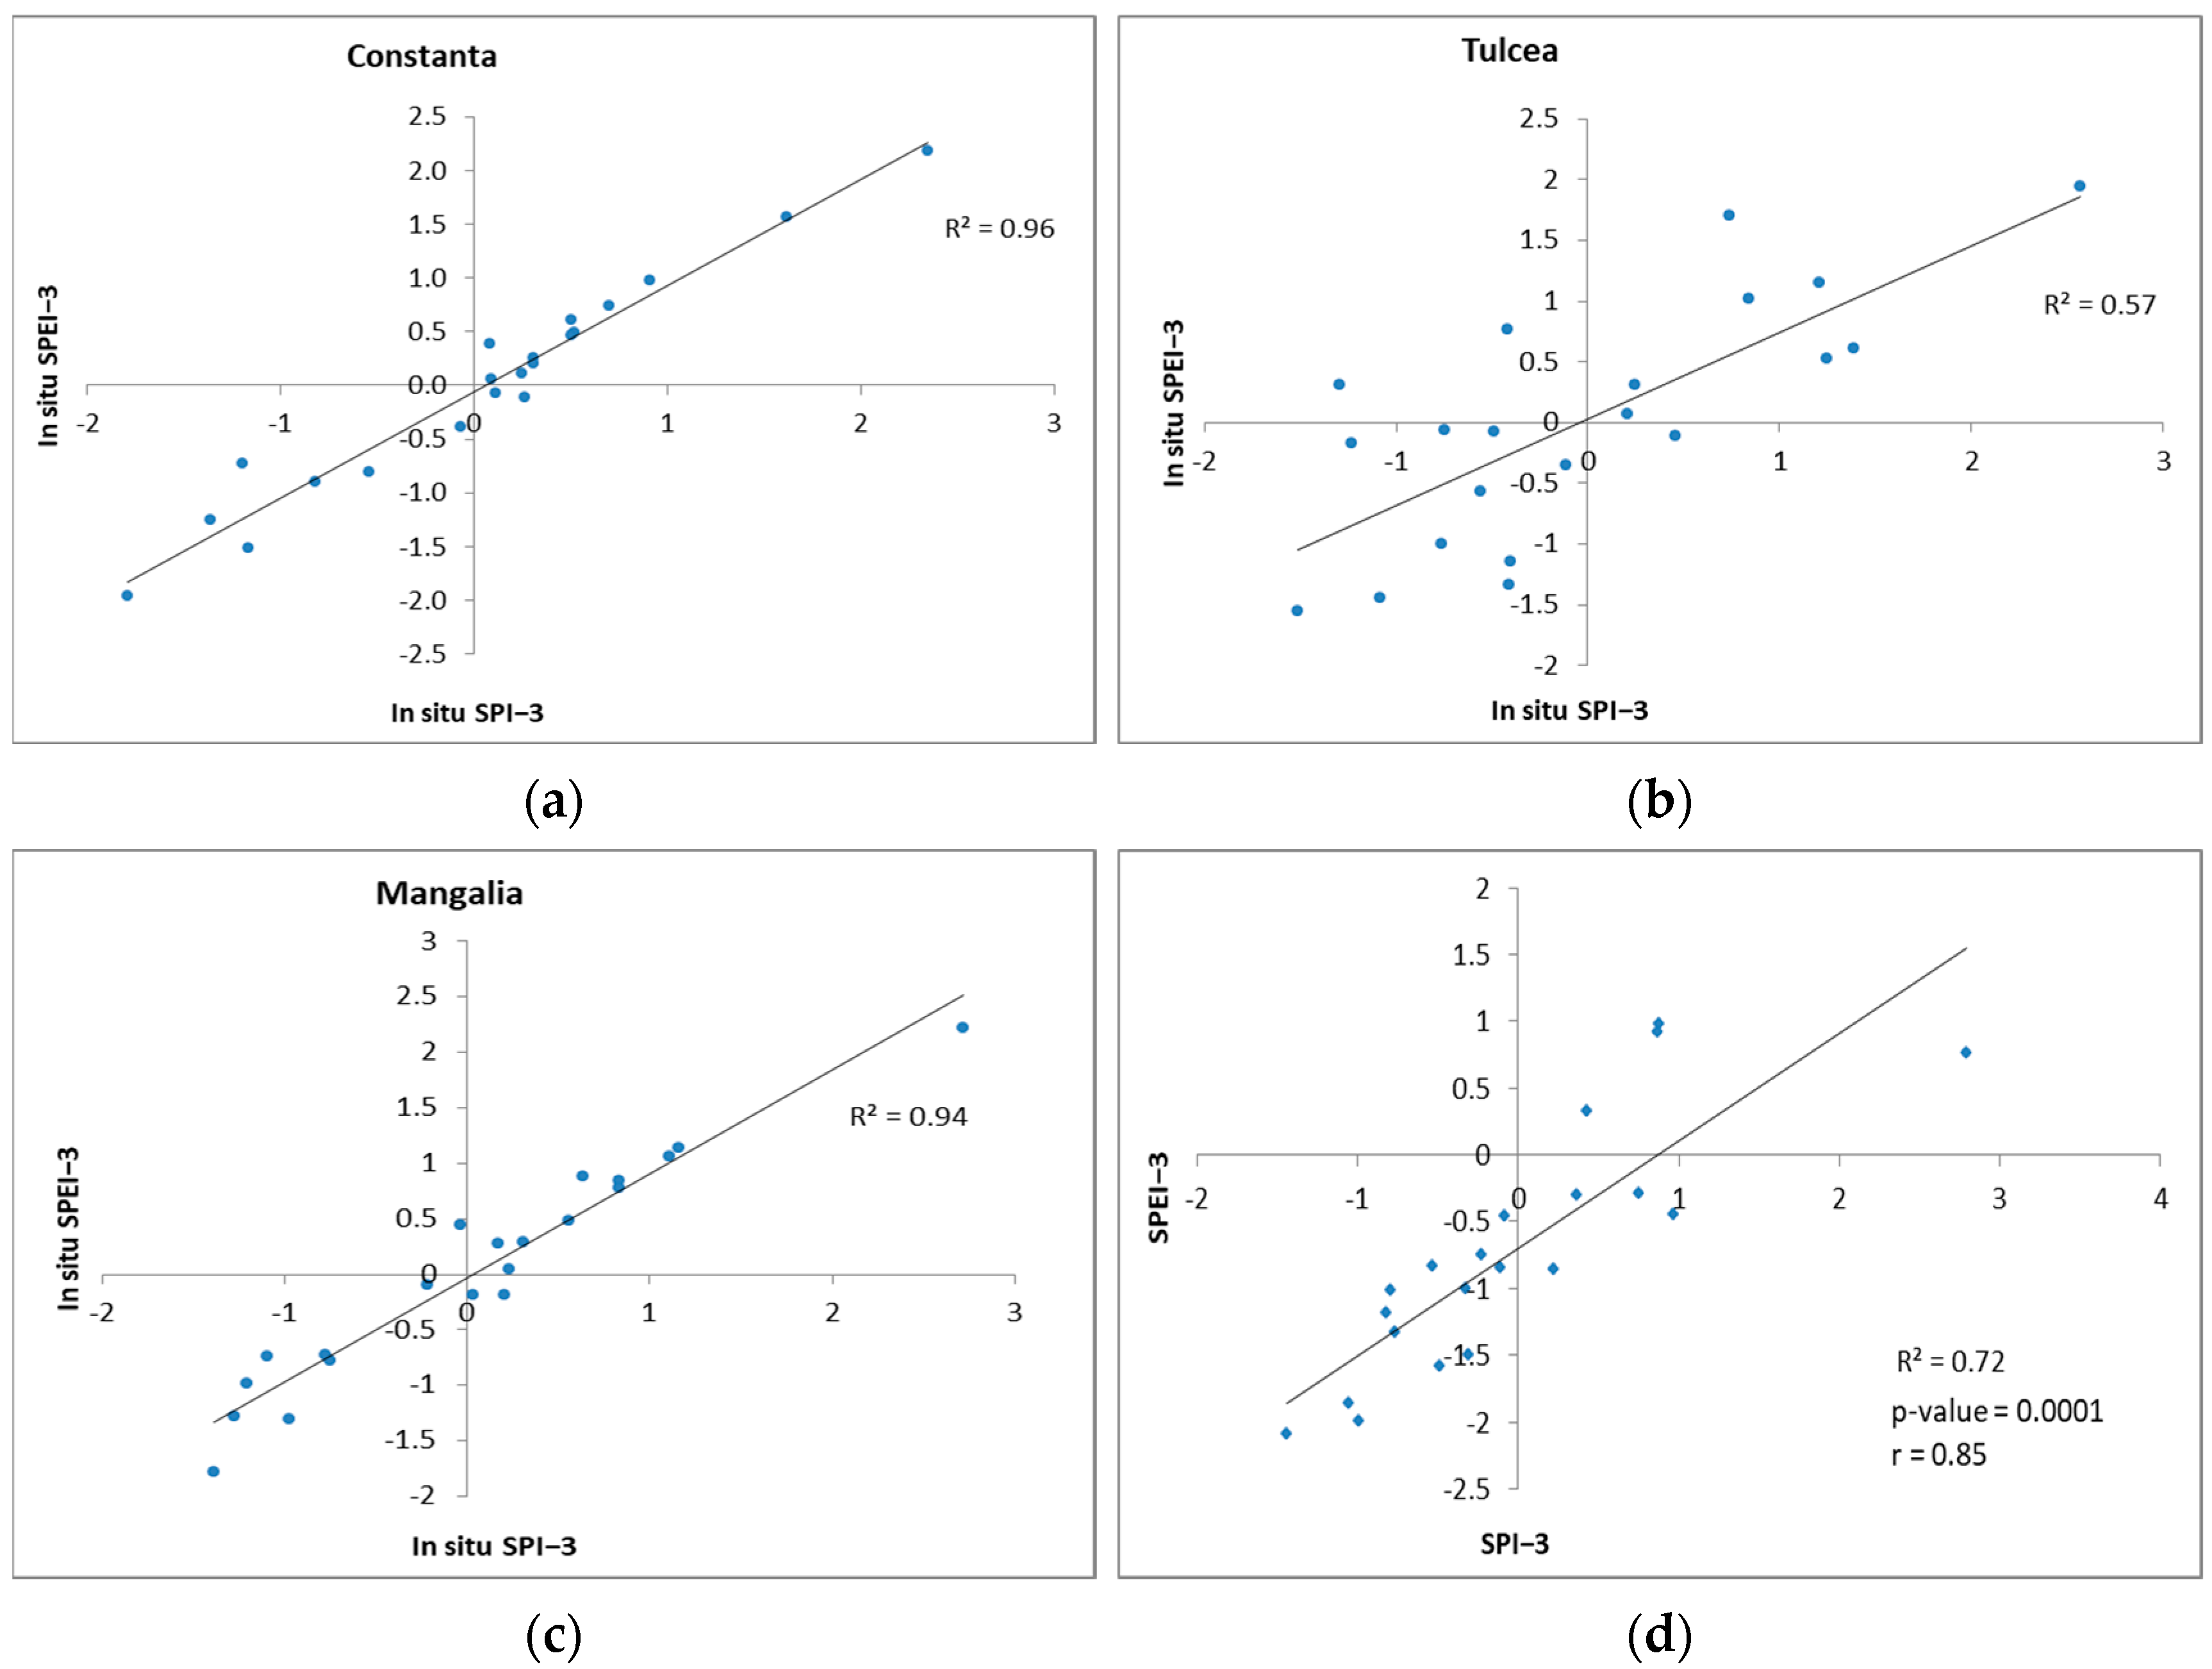
3.7. Correlation Between the SPEI and SPI

Before its further use, in situ SPEI-3 was compared with in situ SPI-3 data, both datasets being built from ground measurements from three weather stations (see Section 2.2.4). The Pearson correlation analysis showed that in situ SPEI-3 had a very strong positive correlation with in situ SPI-3, with r being 0.98, 0.76, and 0.97 at Constanta, Tulcea, and Mangalia stations, respectively. Likewise, the coefficient of determination (Figure 14a–c) indicated a very strong linear association among these indices at Constanta and Mangalia (0.94 R2  0.96, p-value = 0.0001). The dispersion of data points was larger at Tulcea (R2 = 0.57, p-value = 0.0001), which is a sign of a good relationship between indices in that area, but with a greater degree of variability. Further on, we quantified the relationship between satellite-based SPEI-3 and SPI-3, considering their average for each year of the study period (Figure 14d). The results showed that there was a very strong correlation (r = 0.85) and a significant linear association between the SPEI-3 and SPI-3 indices at the 0.0001 significance level (Figure 14d). Overall, we found that there is a good level of agreement between both the in situ and satellite-based SPEI and SPI estimations in the study area at the 3-month timescale.

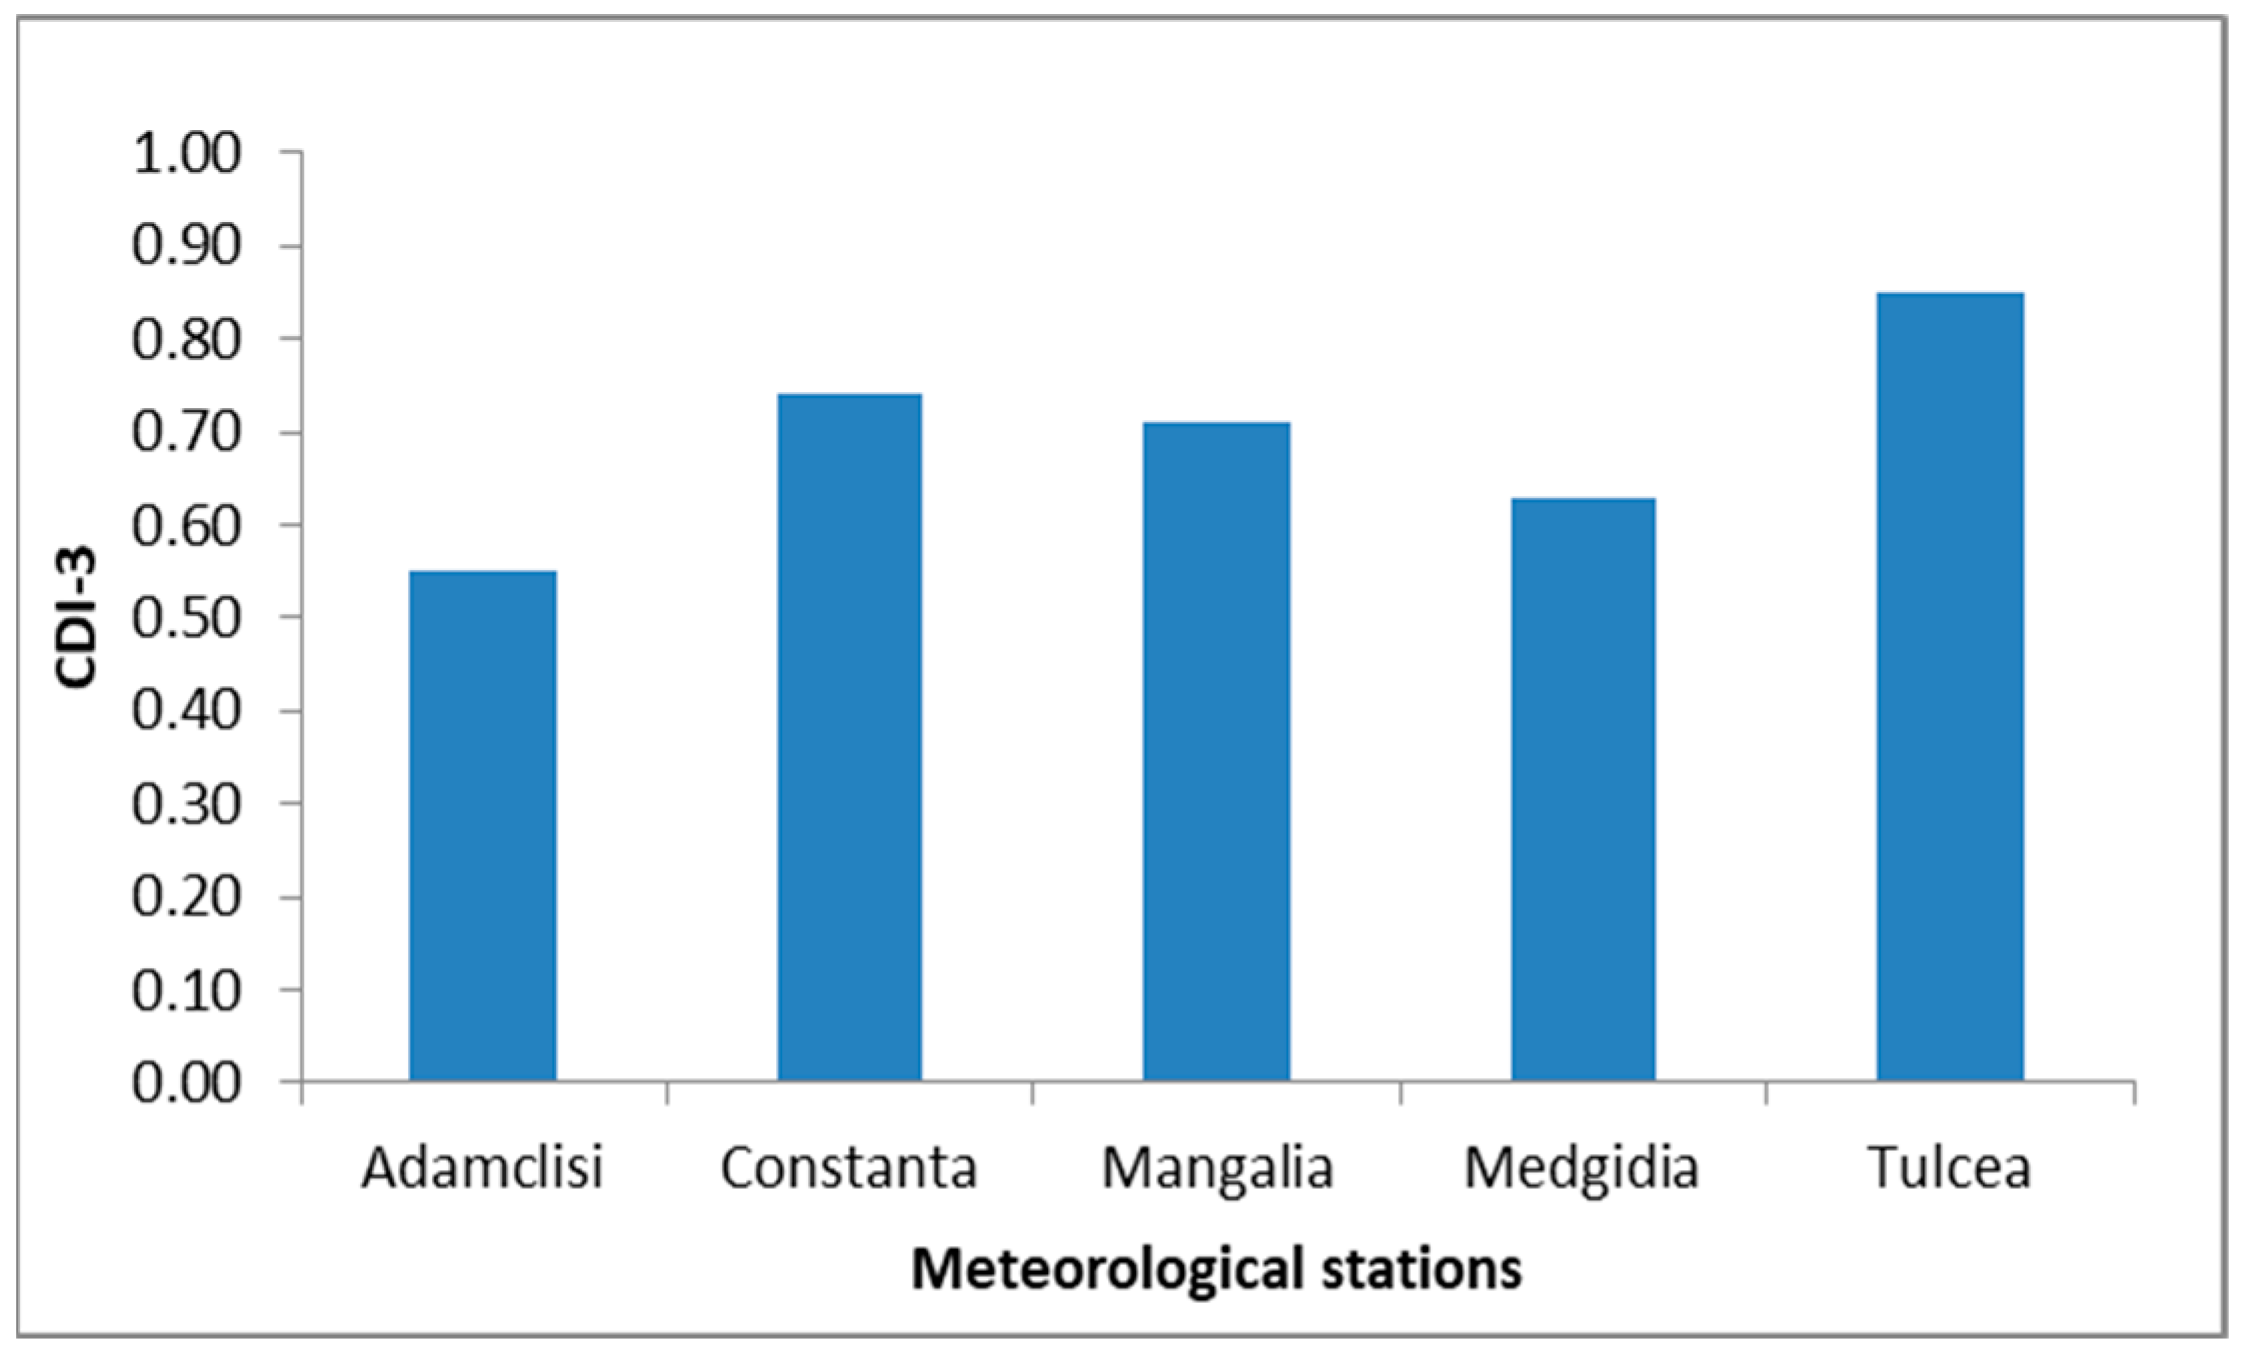
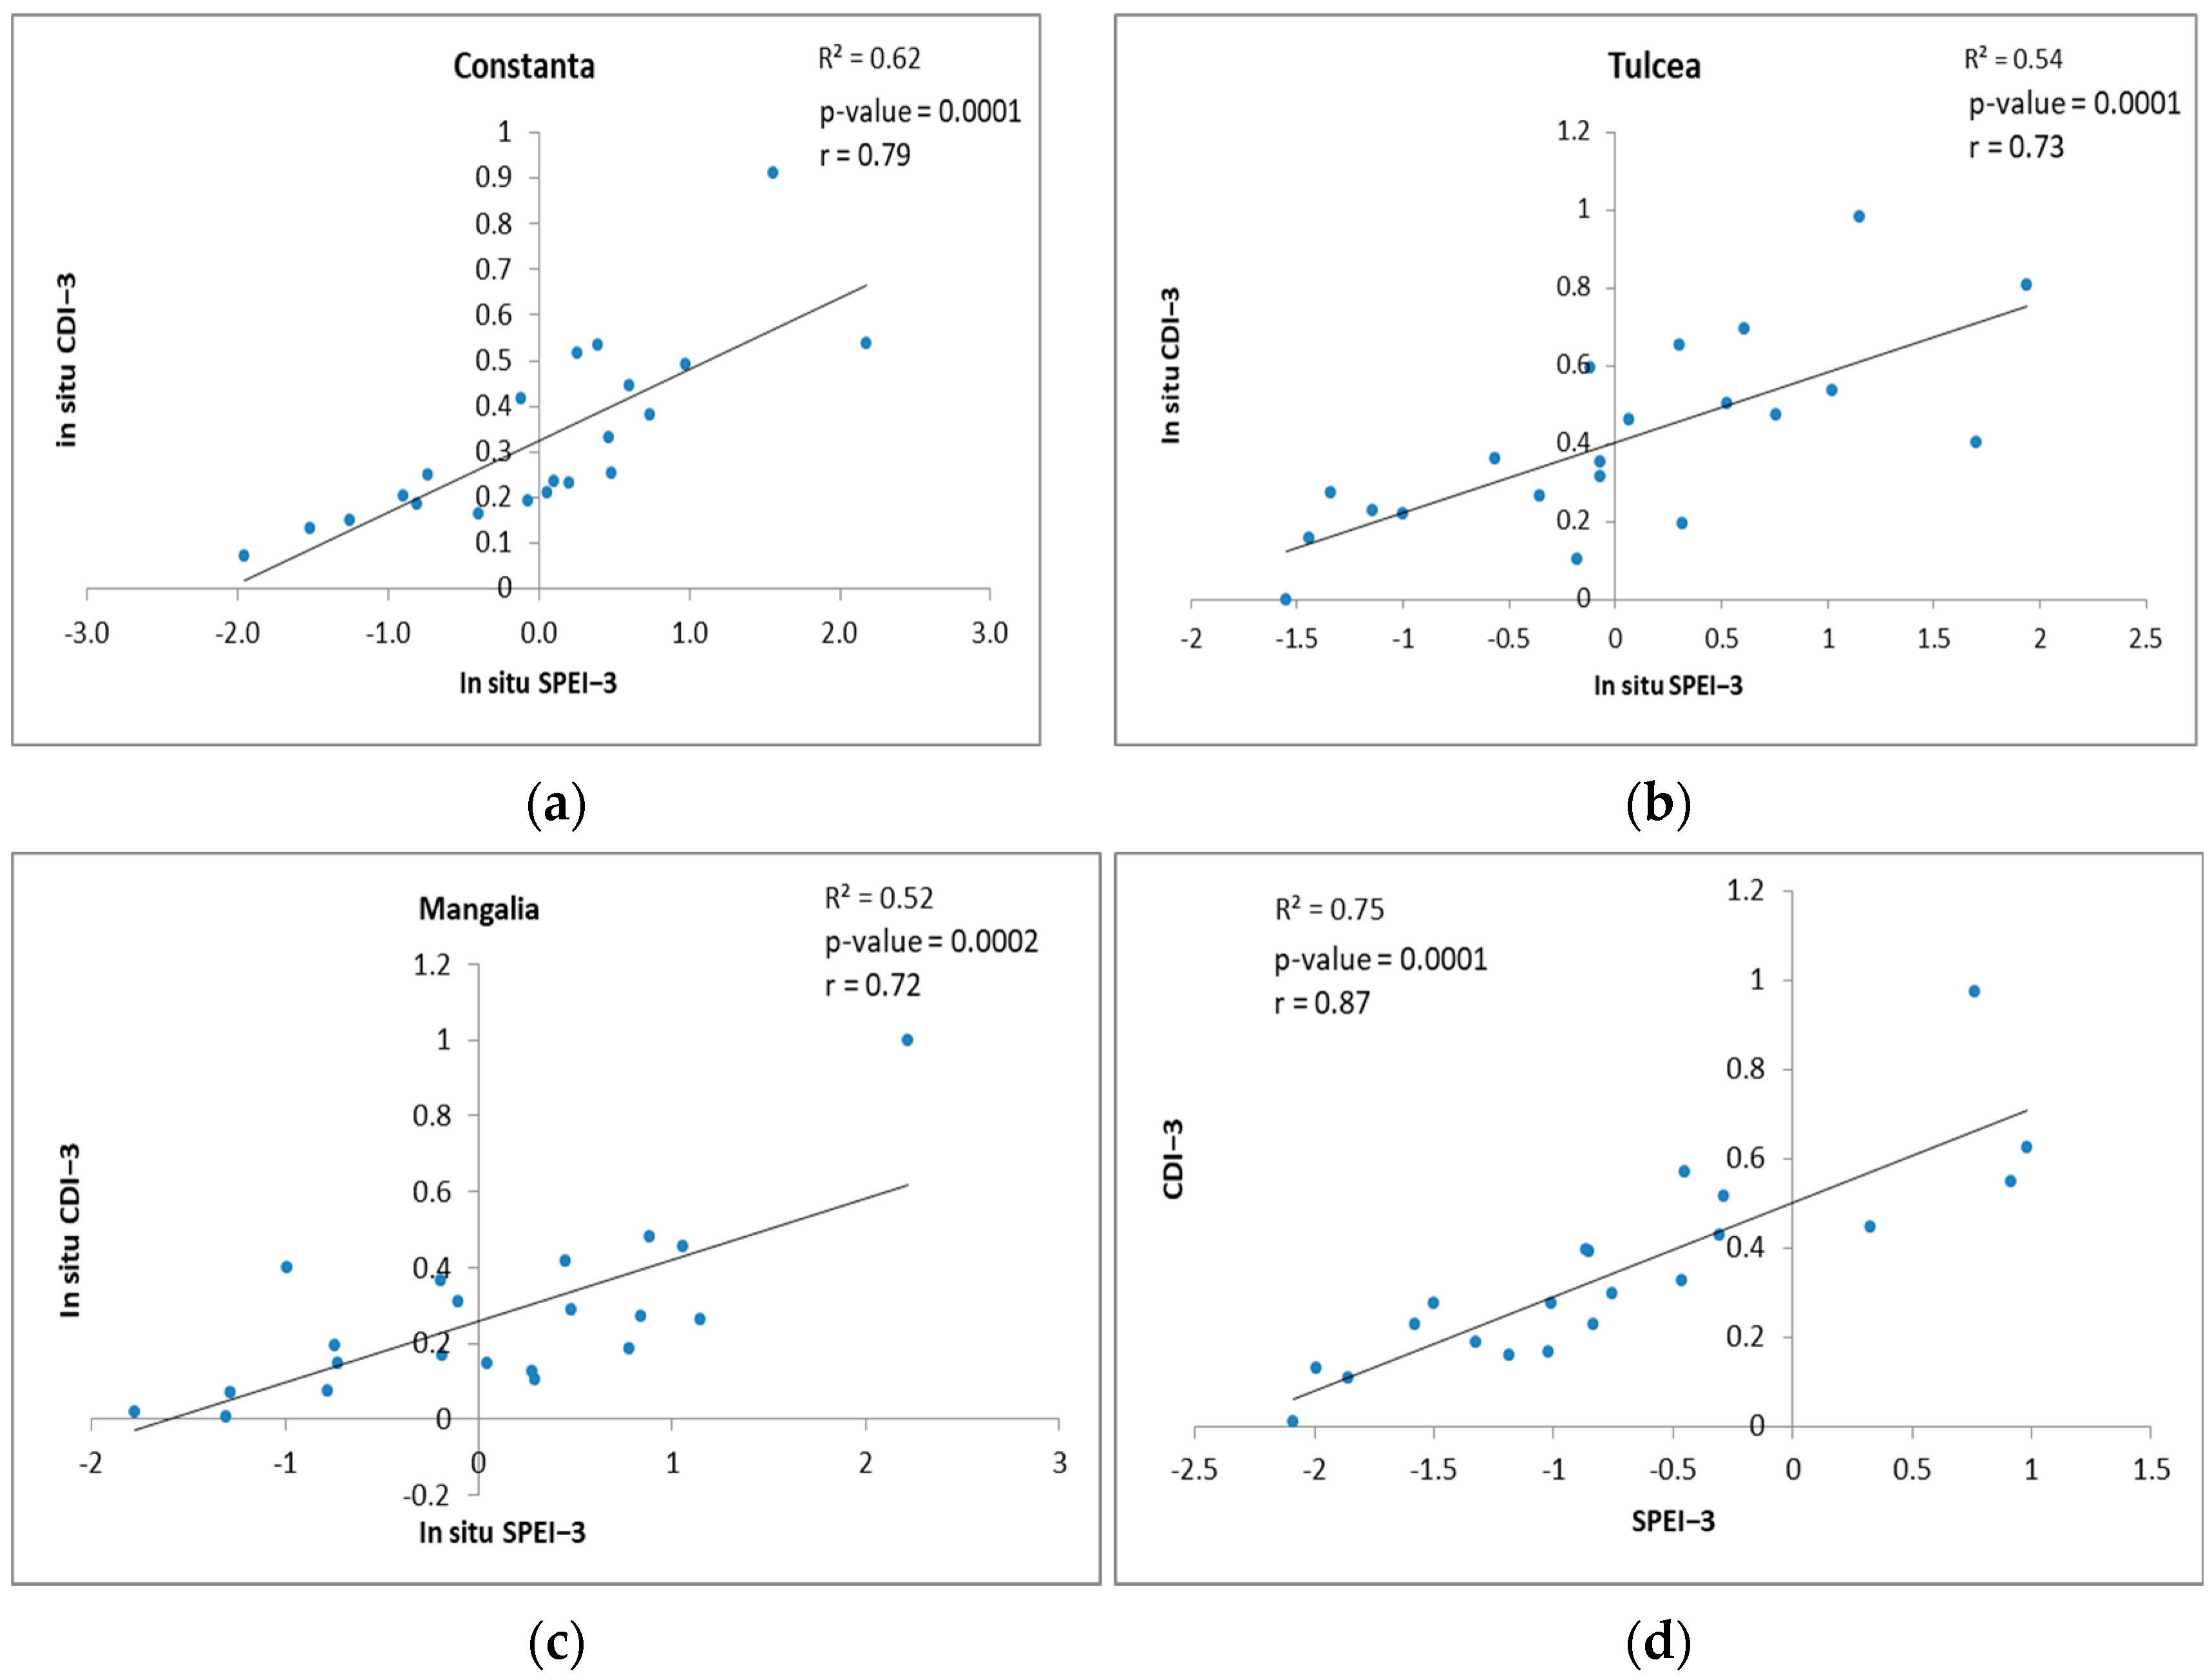
3.8. Correlation Between the CDI and SPEI

Here, we focused our research on assessing the level of agreement between the seasonal CDI and SPEI as drought evaluation tools. To start, we examined the relationship between in situ CDI-3 and SPEI-3, and we identified strong positive correlations, with coefficient r ranging from 0.72 to 0.79 (Figure 15a–c). Moreover, a positive significant linear association between these indices was indicated by the coefficient of determination (0.52 R2  0.62, p-value = 0.0001). Our next step was to explore the relationship between satellite-based seasonal CDI-3 and SPEI-3, taking their average for each year of the study period (Figure 15d). We found that CDI-3 had a significant correlation (r = 0.87) and a strong positive relationship (R2 = 0.75, p-value = 0.0001) with SPEI-3. Considering the results of examining the relationship between CDI-3 and SPI-3 (Section 3.6), we may assume that droughts in Dobrogea are determined by a fusion of factors such as a lack of precipitation, high temperatures, and high evapotranspiration rates.

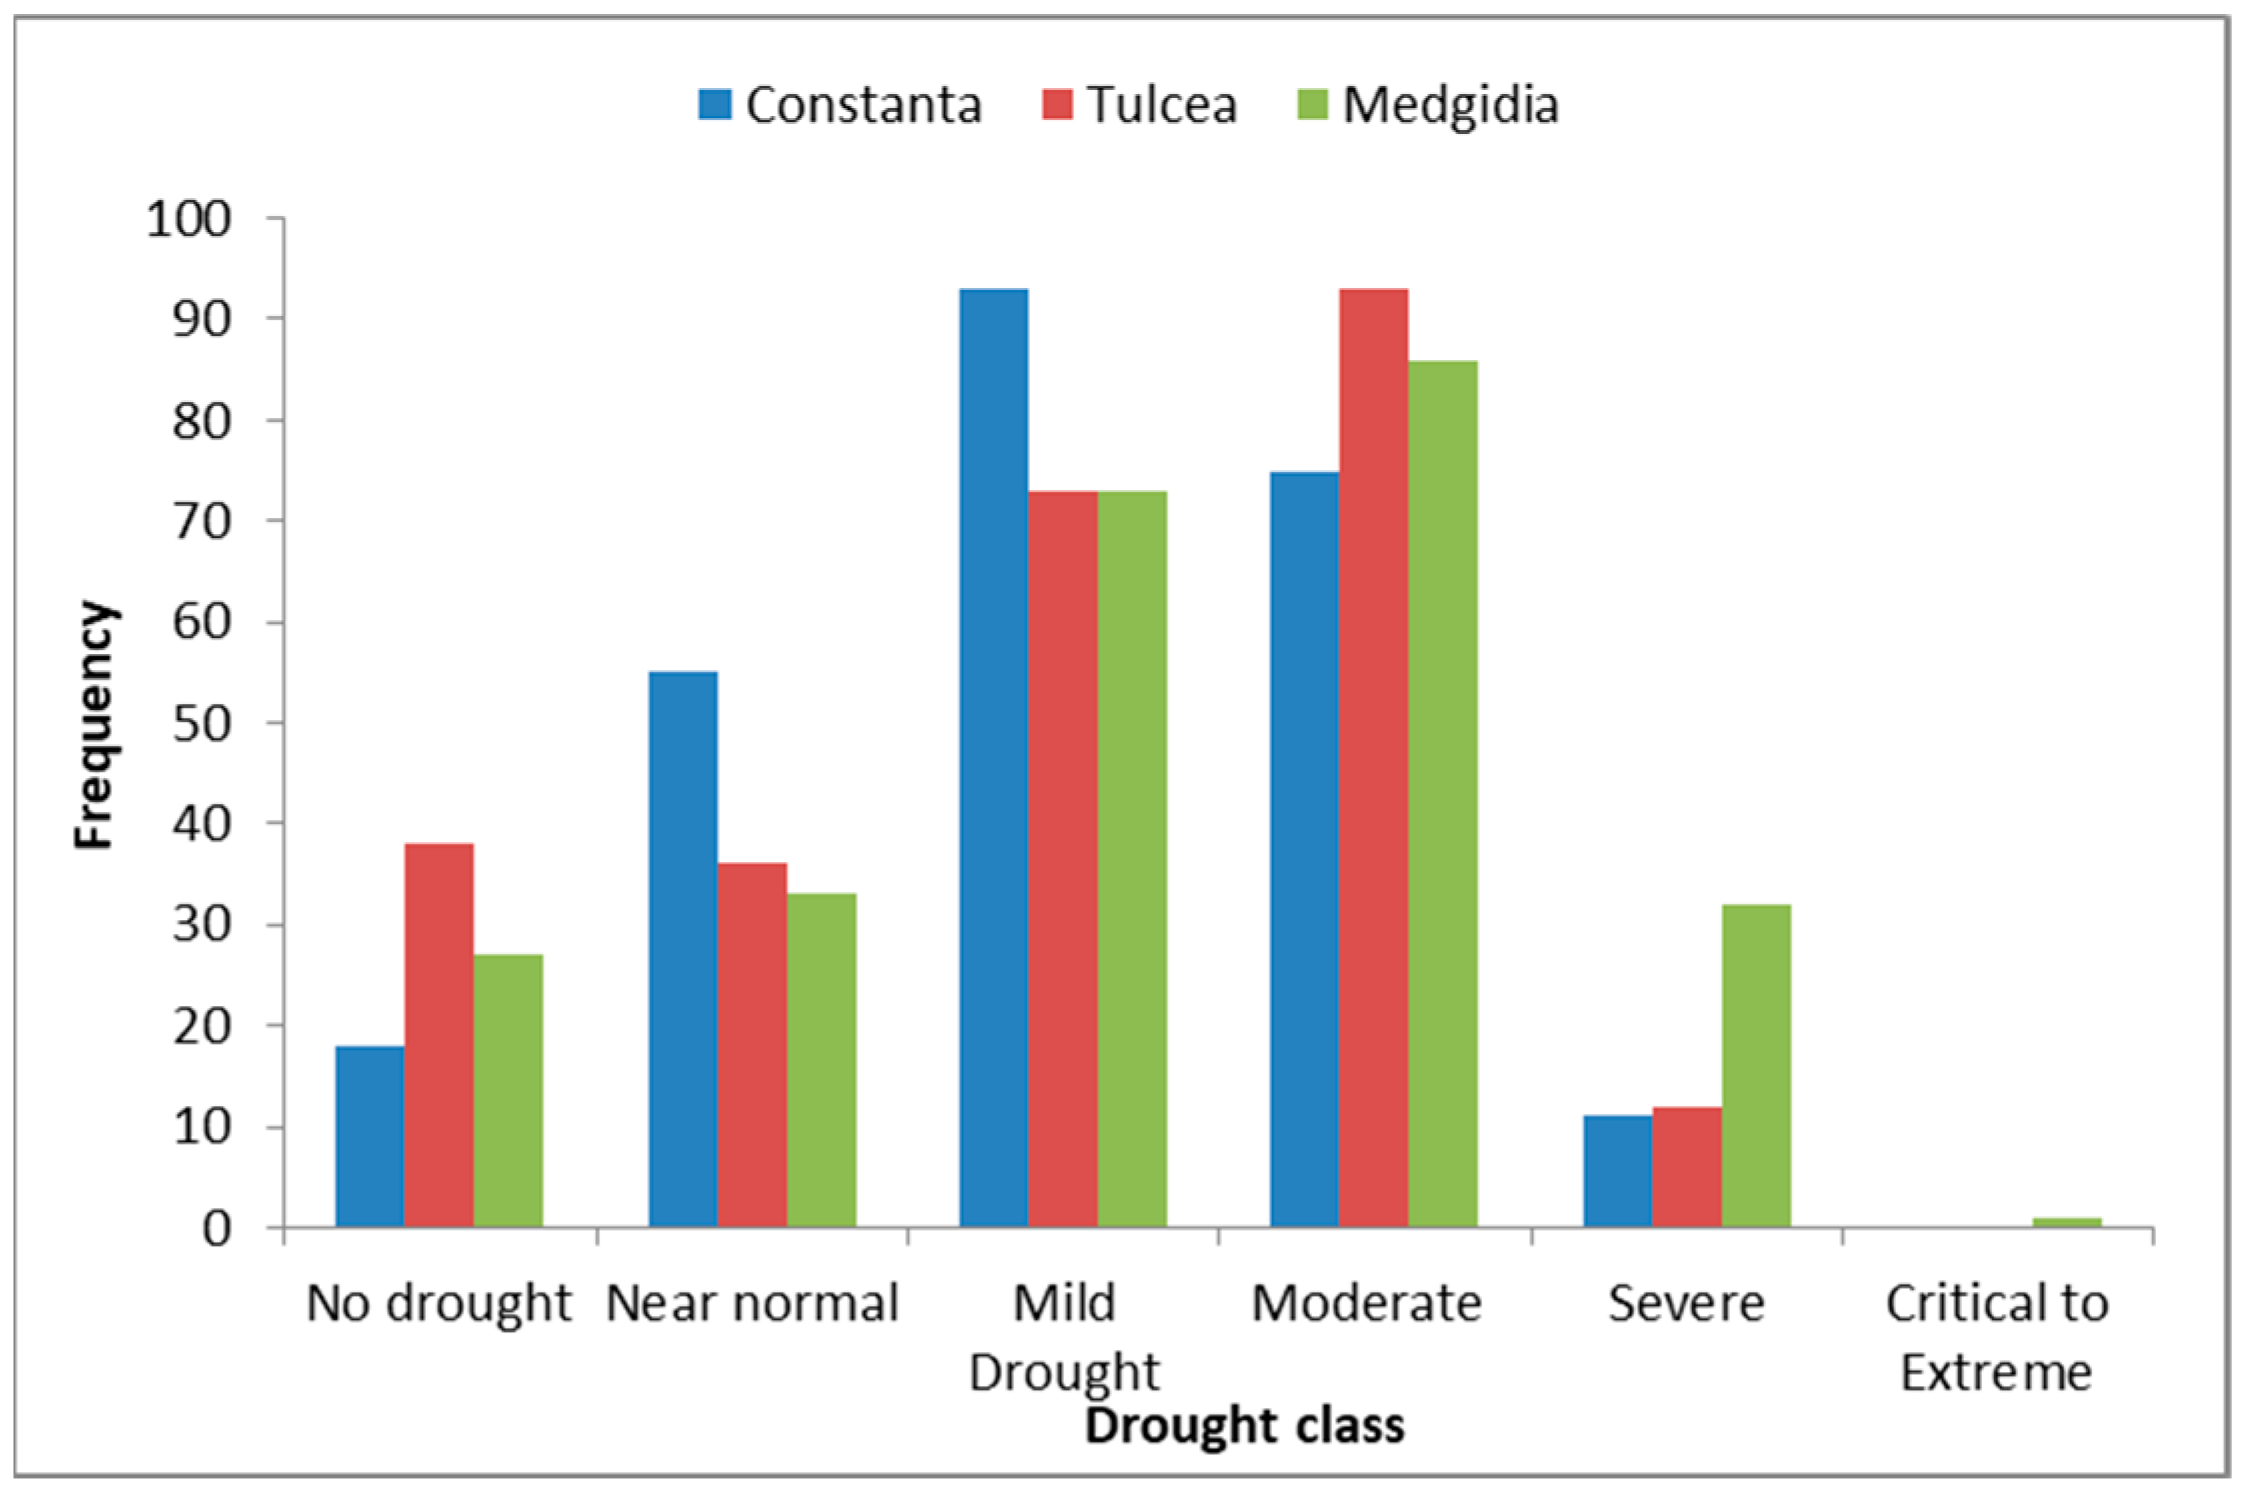
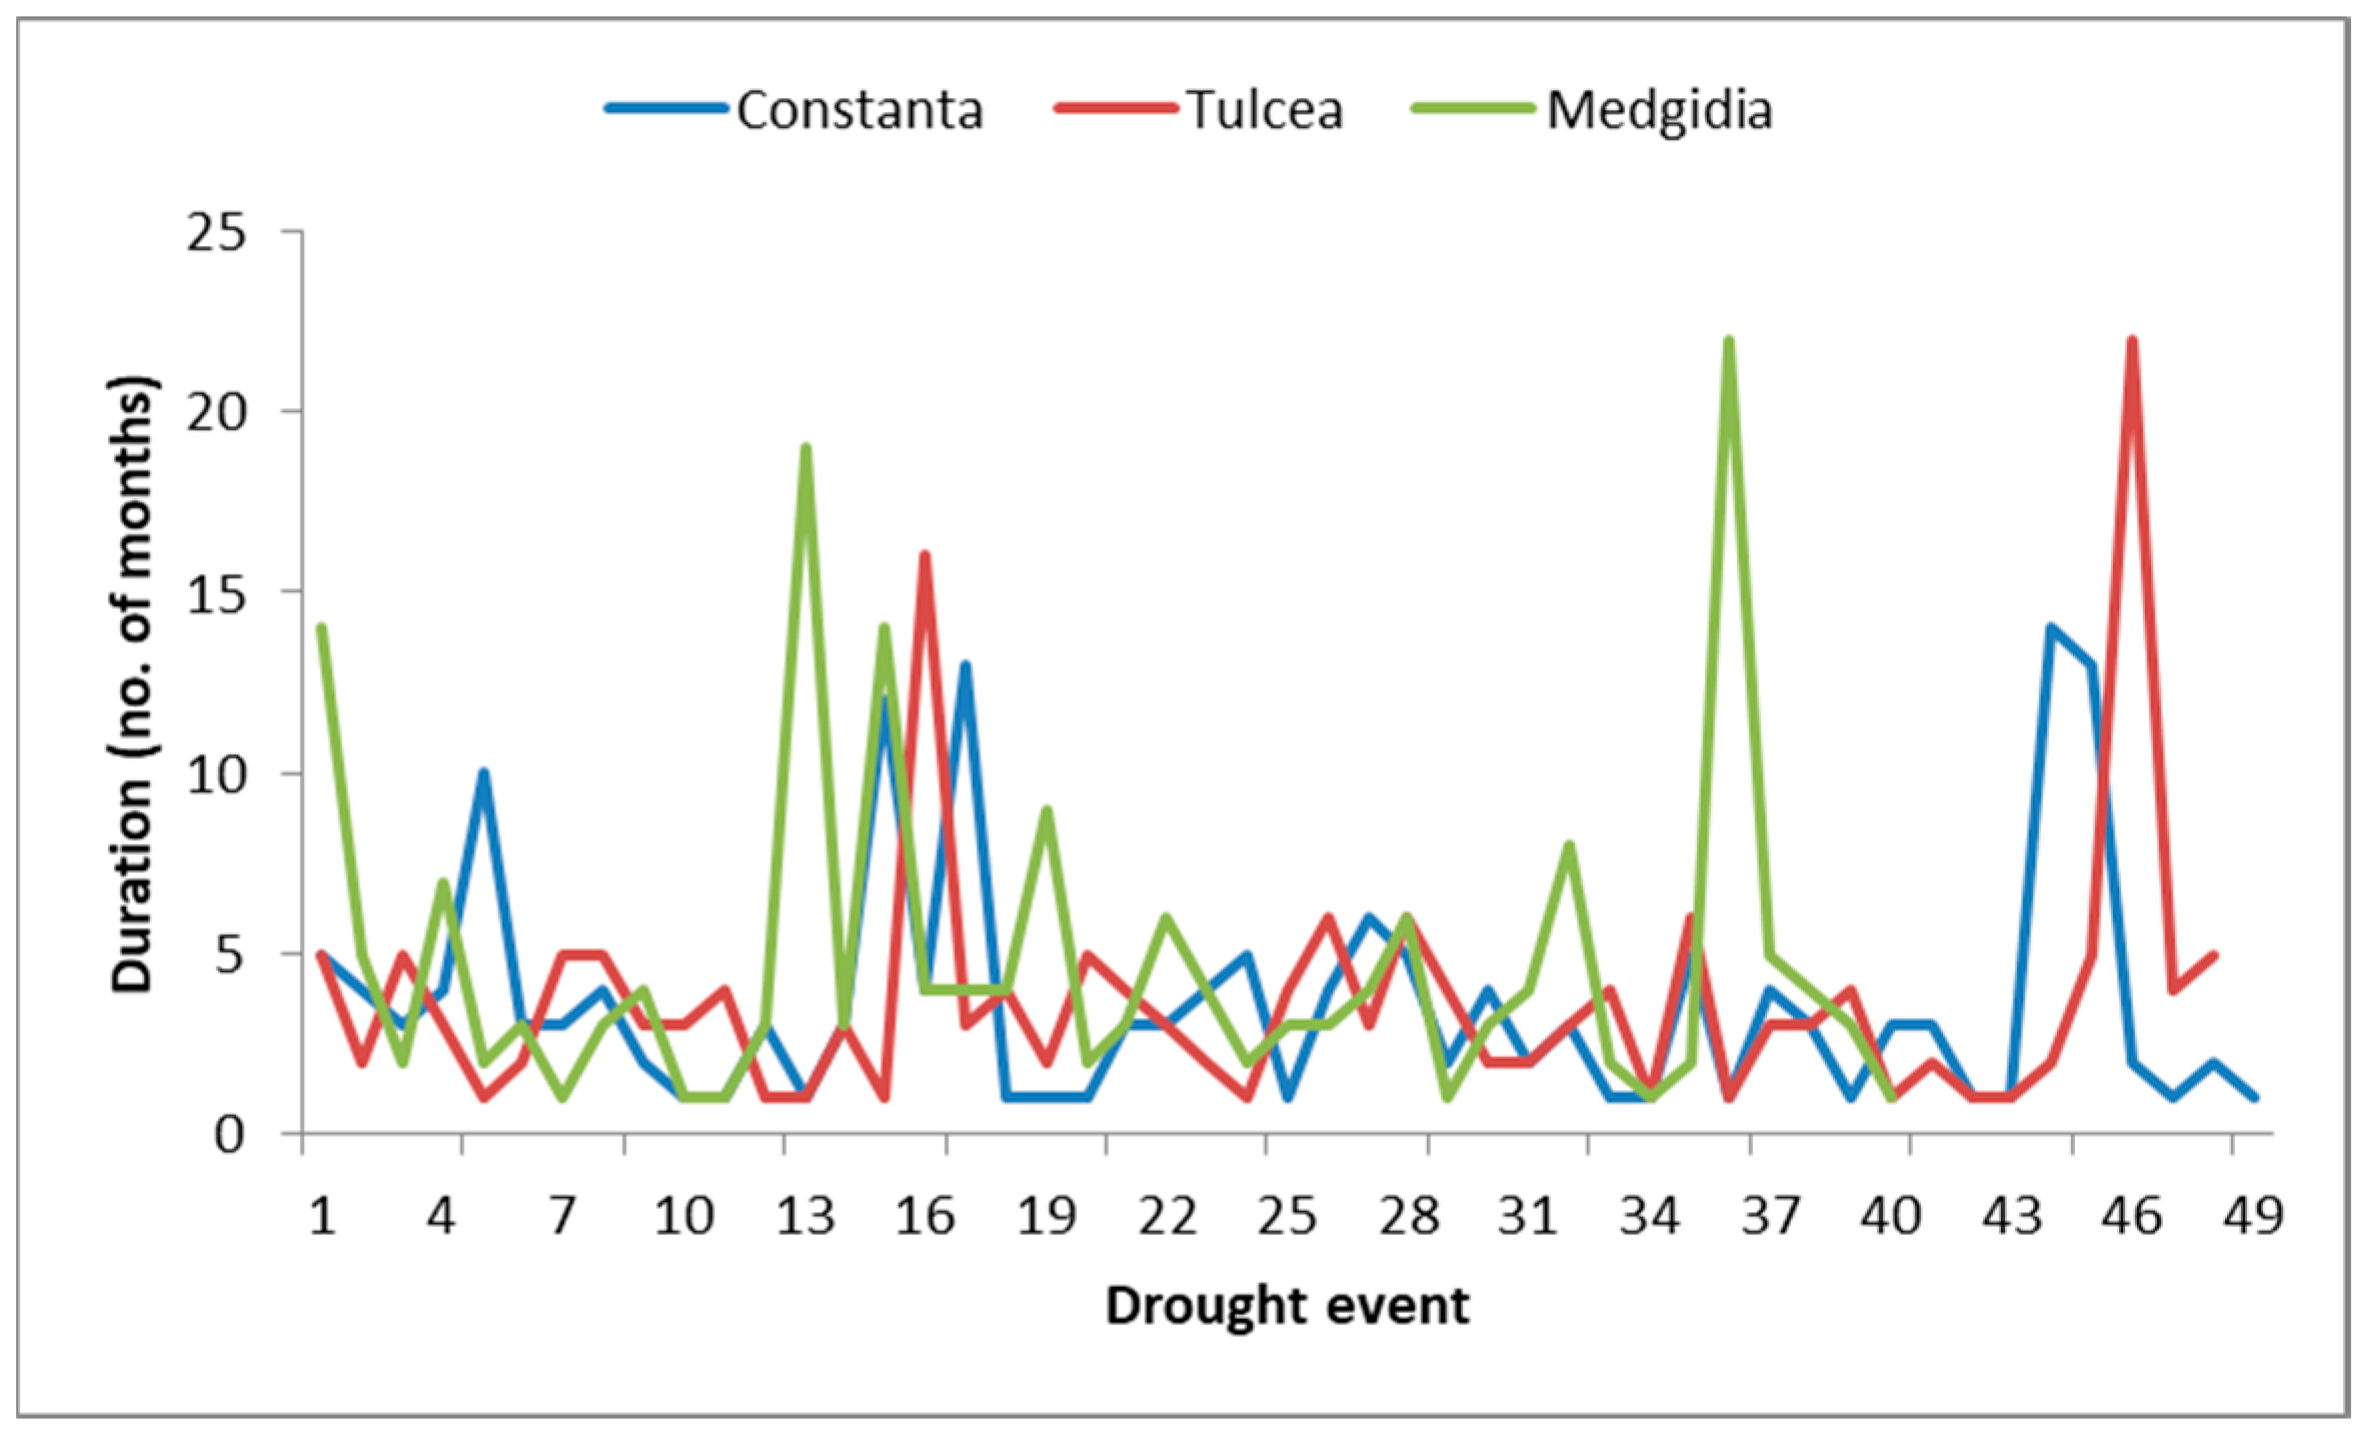
3.9. CDI-Based Drought Characteristics

This study evaluated the duration, intensity, severity, frequency, and probability of occurrence of drought in Dobrogea during the period 2001–2021. We examined the characteristics of drought events in different areas, corresponding to the weather stations Constanta, Tulcea, and Medgidia, for CDI-1.
The frequency and probability of occurrence of various drought events are presented in Table 7 and Figure 16. The mild class of drought has the highest occurrence in Constanta, while the moderate one shows the highest probability in Tulcea, followed by Medgidia. The severe class of drought has the highest likelihood of occurring in Medgidia, which exhibits the highest severe drought occurrence (critical to extreme) among all stations, as well.
The total number of months for the study period is 252, of which we identified the number of drought months for each station, as shown in Table 8. Medgidia had the highest number of months of drought (76.19%), followed by Constanta and Tulcea. The longest drought event was in Tulcea and Medgidia, spanning 22 months, between 2018 and 2020 (Figure 17). The high number of months of drought recorded during the study period is consistent with the results of [35], which indicate an increase in the duration of moderate, severe, and extreme droughts in Dobrogea for 1991–2021 compared to the previous periods.
For less severe drought events, the drought severity values must be closer to zero. Table 8 shows that the severity of drought ranges from moderate in Constanta to severe in Tulcea and extreme in Medgidia.
Most of the drought event intensities were mild to moderate, with more than 40 drought events for each station over the entire study period (Figure 17). One extreme drought occurred in August 2020 in Medgidia. A significant drought incident that was recorded by all stations took place between February 2019 and August 2019, which may indicate that most parts of Dobrogea suffered drought phenomena during this period. This event was extended until November 2020, for all stations, with a month of normal precipitation conditions in Constanta (September 2019) and Medgidia (June 2020). Another long drought event, registered by all stations, was between April 2006 and October 2007, which was interrupted by 3 months of normal conditions in Constanta and 2 months in Tulcea, unevenly distributed throughout the period. It had the longest duration in Medgidia (19 months). Generally, a drought incident was not necessarily followed by a wet period; there were most often near-normal months ( 0.4 < C D I 0.5 : 33 (13%), 36 (14%) and 55 (22%) months in Medgidia, Tulcea, and Constanta, respectively) or short moist breaks.
This study computed the frequencies of the drought classes identified by CDI-1 and in situ SPI-1. Figure 18 shows that CDI-1 and in -situ SPI-1 have their closest similarity for severe and no drought conditions; there is a dissimilarity for the other types of drought classes, which may be due to the CDI’s ability to identify moderate and mild drought events, which were not identified by the in situ SPI or were classified as near-normal conditions.

4. Discussion

4.1. Assessment of Drought Based on the CDI in Dobrogea Area and Practical Implication

As explained in Section 1 and Section 2, Dobrogea is one of the driest regions of Romania, with precipitation that does not exceed 500 mm/year, temperatures that have increased by over 0.8 °C in the last 3 decades, and the presence of dry winds [72]. Studies conducted by [72] show that the coastal area has the longest periods of drought. In order to estimate drought in Dobrogea, a composite drought indicator proposed by Abdourahamane [39] was selected. This type of indicator was used for the first time in a research study in this region, where the density of meteorological stations is small (see Section 2.2). This index was chosen for the following reasons: (i) it integrates data obtained from satellite images, (ii) it uses precipitation, a climatic parameter that governs the wet and dry periods in the region, along with temperature (LST) and vegetation conditions (NDVI), and (iii) it has a spatial resolution of 1 km2. The results are promising and consistent with other drought research studies in Dobrogea, which will allow us to overcome the limits described in Section 3.8. This study cannot be extended to the entire period for which data measurements are available at meteorological stations (1965–2000) since the GPM IMERG product cannot provide data for this period, and, although the CHIRPS product provides information for the period 1981–2000, the errors are greater than those obtained with the GPM IMERG product, as described in Section 3.1.
Using the proposed methodology, we can highlight the following results: (i) the LST value results indicate a temperature rise, consistent with the previous Dobrogea region results [22]; (ii) the NDVI values decreased, which could indicate that agricultural lands were under considerable stress due to high temperatures and irregular and below normal rainfall; (iii) the time series of CDI-3 during 2001–2021 had a significant downward trend, signaling that during the study period, most parts of the study area experienced drought conditions; (iv) the spatiotemporal analysis of the CDI reveals the periods and areas prone to drought, i.e., 2001, 2007–2008, 2011–2012, and 2014–2021, in mostly southern and central areas; (v) there is an acceptable level of agreement between the CDI, SPI and SPEI estimations in the study area, at different timescales; and (vi) the CDI can provide consistent information regarding duration, severity, intensity, and frequency of drought.
These results can be used as part of the DMP in Dobrogea. Still, the DMP must also take into account the climatic particularities of the area, and especially the consequences of using irrigation. The irrigation systems used in Dobrogea were extremely expensive. The water source was mainly the Danube and less often the Danube–Black Sea Canal or the freshwater lakes situated along the coastline. Because of the relief that rises from the Danube and the sea inland, it was necessary to design irrigation systems on pumping energy stages, which led to high energy costs for transporting water from the water source to the highest stage [41]. This is the reason why, nowadays, only irrigation systems located in the proximity of water sources still function. Sometimes, these irrigation systems come with enormous costs for other industries, such as tourism and energy. For example, the studies carried out in Techirghiol and Nuntasi revealed ecological catastrophes, which consisted of the transformation of the lake water from salty or brackish into freshwater [22,70]. This led to a decrease in salinity and the therapeutic quality of the sapropelic mud and, finally, to its disappearance. In Techirghiol, measures were taken in time because the area is well known for its therapeutic center [49]; however, in Nuntasi, no measures were seized, and the mud completely disappeared. However, in Dobrogea, due to climatic conditions, in order to grow large water-consuming plants (such as corn, sunflower, etc.), irrigation is absolutely necessary; therefore, they should be planted in areas that do not influence aquatic ecosystems (some of them being protected areas). For these types of areas, small water-consuming plants combined with a drip irrigation system should be used. To conclude, in Dobrogea, projects are needed that combine the cultivation of small water-consuming plants and irrigation systems with water sources that do not lead to energy consumption for transportation, which will aid in the protection of lakes and rivers. Otherwise, natural ecosystems will be destroyed.

4.2. Limitations

This research facilitates a deeper comprehension of the changes in the Drobrogea area in recent decades (2001–2021), but it is subject to certain limitations. For a study of extreme events such as meteorological drought, at least 30 years of records of climatic parameters (precipitation, temperatures) are needed. Unfortunately, these data are not always available, and not all ground stations have data without any gaps. Also, given the fact that only a few meteorological stations operated by the National Administration of Meteorology (NAM) cover the Dobrogea area, eventually, a small number of meteorological stations were used in this research to collect data for validation, and this could alter the precision of our tests. Nevertheless, the selected stations largely cover the measurement areas proposed by the NAM (the coast, the Danube bank, and the interior area of Dobrogea), being representative (50%) for each area.
This study aims to estimate the CDI using two satellite products for precipitation: CHIRPS and GPM IMERG. Considering the availability of GPM IMERG data (starting with June 2000), for a coherent study, we chose the period 1 January 2001–31 December 2021, this being the period in which satellite data for both products are available, which also corresponds to the availability of test data from weather stations (until 2021). Therefore, this research is conducted in a period not long enough for our results to be significant for understanding long-term drought conditions [73], but rather short- and medium-term trends.
It is well known that the NDVI reflects the health of vegetation during drought periods, but it is difficult to interpret when vegetation is sparse or when areas are analyzed in proximity to water (high absorption of the near-infrared spectrum). For this reason, it will be necessary to integrate other more robust vegetation indices into the CDI calculation.

5. Conclusions

Understanding how drought affects agriculture and the development of the Dobrogea region is an essential component of this study, which can provide useful insights into land and environmental planning in this area. This study’s primary goal was to identify, apply, and evaluate a method to calculate a drought index based only on the RS data for the Dobrogea region, given that other indices such as the SPI or SPEI reveal their limitations, due, in particular, to strong dependency on ground datasets provided by meteorological stations. The prime European platform that provides information about drought, the EDO web portal [74], offers several products related to drought indicators, like the SPI, CDI, SMA, etc., the resolution of these products being around 5 km × 5 km. The technique proposed in this study gives the possibility to calculate a drought hazard index in near real time, based only on RS data, and with a better spatiotemporal resolution, using MODIS satellite imagery (with a spatial resolution of 1 km × 1 km and a frequent repeat cycle of 1–2 days) to retrieve the data related to the NDVI and LST, and a high-resolution satellite rainfall product—GPM IMERG, to estimate precipitation. The research in this paper also reveals that there is a reasonable level of agreement between the CDI, SPI, and SPEI as drought evaluation tools in the study area. To conclude, the Dobrogea area is vulnerable to drought, and the CDI could be used for drought detection as part of the DMP. In the future, we will extend our study to other stations. As the interpretation of the NDVI is quite difficult, we plan to introduce other indices that express vegetation conditions much more robustly.

Author Contributions

Conceptualization, C.S. and C.M.; methodology, C.S. and C.M.; software, C.S.; validation, C.S.; writing—original draft preparation, C.S. and C.M.; writing—review and editing, C.S. and C.M. All authors have read and agreed to the published version of this manuscript.

Funding

The APC was funded by Transilvania University of Brasov.

Data Availability Statement

Dataset available on request from the authors.

Conflicts of Interest

The authors declare no conflict of interest.

References

  1. Bokal, S.; Müller, R. Integrated Drought Management in Central and Eastern Europe; WMO: Geneva, Switzerland, 2018. [Google Scholar]
  2. Maftei, C.E.; Bărbulescu, A.; Osman, A. Assessment of the Drought Risk in Constanta County, Romania. Atmosphere 2024, 15, 1281. [Google Scholar] [CrossRef]
  3. Maftei, C.; Dobrica, G.; Cerneaga, C.; Buzgaru, N. Drought Land Degradation and Desertification—Case Study of Nuntasi-Tuzla Lake in Romania. In Water Safety, Security and Sustainability: Threat Detection and Mitigation; Vaseashta, A., Maftei, C., Eds.; Advanced Sciences and Technologies for Security Applications; Springer International Publishing: Cham, Switzerland, 2021; pp. 583–597. ISBN 978-3-030-76008-3. [Google Scholar]
  4. CE. COM (2007) 414—Addressing the Challenge of Water Scarcity and Droughts in the EU—EU Monitor; CE: Brussels, Belgium, 2007. [Google Scholar]
  5. CE. COM (2012) 673—Blueprint to Safeguard Europe’s Water Resources—EU Monitor; CE: Brussels, Belgium, 2012. [Google Scholar]
  6. Stein, U.; Özerol, G.; Tröltzsch, J.; Landgrebe, R.; Szendrenyi, A.; Vidaurre, R. European Drought and Water Scarcity Policies. In Governance for Drought Resilience: Land and Water Drought Management in Europe; Bressers, H., Bressers, N., Larrue, C., Eds.; Springer International Publishing: Cham, Switzerland, 2016; pp. 17–43. ISBN 978-3-319-29671-5. [Google Scholar]
  7. Fatulová, E.; Majerčáková, O.; Houšková, B.; Bardarska, G.; Alexandrov, V.; Kulířová, P.; Gayer, J.; Molnár, P.; Fiala, K.; Tamás, J.; et al. Guidelines for Preparation of the Drought Management Plans: Development and Implementation of Risk-Based Drought Management Plans in the Context of the EU Water Framework Directive—As Part of the River Basin Management Plans; Global Water Partnership Central and Eastern Europe: Bratislava, Slovakia, 2015; ISBN 978-80-972060-1-7. [Google Scholar]
  8. United Nations Office for Disaster Risk Reduction (UNDRR). Available online: https://www.undrr.org/terminology/hazard (accessed on 15 October 2024).
  9. Kogan, F.N. Droughts of the Late 1980s in the United States as Derived from NOAA Polar-Orbiting Satellite Data. Bull. Am. Meteorol. Soc. 1995, 76, 655–668. [Google Scholar] [CrossRef]
  10. Haied, N.; Foufou, A.; Khadri, S.; Boussaid, A.; Azlaoui, M.; Bougherira, N. Spatial and Temporal Assessment of Drought Hazard, Vulnerability and Risk in Three Different Climatic Zones in Algeria Using Two Commonly Used Meteorological Indices. Sustainability 2023, 15, 10. [Google Scholar] [CrossRef]
  11. Zargar, A.; Sadiq, R.; Naser, B.; Khan, F.I. A review of drought indices. Environ. Rev. 2011, 19, 333–349. [Google Scholar] [CrossRef]
  12. WMO; GWP. Handbook of Drought Indicators and Indices; Svoboda, M., Fuchs, B., Eds.; WMO: Geneva, Switzerland, 2016; ISBN 978-92-63-11173-9. [Google Scholar]
  13. Palmer, W.C. Meteorological Drought. Weather. Bur. Res. Pap. 1965, 45, 1–58. [Google Scholar]
  14. McKee, T.B.; Doesken, N.J.; Kleist, J. The relationship of drought frequency and duration to time scales. Eighth Conf. Appl. Climatol. 1993, 22, 174–184. [Google Scholar]
  15. Vicente-Serrano, S.M.; Beguería, S.; López-Moreno, J.I. A Multiscalar Drought Index Sensitive to Global Warming: The Standardized Precipitation Evapotranspiration Index. J. Clim. 2010, 23, 1696–1718. [Google Scholar] [CrossRef]
  16. Hayes, M.; Svoboda, M.; Wall, N.; Widhalm, M. The Lincoln Declaration on Drought Indices: Universal Meteorological Drought Index Recommended. Bull. Am. Meteorol. Soc. 2011, 92, 485–488. [Google Scholar] [CrossRef]
  17. Alahacoon, N.; Edirisinghe, M.A. Comprehensive Assessment of Remote Sensing and Traditional Based Drought Monitoring Indices at Global and Regional Scale. Geomat. Nat. Hazards Risk 2022, 13, 762–799. [Google Scholar] [CrossRef]
  18. European Drought Observatory|Copernicu. Available online: https://www.copernicus.eu/en/european-drought-observatory (accessed on 23 October 2024).
  19. EDO. Available online: https://www.copernicus.eu/ro/node/8534 (accessed on 15 October 2024).
  20. Mateescu, E.; Smarandache, M.; Jeler, N.; Apostol, V. Drought Conditions and Management Strategies in Romania (Capacity Development to Support National Drought Management Policy) [Country Report]. Available online: https://www.droughtmanagement.info/literature/UNW-DPC_NDMP_Country_Report_Romania_2013.pdf (accessed on 1 July 2015).
  21. Maftei, C.; Barbulescu, A. Statistical Analysis of Climate Evolution in Dobrudja Region. In Proceedings of the World Congress on Engineering, WCE, London, UK, 2–4 July2008; Volume 2, pp. 2–4. [Google Scholar]
  22. Dobrica, G. Evaluarea Secetei Hidrologice în Bazinul Hidrografic al Lacului Nuntași-Tuzla, Județul Constanța (Assessment of the Hydrological Drought in the Nuntași-Tuzla Lake Watershed, Constanța County). Ph.D. Thesis, Unpublished. Ovidius University of Constanta, Constanta, Romania, 2023. [Google Scholar]
  23. Croitoru, A.-E.; Piticar, A.; Imbroane, A.M.; Burada, D.C. Spatiotemporal distribution of aridity indices based on temperature and precipitation in the extra-Carpathian regions of Romania. Theor. Appl. Climatol. 2013, 112, 597–607. [Google Scholar] [CrossRef]
  24. Dascălu, S.I.; Gothard, M.; Bojariu, R.; Birsan, M.-V.; Cică, R.; Vintilă, R.; Adler, M.-J.; Chendeș, V.; Mic, R.-P. Drought-related variables over the Bârlad basin (Eastern Romania) under climate change scenarios. CATENA 2016, 141, 92–99. [Google Scholar] [CrossRef]
  25. Ionita, M.; Scholz, P.; Chelcea, S. Assessment of droughts in Romania using the Standardized Precipitation Index. Nat. Hazards 2016, 81, 1483–1498. [Google Scholar] [CrossRef]
  26. Paltineanu, C.; Mihailescu, I.F.; Prefac, Z.; Dragota, C.; Vasenciuc, F.; Claudia, N. Combining the standardized precipitation index and climatic water deficit in characterizing droughts: A case study in Romania. Theor. Appl. Climatol. 2009, 97, 219–233. [Google Scholar] [CrossRef]
  27. Stefan, S.; Ghioca, M.; Rimbu, N.; Boroneant, C. Study of meteorological and hydrological drought in southern Romania from observational data. Int. J. Climatol. 2004, 24, 871–881. [Google Scholar] [CrossRef]
  28. Chelcea, S.M.; Aldea, A.A.; Trifu, M.C. An Assessment of Low Flow and Water Deficits on the Danube and Romanian Rivers During 1980–2020. In Modeling and Monitoring Extreme Hydrometeorological Events; IGI Global Scientific Publishing: Hershey, PA, USA, 2024; pp. 185–229. [Google Scholar] [CrossRef]
  29. Drobot, R.; Draghia, A.F.; Sîrbu, N.; Dinu, C. Synthetic Drought Hydrograph. Hydrology 2023, 10, 10. [Google Scholar] [CrossRef]
  30. Pravalie, R.; Sîrodoev, I.; Peptenatu, D. Changes in the forest ecosystems in areas impacted by aridization in south-western Romania. J. Environ. Health Sci. Eng. 2014, 12, 2. [Google Scholar] [CrossRef]
  31. Nasiri, V.; Sadeghi, S.M.M.; Moradi, F.; Afshari, S.; Deljouei, A.; Griess, V.C.; Maftei, C.; Borz, S.A. The Influence of Data Density and Integration on Forest Canopy Cover Mapping Using Sentinel-1 and Sentinel-2 Time Series in Mediterranean Oak Forests. ISPRS Int. J. Geo-Inf. 2022, 11, 423. [Google Scholar] [CrossRef]
  32. Cheval, S.; Dumitrescu, A. The summer surface urban heat island of Bucharest (Romania) retrieved from MODIS images. Theor. Appl. Climatol. 2015, 121, 631–640. [Google Scholar] [CrossRef]
  33. Vorovencii, I. Assessing and monitoring the risk of desertification in Dobrogea, Romania, using Landsat data and decision tree classifier. Environ. Monit. Assess. 2015, 187, 204. [Google Scholar] [CrossRef]
  34. Angearu, C.-V.; Ontel, I.; Boldeanu, G.; Mihailescu, D.; Nertan, A.; Craciunescu, V.; Catana, S.; Irimescu, A. Multi-Temporal Analysis and Trends of the Drought Based on MODIS Data in Agricultural Areas, Romania. Remote Sens. 2020, 12, 23. [Google Scholar] [CrossRef]
  35. Vicente-Serrano, S.M.; Juez, C.; Potopová, V.; Boincean, B.; Murphy, C.; Domínguez-Castro, F.; Eklundh, L.; Peña-Angulo, D.; Noguera, I.; Jin, H.; et al. Drought Risk in Moldova under Global Warming and Possible Crop Adaptation Strategies. Ann. N. Y. Acad. Sci. 2024, 1538, 144–161. [Google Scholar] [CrossRef]
  36. Páscoa, P.; Gouveia, C.M.; Russo, A.C.; Bojariu, R.; Vicente-Serrano, S.M.; Trigo, R.M. Drought Impacts on Vegetation in Southeastern Europe. Remote Sens. 2020, 12, 2156. [Google Scholar] [CrossRef]
  37. Badaluta, C.A.; Haliuc, A.; Badaluta, G.; Scriban, R.E. Spatiotemporal variability of drought in Romania during 1901-2021 using the Standardized Precipitation Evapotranspiration Index (SPEI). Analele Univ. Din Oradea Ser. Geogr. 2024, 1, 33–43. [Google Scholar] [CrossRef]
  38. Angearu, C.V.; Irimescu, A.; Mihailescu, D.; Virsta, A. Evaluation of droughts and fires in the Dobrogea region, using Modis satellite data, Agriculture for Life Life for Agriculture. Conf. Proc. 2018, 1, 336–345. [Google Scholar]
  39. Abdourahamane, Z.S.; Garba, I.; Gambo Boukary, A.; Mirzabaev, A. Spatiotemporal Characterization of Agricultural Drought in the Sahel Region Using a Composite Drought Index. J. Arid. Environ. 2022, 204, 104789. [Google Scholar] [CrossRef]
  40. Maftei, C.; Barbulescu, A. Statistical Analysis of Precipitation Time Series in the Dobrudja Region. Mausam 2012, 63, 553–564. [Google Scholar] [CrossRef]
  41. Roşu, L.; Macarov, L.I. Management of Drought and Floods in the Dobrogea Region. In Extreme Weather and Impacts of Climate Change on Water Resources in the Dobrogea Region; IGI Global: Hershey, PA, USA, 2015; pp. 403–443. ISBN 978-1-4666-8438-6. [Google Scholar]
  42. Ciulache, S.; Torica, V. Dobrudja ’s climate (in Romanian), Annals of the University of Bucharest. Geogr. Ser. 2003, 17, 83–105. [Google Scholar]
  43. Posea, G.; Bogdan, O.; Zăvoianu, I. (Eds.) Geography of Romania. In The Romanian Plain, Danube, Dobrudja Platou, The Romanian Black Sea Seaside and the Continental Platform (in Romanian); Romanian Academy Printing House: Bucharest, Romania, 2005; Volume 5. [Google Scholar]
  44. Bandoc, G.; Pravalie, R. Climatic water balancedynamics over the last five decades in Romania’smost arid region, Dobrogea. J. Geogr. Sci. 2015, 25, 1307–1327. [Google Scholar] [CrossRef]
  45. Mitrică, B.; Mateescu, E.; Dragotă, C.S.; Grigorescu, I.; Dumitraşcu, M.; Popovici, E.A. Climatechange impacts on agricultural crops in the Timiş Plain, Romania. Rom. Agric. Res. 2015, 32, 93–101. [Google Scholar]
  46. Lup, A.; Miron, L. Drought Management in the Agriculture of Dobrogea Province, MPRA Paper 53403; University Library of Munich: Munich, Germany, 2013. [Google Scholar]
  47. Chelcea, S.; Ionita, M.; Adler, M.-J. Identification of Dry Periods in the Dobrogea Region. In Extreme Weather and Impacts of Climate Change on Water Resources in the Dobrogea Region; IGI Global: Hershey, PA, USA, 2015; pp. 52–72. ISBN 978-1-4666-8438-6. [Google Scholar]
  48. Ionita, M.; Chelcea, S. Spatio-Temporal Variability of Seasonal Drought over the Dobrogea Region. In Extreme Weather and Impacts of Climate Change on Water Resources in the Dobrogea Region; IGI Global: Hershey, PA, USA, 2015; pp. 17–51. ISBN 978-1-4666-8438-6. [Google Scholar]
  49. Maftei, C.; Buta, C.; Carazeanu Popovici, I. The Impact of Human Interventions and Changes in Climate on the Hydro-Chemical Composition of Techirghiol Lake (Romania). Water 2020, 12, 2261. [Google Scholar] [CrossRef]
  50. Balteanu, D.; Șerban, M. Global environmental changes. In An Interdisciplinary Evaluation of Uncertainties; Coresi Printing House: Bucharest, Romania, 2005. (In Romanian) [Google Scholar]
  51. Google Earth Engine (GEE) Platform. Available online: https://developers.google.com/earth-engine/datasets/ (accessed on 10 May 2024).
  52. Funk, C.; Peterson, P.; Landsfeld, M.; Pedreros, D.; Verdin, J.; Shukla, S.; Husak, G.; Rowland, J.; Harrison, L.; Hoell, A. The climate hazards infrared precipitation with stations—A new environmental record for monitoring extremes. Sci. Data 2015, 2, 150066. [Google Scholar] [CrossRef] [PubMed]
  53. Javed, T.; Li, Y.; Rashid, S.; Li, F.; Hu, Q.; Feng, H.; Chen, X.; Ahmad, S.; Liu, F.; Pulatov, B. Performance and relationship of four different agricultural drought indices for drought monitoring in China’s mainland using remote sensing data. Sci. Total Environ 2021, 759, 143530. [Google Scholar] [CrossRef] [PubMed]
  54. Won, J.; Choi, J.; Lee, O.; Kim, S. Copula-based Joint Drought Index using SPI and EDDI and its application to climate change. Sci. Total Environ 2020, 744, 140701. [Google Scholar] [CrossRef]
  55. Achour, K.; Meddi, M.; Zeroual, A.; Bouabdelli, S.; Maccioni, P.; Moramarco, T. Spatio-temporal analysis and forecasting of drought in the plains of northwestern Algeria using the standardized precipitation index. J. Earth Syst. Sci. 2020, 129, 42. [Google Scholar] [CrossRef]
  56. Guttman, N.B. Comparing the palmer drought index and the standardized precipitation index 1. JAWRA J. Am. Water Resour. Assoc. 1998, 34, 113–121. [Google Scholar] [CrossRef]
  57. Mpelasoka, F.; Hennessy, K.; Jones, R.; Bates, B. Comparison of suitable drought indices for climate change impacts assessment over Australia towards resource management. Int. J. Climatol. 2008, 28, 1283–1292. [Google Scholar] [CrossRef]
  58. Yevjevich, V.M. An Objective Approach to Definitions and Investigations of Continental Hydrologic Droughts. In Hydrology Papers; Colorado State University: Denver, CO, USA, 1967. [Google Scholar]
  59. Malik, A.; Kumar, A.; Salih, S.Q.; Yaseen, Z.M. Hydrological Drought Investigation Using Streamflow Drought Index. In Intelligent Data Analytics for Decision-Support Systems in Hazard Mitigation: Theory and Practice of Hazard Mitigation; Springer: Berlin/Heidelberg, Germany, 2021; pp. 63–88. [Google Scholar]
  60. Aiyelokun, O.; Ogunsanwo, G.; Ojelabi, A.; Agbede, O. Gaussian Naïve Bayes Classification Algorithm for Drought and Flood Risk Reduction. In Intelligent Data Analytics for Decision-Support Systems in Hazard Mitigation: Theory and Practice of Hazard Mitigation; Springer: Berlin/Heidelberg, Germany, 2021; pp. 49–62. [Google Scholar]
  61. Chen, S.; Li, Q.; Zhong, W.; Wang, R.; Chen, D.; Pan, S. Improved monitoring and assessment of meteorological drought based on multi-source fused precipitation data. Int. J. Environ. Res. Public Health 2022, 19, 1542. [Google Scholar] [CrossRef]
  62. Yang, T.; Zhang, W.; Zhou, T.; Wu, W.; Liu, T.; Sun, C. Plant phenomics & precision agriculture simulation of winter wheat growth by the assimilation of unmanned aerial vehicle imagery into the WOFOST model. PLoS ONE 2021, 16, e0246874. [Google Scholar]
  63. Araujo, J.; Born, D.G. Calculating percentage agreement correctly but writing its formula incorrectly. Behav. Anal. 1985, 8, 207. [Google Scholar] [CrossRef]
  64. SPI Generator. Available online: https://drought.unl.edu/monitoring/SPI/SPIProgram.aspx (accessed on 10 July 2024).
  65. Bayissa, Y.; Tadesse, T.; Demisse, G. Building a High-Resolution Vegetation Outlook Model to Monitor Agricultural Drought for the Upper Blue Nile Basin, Ethiopia. Remote Sens. 2019, 11, 371. [Google Scholar] [CrossRef]
  66. Beguería, S.; Vicente Serrano, S.M. SPEI Calculator; Digital.CSIC: Madrid, Spain, 2009. [Google Scholar] [CrossRef]
  67. Pazhanivelan, S.; Geethalakshmi, V.; Samykannu, V.; Kumaraperumal, R.; Kancheti, M.; Kaliaperumal, R.; Raju, M.; Yadav, M.K. Evaluation of SPI and Rainfall Departure Based on Multi-Satellite Precipitation Products for Meteorological Drought Monitoring in Tamil Nadu. Water 2023, 15, 1435. [Google Scholar] [CrossRef]
  68. Gulacsi, A.; Kovacs, F. Drought monitoring with spectral indices calculated from MODIS satellite images in Hungary. J. Environ. Geog. 2015, 8, 11–20. [Google Scholar] [CrossRef]
  69. Popescu, A.; Dinu, T.A.; Stoian, E.; Serban, V. Variation of the main agricultural crops yield due to drought in Romania and Dobrogea region in the period 2000–2019, Scientific Papers Series Management. Econ. Eng. Agric. Rural. Dev. 2020, 20, 397–416. [Google Scholar]
  70. Serban, C.; Maftei, C.; Dobrică, G. Surface Water Change Detection via Water Indices and Predictive Modeling Using Remote Sensing Imagery: A Case Study of Nuntasi-Tuzla Lake, Romania. Water 2022, 14, 556. [Google Scholar] [CrossRef]
  71. Ionita, M.; Tallaksen, L.M.; Kingston, D.G.; Stagge, J.H.; Laaha, G.; Van Lanen, H.A.J.; Scholz, P.; Chelcea, S.M.; Haslinger, K. The European 2015 drought from a climatological perspective. Hydrol. Earth Syst. Sci. 2017, 21, 1397–1419. [Google Scholar] [CrossRef]
  72. Păltineanu, C.; Mihăilescu, I.F.; Seceleanu, I. Dobrogea: Pedoclimatic Conditions, Consumption and Irrigation Water Requirements of the Main Agricultural Crops (in Romanian); Ex Ponto: Constanta, Romania, 2000. [Google Scholar]
  73. Pedro-Monzonís, M.; Solera, A.; Ferrer, J.; Estrela, T.; Paredes-Arquiola, J. A review of water scarcity and drought indexes in water resources planning and management. J. Hydrol. 2015, 527, 482–493. [Google Scholar] [CrossRef]
  74. EDO Web Portal. Available online: https://edo.jrc.ec.europa.eu/edov2/php/index.php?id=1051 (accessed on 15 October 2024).
Figure 1. Schematization of the methodology.
Water 17 00481 g001
Figure 2. Study area; the stations used in this study are marked with stars (see also Table 1).
Water 17 00481 g002
Figure 3. Scatterplots of in situ SPI and estimated SPI: (a) SPI-1i, Constanta, (b) SPI-1i, Tulcea, (c) SPI-1c, Constanta, and (d) SPI-1c, Tulcea.
Water 17 00481 g003
Figure 4. Long-term dry season mean LST-3 (°C) over Dobrogea.
Water 17 00481 g004
Figure 5. Long-term dry season mean NDVI-3 over Dobrogea.
Water 17 00481 g005
Figure 6. Long-term dry season average SPI-3 over Dobrogea.
Water 17 00481 g006
Figure 7. Spatiotemporal patterns of SPI-3 over the study area during the period from 2001 to 2021. Identified dry conditions: severe to extreme (2020), severe (2011, 2012, 2015, 2016, 2019, and 2021), moderate to severe (2001, 2007, and 2008), mild to moderate (2017 and 2018), and mild (2014).
Water 17 00481 g007
Figure 8. Long-term dry season average CDI-3 over Dobrogea.
Water 17 00481 g008
Figure 9. LST-1 and NDVI-1 for the dry season (July–September) in 2011, 2012, and 2020.
Water 17 00481 g009
Figure 10. Spatiotemporal patterns of CDI-3 over the study area during the period 2001–2021. Identified dry conditions: critical to extreme (2011, 2012, 2020), severe (2015, 2016, 2019, and 2021), moderate to severe (2001, 2007, and 2008), mild to moderate (2017 and 2018), and mild (2014).
Water 17 00481 g010
Figure 11. The correlation coefficient between CDI-3 and in situ SPI-3 at meteorological stations during the dry season (July–September) from 2001 to 2021.
Water 17 00481 g011
Figure 12. Scatterplots of seasonal CDI-3 and in situ SPI-3 from 2001 to 2021 for weather stations (a) Constanta, (b) Tulcea, (c) Mangalia, and (d) Medgidia.
Water 17 00481 g012
Figure 13. Spatial distribution of Pearson’s correlation between CDI-3 and SPI-3 during the dry season (July–September) in Dobrogea.
Water 17 00481 g013
Figure 14. Scatterplots of seasonal in situ SPEI-3 and in situ SPI-3 from 2001 to 2021 for weather stations (a) Constanta, (b) Tulcea, and (c) Mangalia. (d) Correlation graph of average satellite-based SPEI-3 and SPI-3 for 2001–2021.
Water 17 00481 g014
Figure 15. Scatterplots of seasonal in situ SPEI-3 and in situ CDI-3 from 2001 to 2021 for weather stations (a) Constanta, (b) Tulcea, and (c) Mangalia. (d) Correlation graph of average satellite-based CDI-3 and SPEI-3 for 2001–2021.
Water 17 00481 g015
Figure 16. Drought frequency for ground stations from 2001 to 2021.
Water 17 00481 g016
Figure 17. Drought duration (in months) for ground stations during the years 2001 to 2021.
Water 17 00481 g017
Figure 18. Comparison of the frequency of drought classes between CDI-1 and in situ SPI-1.
Water 17 00481 g018
Table 2. Drought severity levels by the CDI.
CDIDrought Severity Categories
>0.5No drought
0.4–0.5Near Normal
0.3–0.4Mild
0.2–0.3Moderate
0.1–0.2Severe
0.03–0.1Critical
≤0.03Extreme
Table 3. Drought severity levels by the SPI.
SPIDrought Severity Level
≥2Extremely Wet
1.50–1.99Severely Wet
1.00–1.49Moderately Wet
−0.99–0.99Nearly Normal
−1.49–−1.0Moderate Drought
−1.99–−1.5Severe Drought
≤−2Extreme Drought
Table 4. Statistical evaluation metrics used to validate satellite products.
MetricEquation Interpretation
Pearson Correlation
Coefficient (r)
r = i = 1 n ( x i x ¯ ) ( y i y ¯ ) i = 1 n ( x i x ¯ ) 2 i = 1 n ( y i y ¯ ) 2 (14)r takes values from 1.0 to −1.0, meaning a positive to negative strong linear correlation; a zero or near-zero value indicates no correlation among the variables [61].
where n represents the number of samples, xi/yi are the ith value of the measured/estimated samples, and x ¯ and y ¯ are the average of the measured and estimated values of all samples.
Strong correlations have the following values:
-
Positive (0.5 to 1.0) and negative (−0.5 to −1.0).
Medium correlations have the following values:
-
Positive (0.3 to 0.5) and negative (−0.3 to −0.5).
Small correlations have the following values:
-
Positive (0.1 to 0.3) and negative (−0.1 to −0.3).
Root Mean Square Error (RMSE) R M S E = 1 n i = 1 n ( y i x i ) 2 (15)The lower the value, the better the central tendencies and the smaller the errors. A value of zero is the perfect outcome [61].
Normalized Root Mean Square Error (NRMSE) N R M S E = 100 × R M S E x ¯ For a model, smaller values show reduced residual variance [62].
Agreement (%) A g r e e m e n t = 100 × 1 R M S E / x ¯ Values close to 100% suggest strong agreement; values closer to 0% show the least agreement [63].
Table 5. Statistical assessment of annual satellite precipitation for the period 2001–2021.
Weather StationConstantaTulceaMedgidiaMangaliaAdamclisi
IndexGPM IMERG
r0.900.950.700.770.70
RMSE7.976.2010.2011.7310.36
NRMSE19.714.625.027.722.20
Agreement80.385.475.072.377.8
CHIRPS
r0.850.840.580.710.55
RMSE6.166.1210.458.6610.73
NRMSE15.214.425.420.423.0
Agreement84.885.674.679.677.0
Table 6. The area under different categories of droughts during the years 2001 to 2021.
Year/DroughtMildModerateSevereCriticalExtreme
200124.89%33.88%26.67%11.00%0.77%
20020.18%0.08%0.02%0.02%0.00%
20033.66%0.08%0.03%0.02%0.01%
20040.11%0.05%0.03%0.00%0.00%
20050.08%0.05%0.04%0.00%0.00%
200622.87%4.85%0.05%0.03%0.01%
200716.77%77.95%4.66%0.02%0.02%
200812.58%19.88%36.10%3.59%0.01%
200934.49%14.20%0.09%0.02%0.01%
201030.01%0.21%0.05%0.03%0.01%
20110.42%2.86%62.14%34.07%0.22%
20121.28%20.19%41.04%34.74%2.38%
20139.23%0.20%0.00%0.00%0.01%
201460.99%24.33%0.75%0.01%0.00%
20150.54%4.42%94.56%0.06%0.00%
201611.03%25.09%50.05%13.24%0.01%
201743.42%43.66%7.70%0.02%0.00%
201814.25%62.00%11.23%0.05%0.01%
20198.97%14.77%43.02%15.79%0.13%
20200.30%0.71%2.68%21.83%74.22%
20217.07%16.88%66.46%9.13%0.05%
Table 7. Drought probability of occurrence for ground stations under CDI-1 from 2001 to 2021.
StationMild DroughtModerate DroughtSevere DroughtCritical to
Extreme Drought
Constanta52%42%6%0
Tulcea41%52%7%0
Medgidia38%45%17%1%
Table 8. Drought characteristics for ground stations under CDI-1 during the years 2001 to 2021.
StationTotal MonthsNo. of Drought MonthsDrought (%)Longest Drought PeriodLongest Drought Duration (Months)SeverityIntensity
Constanta25217971.03%July 2018 to August 2019141.360.10
Tulcea25217870.63%February 2019 to November 2020222.810.13
Medgidia25219276.19%August 2018 to June 2020223.410.16
Disclaimer/Publisher’s Note: The statements, opinions and data contained in all publications are solely those of the individual author(s) and contributor(s) and not of MDPI and/or the editor(s). MDPI and/or the editor(s) disclaim responsibility for any injury to people or property resulting from any ideas, methods, instructions or products referred to in the content.

