Article

Enhanced Groundwater Aeration with a Geometrically Constrained Vortex

by
Roman Klymenko
1,2,*,
Leticia Cerutti
3,
Marcos B. A. Colombo
4,
Elmar C. Fuchs
1,5,
Jakob Woisetschläger
6,
Wilfred F. L. M. Hoeben
2 and
Luewton L. F. Agostinho
1,4
1
Wetsus, European Centre of Excellence for Sustainable Water Technology, 8911 MA Leeuwarden, The Netherlands
2
Electrical Energy Systems Group, Department of Electrical Engineering, Eindhoven University of Technology, 5612 AP Eindhoven, The Netherlands
3
Department of Civil Engineering, Center of Science and Technology, Federal University of Viçosa, Viçosa 36570-900, Brazil
4
Water Technology Research Group, NHL Stenden University of Applied Sciences, 8917 DD Leeuwarden, The Netherlands
5
Optical Sciences Group, Faculty of Science and Technology (TNW), University of Twente, 7522 NB Enschede, The Netherlands
6
Laser Optical Metrology Group, Institute of Thermal Turbomachinery and Machine Dynamics, Graz University of Technology, A-8010 Graz, Austria
*
Author to whom correspondence should be addressed.
Water 2025, 17(4), 506; https://doi.org/10.3390/w17040506
Submission received: 6 December 2024 / Revised: 24 January 2025 / Accepted: 7 February 2025 / Published: 11 February 2025

Abstract

:
This paper presents an experimental study comparing the aeration efficiencies of hyperbolic funnels and a cylindrical reactor, focusing on key parameters such as dissolved oxygen (DO) concentration, standard oxygen transfer rate (SOTR20), and standard aeration efficiency (SAE). The unique geometry of the hyperbolic funnel induces a helical water flow, which expands the gas–liquid interfacial area within the water vortex, thereby enhancing aeration efficiency via vortex dynamics. The cylindrical reactor forms larger water “umbrellas” at its outlet due to increased internal water pressure, specifically optimizing the umbrella-driven aeration. The study also evaluated a three-funnel cascade system, demonstrating that a single funnel operating in the umbrella regime is more aeration-efficient than multiple funnels in cascade, as additional funnels reduce the SAE, due to the increased pumping height required. Further experiments using 3D-printed funnels investigated the influence of outlet diameter on flow rates and aeration efficiency. Our results indicated that larger outlet diameters allowed higher flow rates and umbrella sizes, yielding a superior aeration efficiency and outperforming all other reactors tested. The study also highlights the importance of funnel positioning relative to the water reservoir, which significantly influences both the SOTR20 and SAE. For the reactor investigated, a height of 75 cm was optimal for balancing both parameters. Whereas the SOTR20 values of the lab reactors were lower than those of commercial systems, due to the lower flow rates, the SAE values were notably high, surpassing those of mechanical aeration systems. Our findings suggest that hyperbolic funnels are a promising and highly efficient alternative for wastewater and groundwater aeration, with a strong potential for scalability.

1. Introduction

Helical flow structures, as natural phenomena, provide an efficient and cost-effective approach to tackling industrial challenges [1]. This study focuses on leveraging these structures, particularly in the context of hyperbolic funnels, for improved water aeration. Early in the 20th century, Austrian forester and philosopher Viktor Schauberger recognized this fact. He believed that humans should “understand and copy nature” instead of working against it. Building on his father’s work, Viktor’s son, Walter Schauberger, advanced new technologies based on this principle and created water vortices for various applications, including drinking water treatment, industrial processes, pond and watercourse restoration, and river regulation [2,3]. One of his concepts that has gained considerable attention recently is water aeration using a hyperbolic funnel, which generates a vortex solely through the flow of water, without mechanical stirring devices [4,5]. This method has also been proven effective for oxidizing iron in groundwater [6].
In the Netherlands, large quantities of drinking water are sourced from underground reserves, where iron concentrations can reach several tens of milligrams per liter [7], far exceeding the acceptable standard of 0.2 mg·L−1 [8]. Aeration is commonly used in drinking water plants to reduce iron levels by increasing dissolved oxygen (DO) subsequent oxidation of highly soluble (and toxic) ferrous ( F e 2 + ) compounds to less soluble ferric ( F e 3 + ) compounds. Additionally, aeration helps remove unwanted gases and substances [9]. Traditional aeration techniques include cascades, towers, spray systems, and plate aeration [10,11]. These methods are energy-intensive and consume 50% to 90% of the total energy used in treatment facilities, accounting for up to 40% of operational budgets [12,13].
The hyperbolic funnel, with its geometry enabling enhanced gas–liquid interaction and resistance to clogging, presents an efficient and cost-effective alternative to conventional aeration methods. Various parameters are used to characterize this system, such as water flow rate, hydraulic retention time (HRT), residence time distribution (RTD), the oxygen volumetric liquid-phase mass transfer coefficient ( K L a ), the standard oxygen transfer rate at 20 °C (SOTR20), and standard aeration efficiency (SAE). These parameters are essential for assessing the technology’s effectiveness, feasibility, and mixing properties [14,15,16].
It has been shown that a free surface vortex (FSV) reveals flow patterns similar to Taylor–Couette flow principles when the air core is modeled as a rotating inner cylinder [17]. Other studies [18,19] have demonstrated theoretically and experimentally that a water vortex in a hyperbolic funnel also contains secondary flows with Taylor-like vortices that enhance advection in the bulk liquid [15], which apparently include the boundary layers more strongly than FSVs, leading to increased gas dissolution and, consequently, improved mixing, highlighting the aeration potential of hyperbolically confined water vortices [4,5]. Given their energy-efficient operation, these systems show promise as alternatives to traditional aeration methods, offering applications in groundwater treatment, river engineering, and innovative fields like plasma discharge technologies for micro-pollutant degradation [20].
While there is growing interest in vortex-induced gas dissolution, key mechanisms—such as the influence of reactor geometries on aeration efficiency—remain insufficiently understood. It has been shown that water vortices in hyperbolic funnels can form at least four distinct regimes—twisted, straight, restricted, and minimal air—each with different characteristics, such as interface areas, hydraulic retention times, and oxygen dissolution rates. Among these, the twisted and straight regimes have demonstrated the most effective aeration properties [5,21]. However, further research is needed to optimize these systems and fully understand the mechanisms behind their operation.
The purpose of this work is to explore and demonstrate the use of different reactor geometries for efficient water-vortex aeration. Furthermore, it investigates the impact of the water “umbrella”, a rotating bell-shaped thin film of water that can form at the outlet of a hyperbolic funnel. This study provides insights into the geometric parameters of hyperbolic reactors influencing aeration efficiency and water treatment capacity. These findings can contribute to the development of energy-efficient and sustainable aeration methods, paving the way for advancements in groundwater treatment technologies.

2. Materials and Methods

The experimental methods and protocols are thoroughly detailed in [4]. Additionally, detailed video instructions are available in [4], providing clarification on the principles and operational methods of the reactor. The setup is illustrated in Figure 1. Groundwater is pumped into the reactor (12, 13) by pump 1 through control valves (10, 11), which regulate the water flow rate, as measured by the flow meters (8, 9). The groundwater enters the reactor tangentially, creating a vortex due to the combined effects of the reactor’s hyperbolic and cylindrical shapes and the helical flow of the water. Upon exiting the reactor, the water continues in a helical flow, expanding to form a water “umbrella” (Figure 2). This “umbrella” configuration, characterized by a very thin rotating water film, significantly increases the gas–liquid interfacial area, thereby enhancing the aeration. However, if the reactor outlet is connected to a hose, the umbrella cannot form, and aeration occurs solely at the interface of the water vortex.
Four different configurations were tested: a hyperbolic glass funnel (Figure 2a) and a cylindrical reactor (Figure 2b), both with and without the umbrella, to investigate the individual effects of the vortex and the umbrella. A cascade funnel setup (Figure 3) was investigated to assess the impact of multiple vortex reactors arranged in sequence, with the objective of evaluating the scalability potential. Additionally, a 3D-printed hyperbolic funnel, comprising five removable sections (Figure 4), was tested to examine the influence of varying outlet diameters on the water flow rate, umbrella size, and aeration efficiency.
Figure 1a illustrates the configuration of the experimental setup without the umbrella. In this setup, groundwater enters the reactor (12) tangentially, and the reactor’s outlet is connected to a hose leading to a drain (14), preventing formation of the umbrella. In this configuration, the DO concentration was measured immediately before the reactor’s inlet and after the reactor’s outlet (2, 3).
In the setup employing the umbrella configuration (Figure 1b), the reactor’s outlet was positioned above a water reservoir (16). This configuration allowed umbrella formation (17). The reservoir was connected to a drain (15). In this setup, the DO was measured before the reactor’s inlet (4) and after the water reservoir (5). Because DO saturation concentration is dependent on water temperature, this parameter was measured at all points where DO was recorded. The DO measurements were conducted for a minimum of 10 min once the system reached stability, with a sampling frequency of 1 Hz. The measurements were conducted on two separate days, to assess the potential impact of varying atmospheric conditions on the results. This approach provided a large sample size and minimal standard deviation, ensuring the reliability of the measurements. In some cases, the standard deviation was so small that the error bars appear to be absent, but are in fact hidden behind the data marker.
The hyperbolic glass funnel had an upper cylindrical part with a diameter of 30 cm and an outlet diameter of 1.8 cm. The cylindrical part was 12 cm in length, while the hyperbolic section was 80 cm long. The funnel inlet was located just above the hyperbolic section. In the umbrella configuration, the funnel inlet was positioned 150 cm above the bottom of the reservoir, and the funnel’s outlet was 70 cm above the reservoir bottom. The cylindrical reactor was designed and constructed with the same diameter as the funnel’s cylindrical Section (30 cm), with the outlet diameter, distances between the inlet and outlet, and the distance to the bottom of the water reservoir matching those of the funnel.
The cascade funnel setup (Figure 3) consisted of three 3D-printed funnels, each with a length of 26 cm and an inlet and outlet diameter of 6 mm. DO measurements were conducted in the same manner as described in Figure 1. The setup was tested under various configurations: (1) one funnel, two funnels, and three funnels without an umbrella; (2) one funnel with an umbrella; and (3) two funnels without an umbrella connected to a third funnel with an umbrella.
Figure 2c illustrates the umbrella production with a 3D-printed hyperbolic funnel (Figure 4). The upper section of the funnel included a 20 cm cylindrical part and a 10 cm hyperbolic part, with each subsequent section measuring 10 cm in length. This modular design allowed testing the influence of different outlet diameters on the water flow rate, the size of the umbrella, and the aeration rate. This reactor was only tested under umbrella formation. Experiments were conducted at three different distances between the funnel’s inlet and the bottom of the water reservoir: 150 cm (the same as for the glass funnel and cylindrical reactor), 75 cm, and 40 cm, to investigate the effect of the distance of the free-falling umbrella on the aeration properties.
The performance of the reactors was evaluated based on the DO concentration, SOTR20, and SAE, as detailed in [4]. The SOTR20 was calculated using Equations (1) and (2) [4]:
K L a 20 = φ V · θ T 20 · ln c S c in c S c out ,
S O T R 20 = K L a 20 · C S 20 · V = φ · C S 20 θ T 20 · l n ( C S C i n C S C o u t ) ,
where K L a 20 is the volumetric liquid-phase mass transfer coefficient normalized to 20 °C, C S 20 is the DO concentration at saturation for a temperature of 20 °C, V represents the liquid volume in the reactor, φ is the water flow rate per hour, θ is the temperature correction factor, which is 1.024 for DO in water, T is the water temperature, C S is the DO concentration at saturation for the water at temperature T, C i n is the DO concentration in the feed, and C o u t is the DO concentration in the effluent.
The SAE represents the efficiency of the system and can be calculated as the ratio between SOTR20 and the power consumed. The energy required to pump water was determined using Equation (3):
E = m · g · h ,
where m is the mass of groundwater to be pumped, g is the acceleration due to Earth’s gravity, equal to 9.81 m·s−2, and h is the height to which the water must be pumped. According to [22,23], for relatively large flows, pump efficiency typically ranges between 70% and 90%. In this study, a pump efficiency of 70% was used. Since SAE is evaluated in kg·O2·kWh−1, the mass of water to be pumped corresponds to the water flow rate per hour, and the power is calculated by converting the energy from Equation (3) from joules (J) to kilowatt-hours (kWh) and then multiplying by the pump efficiency:
S A E = S O T R 20 P = S O T R 20 · 3.6 · 10 6 E · η ,
where P represents the power of a pump, 3.6 · 10 6 is the conversion factor between J and kWh, and η represents the pump efficiency, which was approximately 70% in our case.
During the experiments, the umbrella diameter was measured optically. The reactor water volume was determined by collecting and measuring the water immediately after stopping the inflow. The area of the hyperbolic vortex, defined by the equation
y = C x ,
and bounded by two radii, R 1 (at the outlet) and R 2 (at the upper part), was calculated using the formula for the area under the curve between these bounds:
S v = C · ln R 2 R 1
The constant C was determined by solving the following system of equations:
y 1 = C R 1 , y 2 = C R 2 ,
where y 1 , R 1 , y 2 , and R 2 are the coordinates representing the upper and lower parts of the curve that define the hyperbolic vortex. From this system, C is calculated as
C = h · R 2 · R 1 R 2 R 1 ,
where h is the total height of the water vortex.

3. Results and Discussion

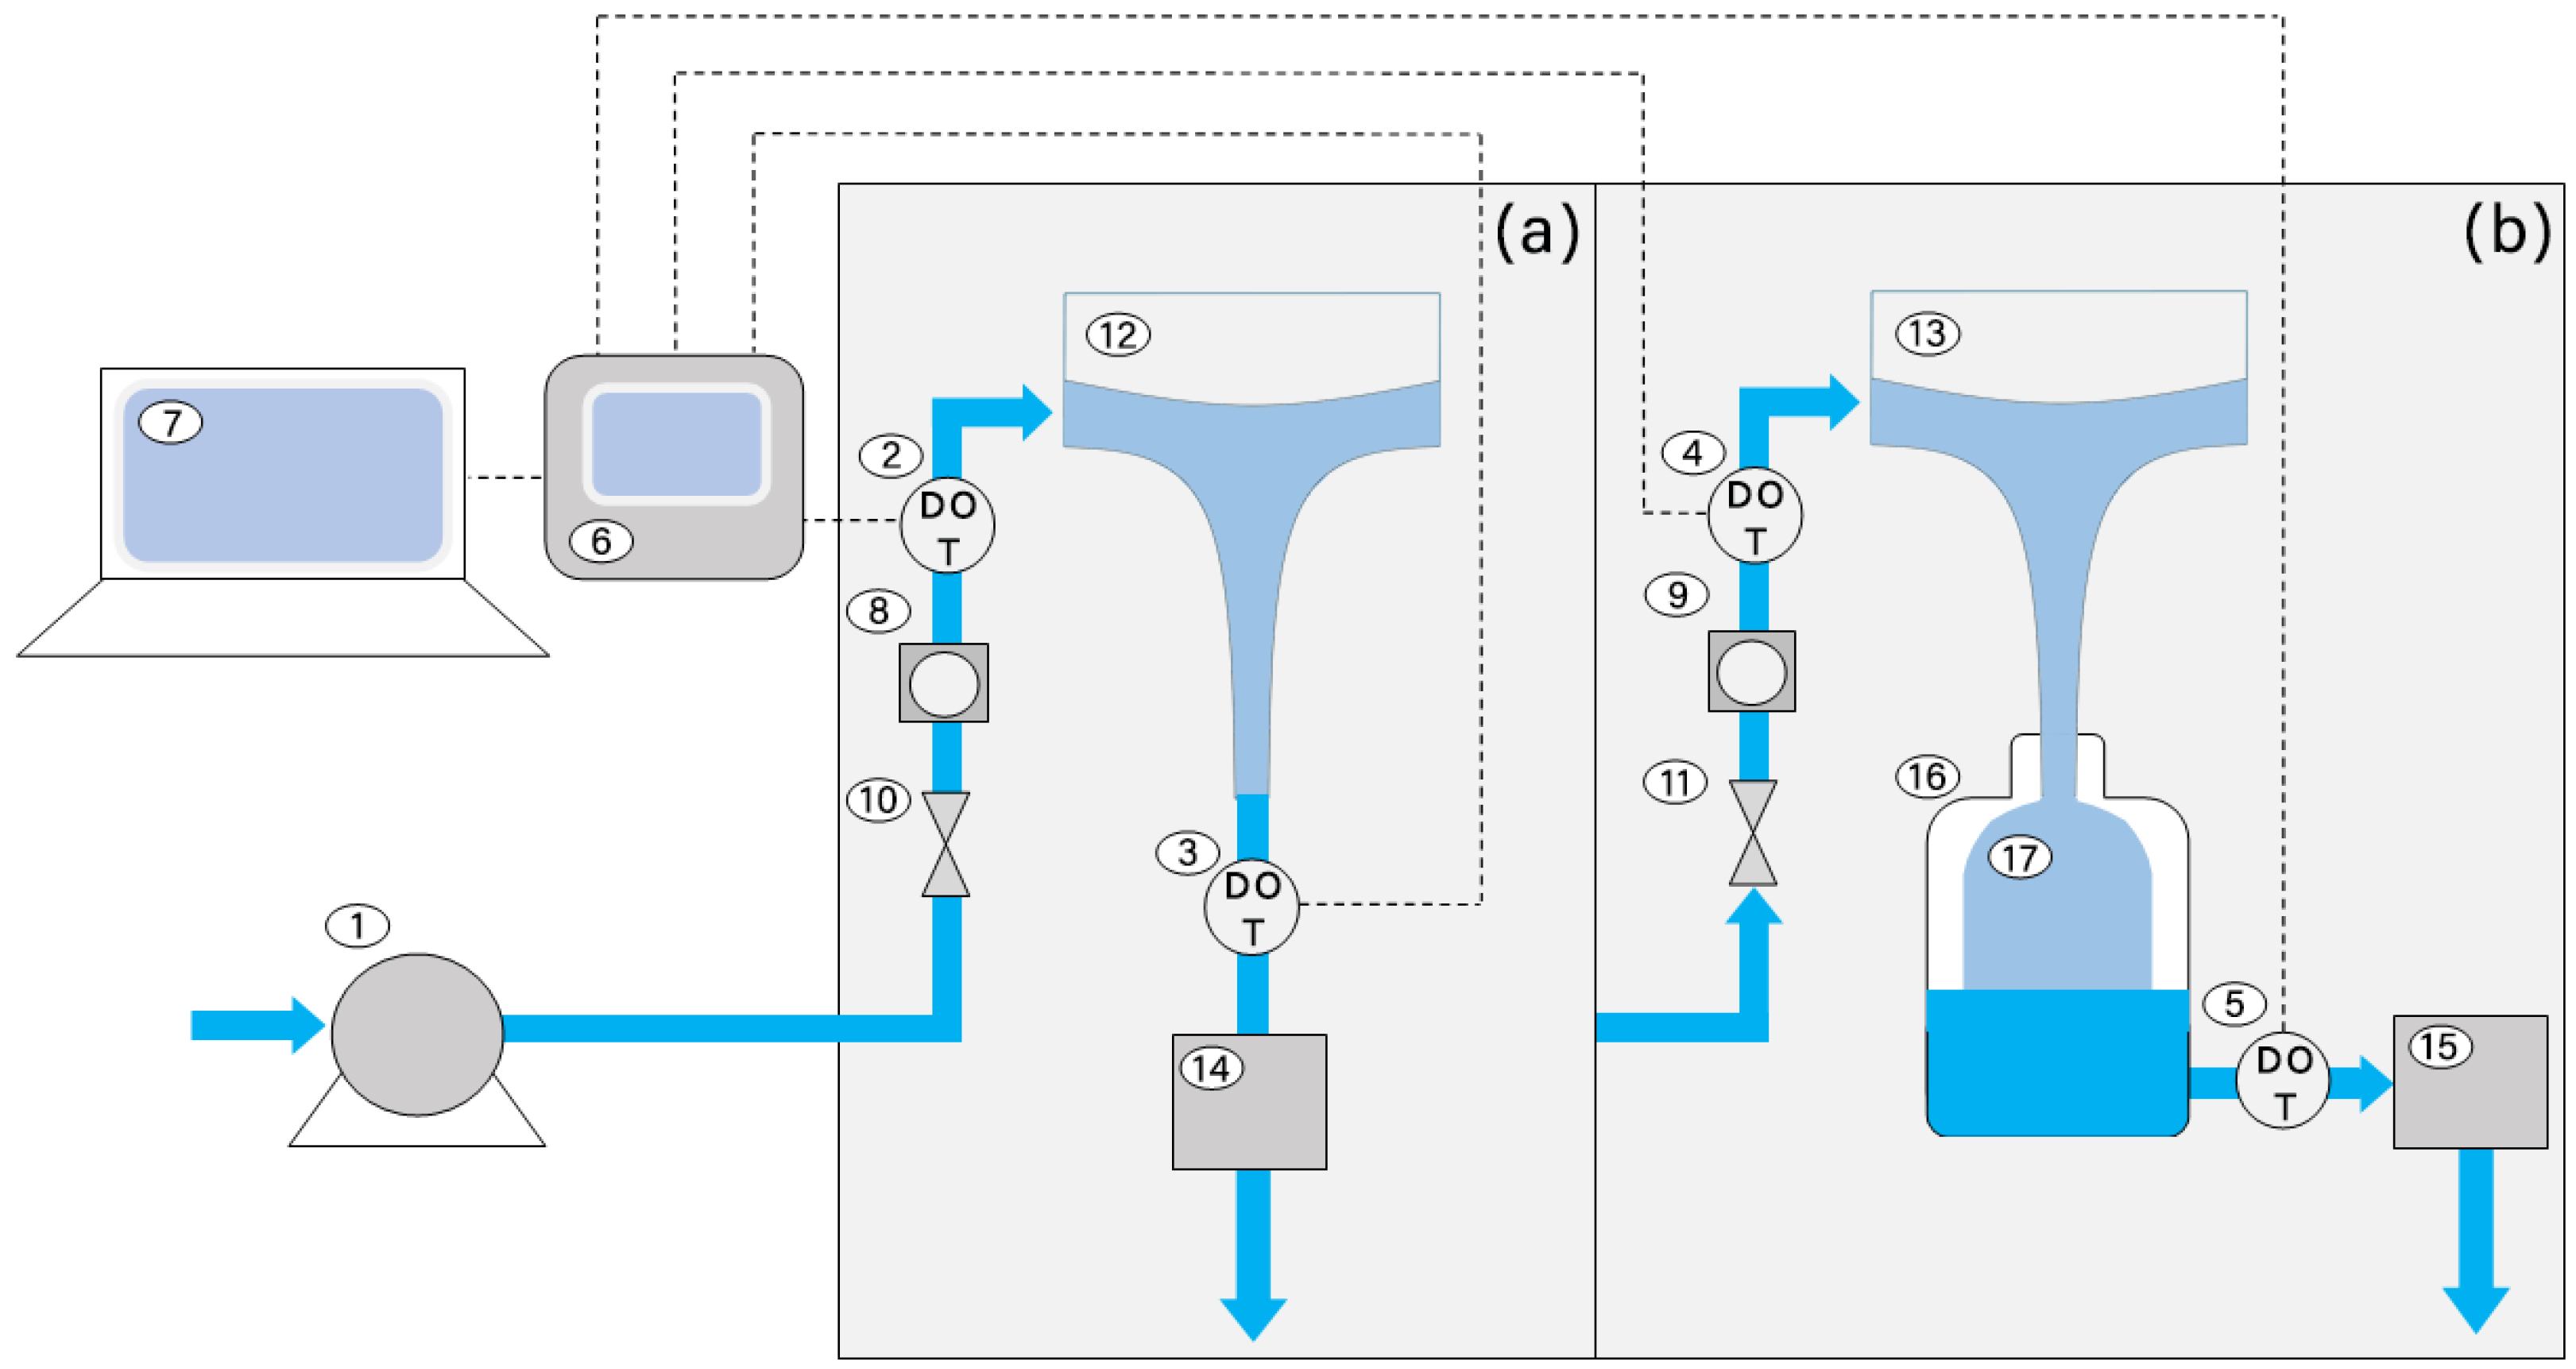
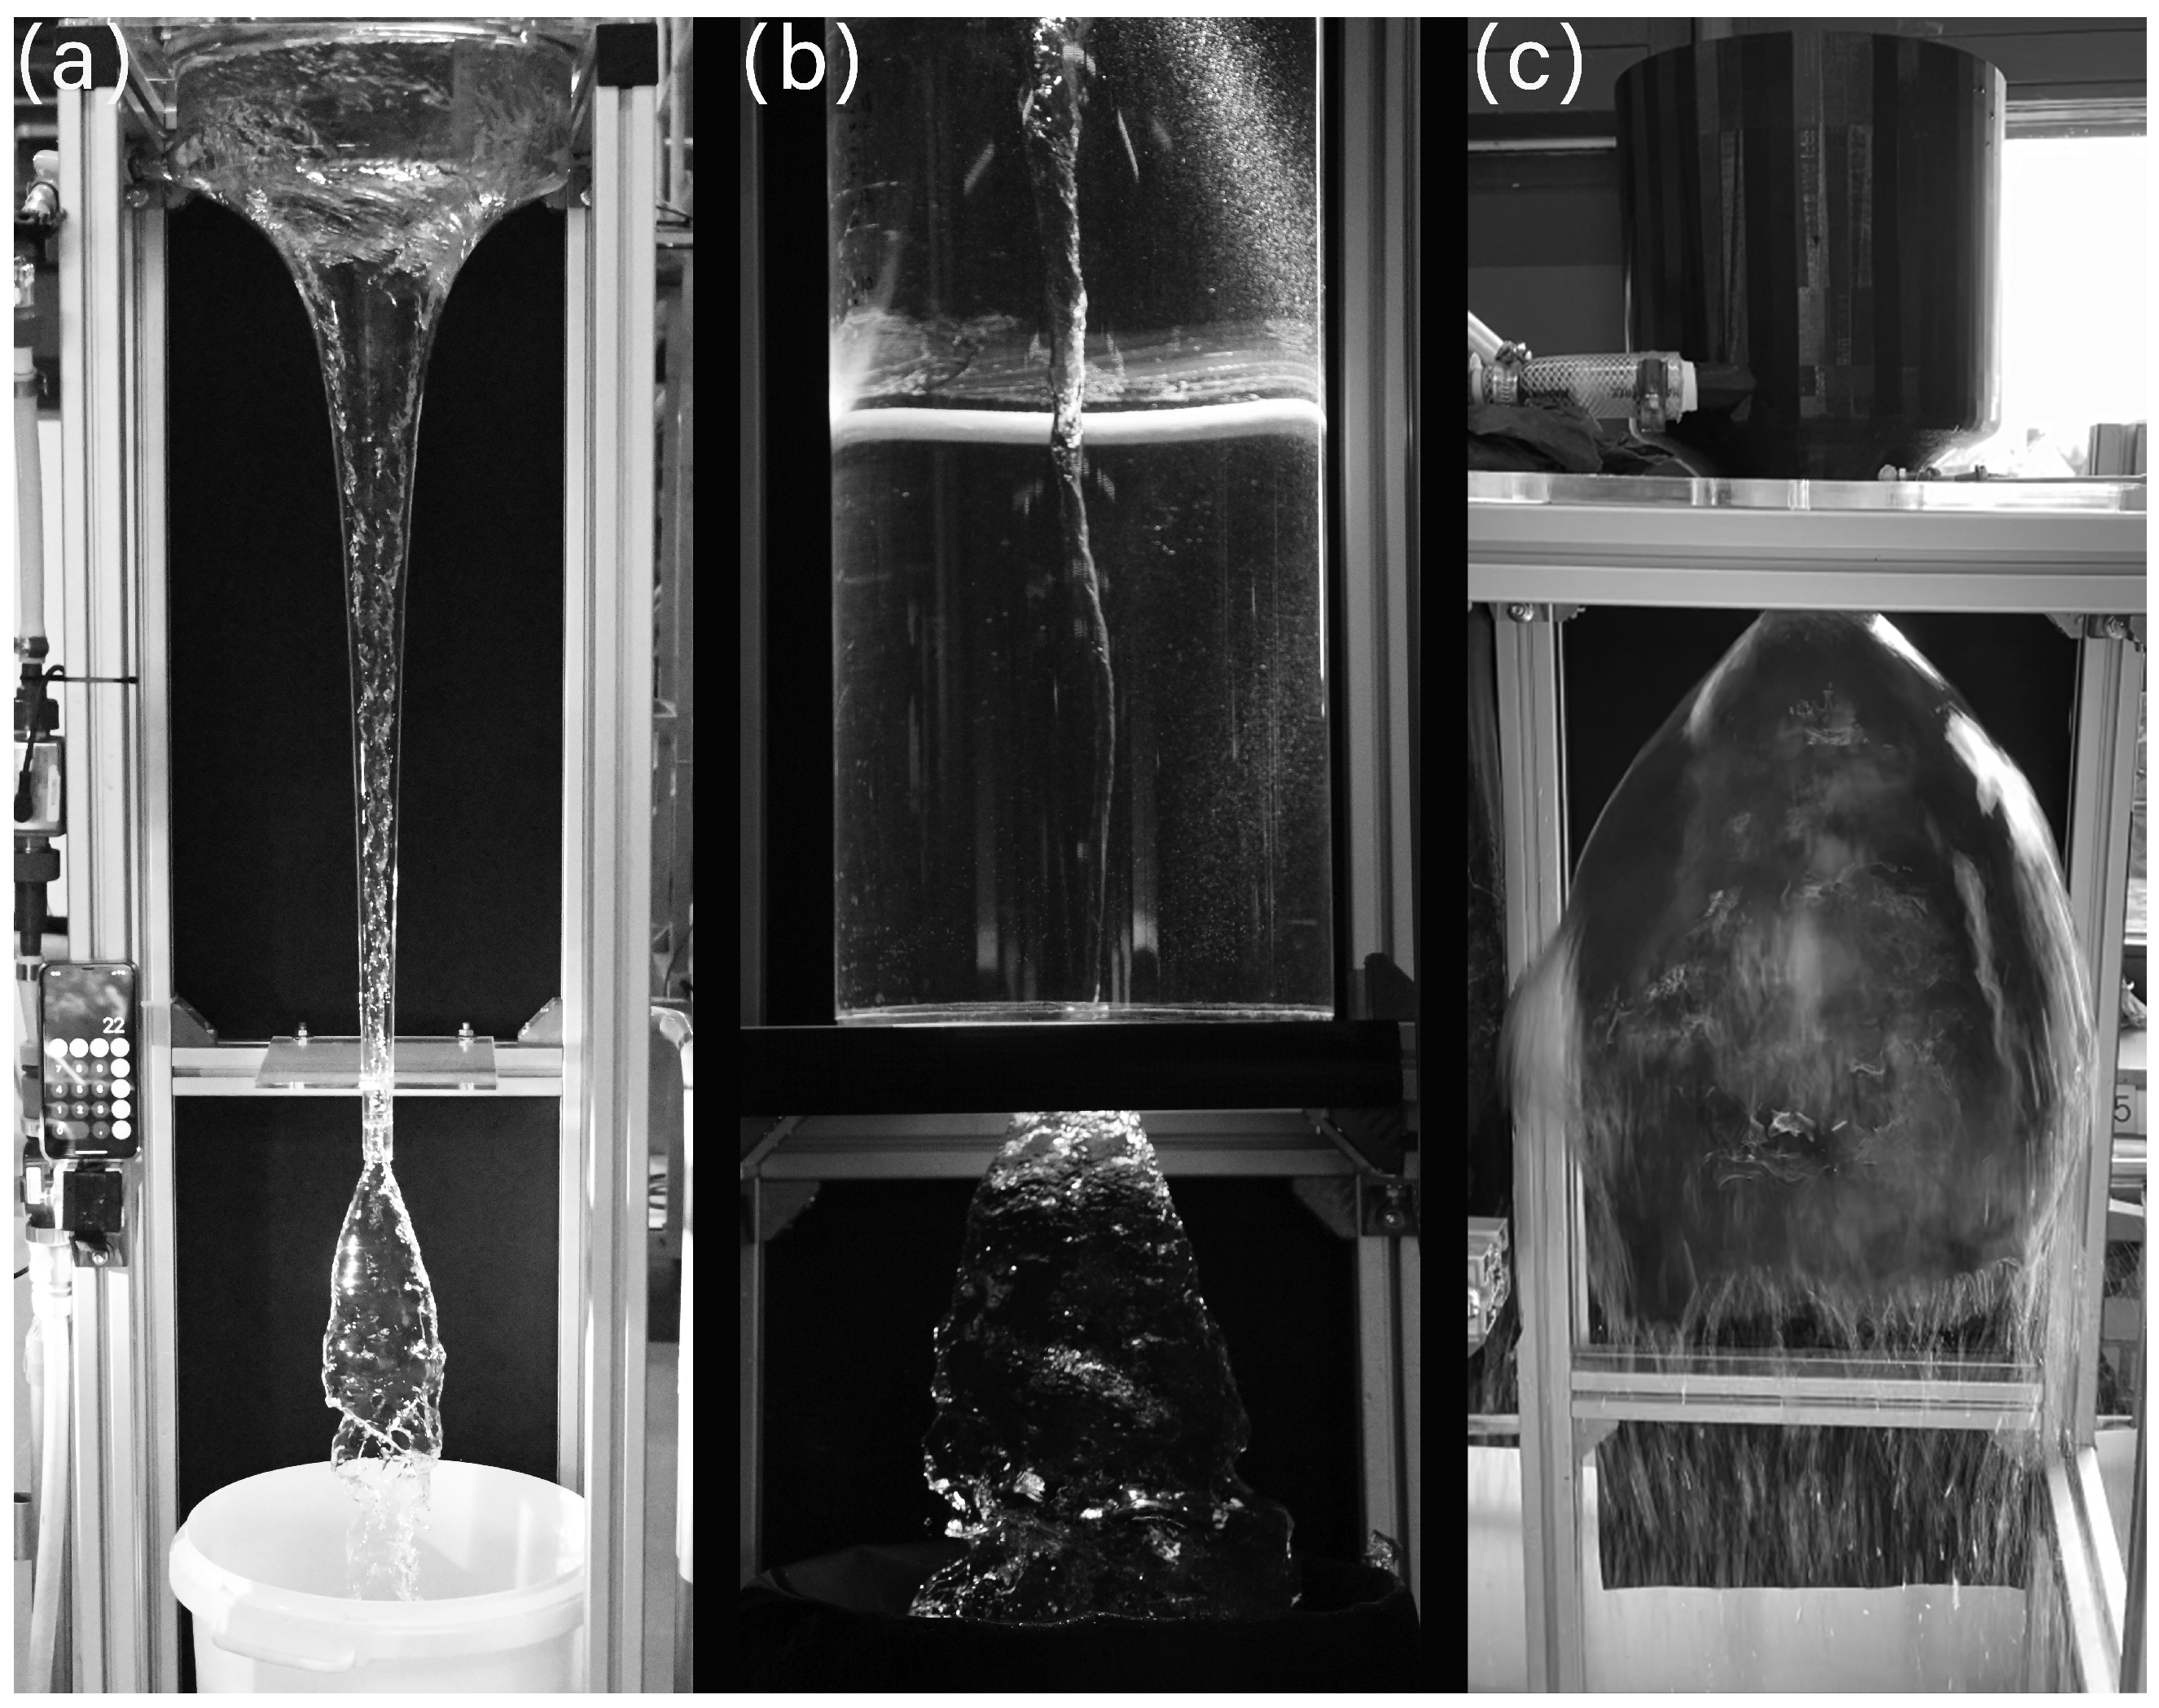
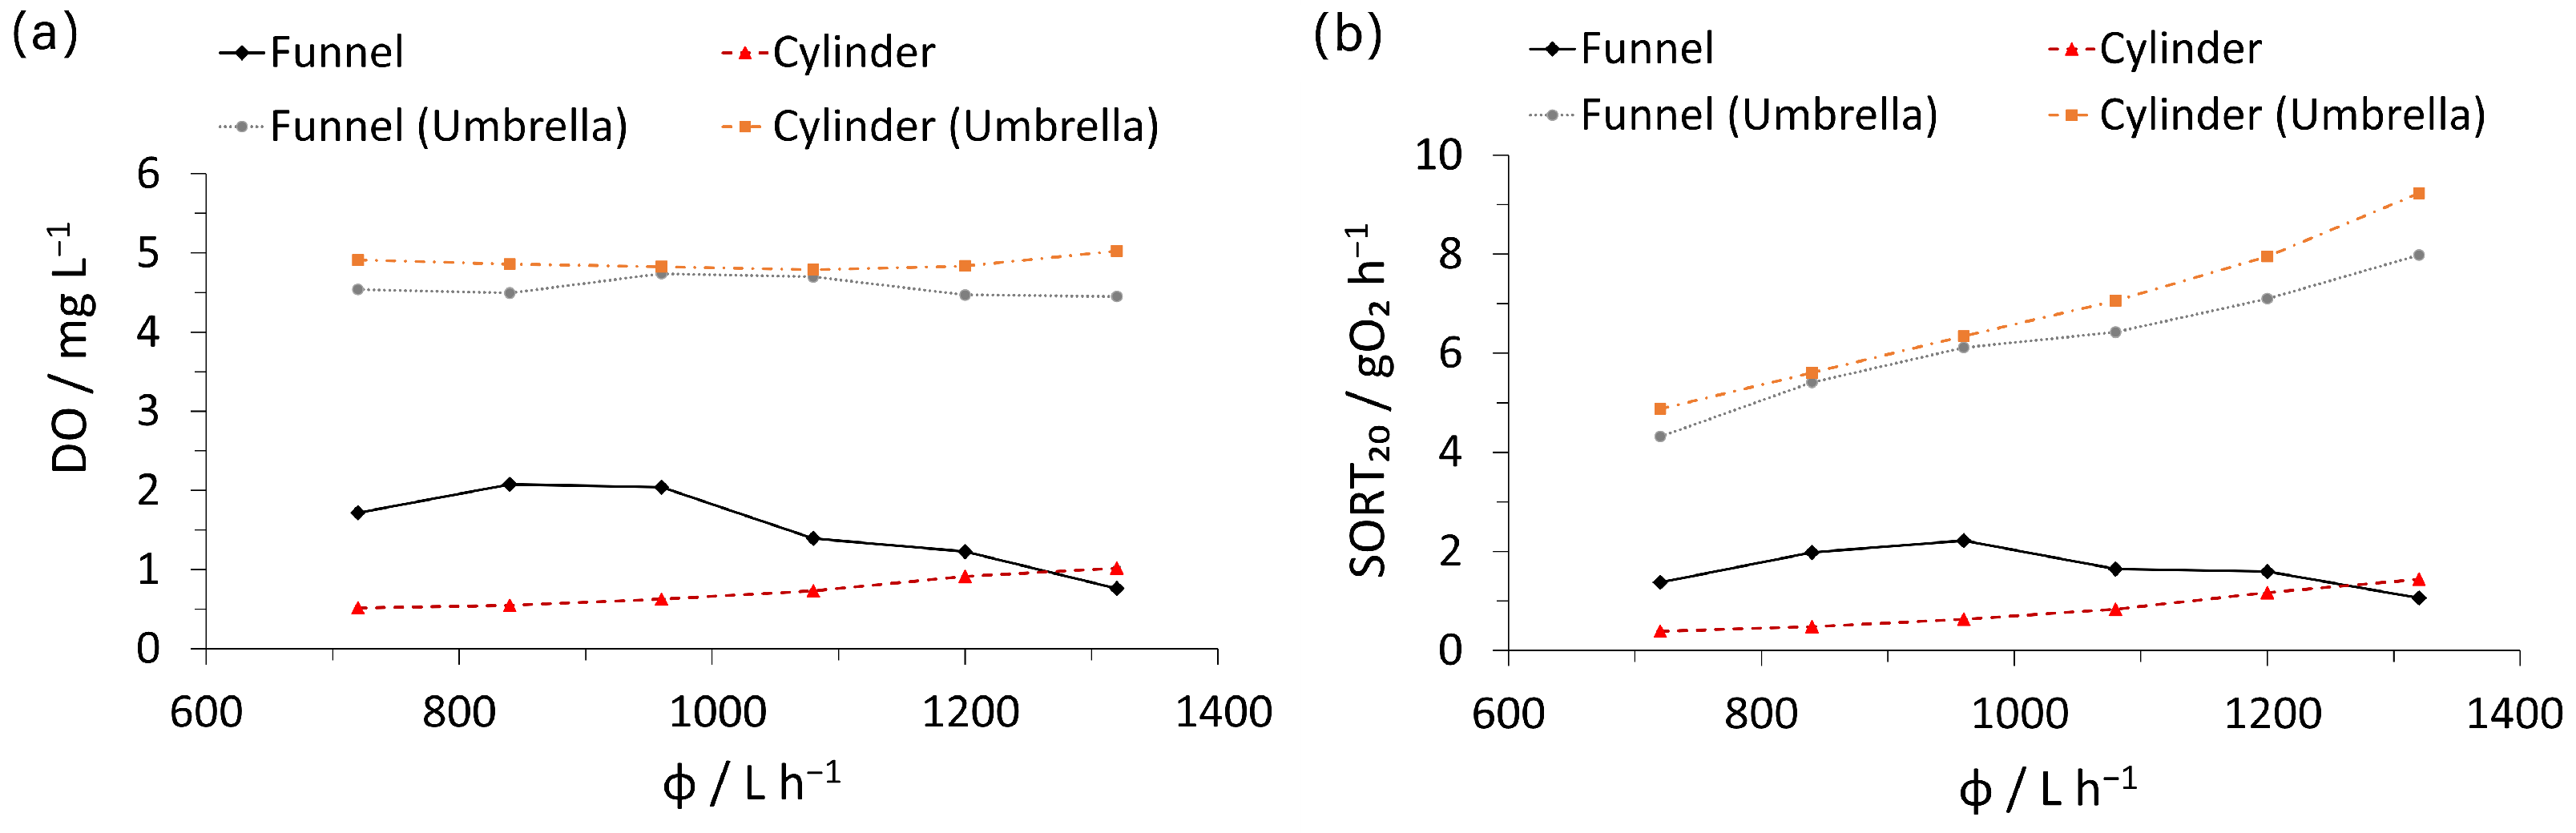
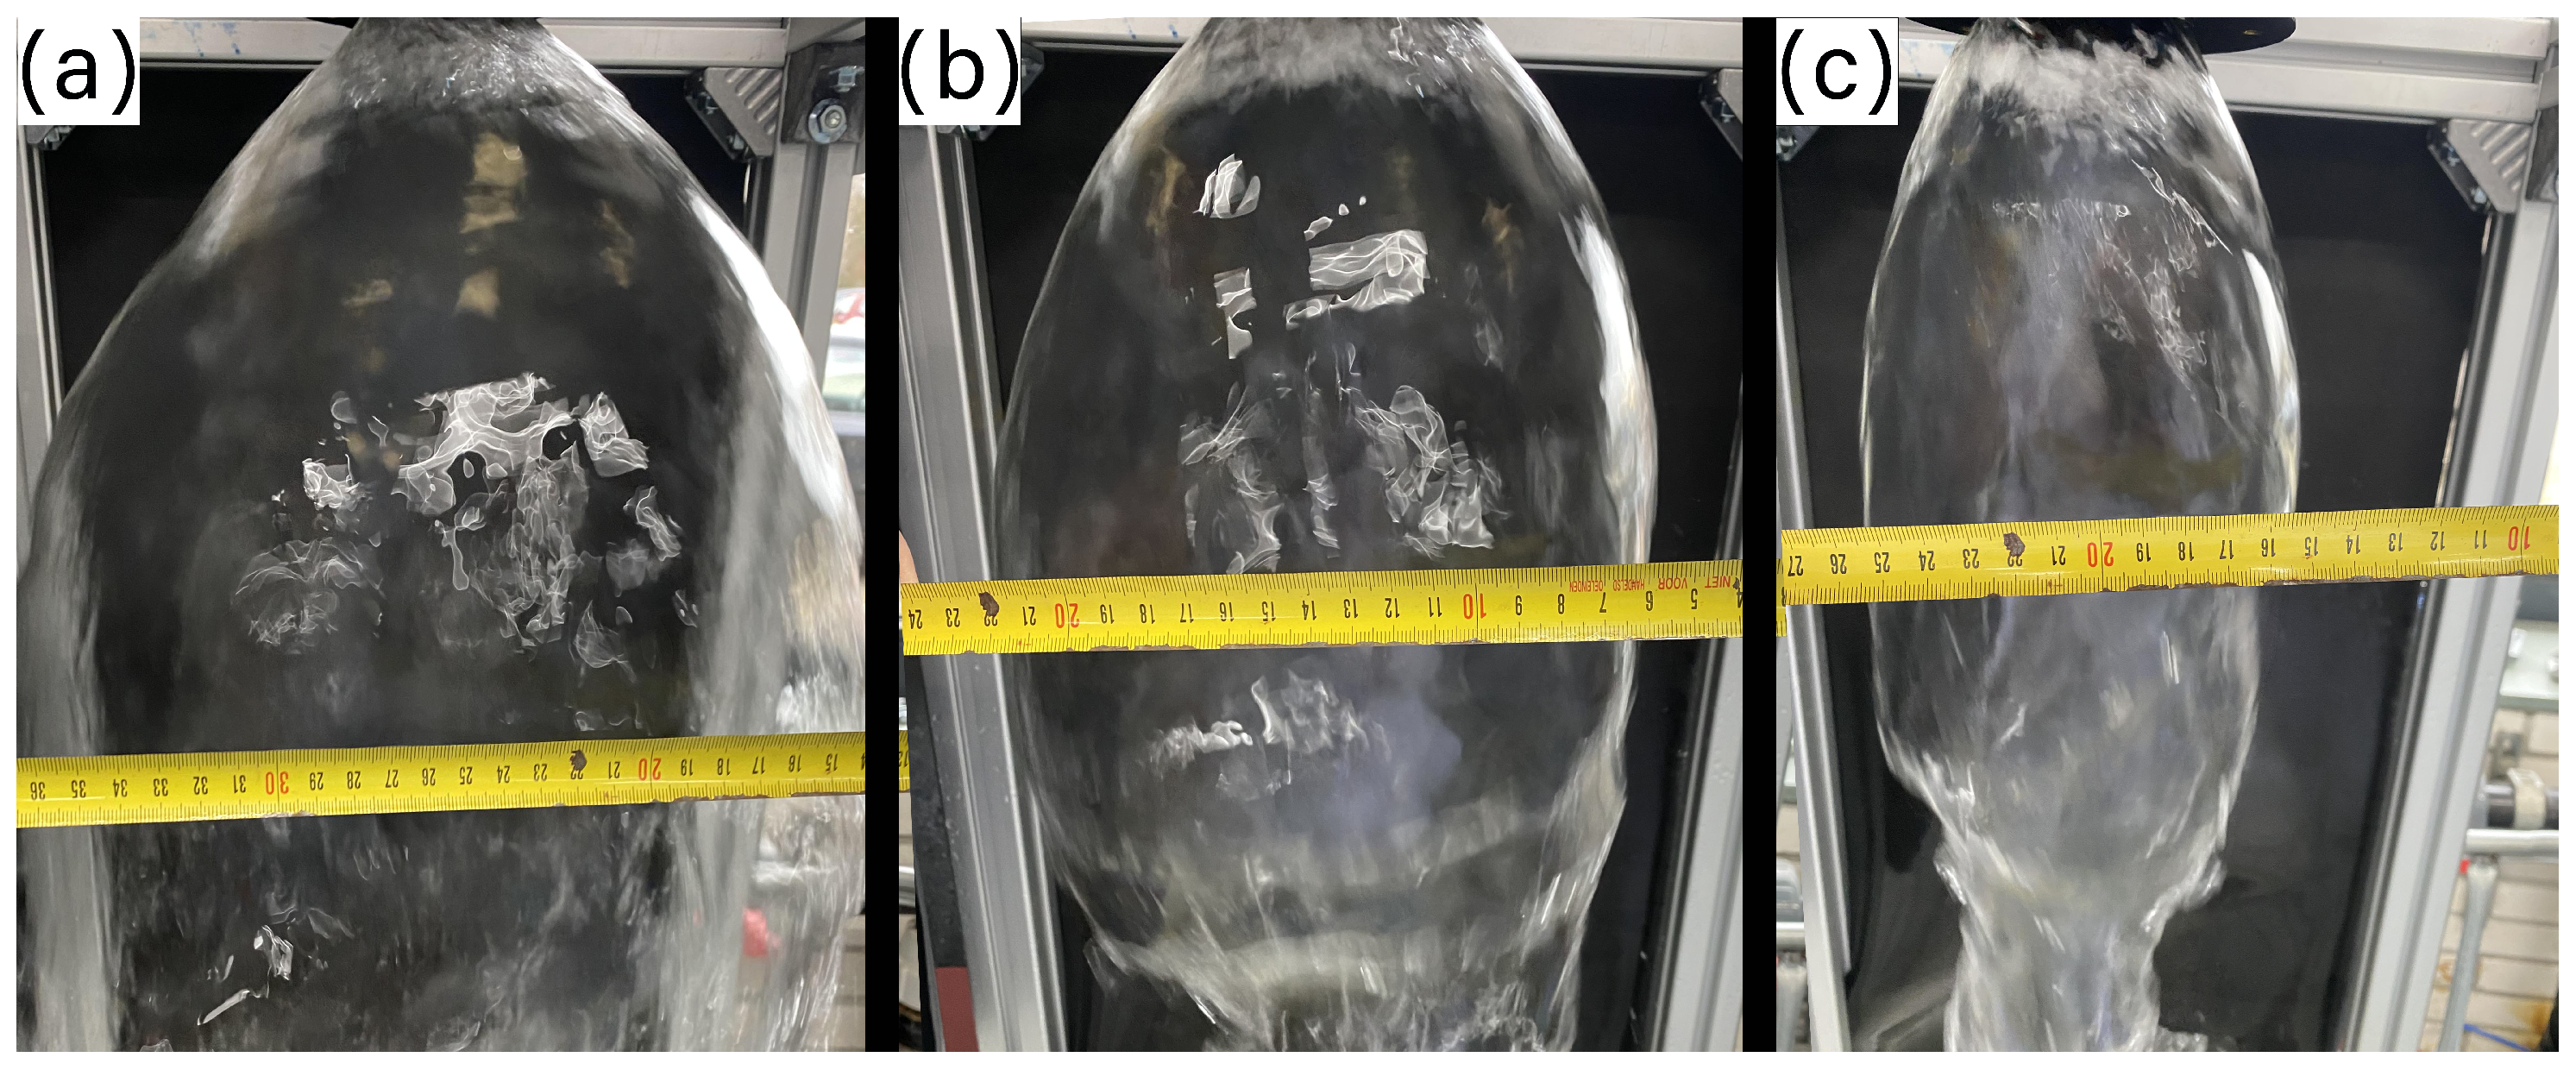
3.1. Hyperbolic Glass Funnel and Cylindrical Reactor

Table 1 presents the water volume in the reactor (V), umbrella diameter ( D u ), and interfacial area ( S v ) at varying flow rates ( φ ) for both the hyperbolic glass funnel and cylindrical reactor. The tangential entry of water into the funnel, combined with its hyperbolic shape, induced a helical flow within the funnel and the formation of an umbrella-like structure at the funnel exit. Similarly, the vortex in the cylindrical reactor was hyperbolic, and the water followed a helical flow. However, the larger water volume in the cylindrical reactor generated additional pressure at the outlet, leading to a further expansion of the umbrella, as shown in Figure 2a,b. Consequently, the diameter of the umbrella in the cylindrical reactor was more than three times larger than that in the funnel at a water flow rate of 1320 L·h−1.
Figure 5 illustrates the DO concentrations and SOTR20 for the glass hyperbolic funnel and cylindrical reactor at various water flow rates, comparing configurations with and without umbrella formation. The results with umbrella formation showed significantly better oxygen dissolution than those without. The highest DO concentration (Figure 5a) for the funnel without the umbrella was 2.08 mg·L−1 at a water flow rate of 840 L·h−1, while for the cylindrical reactor, the highest concentration was 1.02 mg·L−1 at 1320 L·h−1. With umbrella formation, the DO concentrations reached 4.74 mg·L−1 at 840 L·h−1 and 5.02 mg·L−1 at 1320 L·h−1, respectively.
The DO concentrations for the funnel without an umbrella were generally higher than those for the cylindrical reactor, likely due to the larger gas–liquid interface and smaller reactor volume in the funnel. As the water flow rate increased, the volume in the funnel also increased significantly, leading to a decrease in interfacial area (Table 1) and consequently lower DO values at higher flow rates. In contrast, in the cylindrical reactor, the interfacial area increased with the water flow rate, without a corresponding significant increase in water volume, resulting in higher DO values. Due to the wider umbrella diameters observed in the cylindrical reactor, the DO results for the umbrella regime were slightly higher than those for the funnel. A similar trend was observed for the SOTR20 (Figure 5). The highest SOTR20 for the funnel without umbrella was 2.2 gO2·h−1 at a water flow rate of 960 L·h−1, while for the cylindrical reactor, it was 1.4 gO2·h−1 at 1320 L·h−1. For the umbrella regime, the SOTR20 reached 8 gO2·h−1 and 9.2 gO2·h−1 at 1320 L·h−1, respectively.
The hyperbolic funnel enhanced the area of the water vortex, thereby improving aeration induced by the vortex. However, the additional water pressure in the cylindrical reactor resulted in a wider umbrella, which also increased the aeration. Despite the cylindrical reactor’s wider umbrella, the DO results were only slightly higher than those of the hyperbolic funnel. This result suggests that by optimizing the funnel’s dimensions, the aeration induced by the water vortex could be further enhanced, including an optimization of the outlet diameter to further increase the size of the umbrella.
The trend observed for DO and SOTR20 was also evident for SAE in both reactors (Figure 6). The maximum SAE without the umbrella reached 0.4 kgO2·kWh−1 for the funnel at a water flow rate of 960 L·h−1, while for the cylindrical reactor, it reached only 0.19 kgO2·kWh−1 at 1320 L·h−1. In the umbrella configuration, the SAE increased to 1.1 kgO2·kWh−1 at 960 L·h−1 and 1.2 kgO2·kWh−1 at 1320 L·h−1, respectively.

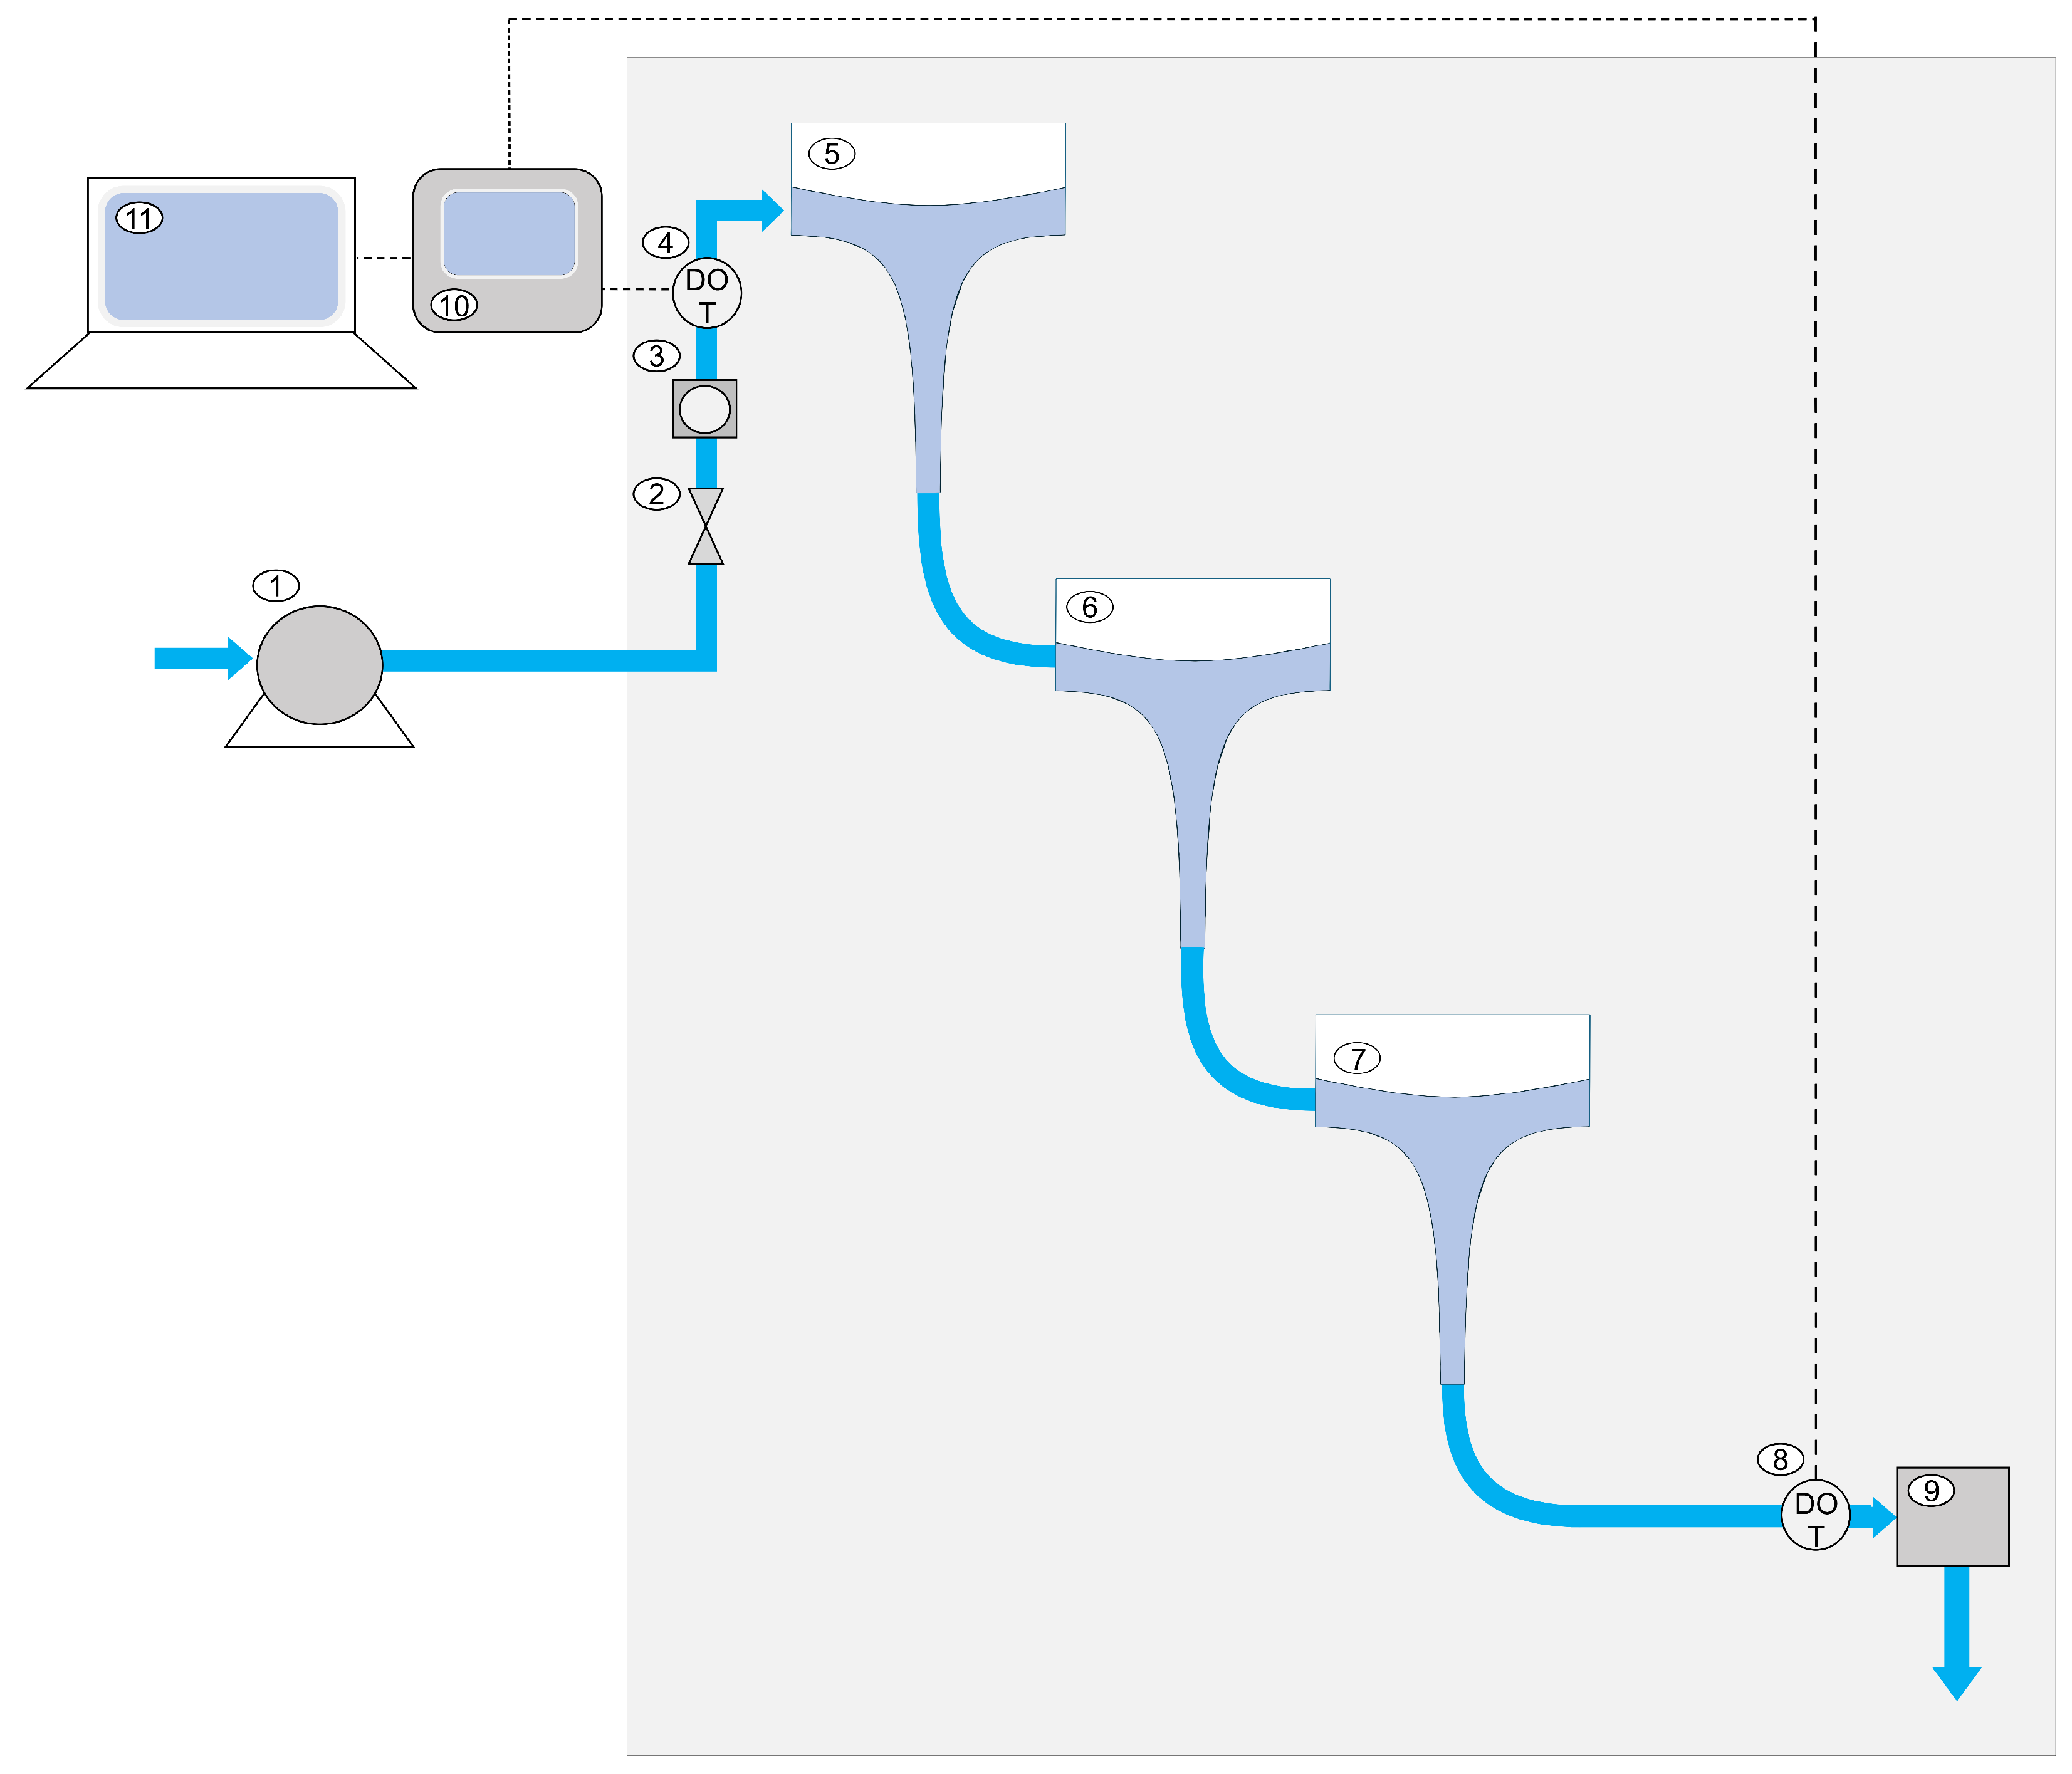
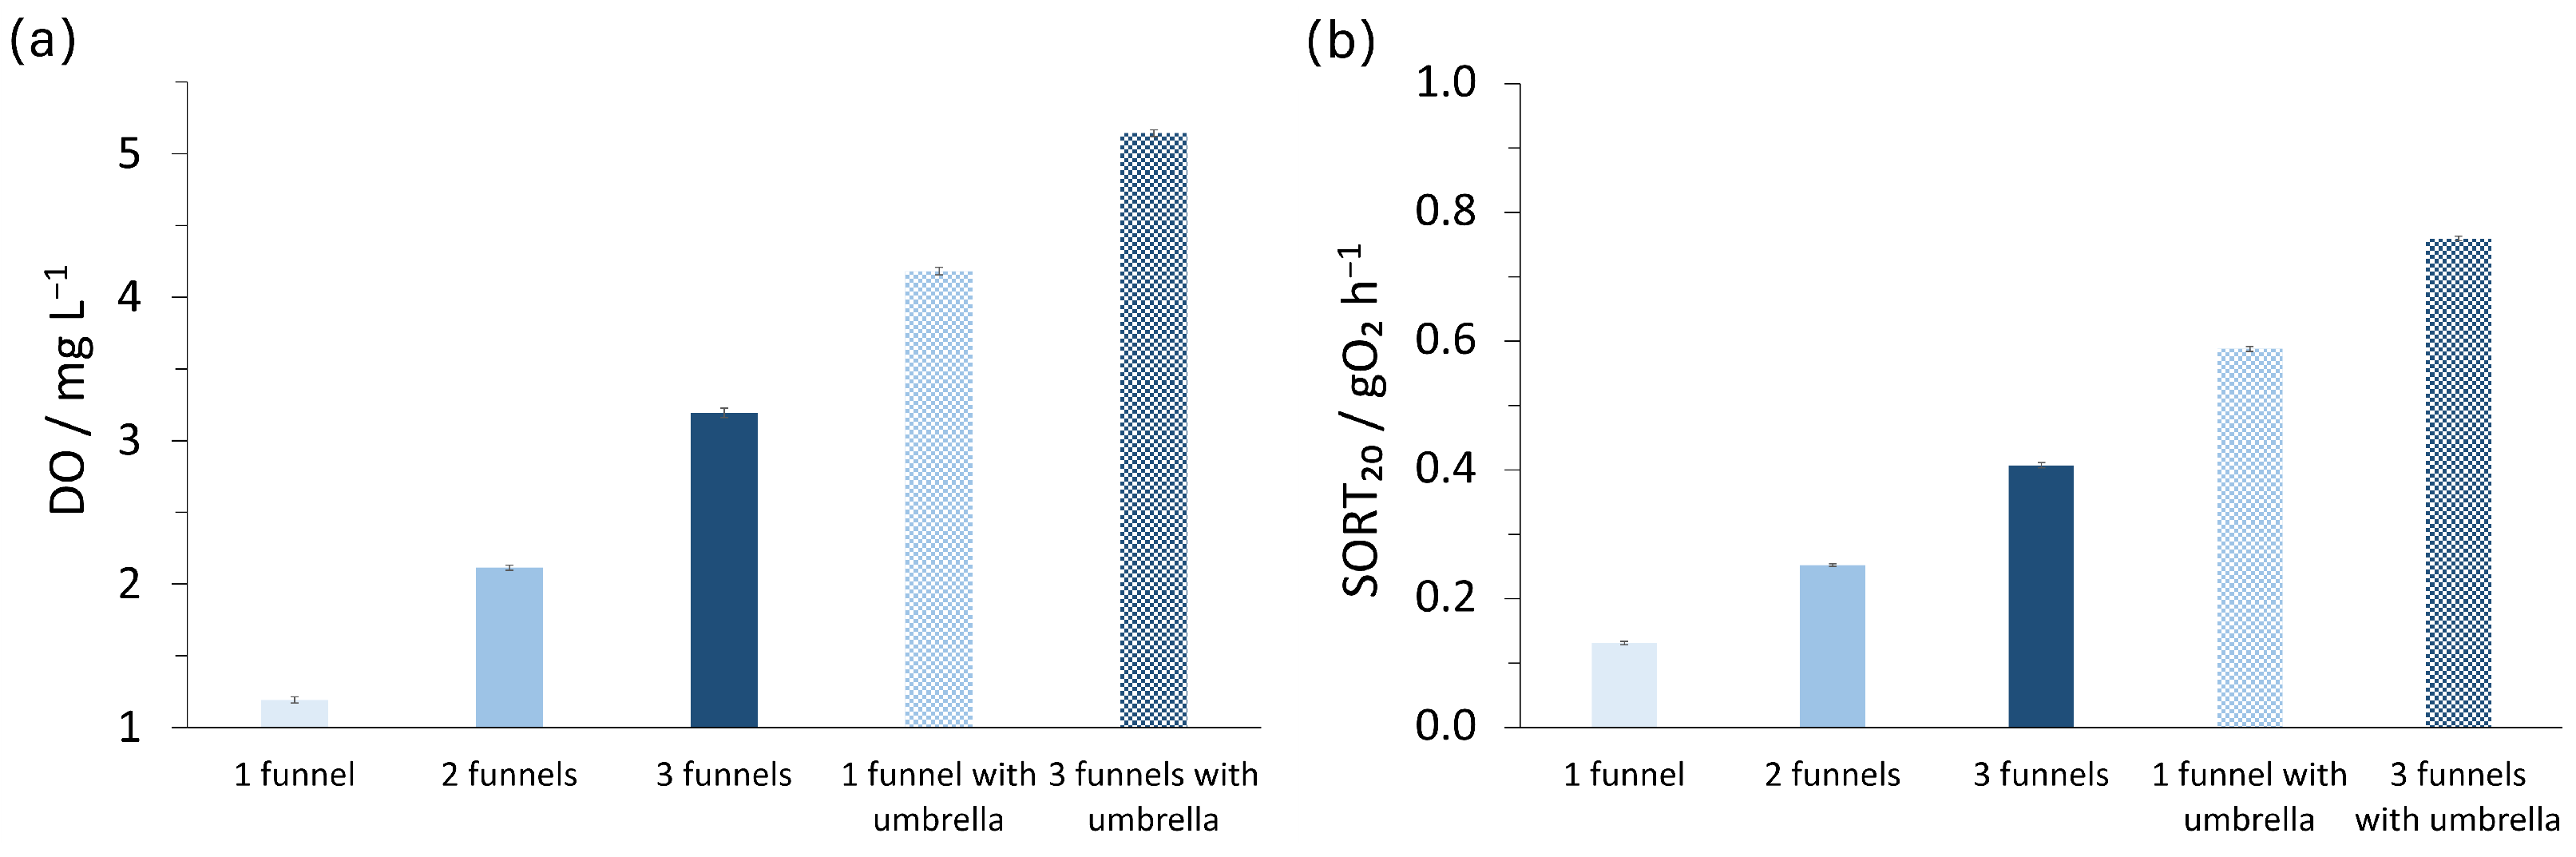
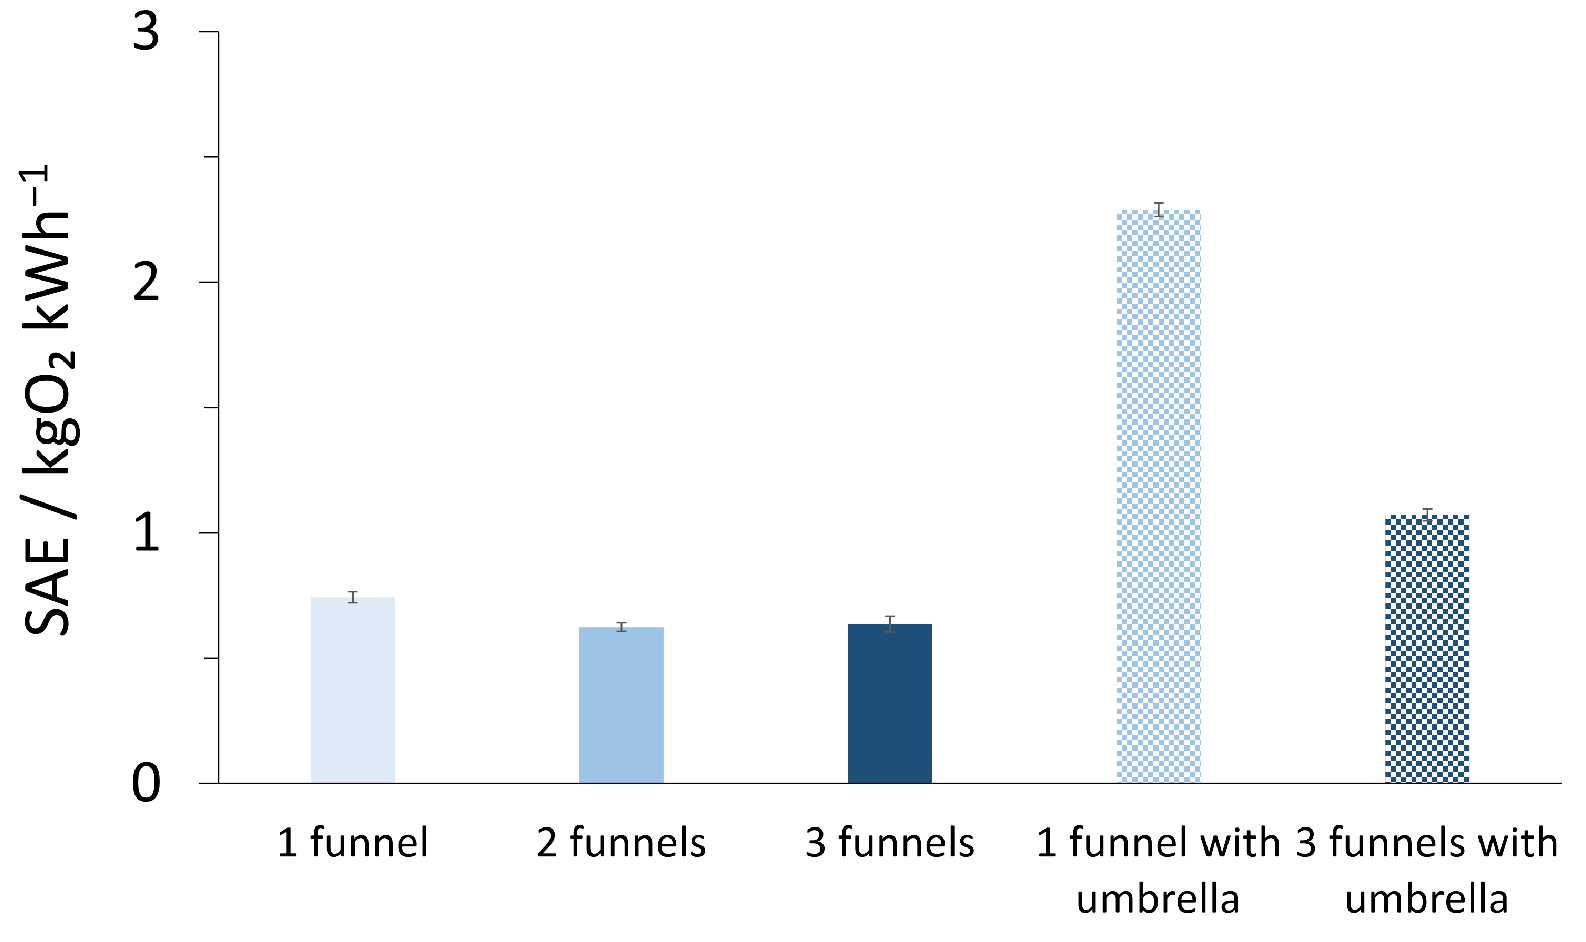
3.2. Cascade Configuration

It is known that a hyperbolic funnel provides high aeration efficiency but does not allow a high mass transfer, due to its short hydraulic retention time [5]. Consequently, it was decided to investigate the relation between hydraulic retention time and aeration efficiency by testing a cascade configuration with three funnels. Figure 7a,b present the DO and SOTR20 results for the different configurations: for a single funnel without an umbrella, the DO and SOTR20 values reached 1.2 mg·L−1 and 0.13 gO2·h−1, respectively. When two funnels were used, these values increased to 2.3 mg·L−1 and 0.27 gO2·h−1, and with three funnels, they reached 2.7 mg·L−1 and 0.33 gO2·h−1, respectively. Due to the decreasing oxygen concentration gradient, in a series of funnels, each subsequent funnel contributes less to the increase in DO concentration than the previous one. Consequently, the third funnel increased the DO concentration by only 0.4 gO2·h−1, whereas the second and first funnels contributed increases of 1.1 mg·L−1 and 1.2 mg·L−1, respectively. In contrast, a single funnel with an umbrella exhibited superior aeration performance compared to three funnels without an umbrella, achieving a DO concentration of 4.2 mg·L−1 and SOTR20 of 0.57 gO2·h−1. The addition of two extra funnels without an umbrella to the single funnel with an umbrella resulted in only a modest increase in DO concentration and SOTR20, by 0.9 mg·L−1 and 0.19 gO2·h−1, respectively.
Adding more funnels to a cascade system increases the height to which the water must be pumped, thereby decreasing the system’s SAE (Figure 8). As a result, despite the increases in DO and SOTR20 observed when adding funnels to the cascade system without an umbrella, the SAE decreased, reaching 0.8 kgO2·kWh−1, 0.7 kgO2·kWh−1, and 0.5 kgO2·kWh−1 for the one-, two-, and three-funnel configurations, respectively. The highest SAE was achieved with a single funnel with an umbrella, reaching 2.3 kgO2·kWh−1, while the addition of two funnels without an umbrella reduced the SAE to 1.1 kgO2·kWh−1.
Our results indicate that a single funnel with an umbrella achieved higher DO and SOTR20 values (Figure 7) and significantly higher SAE (Figure 8) than all cascade configurations investigated in this work. This result suggests that enhancing aeration efficiency by optimizing one reactor is potentially more effective than adding additional reactors in a cascade. Furthermore, our data allow the prediction that adjusting a hyperbolic funnel’s width and outlet diameter, rather than its height, may provide further improvements in aeration parameters, though this assumption requires experimental validation.

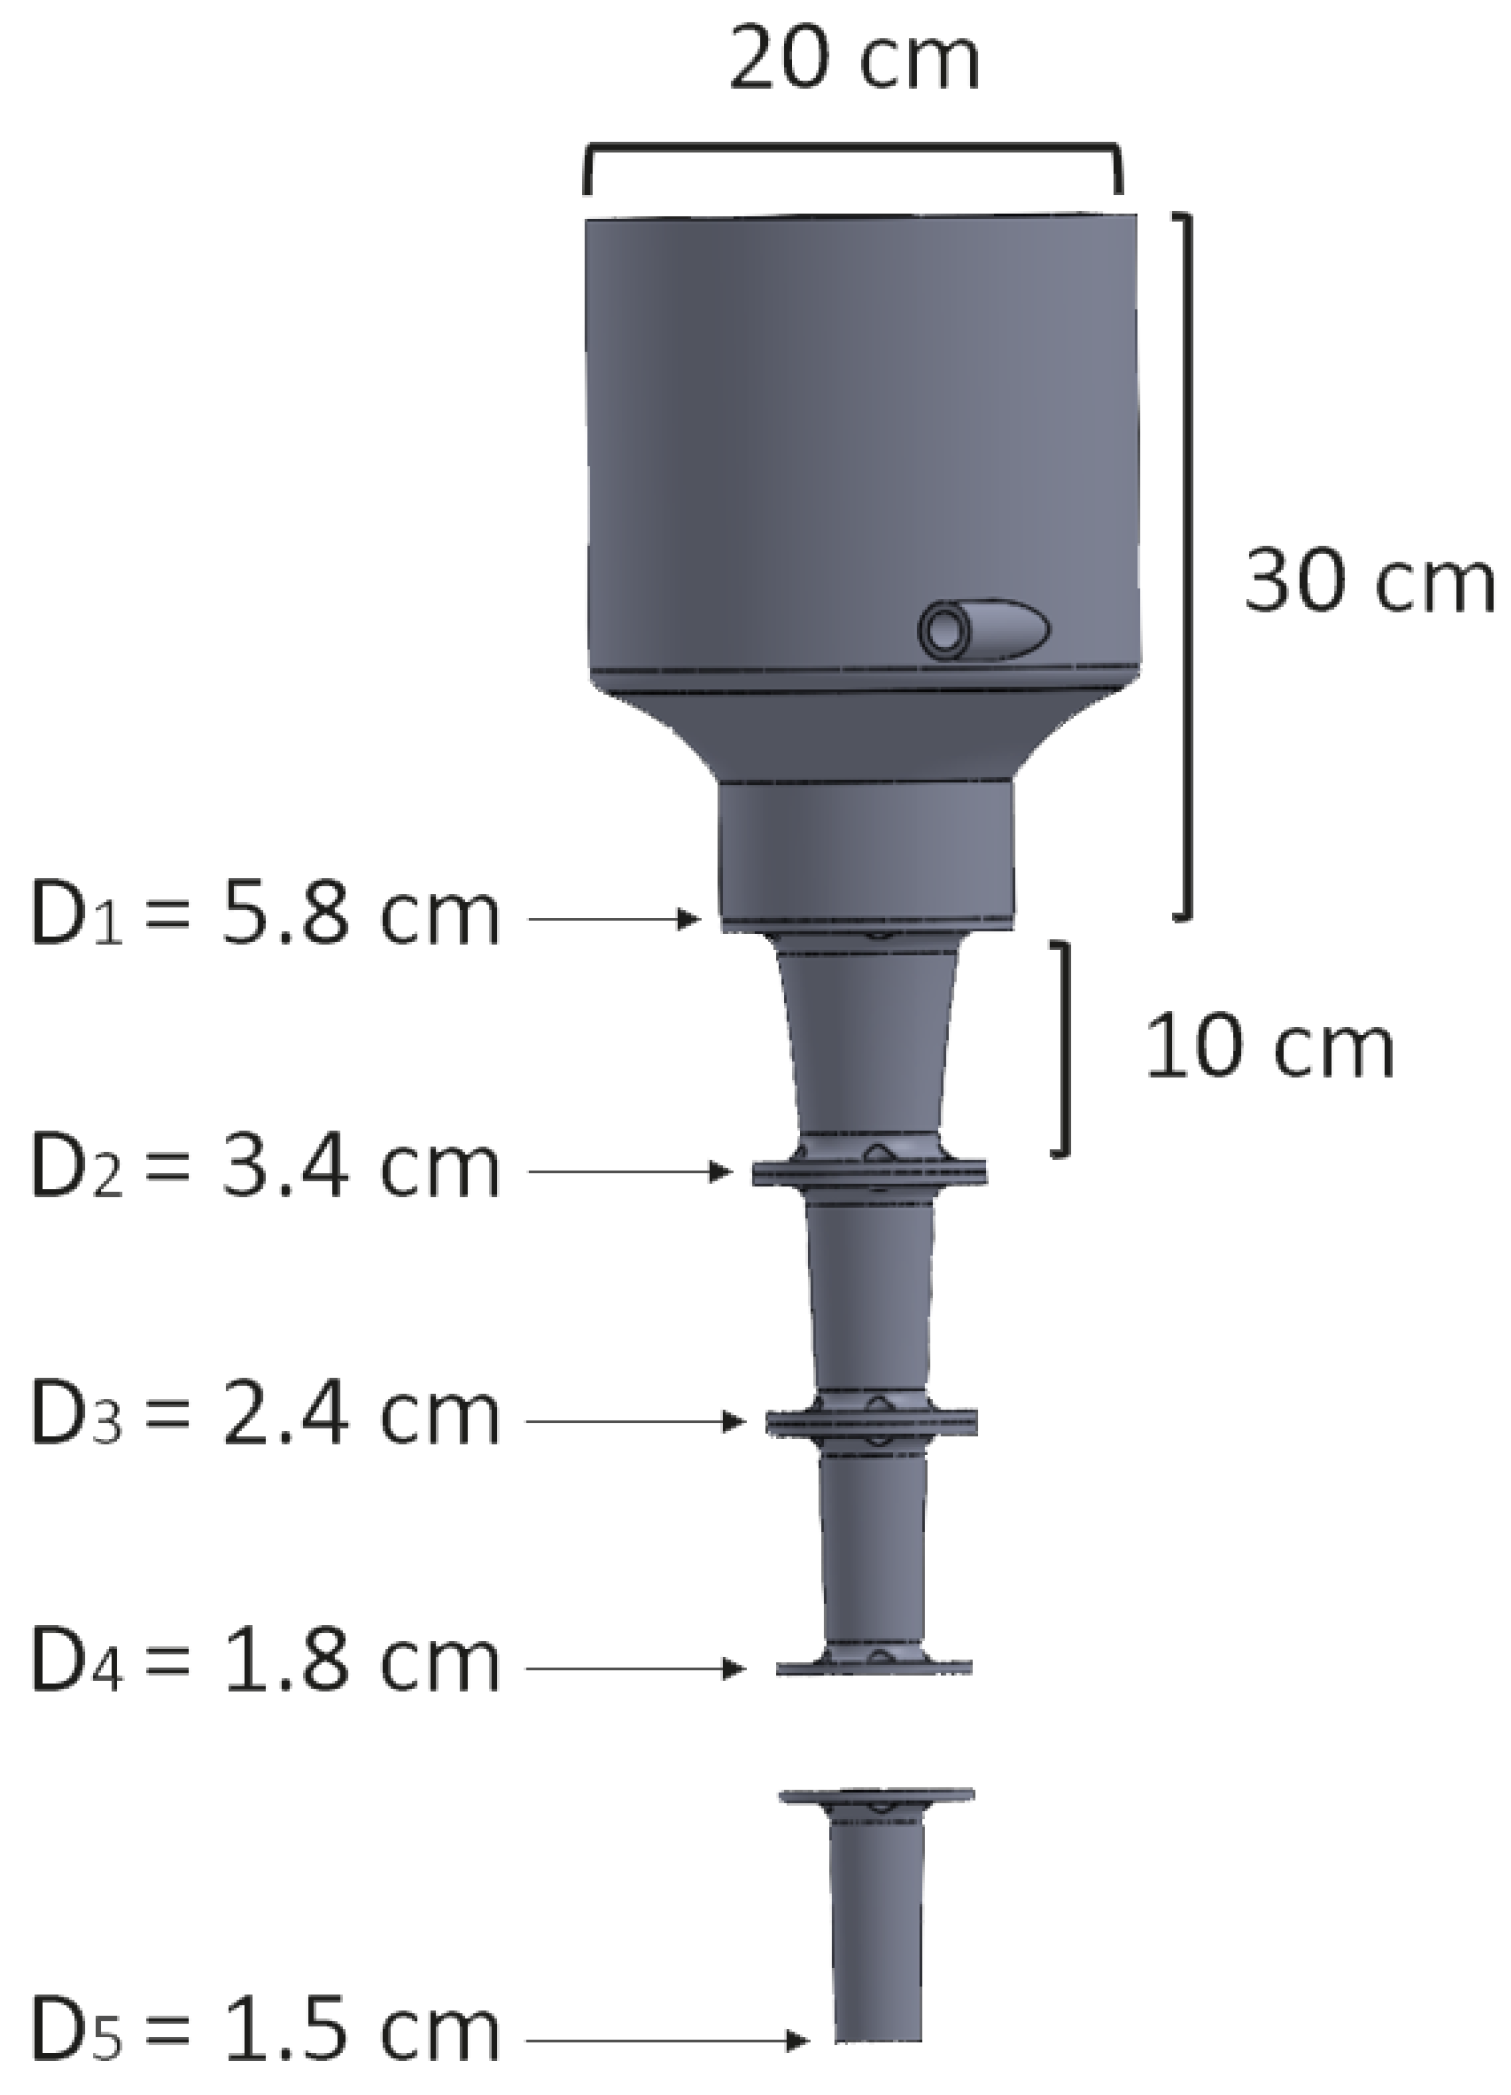
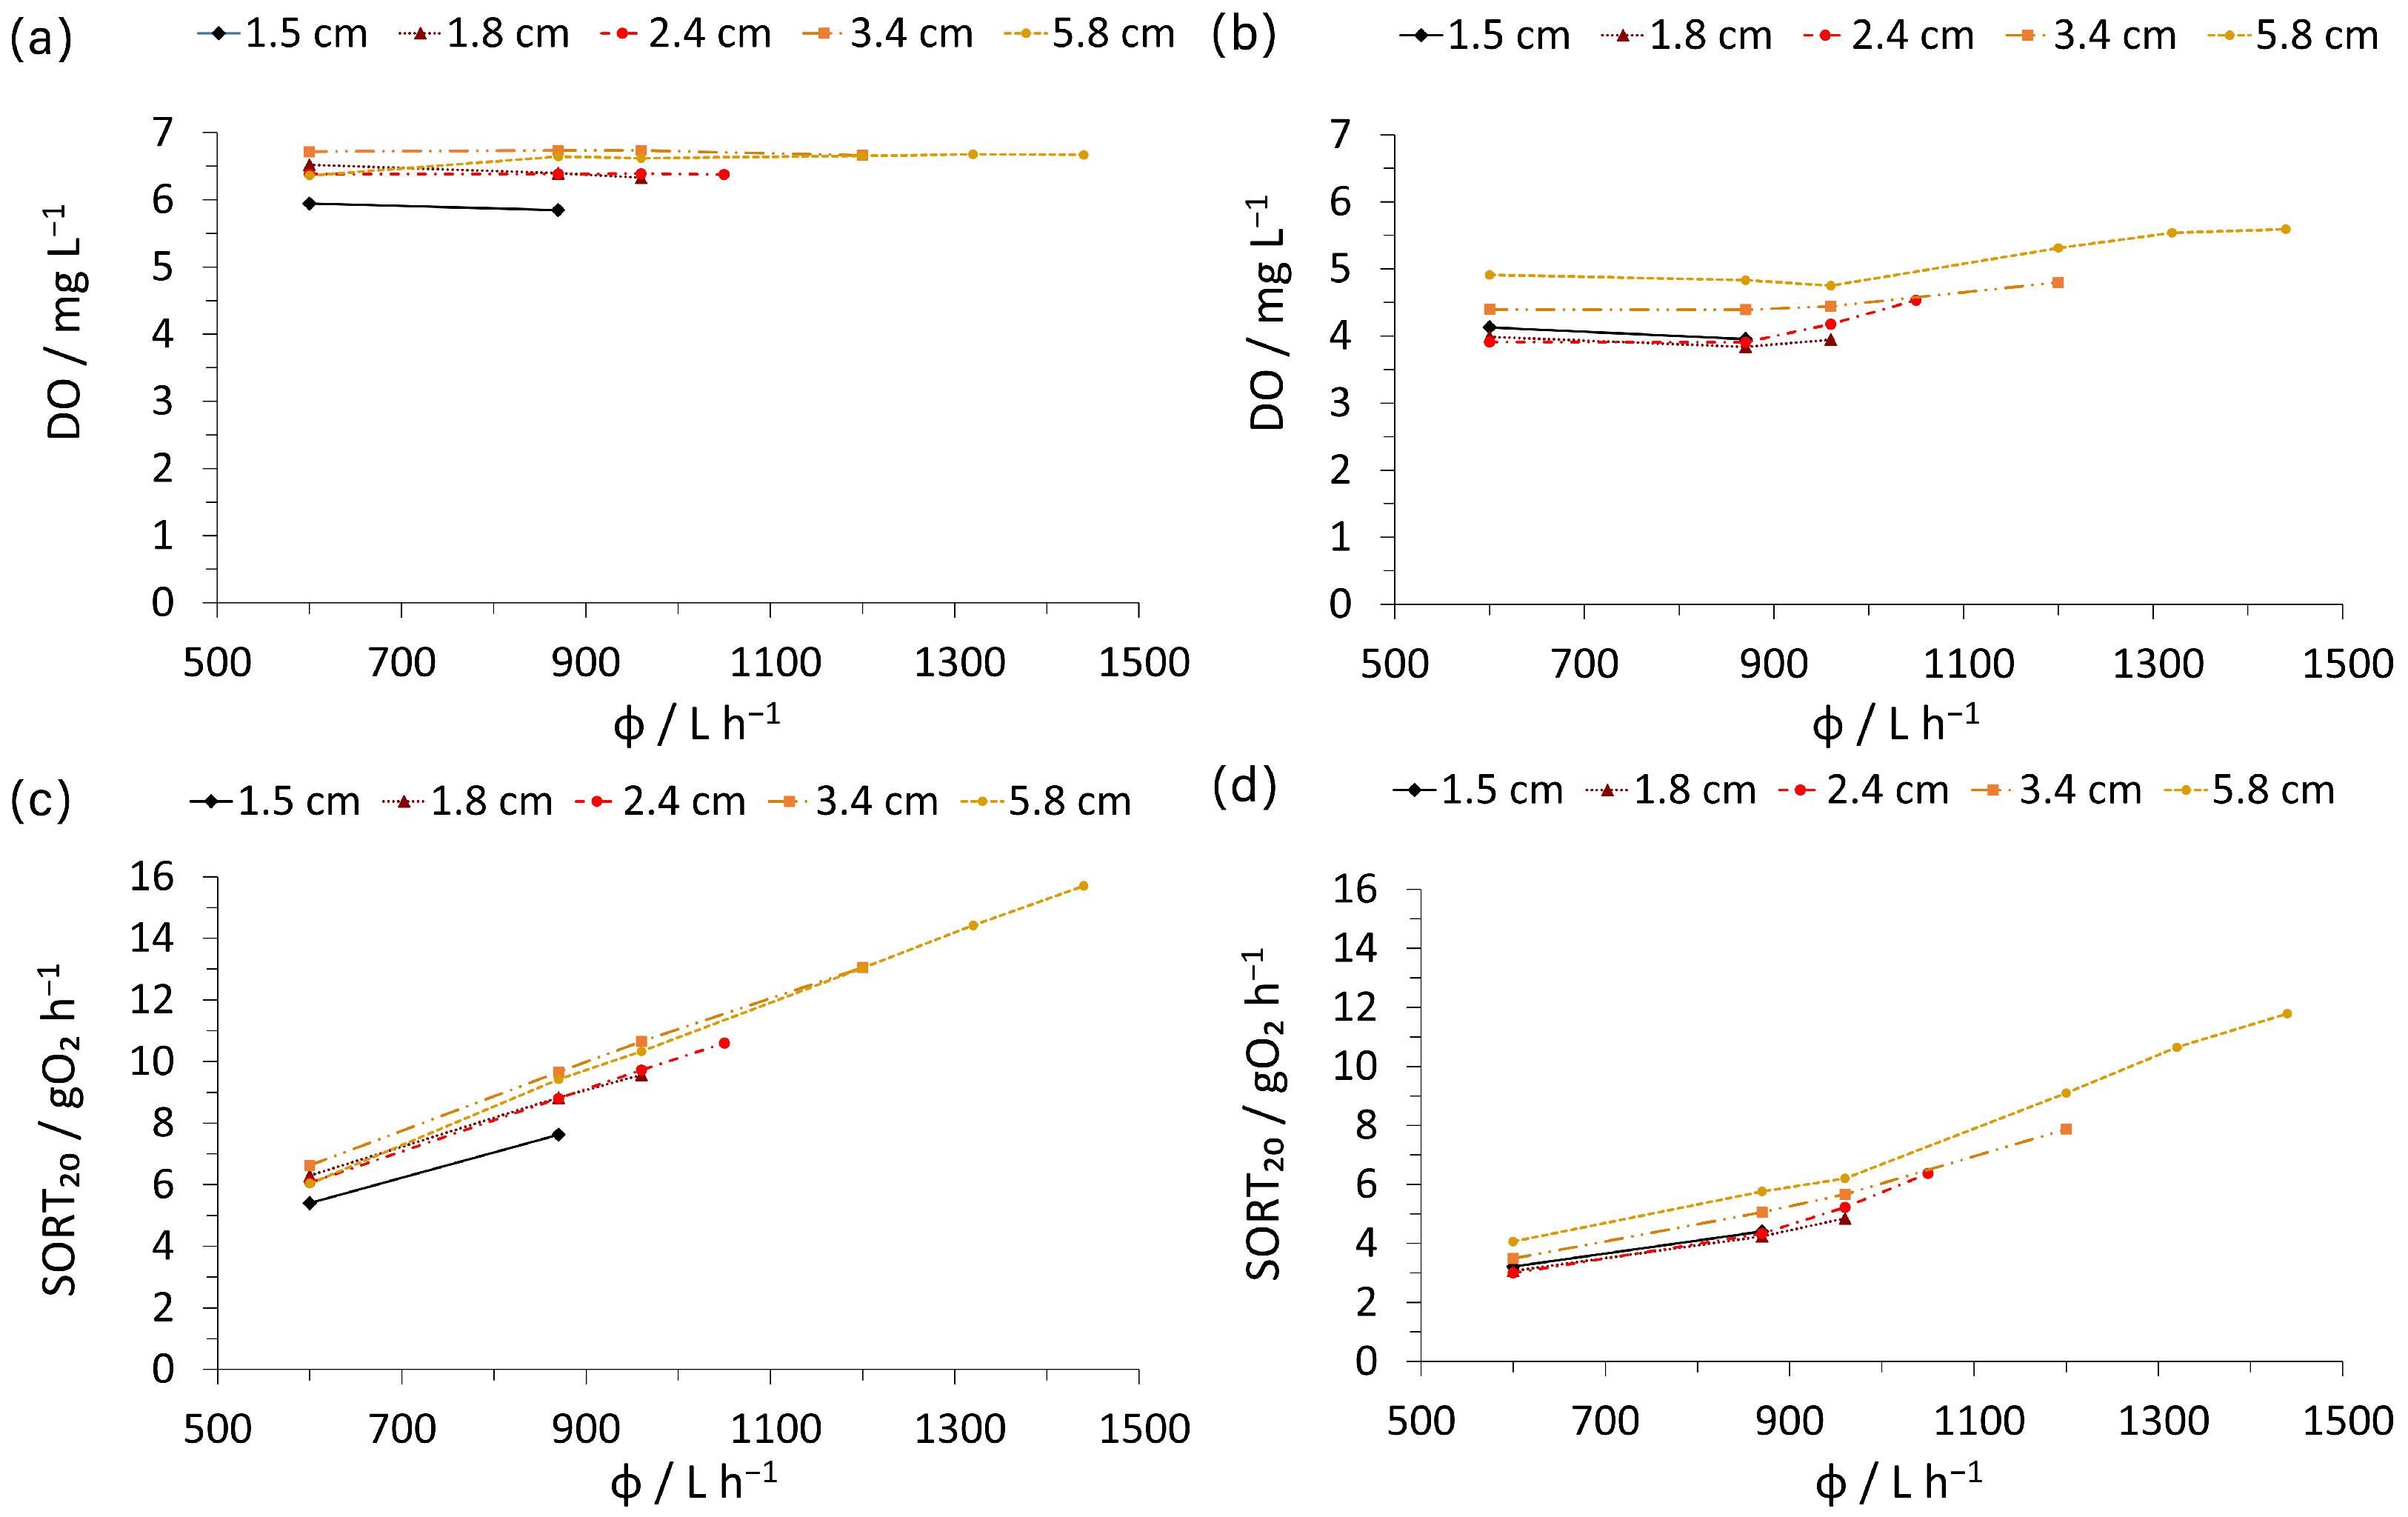
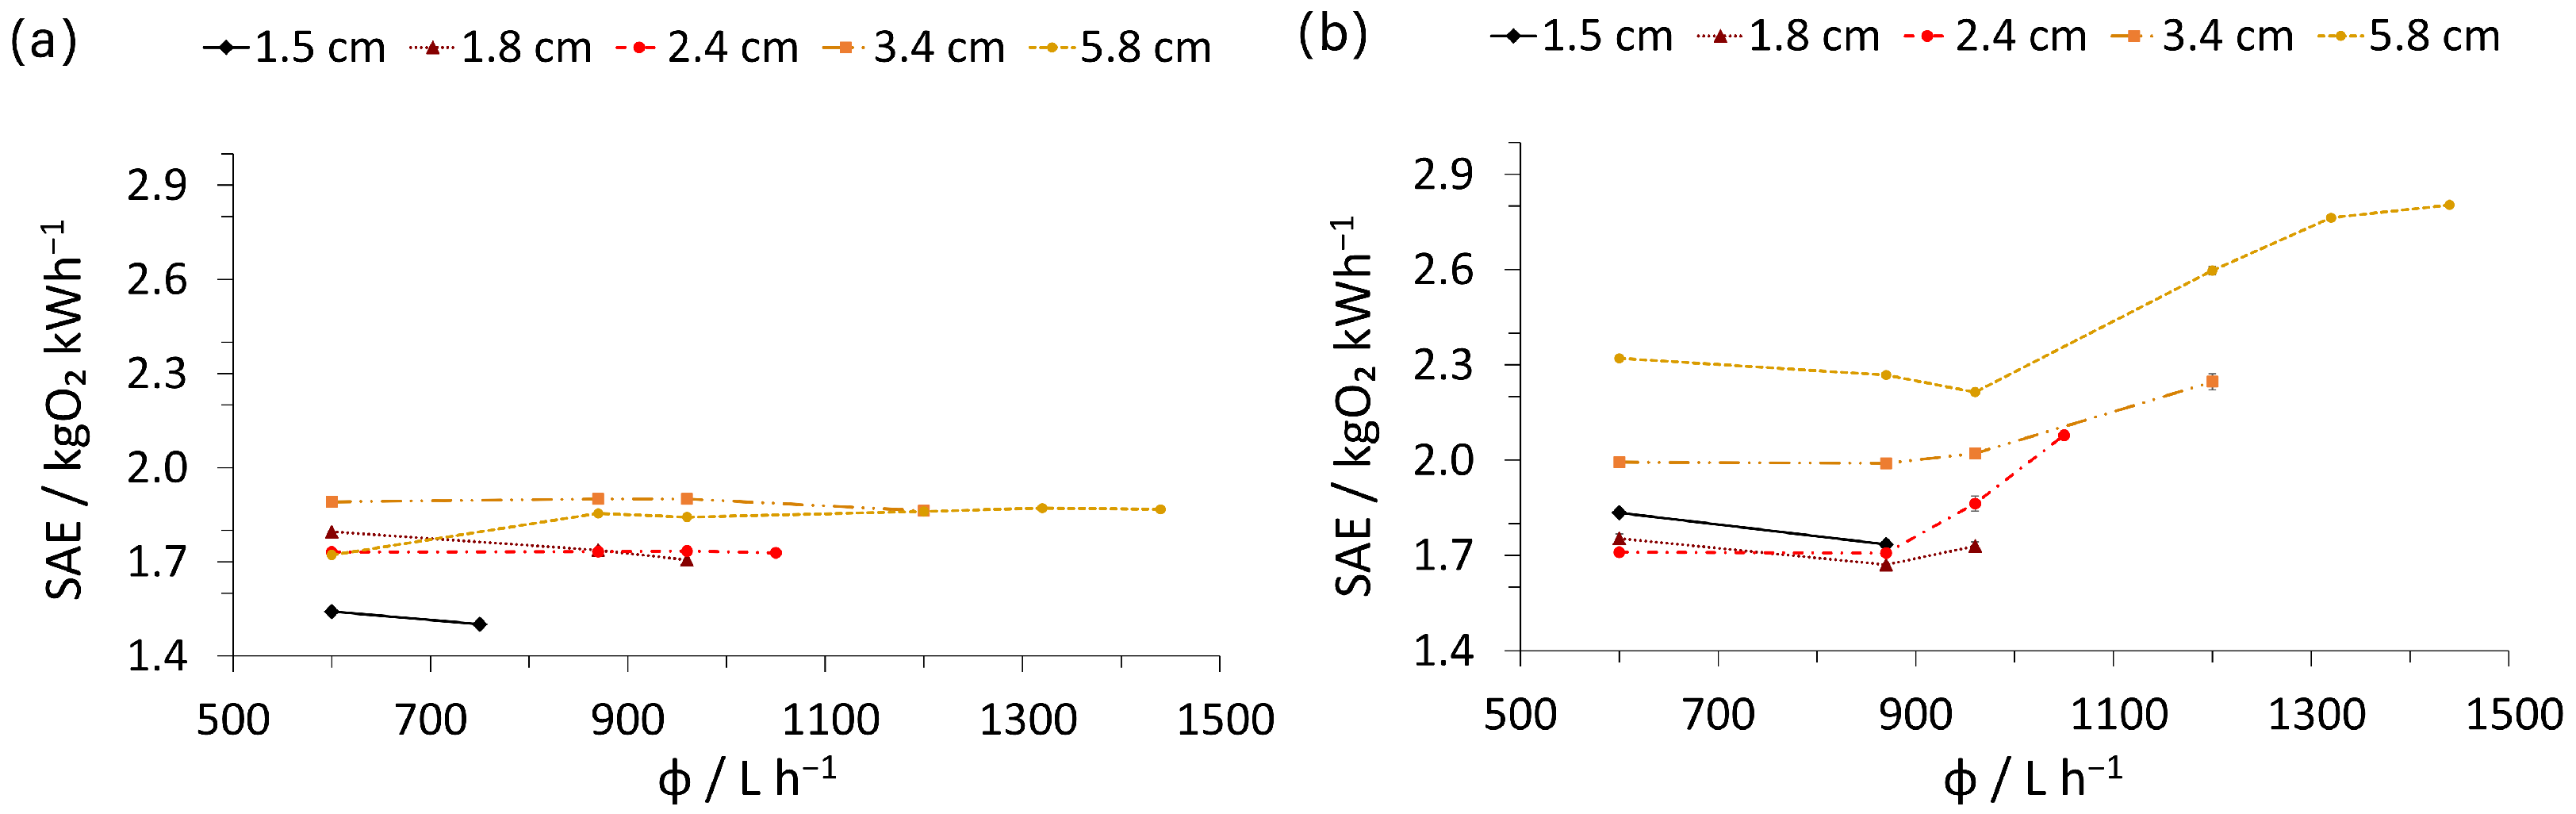
3.3. 3D-Printed Hyperbolic Funnel

A 3D-printed hyperbolic funnel, composed of five stacked sections (Figure 4) with varying outlet diameters, was investigated to assess the influence of the outlet diameter on the umbrella size (Figure 9) and aeration characteristics (Figure 10). An increase in water flow rate and outlet diameter resulted in a corresponding increase in umbrella size and maximum water flow rate through the funnel. The maximum umbrella diameter and water flow rate (Figure 9) were achieved with an outlet diameter of 5.8 cm, reaching 23 cm and 1440 L·h−1, respectively, while with an outlet diameter of 1.5 cm, they were limited to 5 cm and 870 L·h−1, respectively.
Figure 11 shows photographs of the umbrella for an outlet diameter of 5.8 cm at various water flow rates: in Figure 11a, the flow rate is 1440 L·h−1 with a height of 24 cm; in Figure 11b, the flow rate is 960 L·h−1 with a height of 16 cm; and in Figure 11c, the flow rate is 600 L·h−1 with a height of 9.5 cm.
Despite the significant impact of varying the outlet diameter on the maximum flow rate and the umbrella size, it did not substantially alter the DO concentration for the configuration with a distance of 150 cm between the funnel’s inlet and the bottom of the water reservoir (Figure 10a). The minimum DO concentration of 5.8 mg·L−1 was observed with an outlet diameter of 1.5 cm and a flow rate of 870 L·h−1, while the highest concentration of 6.7 mg·L−1 was achieved with an outlet diameter of 5.8 cm and a flow rate of 1320 L·h−1. For the 75 cm height, the differences were more significant, ranging from 3.9 mg·L−1 for an outlet diameter of 2.4 cm at 870 L·h−1 to 5.6 mg·L−1 for the 5.8 cm outlet at 1440 L·h−1 (Figure 10b). This increase was likely due to the shorter distance between the funnel’s outlet and the bottom of the water reservoir compared to the previous case, making the impact of the umbrella more significant. Conversely, due to the higher water flow rates associated with larger outlet diameters, the SOTR20 values differed significantly. For the 5.8 cm outlet at 1440 L·h−1, the SOTR20 reached 15.7 gO2·h−1 at 150 cm (Figure 10c) and 11.8 gO2·h−1 at 75 cm (Figure 10d).
Despite the high SOTR20 for the 150 cm configuration, the maximum SAE of 1.9 kgO2·kWh−1 (Figure 12a) was lower than the maximum SAE for the 75 cm configuration, which reached 2.8 kgO2·kWh−1 (Figure 12b) for a 5.8 cm outlet diameter at a water flow rate of 1440 L·h−1. This difference was attributed to the shorter distance over which the water needed to be pumped in the 75 cm setup.
The best results for both SOTR20 and SAE were obtained with a funnel featuring a 5.8 cm outlet diameter. Based on these findings, the SOTR20 and SAE were compared for the same outlet diameter at different distances between the funnel’s inlet and the bottom of the water reservoir: 150 cm, 75 cm, and the minimum distance required to fit the funnel and umbrella, 40 cm (Figure 13). While the highest SOTR20 of 15.7 gO2·h−1 was achieved at 150 cm, the highest SAE of 2.9 kgO2·kWh−1 was obtained at 40 cm, though with a significantly lower SOTR20 of only 6.1 gO2·h−1. The optimal configuration was suggested to be a height of 75 cm, providing an SOTR20 of 11.8 gO2·h−1 and an SAE of 2.8 kgO2·kWh−1, where the distance is not so great as to consume excessive energy, yet sufficient to ensure significant aeration.
The SOTR20 values of our system were relatively low compared to commercial installations, where SOTR20 is typically measured in kgO2·h−1 rather than gO2·h−1. However, for hyperbolic or cylindrical reactors, achieving higher SOTR20 values is primarily a function of the water flow rate, which depends on the reactor’s size. If the flow rate in our system were increased by several hundred times, the resulting SOTR20 would also be expressed in kgO2·h−1. Nevertheless, upscaling might impact the aeration efficiency in both directions, either enhancing or reducing performance. For this reason, a pilot-scale test is necessary, and the authors plan to conduct such tests in the future. Conversely, the SAE values of the 3D-printed hyperbolic funnel were notably high compared to the SAE ranges of commercially available mechanical aeration systems (Figure 14) [24,25,26,27], exceeding the SAE of widely used horizontal rotors and paddle wheel aerators.
The SAE values of different aeration technologies, such as diffused air systems, can reach up to 7.9 kgO2·kWh−1 for fine bubble diffusers, 5.5 kgO2·kWh−1 for medium bubble tubes, and 4.6 kgO2·kWh−1 for cascade systems [27,28,29]. However, these systems present several disadvantages, including clogging and fouling, increased maintenance requirements, high initial costs for installation, and limited depth applications for diffused air systems, as well as a moderate mixing efficiency. Cascade systems also face challenges, such as their space requirements, lower process control, and issues related to erosion and wear, which can limit their applicability. In contrast, aeration using a hyperbolic funnel shows potential for use in water reservoirs or carousel systems for wastewater and groundwater treatment.
Conventional aeration technologies, such as low-speed aerators, horizontal rotors, and high-speed propellers, are known to generate significant noise pollution, which poses challenges in populated or ecologically sensitive areas [30]. In contrast, a hyperbolic funnel operates with significantly lower noise levels, making it a more suitable option for such environments. Furthermore, the high turbulence created by high-speed propellers and similar technologies disrupts sediment and aquatic ecosystems [31,32], whereas a hyperbolic funnel produces controlled, gentle flows that mitigate these disruptions.
Paddle wheel aerators, commonly used in aquaculture and wastewater treatment, require continuous monitoring to optimize rotational speeds for energy efficiency and cost-effectiveness [32]. Their performance is highly sensitive to operational parameters [33], and they frequently encounter wear and tear to mechanical components, increasing maintenance demands [25].
Low-speed aerators, while effective at providing basic aeration, often fail to achieve efficient oxygen transfer in larger or deeper systems, due to their limited capacity for water mixing. This limitation can result in uneven oxygen distribution, thereby reducing the overall system performance [25].
Mechanical systems, such as horizontal rotors and discs, also demand regular maintenance to address issues of wear and fouling [34]. In contrast, a hyperbolic funnel’s static, geometry-based operation significantly minimizes maintenance requirements. Unlike traditional systems with fixed designs, which limit their adaptability across varying water depths or configurations, the modular nature of the hyperbolic funnel offers flexibility for customization. Its operation without moving parts further enhances its reliability by reducing maintenance requirements and ensuring consistent oxygenation throughout the water column. Additionally, the hyperbolic funnel’s compact and modular design effectively addresses challenges related to energy efficiency and scalability.
By overcoming these drawbacks, the hyperbolic funnel emerges as a robust alternative, excelling in low maintenance, minimal noise generation, environmental sustainability, and operational flexibility.

4. Conclusions

A hyperbolic funnel and cylindrical reactors were evaluated for aeration efficiency, focusing on key parameters such as DO concentration, SOTR, and SAE (Figure 5 and Figure 6). Our results confirmed previous findings [5,18] that a hyperbolic funnel configuration significantly enhances the gas–liquid interfacial area within a water vortex (Table 1), surpassing that of a cylindrical reactor. In contrast, a hyperbolic vortex formed in a cylindrical reactor promotes water umbrella formation at its outlet due to the higher water pressure from the increased water volume, thereby expanding the water–air interface and enhancing aeration capabilities. For this reason, a hyperbolic funnel proves more effective for vortex-driven aeration, but a hyperbolic vortex in a cylindrical reactor shows superior performance concerning umbrella-based aeration. In an optimum situation, the higher water pressure of the cylindrical reactor would be effectively offset in the hyperbolic funnel by applying higher water flow rates. For practical purposes, a precise analysis of the given parameters (e.g., flow rate) and the required performance (e.g., desired final DO concentration) for a certain application is required to decide which configuration is best suited.
A cascade system comprising three hyperbolic funnels (Figure 3) was also tested under both umbrella and non-umbrella regimes. The umbrella regime consistently outperformed the cascade system in both SOTR20 and SAE metrics (Figure 7 and Figure 8).
A 3D-printed funnel (Figure 4) was utilized to investigate the influence of the funnel length outlet diameter, revealing that bigger outlet diameters can increase umbrella sizes by increasing the flow rate (Figure 9), which, in turn, improves the aeration efficiency. The positioning of the funnel relative to the ground is also a key factor affecting SOTR20 and SAE, since funnel placements at an increased height result in increased SOTR20 but a decrease in SAE (Figure 10 and Figure 12). For the system under study, an optimal funnel height of 75 cm above the ground was identified, providing a balanced performance with elevated SOTR20 and optimal SAE (Figure 13). Notably, the 3D-printed funnel with an outlet diameter of 5.8 cm demonstrated superior performance, outperforming all other reactors tested.
Although the SOTR20 values of the systems tested were relatively low, due to the small treated water volumes, we expect that these values could be enhanced through reactor upscaling. The SAE values, reaching up to 2.9 kgO2·kWh−1, exceed those of commercially available mechanical aeration systems (Figure 14), underscoring the potential of this technology for wastewater and groundwater treatment applications.

Author Contributions

R.K.: Formal analysis, Methodology, Investigation, Writing—Original Draft, Visualization; L.C.: Investigation, Visualization, Formal analysis; M.B.A.C.: Methodology, Supervision; L.L.F.A.: Methodology, Writing—Review and Editing, Supervision, Project administration; E.C.F.: Methodology, Writing—Review and Editing, Visualization, Supervision, Project administration; J.W.: Methodology, Writing—Review and Editing, Supervision; W.F.L.M.H.: Methodology, Writing—Review and Editing, Supervision. All authors have read and agreed to the published version of the manuscript.

Funding

This research received funding from the European Union’s Horizon 2020 research and innovation program under the Marie Sklodowska-Curie Grant Agreement No. 665874 and the Gilbert—Armstrong lab.

Data Availability Statement

The raw data supporting the conclusions of this article will be made available by the authors on request.

Acknowledgments

This work was performed within the cooperation framework of Wetsus European Center of Excellence for Sustainable Water Technology (www.wetsus.eu) within the Applied Water Physics theme. Wetsus was cofounded by the Dutch Ministry of Economic Affairs and Ministry of Infrastructure and Environment, The Province of Friesland and the Northern Netherlands Provinces. During the preparation of this work, the authors used OpenAI (2023) ChatGPT (version 3.5) [large language model] in order to structure the text and to correct spelling and grammar issues. After using this tool, the authors reviewed and edited the content as needed and take full responsibility for the content of the publication.

Conflicts of Interest

The authors declare that they have no known competing financial interests or personal relationships that could have appeared to influence the work reported in this paper.

Abbreviations

DODissolved oxygen
SOTR20Standard oxygen transfer rate at 20 °C
SAEStandard aeration efficiency
HRTHydraulic retention time
RTDResidence time distribution
K L a Volumetric liquid-phase mass transfer coefficient
K L a 20 Volumetric liquid-phase mass transfer coefficient normalized to 20 °C
FSVsFree-surface vortices

References

  1. Tsuji, K.; Müller, S.C. Spirals and Vortices in Culture, Nature, and Science; Springer Nature: Cham, Switzerland, 2019. [Google Scholar] [CrossRef]
  2. Radlberger, C. Der Hyperbolische Kegel; PKS Eigenverlag: Bad Ischl, Austria, 2014; Available online: https://www.scribd.com/doc/54990676/Radlberger-Der-Hyperbolische-Kegel-Nach-Walter-Schauberger-2002?language_settings_changed=English (accessed on 1 December 2024).
  3. Fitzke, F.; Mende, M.; Sindelar, C.; Werdenberg, N.; Schauberger, J.; Sàlat, A.; Grober, O. Instream River Training (IRT)—Naturnaher Flussbau nach Viktor Schauberger—Handbuch (v3.8)—eBook; Franz Fitzke, PKS Pythagoras Kepler System, Verein für Implosionsforschung: Bad Ischl, Austria, 2020; Available online: https://www.researchgate.net/publication/379669864_Instream_River_Training_IRT_-_Naturnaher_Flussbau_nach_Viktor_Schauberger_-_Handbuch_v38_-_eBook (accessed on 1 December 2024).
  4. Klymenko, R.; Nanninga, H.; de Kroon, E.; Agostinho, L.L.F.; Fuchs, E.C.; Woisetschläger, J.; Hoeben, W.F.L.M. Preparation of Free-Surface Hyperbolic Water Vortices. JoVE 2023, 197, e64516. [Google Scholar] [CrossRef] [PubMed]
  5. Agostinho, L.L.; Pecnik, R.; Woisetschläger, J.; de Kroon, E.; Şişcanu, N.; van de Griend, M.V.; Loiskandl, W.; Fuchs, E.C. Enhanced Oxygen Volumetric Mass Transfer in a Geometrically Constrained Vortex. Water 2022, 14, 771. [Google Scholar] [CrossRef]
  6. de Kroon, E. Iron Oxidation in Groundwater Using a Hyperbolic Water Vortex System. Master’s Thesis, Environmental Sciences and Chemical Engineering Van Hall Larenstein University of Applied Sciences, Leeuwarden, The Netherlands, 2021. [Google Scholar]
  7. van den Brink, C.; Frapporti, G.; Griffioen, J.; Zaadnoordijk, W.J. Statistical analysis of anthropogenic versus geochemical-controlled differences in groundwater composition in The Netherlands. J. Hydrol. 2007, 336, 470–480. [Google Scholar] [CrossRef]
  8. Rijksoverheid. Besluit Kwaliteit Drinkwater BES. 2010. Available online: https://wetten.overheid.nl/BWBR0028642/2010-10-10 (accessed on 1 December 2024).
  9. Chaturvedi, S.; Dave, P.N. Removal of iron for safe drinking water. Desalination 2012, 303, 1–11. [Google Scholar] [CrossRef]
  10. OpenCourseWare, T.D. Aeration and Gas Stripping. 2015. Available online: https://ocw.tudelft.nl/wp-content/uploads/Aeration-and-gas-stripping-1.pdf (accessed on 1 December 2024).
  11. Pöpel, H.J. Aeration and Gas Transfer; International Reference Centre for Community Water Supply: The Hague, The Netherlands, 1976; Available online: https://www.ircwash.org/sites/default/files/251-74AE.pdf (accessed on 1 December 2024).
  12. Rosso, D.; Stenstrom, M.K.; Larson, L.E. Aeration of large-scale municipal wastewater treatment plants: State of the art. Water Sci. Technol. 2008, 57, 973–978. [Google Scholar] [CrossRef] [PubMed]
  13. Drewnowski, J.; Remiszewska-Skwarek, A.; Duda, S.; Łagód, G. Aeration Process in Bioreactors as the Main Energy Consumer in a Wastewater Treatment Plant. Review of Solutions and Methods of Process Optimization. Processes 2019, 7, 311. [Google Scholar] [CrossRef]
  14. Marappan, J.; Anathaikamatchi, B.A.; Sakkarai, S.; Thiagarajan, R.; Muthusamy, D.; Kuppusamy, M.; Moturi, M.; Bera, A.; Ramasamy, P.; Shanmugam, S. Assessment of the new generation aeration systems efficiency and water current flow rate, its relation to the cost economics at varying salinities for Penaeus vannamei culture. Aquac. Reasearch 2020, 51, 2112–2124. [Google Scholar] [CrossRef]
  15. Benjamin, M.M.; Lawler, D.F. Water Quality Engineering: Physical/Chemical Treatment Processes Analysis; Wiley: Hoboken, NJ, USA, 2013; pp. 155–257. Available online: https://www.wiley.com/en-ie/Water+Quality+Engineering%3A+Physical+%2F+Chemical+Treatment+Processes-p-9781118169650 (accessed on 1 December 2024).
  16. Levenspiel, O. Tracer Technology; Springer: New York, NY, USA, 2012; pp. 30–33. [Google Scholar] [CrossRef]
  17. Mulligan, S.; Cesare, G.D.; Casserly, J.; Sherlock, R. Understanding turbulent free-surface vortex flows using a Taylor-Couette flow analogy. Sci. Rep. 2018, 8, 824. [Google Scholar] [CrossRef] [PubMed]
  18. Donepudi, T.; van de Griend, M.; Agostinho, L.; de Kroon, E.; Klymenko, R.; Pecnik, R.; Woisetschläger, J.; Fuchs, E. Numerical Analysis of Vortex Dynamics in Hyperbolic Funnels Using Computational Fluid Dynamics. Phys. Fluids 2024, 36, 095171. [Google Scholar] [CrossRef]
  19. Donepudi, T. Vortices in Hyperbolic Funnels as Aeration Systems A Numerical Study. Master’s Thesis, Faculty of Mechanical, Maritime and Materials Engineering, Delft University of Technology, Delft, The Netherlands, 2021. [Google Scholar]
  20. Klymenko, R.; de Kroon, E.; Agostinho, L.L.F.; Fuchs, E.C.; Woisetschläger, J.; Hoeben, W.F.L.M. Characterization of a hyperbolic vortex plasma reactor for the removal of aqueous phase micropollutants. J. Phys. D Appl. Phys. 2024, 57, 215204. [Google Scholar] [CrossRef]
  21. van de Griend, M. On the Theory and Applications of Hyperbolic Water Vortices. Ph.D. Thesis, University of Natural Resources and Life Sciences, Vienna, Austria, 2023. [Google Scholar]
  22. Cardoso, P.; Santos, A.; Rato, R.; Estrela, M. Assessment of Pump’s Performance in Water Supply Systems – Data Collected from Multiple Case Studies. J. Sustain. Dev. 2017, 6, 217. [Google Scholar] [CrossRef]
  23. Martin-Candilejo, A.; Santillán, D.; Garrote, L. Pump Efficiency Analysis for Proper Energy Assessment in Optimization of Water Supply Systems. Water 2020, 12, 132. [Google Scholar] [CrossRef]
  24. Roya, S.M.; Tanveerb, M.; Guptac, D.; Pareeka, C.M.; Mald, B.C. Prediction of standard aeration efficiency of a propeller diffused aeration system using response surface methodology and an artificial neural network. Water Supply 2021, 8, 4534. [Google Scholar] [CrossRef]
  25. Tanveer, M.; Roy, S.M.; Vikneswaran, M.; Renganathan, P.; Balasubramanian, S. Surface aeration systems for application in aquaculture: A review. Int. J. Fish. Aquat. Stud. 2018, 6, 342–347. [Google Scholar]
  26. Bahri, S.; Setiawan, R.P.A.; Hermawan, W.; Junior, M.Z. Design and Mechanism Analysis of Paddlewheel Aerator with Movable Blades. IOP Conf. Ser. Mater. Sci. Eng. 2019, 532, 012011. [Google Scholar] [CrossRef]
  27. Samstag, R.W.; Engineers, P.C. Overview of Wastewater Aeration. 2011. Available online: https://rsamstag.wordpress.com/wp-content/uploads/2015/02/aeration.pdf (accessed on 1 December 2024).
  28. Xylem. Aeration Products for Energy-Efficient Biological Treatment. 2024. Available online: https://www.xylem.com/siteassets/campaigns/oceania/sanitaire-aeration-product-range/aeration-product-range-brochure-updated2.pdf (accessed on 1 December 2024).
  29. Roy, S.M.; Machavaram, R.; Pareek, C.; Kim, T. Investigating the performance of a perforated pooled circular stepped cascade aeration system for intensive aquaculture. Heliyon 2024, 10, e26367. [Google Scholar] [CrossRef] [PubMed]
  30. Zhang, Y.; Shitu, A.; Hang, S.; Ye, Z.; Zhao, H.; Xu, W.; Zhao, J.; Zhu, S. The effects of aerator noise on the swimming, feeding, and growth of Micropterus Salmoides. Front. Mar. Sci. 2023, 10. [Google Scholar] [CrossRef]
  31. Rodriguez, J.P.; Garcia, M.L.; Chen, X.; Li, W. Propeller-Induced Sediment Transport and Its Environmental Implications in Aquatic Systems. Water 2023, 16, 1647. [Google Scholar] [CrossRef]
  32. Roshan, R.U.; Harini, R.; Anand, T. Development of Integrated Aerator combining Paddlewheel and Propeller Aspirator Aerators for Shrimp Farming. In Next Generation Materials and Processing Technologies; Springer: Singapore, 2021; pp. 67–79. [Google Scholar] [CrossRef]
  33. Roy, S.; Moulick, S.; Mukherjee, C.K.; Mal, B.C. Effect of Rotational Speeds of Paddle Wheel Aerator on Aeration Cost. ResearchGate 2015, 2, 3069–3087. [Google Scholar]
  34. Aeration Store. DiscoPM Aeration System: User Manual. Available online: https://www.aerationstore.com/Downloads/discopm_manual.pdf (accessed on 1 December 2024).
Figure 1. Sketch of the experimental setup, without (a) and with (b) the umbrella regime. The components included a (1) Groundwater pump (SAER Elettropompe S.p.A., Guastalla, Italy; Model 3637899, H/150); (2, 3, 4, 5) Polymer optical fibers for DO detection (PreSens Precision Sensing GmbH, Regensburg, Germany; Model POF-L2.5-2SMA, OXY-1 SMA) and temperature sensors (Innovative Sensor Technology IST AG, Ebnat-Kappel, Switzerland; Model Pt100, TEP-L5-St62-OD5.4/3.3); (6) Fiber-optic oxygen transmitter (PreSens Precision Sensing GmbH, Regensburg, Germany; Model SACN0002000005, Fibox 3); (7) Laptop with installed SoftProSens v.2.26 software; (8, 9) Water flow meters (Endress+Hauser AG, Reinach, Switzerland; Model P7066819000, Picomag); (10, 11) Control valves (+GF+ Georg Fischer Ltd., Schaffhausen, Switzerland; Model 625DN20, Typ514); (12, 13) Reactors; (14, 15) Water drains; (16) Water reservoir; and (17) vortex “umbrella”.
Water 17 00506 g001
Figure 2. Water vortex reactors combined with the “umbrella” effect: (a) hyperbolic glass funnel; (b) cylindrical reactor; and (c) 3D-printed hyperbolic funnel.
Water 17 00506 g002
Figure 3. Sketch of the cascade funnel setup. The components included a (1) Water pumps (EHEIM GmbH & Co. KG, Deizisau, Germany; Model 1101.220) and (SAER Elettropompe S.p.A., Guastalla, Italy; Model 3637899, for groundwater); (2) Control needle valve (FPM, EM-Technik GmbH, Maxdorf, Germany); (3) Water flow meter (Endress+Hauser AG, Reinach, Switzerland; Model P7066819000, Picomag); (4,8) Polymer optical fibers for DO detection (PreSens Precision Sensing GmbH, Regensburg, Germany; Model POF-L2.5-2SMA, OXY-1 SMA) and temperature sensors (Innovative Sensor Technology IST AG, Ebnat-Kappel, Switzerland; Model Pt100, TEP-L5-St62-OD5.4/3.3); (5,6,7) Hyperbolic funnels; (9) Water drain; (10) Fiber-optic oxygen transmitter (PreSens Precision Sensing GmbH, Regensburg, Germany; Model SACN0002000005, Fibox 3); (11) Laptop with installed SoftProSens v.2.26 software.
Water 17 00506 g003
Figure 4. Sketch of 3D-printed hyperbolic funnel, consisting of removable parts with different outlet diameters.
Water 17 00506 g004
Figure 5. DO concentrations (a) and SOTR20 (b) for the glass hyperbolic funnel and cylindrical reactor at various water flow rates, comparing configurations with (Funnel (Umbrella) and Cylinder (Umbrella)) and without (Funnel and Cylinder) umbrella formation.
Water 17 00506 g005
Figure 6. SAE of the glass hyperbolic funnel and cylindrical reactor at various water flow rates, comparing configurations with (Funnel (Umbrella) and Cylinder (Umbrella)) and without (Funnel and Cylinder) the umbrella regime.
Water 17 00506 g006
Figure 7. DO concentrations (a) and SOTR20 (b) for the cascade setup at a flow rate of 105 ± 3 L·h−1 for the different configurations: a single funnel without an umbrella; two funnels without umbrellas; three funnels without an umbrella; a single funnel with an umbrella; and a three-funnel system, where the first two funnels lacked umbrellas, and the third funnel included an umbrella.
Water 17 00506 g007
Figure 8. SAE of the cascade setup at a flow rate of 105 L·h−1 for different configurations: a single funnel without an umbrella; two funnels without umbrellas; three funnels without umbrellas; a single funnel with an umbrella; and a three-funnel system, where the first two funnels lacked umbrellas, and the third funnel included an umbrella.
Water 17 00506 g008
Figure 9. Diameter of the umbrella for the 3D-printed funnel at various water flow rates, for different outlet diameters (different removable parts).
Water 17 00506 g009
Figure 10. DO concentrations (a,b) and SOTR20 (c,d) for the 3D-printed hyperbolic funnel at various water flow rates, for different outlet diameters (different removable parts), measured at two distances between the funnel’s inlet and the bottom of the water reservoir, where the treated water was collected: 150 cm (a,c) and 75 cm (b,d).
Water 17 00506 g010
Figure 11. Photos of the umbrella for the 3D-printed funnel for outlet diameter of 5.8 cm at various water flow rates: (a) 1440 L·h−1, (b) 960 L·h−1, and (c) 600 L·h−1.
Water 17 00506 g011
Figure 12. SAE for the 3D-printed hyperbolic funnel at various water flow rates, for different outlet diameters (different removable parts), measured at two distances between the funnel’s inlet and the bottom of the water reservoir, where the treated water was collected: 150 cm (a) and 75 cm (b).
Water 17 00506 g012
Figure 13. SOTR20 (a) and SAE (b) for the 3D-printed hyperbolic funnel at various water flow rates, and for different outlet diameters (different removable parts) and distances between the funnel’s inlet and the bottom of the water reservoir, where the treated water was collected.
Water 17 00506 g013
Figure 14. Comparison of SAE ranges between commercially used mechanical aeration systems and the 3D-printed hyperbolic funnel [24,25,26,27].
Water 17 00506 g014
Table 1. The water volume in the reactor (V), umbrella diameter ( D u ), and vortex gas–liquid interface area ( S v ) at varying flow rates ( φ ) for the hyperbolic glass funnel and cylindrical reactor configurations.
φ /L·h−1FunnelCylinder
V/LDu/cmSv/cm2V/LDu/cm Sv/cm2
7200.41.819930.71492
8400.52.319732.314.593
9600.82.5193341594
10801.23.819034.714.295
12001.65.51823515.596
13205.1617937.61699
Disclaimer/Publisher’s Note: The statements, opinions and data contained in all publications are solely those of the individual author(s) and contributor(s) and not of MDPI and/or the editor(s). MDPI and/or the editor(s) disclaim responsibility for any injury to people or property resulting from any ideas, methods, instructions or products referred to in the content.

