Article

Determination of the Occurrence of Trihalomethanes in the Drinking Water Supply of the City of Cuenca, Ecuador

by
Bolívar Hernández
1,
Paola Duque-Sarango
1,*,
María Dolores Tonón
2,
Mónica Abril-González
2,
Verónica Pinos-Vélez
2,3,
Cristian R. García-Sánchez
4 and
Manuel J. Rodríguez
4
1
Grupo de Investigación sobre Recursos Hídricos (GIRH-UPS), Universidad Politécnica Salesiana, El Vecino Campus, Calle Vieja 12-30 y Elia Liut, Cuenca 010203, Ecuador
2
Department of Water Resources and Environmental Sciences, Universidad de Cuenca, Eco-Campus Balzay, Av. Victor Manuel Albornoz, Cuenca 010202, Ecuador
3
Department of Biosciences, Ecocampus Balzay, Universidad de Cuenca, Cuenca 010202, Ecuador
4
Graduate School of Land Planning and Regional Development, Faculty of Planning, Architecture, Art and Design, Université Laval, Québec City, QC G1V 0A6, Canada
*
Author to whom correspondence should be addressed.
Water 2025, 17(4), 591; https://doi.org/10.3390/w17040591
Submission received: 15 January 2025 / Revised: 7 February 2025 / Accepted: 13 February 2025 / Published: 18 February 2025

Abstract

:
Water chlorination, fundamental for its microbiological safety, generates by-products, such as trihalomethanes (THMs), potentially associated with carcinogenic and reproductive risks. This study determined the levels of chloroform (CHCl3) in drinking water in Cuenca, Ecuador, a topic that has been little explored in the region. During five months, water samples were collected from three water treatment systems (Cebollar, Tixan, and Sustag), and in situ measurements of physicochemical parameters such as free chlorine, pH, temperature, electrical conductivity, and turbidity were performed in the storage and distribution area. The determination of CHCl3 was performed following the Hach protocol. For data analysis, the Kruskal–Wallis test was employed, followed by Dunn’s post hoc method and Spearman’s correlation coefficient. The results revealed a progressive decrease in free residual chlorine throughout the distribution systems. CHCl3 concentrations ranged from 11.75 µg/L to 21.88 µg/L, remaining below the Ecuadorian regulatory limit of 300 µg/L. There was no consistent correlation between CHCl3 and physicochemical parameters. These findings align with previous research, suggesting that the variability in CHCl3 formation is associated with different water treatment conditions and environmental variables. This study highlights the importance of monitoring disinfection processes to minimize THMs and other DBPs, ensure public health, and contribute to sustainable drinking water management in Ecuador.

1. Introduction

Water scarcity and insecurity represent critical challenges in today’s world, putting the health and safety of the population at risk in the short and long term [1]. In this context, ensuring the microbiological safety of drinking water is fundamental in water treatment systems [2], with chlorine disinfection being a common practice to inactivate microorganisms and prevent their development during water storage and distribution [3]. This process aims to eliminate pathogenic organisms present in water to make it suitable for human consumption and other domestic activities [4,5]. Access to water in adequate quantity, which is safe, of acceptable quality, and economically accessible, is recognized as a fundamental human right and constitutes a key element in the Sustainable Development Goals [6].
Chemical methods to disinfect water mainly include the use of chlorine, chlorine dioxide, ozone, and chloramines, which have been widely applied worldwide for several decades [7,8]. However, the generation of numerous disinfection by-products (DBPs) represents a significant concern, especially in chlorinated drinking water, because chlorination byproducts, such as THMs, are frequently used as indicators of other DBPs [9]. THMs are usually the most abundant type of DBPs in chlorinated water. The formation of these by-products depends mainly on the number of precursors (organic and inorganic materials present in the untreated water), the characteristics of the treatment and disinfection processes [10], environmental conditions (such as water temperature), and distribution conditions (especially the water residence time). Worldwide, more than 700 types of DBPs have been detected in drinking water, from which the most studied groups are THMs and haloacetic acids (HAAs) [11,12]. The species present in the highest concentrations in chlorinated drinking water is commonly chloroform (CHCl3) [13], especially when raw water contains little levels of bromide.
Chlorine doses and free residual chlorine are key factors in the formation of THMs. The primary sources of chlorine in drinking water include direct chlorination during water treatment and residual chlorine from distribution networks. Additionally, industrial and agricultural activities may contribute to chlorine-based compounds in source waters. Therefore, having monitoring data for residual chlorine and a thorough understanding of the mechanisms of its decay, as well as the processes leading to the formation of THMs, is essential to effectively manage these compounds in water supply systems [11,14]. Primarily, the formation of THMs occurs through the reaction of chlorine with natural organic matter (NOM) over time, a process that depends not only on the amount but also on the specific type of organic matter [15,16]. In addition, the physicochemical properties of water, such as temperature, pH, and presence of chlorophyll and nitrogen content, significantly influence chlorine demand and THM formation. Also, since water quality parameters can vary considerably over time and space (within the distribution system), these fluctuations also affect chlorine demand and, consequently, DBP management [16].
The issue of potential human health effects from exposure to DBPs is a matter of significant concern, as well as their potential reproductive and developmental implications [17]. The main route of exposure to THMs is ingestion, although dermal and inhalation exposure is also relevant, considering that these compounds are volatile at room temperature [18]. Several epidemiological studies have established associations between chlorination byproducts and a variety of diseases, such as musculoskeletal congenital disabilities [19], kidney disease [20], low birth weight [21], effects on male reproductive health, impaired ovarian function in women [22,23], increased risk of bladder cancer [24], and risk of colorectal cancer [25].
Several techniques have been reported for the determination of THMs in water, including advanced methods such as gas chromatography–negative chemical ionization–mass spectrometry (GC-NCI-MS), gas chromatography with electron capture detection (GC-ECD), and the Purge and Trap technique coupled with GC-ECD, which offer high precision and sensitivity [26,27,28]. Other approaches include the head-space technique coupled with gas chromatography–mass spectrometry (HS-GC-MS) and solid phase microextraction (SPME) or liquid phase microextraction (LPME) techniques, valuable for their simplicity and low solvent consumption when combined with GC-ECD or GC-MS [29,30]. In addition, modern artificial intelligence-based methods, such as artificial neural networks and support vector machines, have been explored to predict the presence of THMs using Python® and MATLAB® [31].
Additionally, more accessible methods have been investigated, such as spectrophotometric and colorimetric methods, known for their ease of implementation and low cost. These techniques have proven to be effective for monitoring THMs trends in the field [32,33]. In this context, the Hach THM Plus™ colorimetric method (method 10,132) is included among the available options for THMs evaluation, being recognized in recent studies for its ability to generate reliable results under specific conditions [34,35].
International agencies have set standards and guidelines for the presence of THMs in drinking water. The U.S. Environmental Protection Agency [36] set a limit of 0.08 mg/L for total THMs, while the World Health Organization [37] sets specific guideline levels for the various species: 0.3 mg/L for chloroform, 0.1 mg/L for bromoform, 0.1 mg/L for dibromochloromethane, and 0.06 mg/L for bromodichloromethane. In the European Union, the regulation establishes a maximum limit of 0.1 mg/L for total THMs [38]. Ecuadorian regulations [39] establish maximum permissible limits for some compounds: 0.3 mg/L for chloroform, 3.0 mg/L for monochloramine, and 0.06 mg/L for bromodichloromethane. In Ecuador, although there are studies on water quality, few have focused on DBPs, such as the study by Salazar-Flores et al. [40]. While these studies have been valuable, their scope has been limited in terms of geographical coverage and the number of compounds analyzed. Furthermore, advanced analytical techniques that could enable more precise detection have not been explored. This lack of research on THMs hinders the assessment of regulatory compliance and the control of public health risks. In addition, to mitigate THM formation, alternative disinfection methods such as chloramination and advanced oxidation processes (AOPs) can be considered. On the other hand, optimizing chlorine dosing and applying precursor removal strategies (e.g., activated carbon filtration) can significantly reduce THM formation while maintaining adequate disinfection levels [37].
In this context, this study in Ecuador represents a crucial advance in understanding the spatio-temporal occurrence of CHCl3, one of the most common THMs in drinking water. In Cuenca canton, there is an aggravated scenario due to the limited surveillance of DBPs, which generates unawareness of the problem and hinders the implementation of adequate measures. The purpose of this research is to evaluate the presence of CHCl3 in the drinking water supply of the city of Cuenca, Ecuador, a topic that has been little explored in the country. The innovative contribution of this study lies in the application of field photometric techniques for the detection of CHCl3, an approach that seeks to facilitate the future development of water quality control and monitoring strategies. In addition, the research responds to the lack of data on DBP in the region, providing valuable information on its occurrence and possible implications on public health and drinking water quality.

2. Materials and Methods

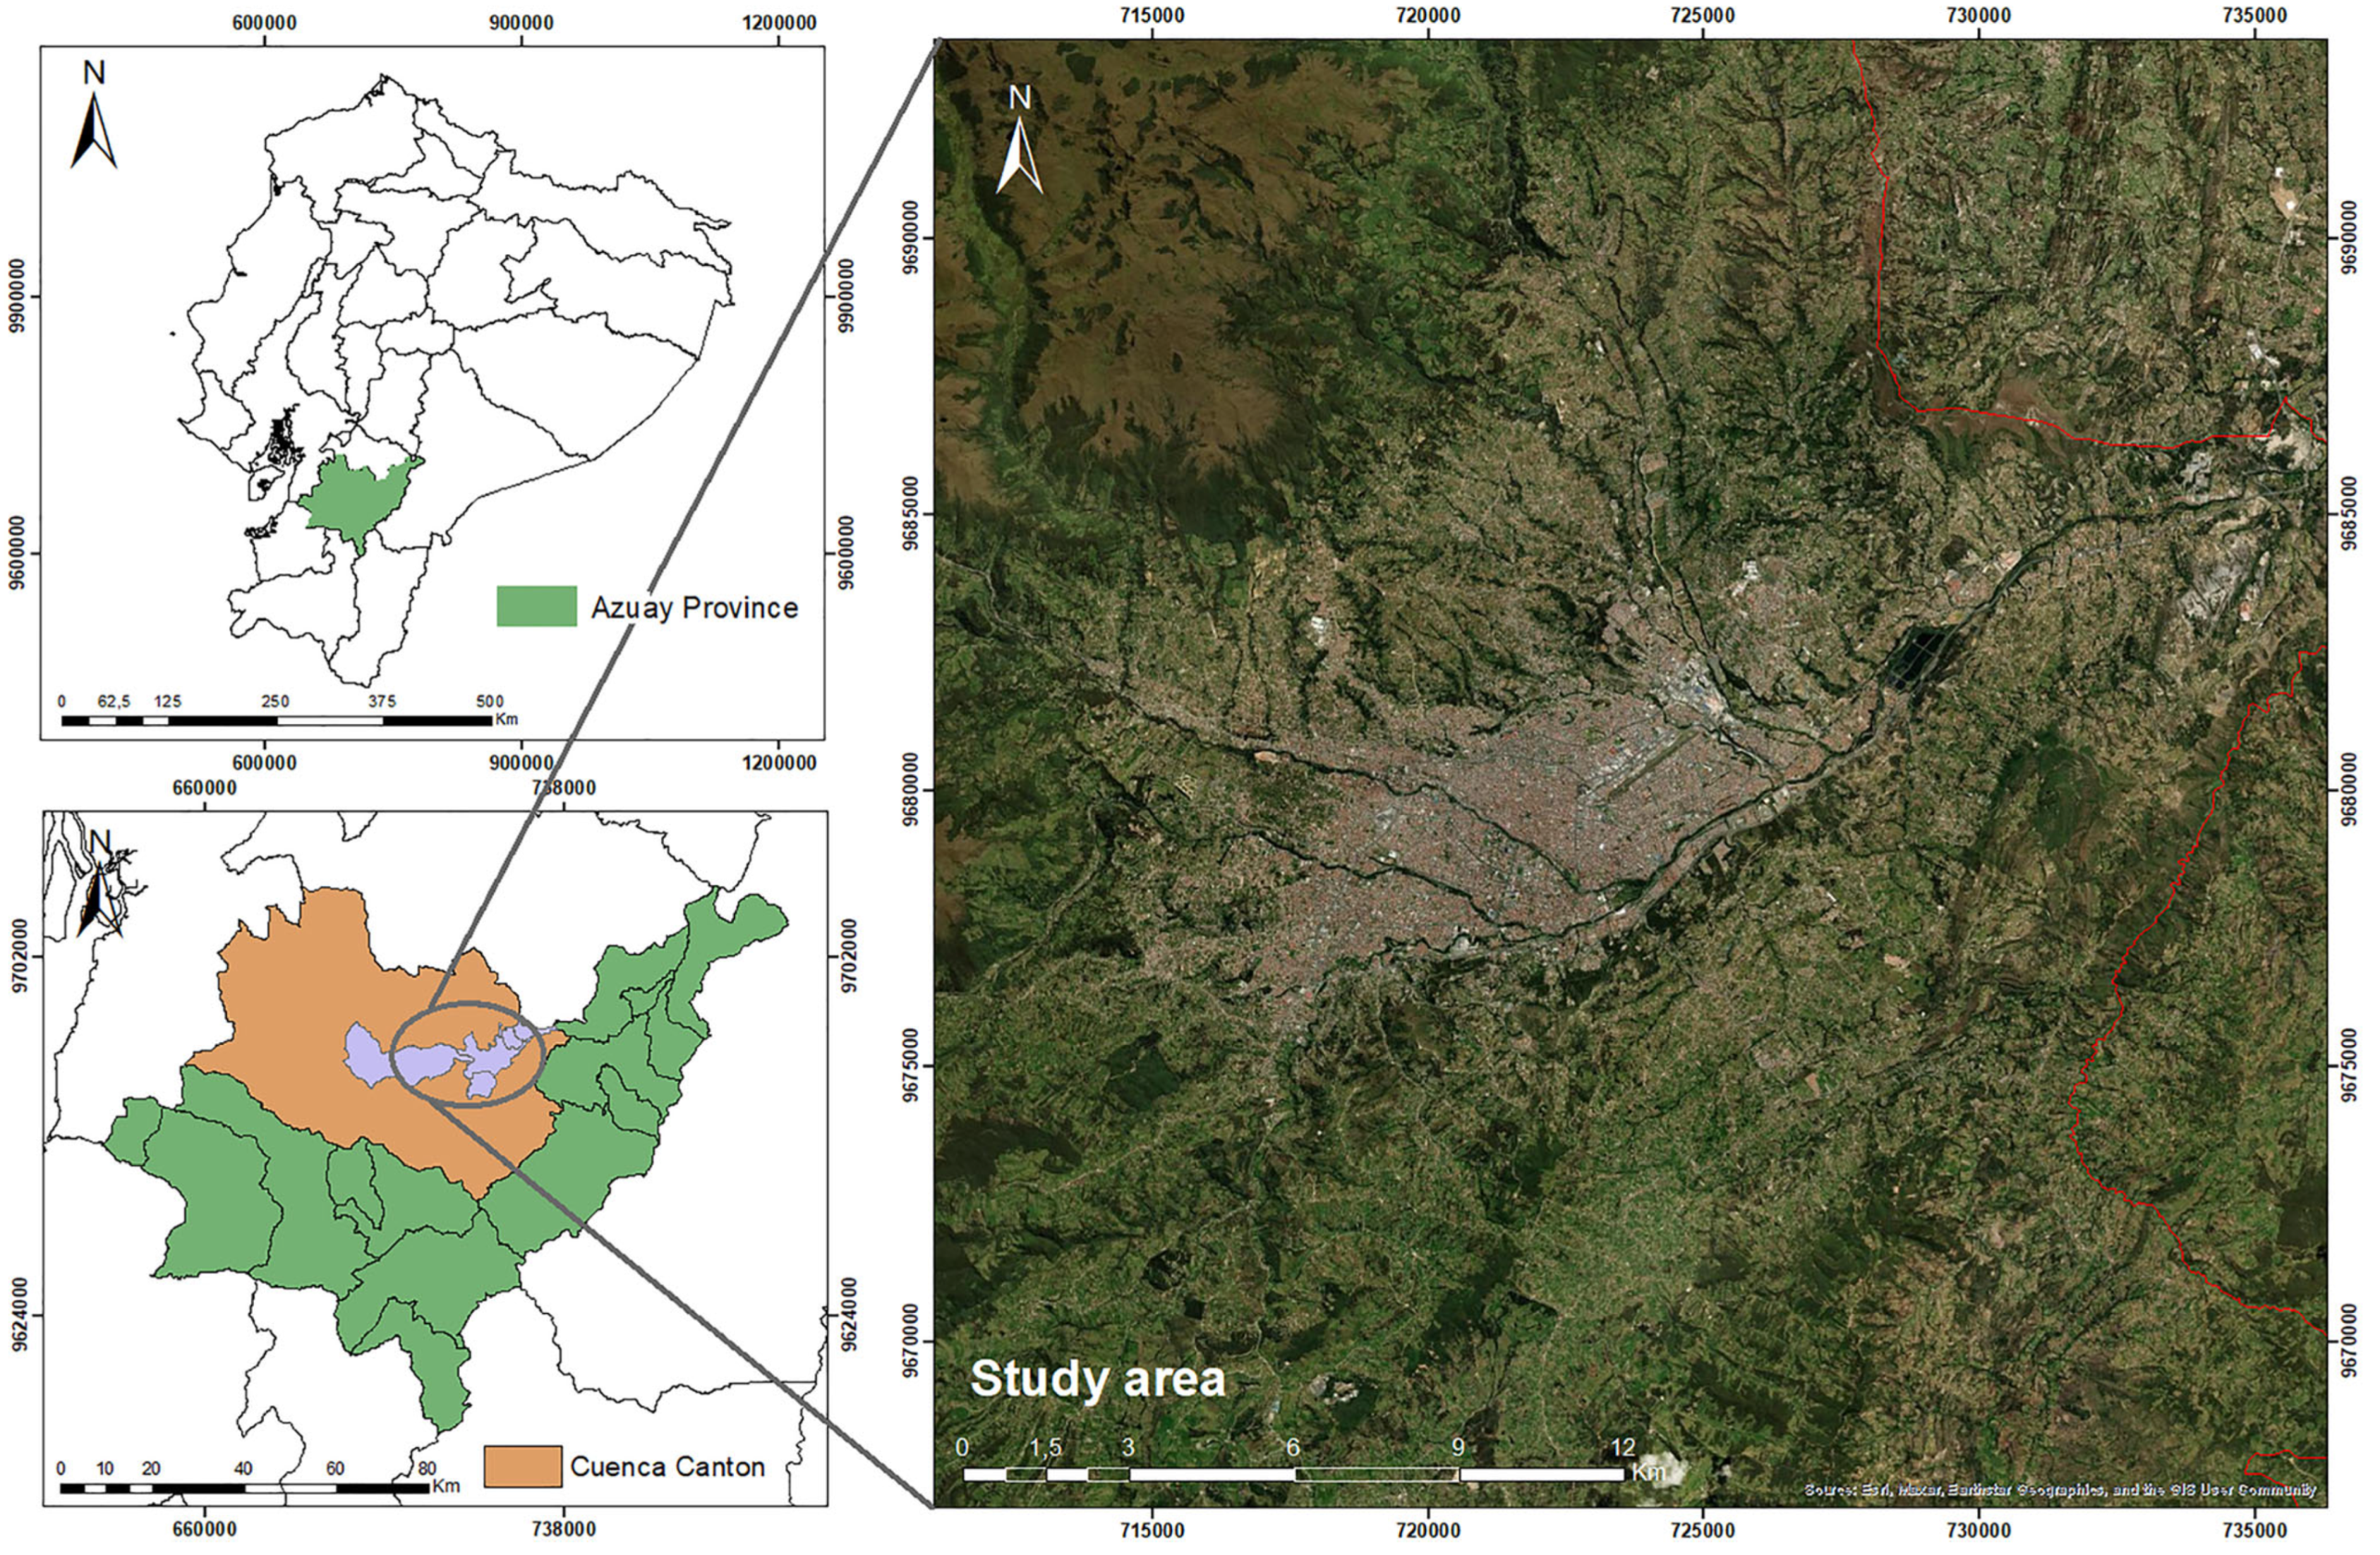
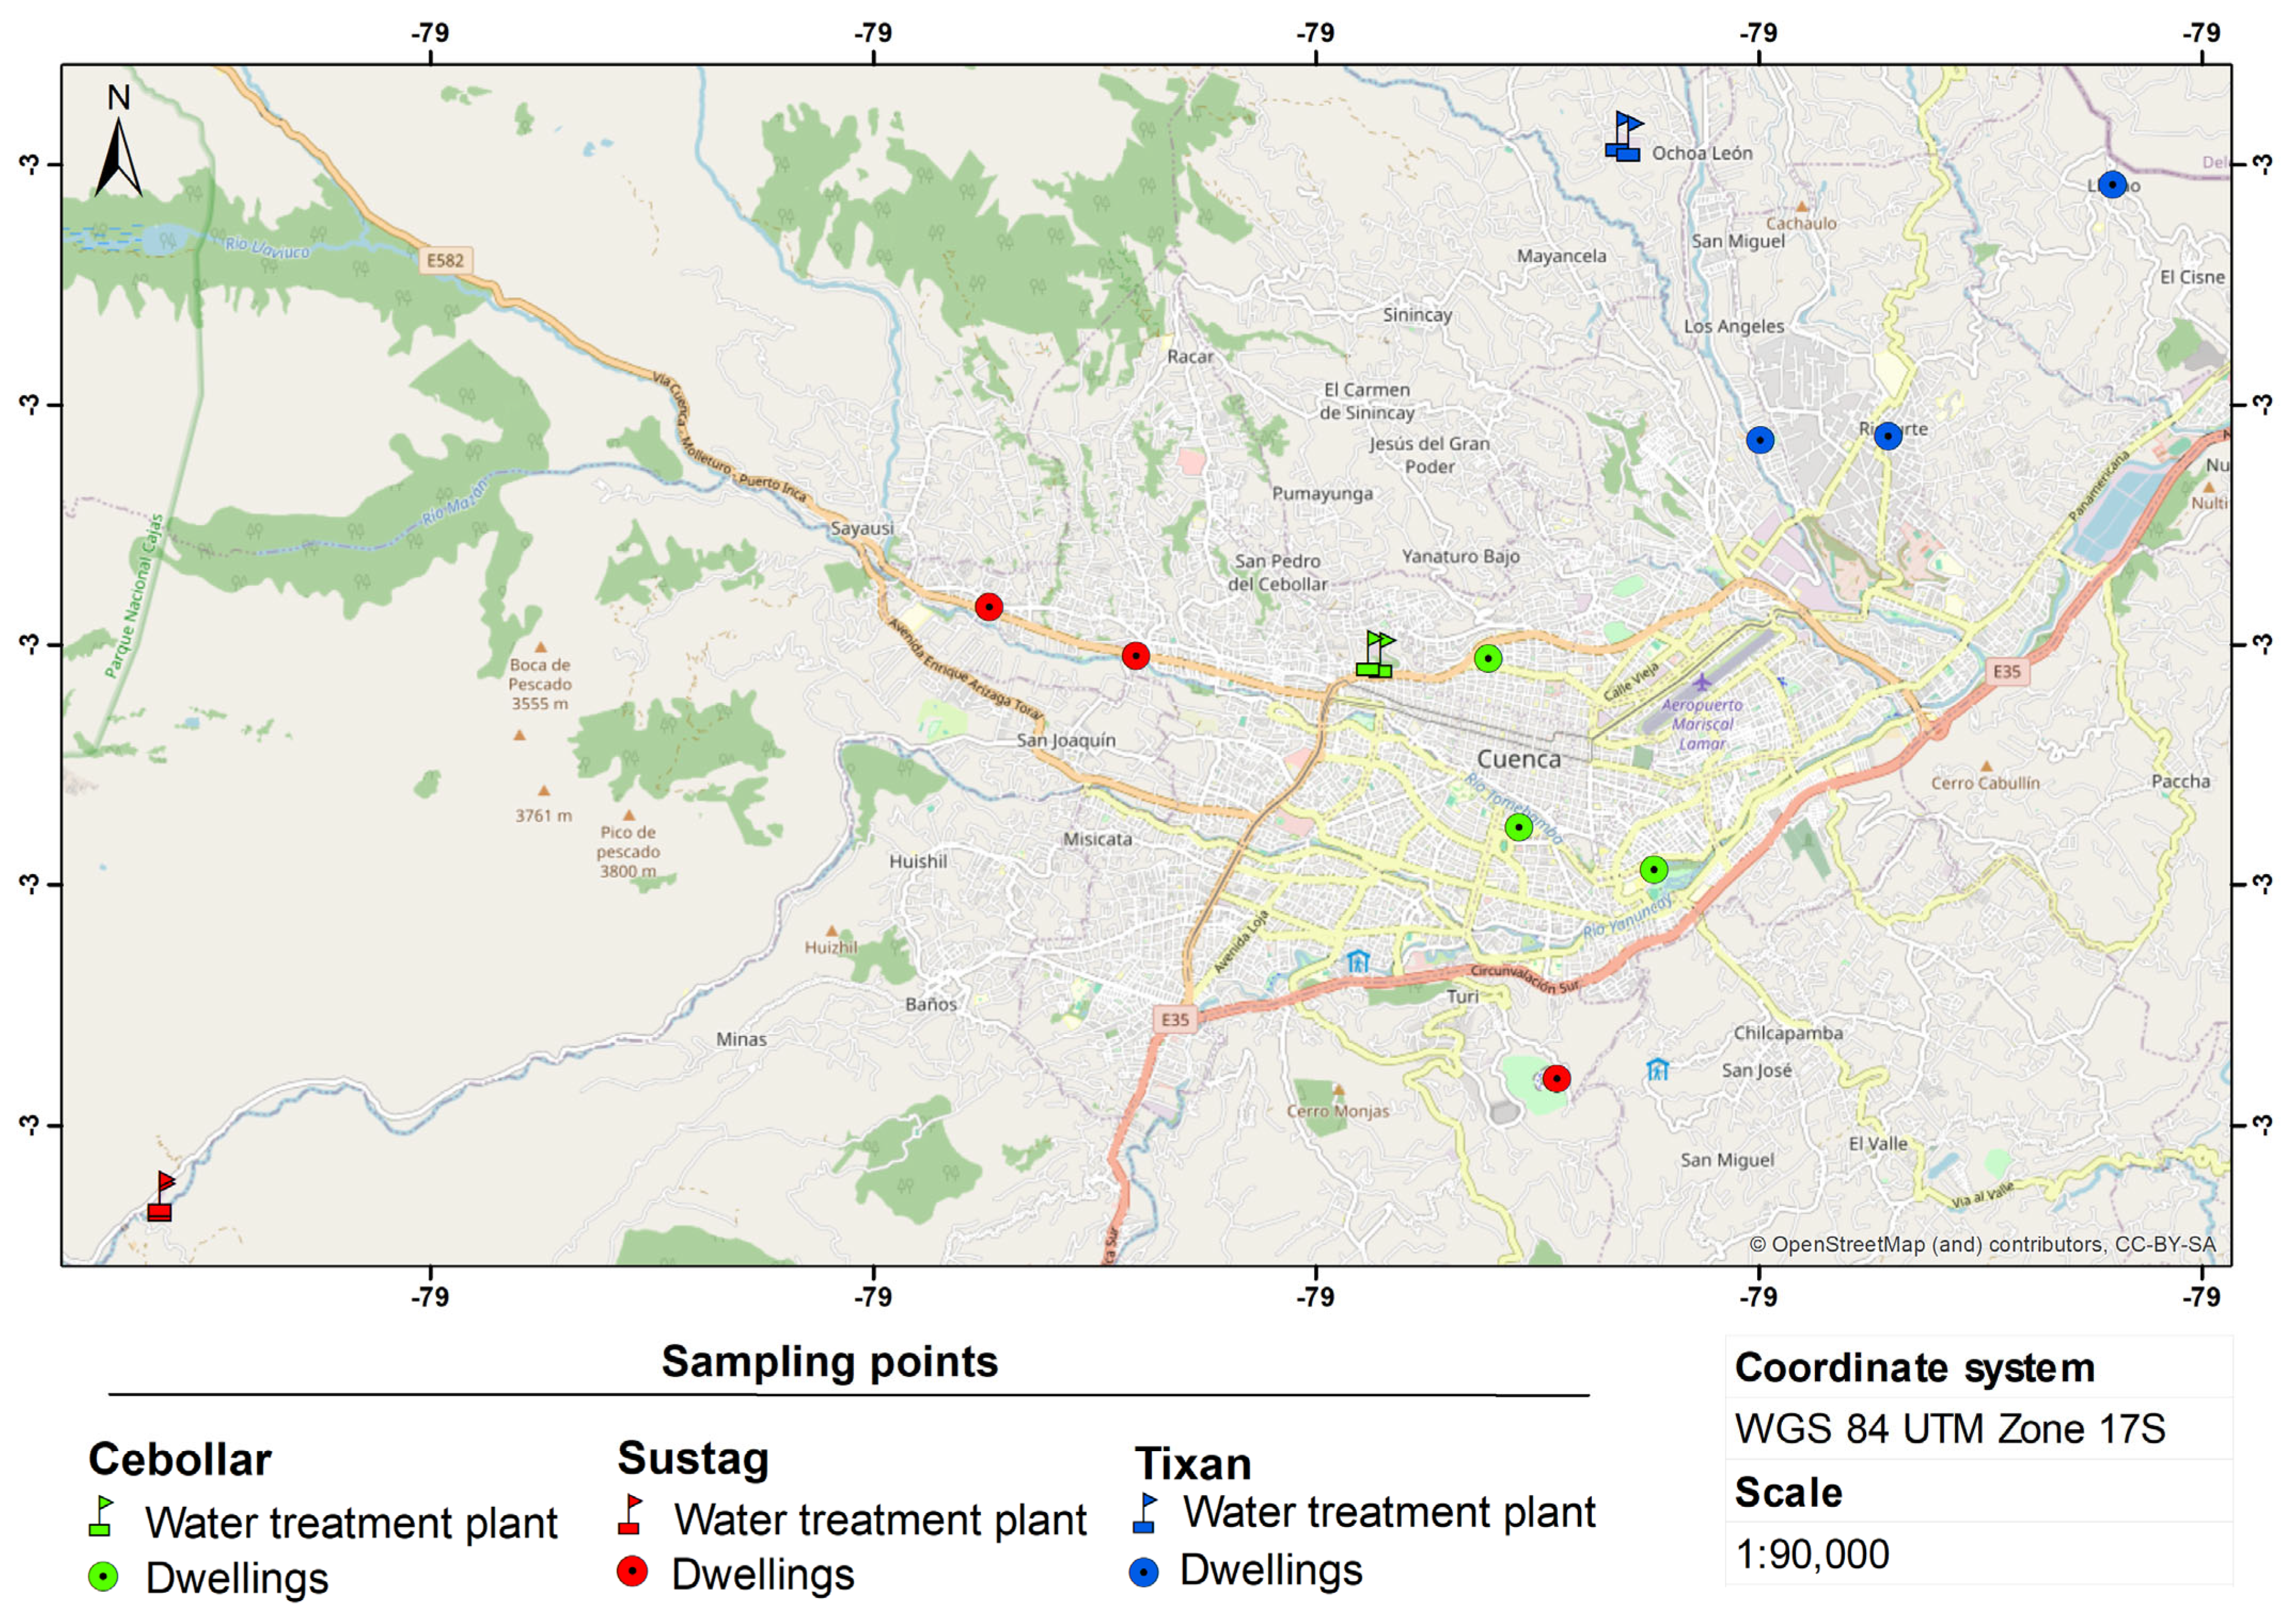
2.1. Description of the Study Area

This study was conducted in the canton of Cuenca, located in the province of Azuay in the south-central region of Ecuador (Figure 1). This territory extends from the western cordillera to the inter-Andean valley of the Andes. Its geography includes high mountain landscapes, such as the paramo, as well as valley floor areas, where the city of Cuenca, the main urban settlement, is located at an altitude of approximately 2500 masl [41]. Cuenca’s drinking water system is organized into four subsystems, named after the rivers where the water comes from: Tomebamba, Machangara, Yanuncay, and Culebrillas. In this study, the subsystems corresponding to the Tomebamba, Machangara, and Yanuncay rivers were considered, each with its own catchment, treatment, and distribution infrastructure, whose waters are processed in the Cebollar, Tixan, and Sustag water treatment plants, respectively [42,43].

2.2. Sampling

Four sampling zones were identified in the three drinking water treatment systems: Cebollar (C), Tixan (T), and Sustag (S). In each system, sampling was conducted in the treated water storage area (CS, TS, SS) and at three additional points along the distribution network (C1–C3, T1–T3, S1–S3). These points were selected in residences near the treatment plant, at an intermediate and end point of the distribution network (Figure 2).
Sampling was carried out during five months in 2023 and 2024, covering the periods from December and March to June, with eight sampling events. Two types of samples were collected at each point: the first, in 40 mL vials, for the determination of chloroform (CHCl3), and the second, in 710 mL sterile bags, intended for laboratory turbidity measurement using HANNA® HI98703 equipment.
Additionally, in situ measurements of physicochemical parameters were performed, including free chlorine (free Cl) with the DR 300 colorimeter from Hach®, pH with the pHtestr30 from Oakton®, temperature and electrical conductivity with the Multi 340i from WTW®. In total, 40 samples were analyzed.
The samples were kept in a container on ice during the sampling process. Thereafter, the samples were transferred to the laboratory and stored at a temperature of 4 °C until analysis.

2.3. Determination of CHCl3

The determination of CHCl3 was determined using the THM Plus method, according to Hach® method 10,132, with a measuring range of 10 to 600 µg/L CHCl3 surveyed. The reagent set includes THM Plus reagent solutions 1, 2, and 3, as well as sachets of THM Plus 4 powder [44]. The process for the determination of CHCl3 was determined by the protocol proposed by Hach® [45], using the DR 1900 kit.
Prior to analysis, it was necessary to add three drops of THM Plus Reagent 1 to the freshly collected samples in the 40 mL vials, following the protocol specifications [45]. As part of the procedure, initially, two baths were prepared: one with hot water (500 mL) and one with cold water (18–25 °C, 500 mL). Water samples were transferred to 10 mL vials labeled for correct identification. Additionally, a blank was prepared using deionized water to ensure analysis accuracy. To each cell, 3 mL of THM Plus Reagent 2 was added, avoiding shaking until the cells were closed entirely. Subsequently, the samples were mixed to ensure homogeneity of the reagent and placed in a hot water bath for 5 min. After this time, the cells were transferred to the cooling bath for another 5 min. They were then removed and inverted three times to homogenize the temperature. A total of 1 mL of THM Plus Reagent 3 was added to each cell, and the cells were returned to the cooling bath for another 5 min. At the end of the cooling time, one sachet of THM Plus Reagent 4 powder was added to each cell, and the cells were shaken until the powder was completely dissolved. After dissolution, 15 min were waited before proceeding with the measurement. For the final analysis, the prepared samples and blank were transferred to DR 1900 square cells and allowed to stand for 30 s to enable the turbidity to settle. Finally, each sample was measured using the prepared blank as a reference.

2.4. Statistical Analysis

A descriptive analysis of the data was performed, involving the calculation of measures of central tendency and dispersion to summarize the main characteristics of the data. To evaluate the assumptions of normality, the Shapiro–Wilk test was applied, and for homoscedasticity, the Levene test was used. Most of the data groups do not follow a normal distribution and do not present homogeneity of variance. Consequently, we chose to use nonparametric tests. For the analysis of variance, the Kruskal–Wallis test was used. Subsequently, a post hoc test was performed using Dunn’s test for the parameters that showed significant differences in the analysis of variance. In addition, a correlation analysis was performed using Spearman’s correlation coefficient for the three water treatment systems.

3. Results

3.1. Physicochemical Characteristics of Water Quality

The results obtained from the physicochemical analysis of the water samples at the different water treatment systems under study, C, S, and T, show notable differences in the values of pH, temperature, electrical conductivity (EC), turbidity, and free chlorine concentration (free Cl) (Table 1). Cebollar has the highest electrical conductivity, turbidity, and free chlorine levels (Figure S1). Sustag has the highest temperature and the lowest levels of turbidity and electrical conductivity (Figure S2). Tixan has similar characteristics to those previously described for Cebollar and Sustag, although it shows higher pH levels in water (Figure S3).

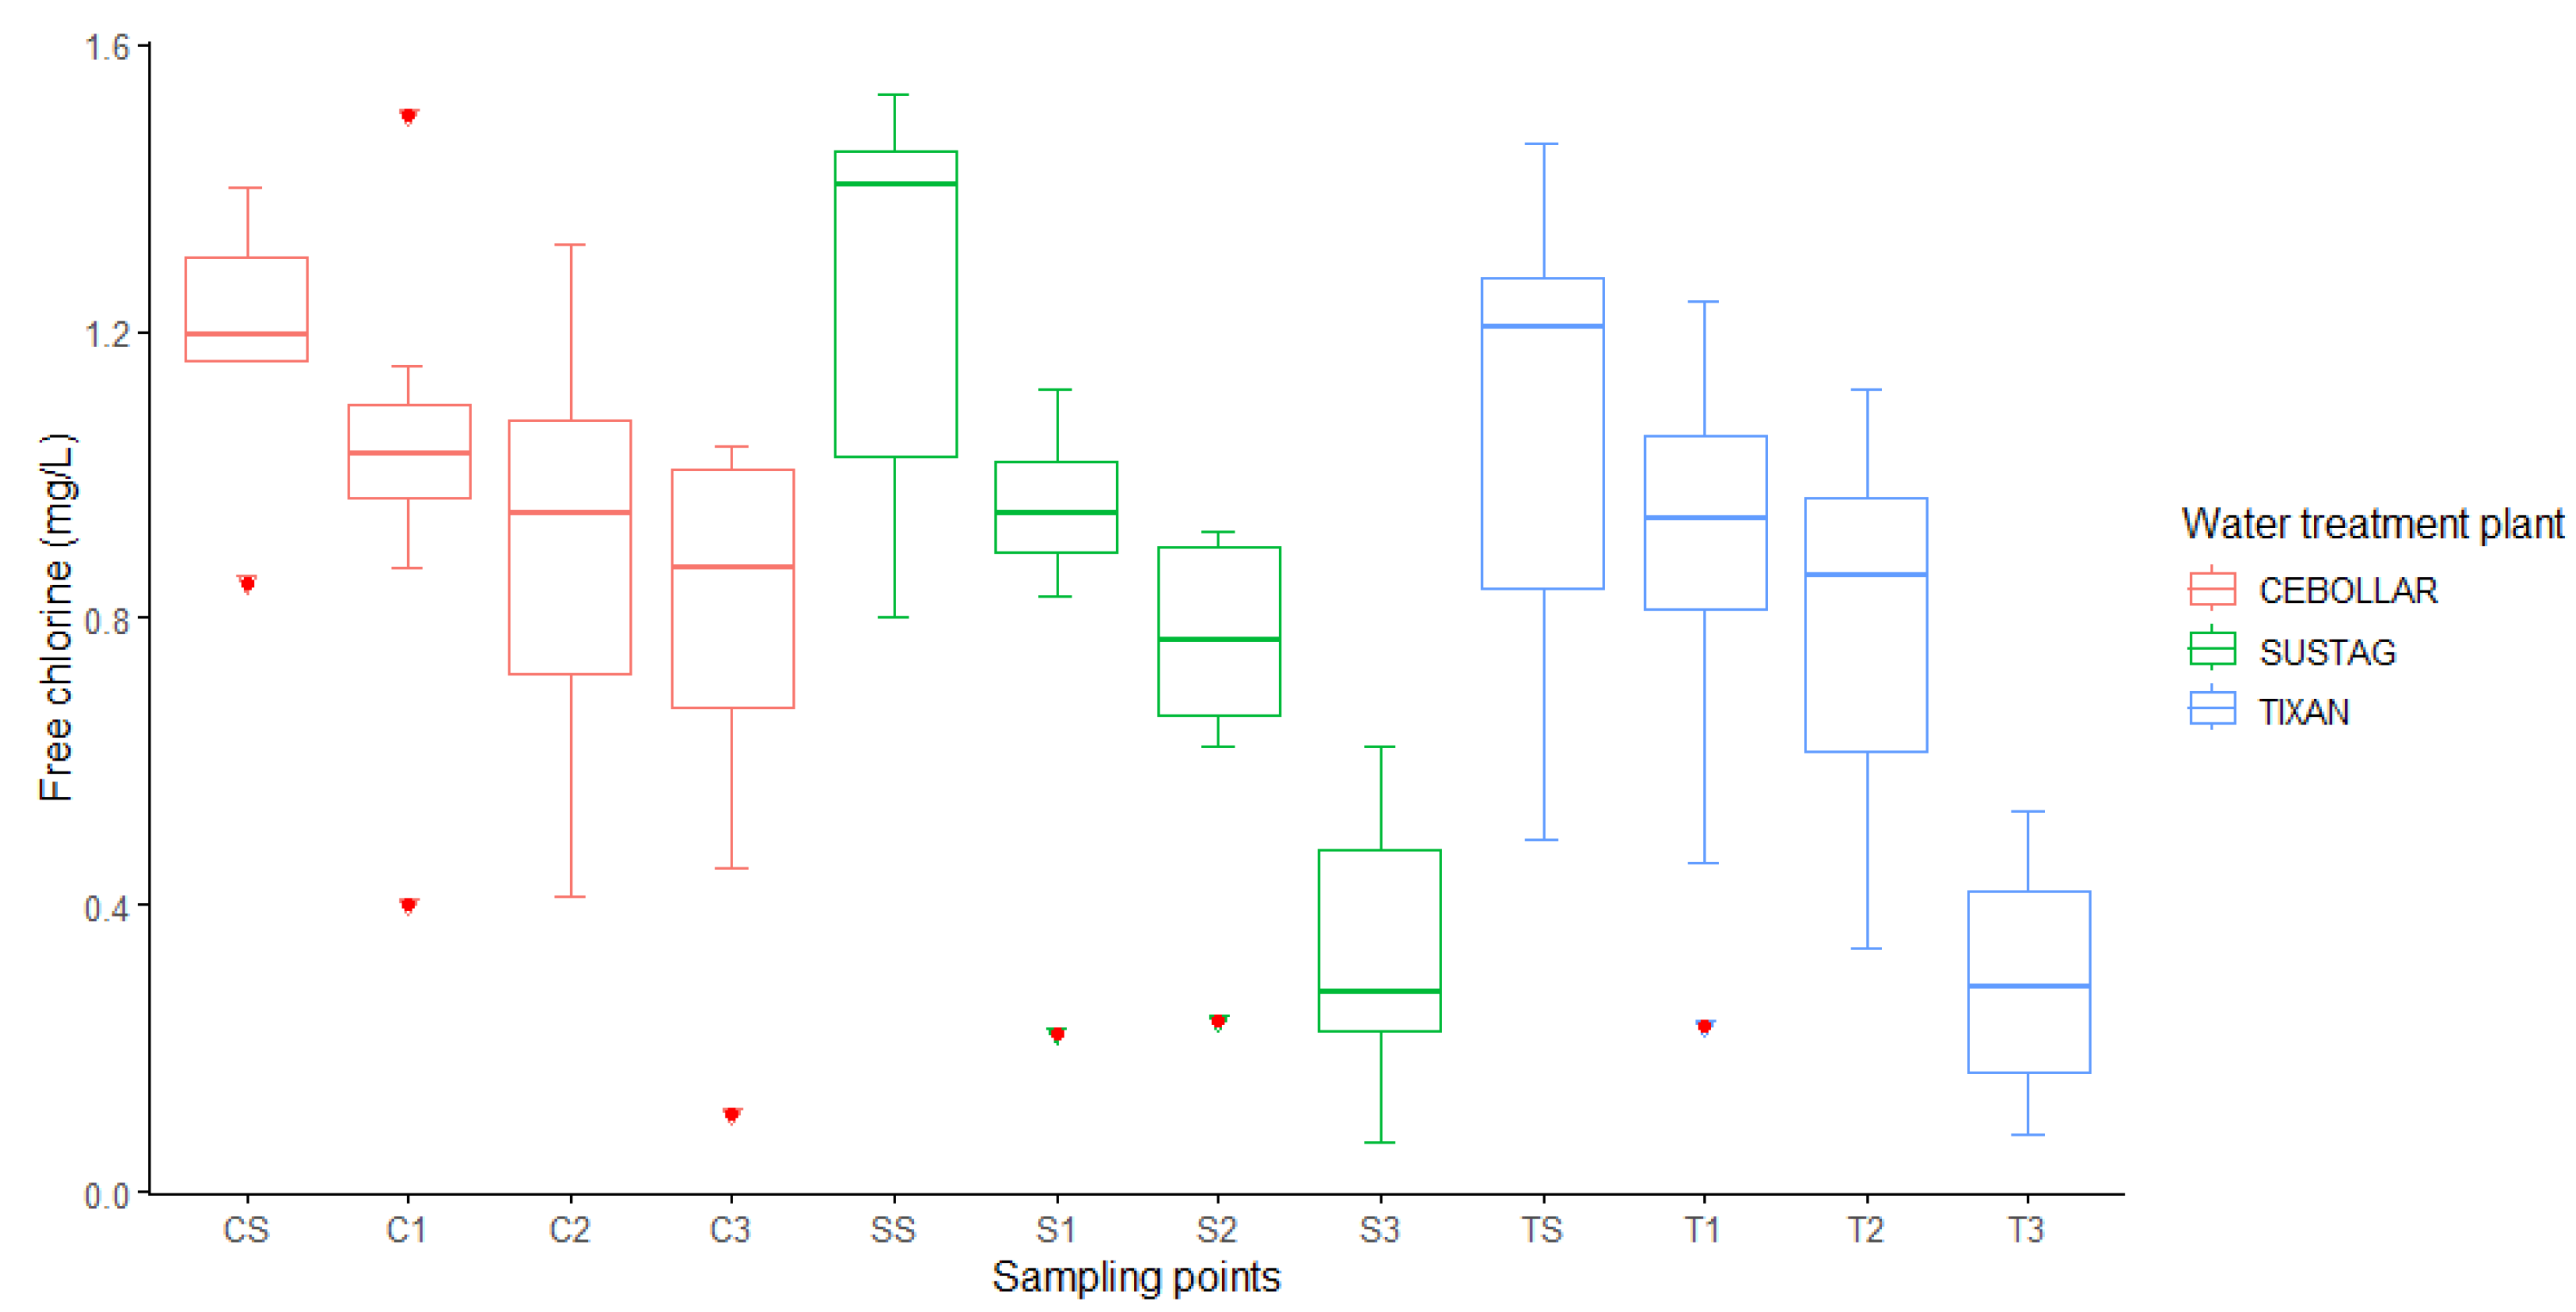
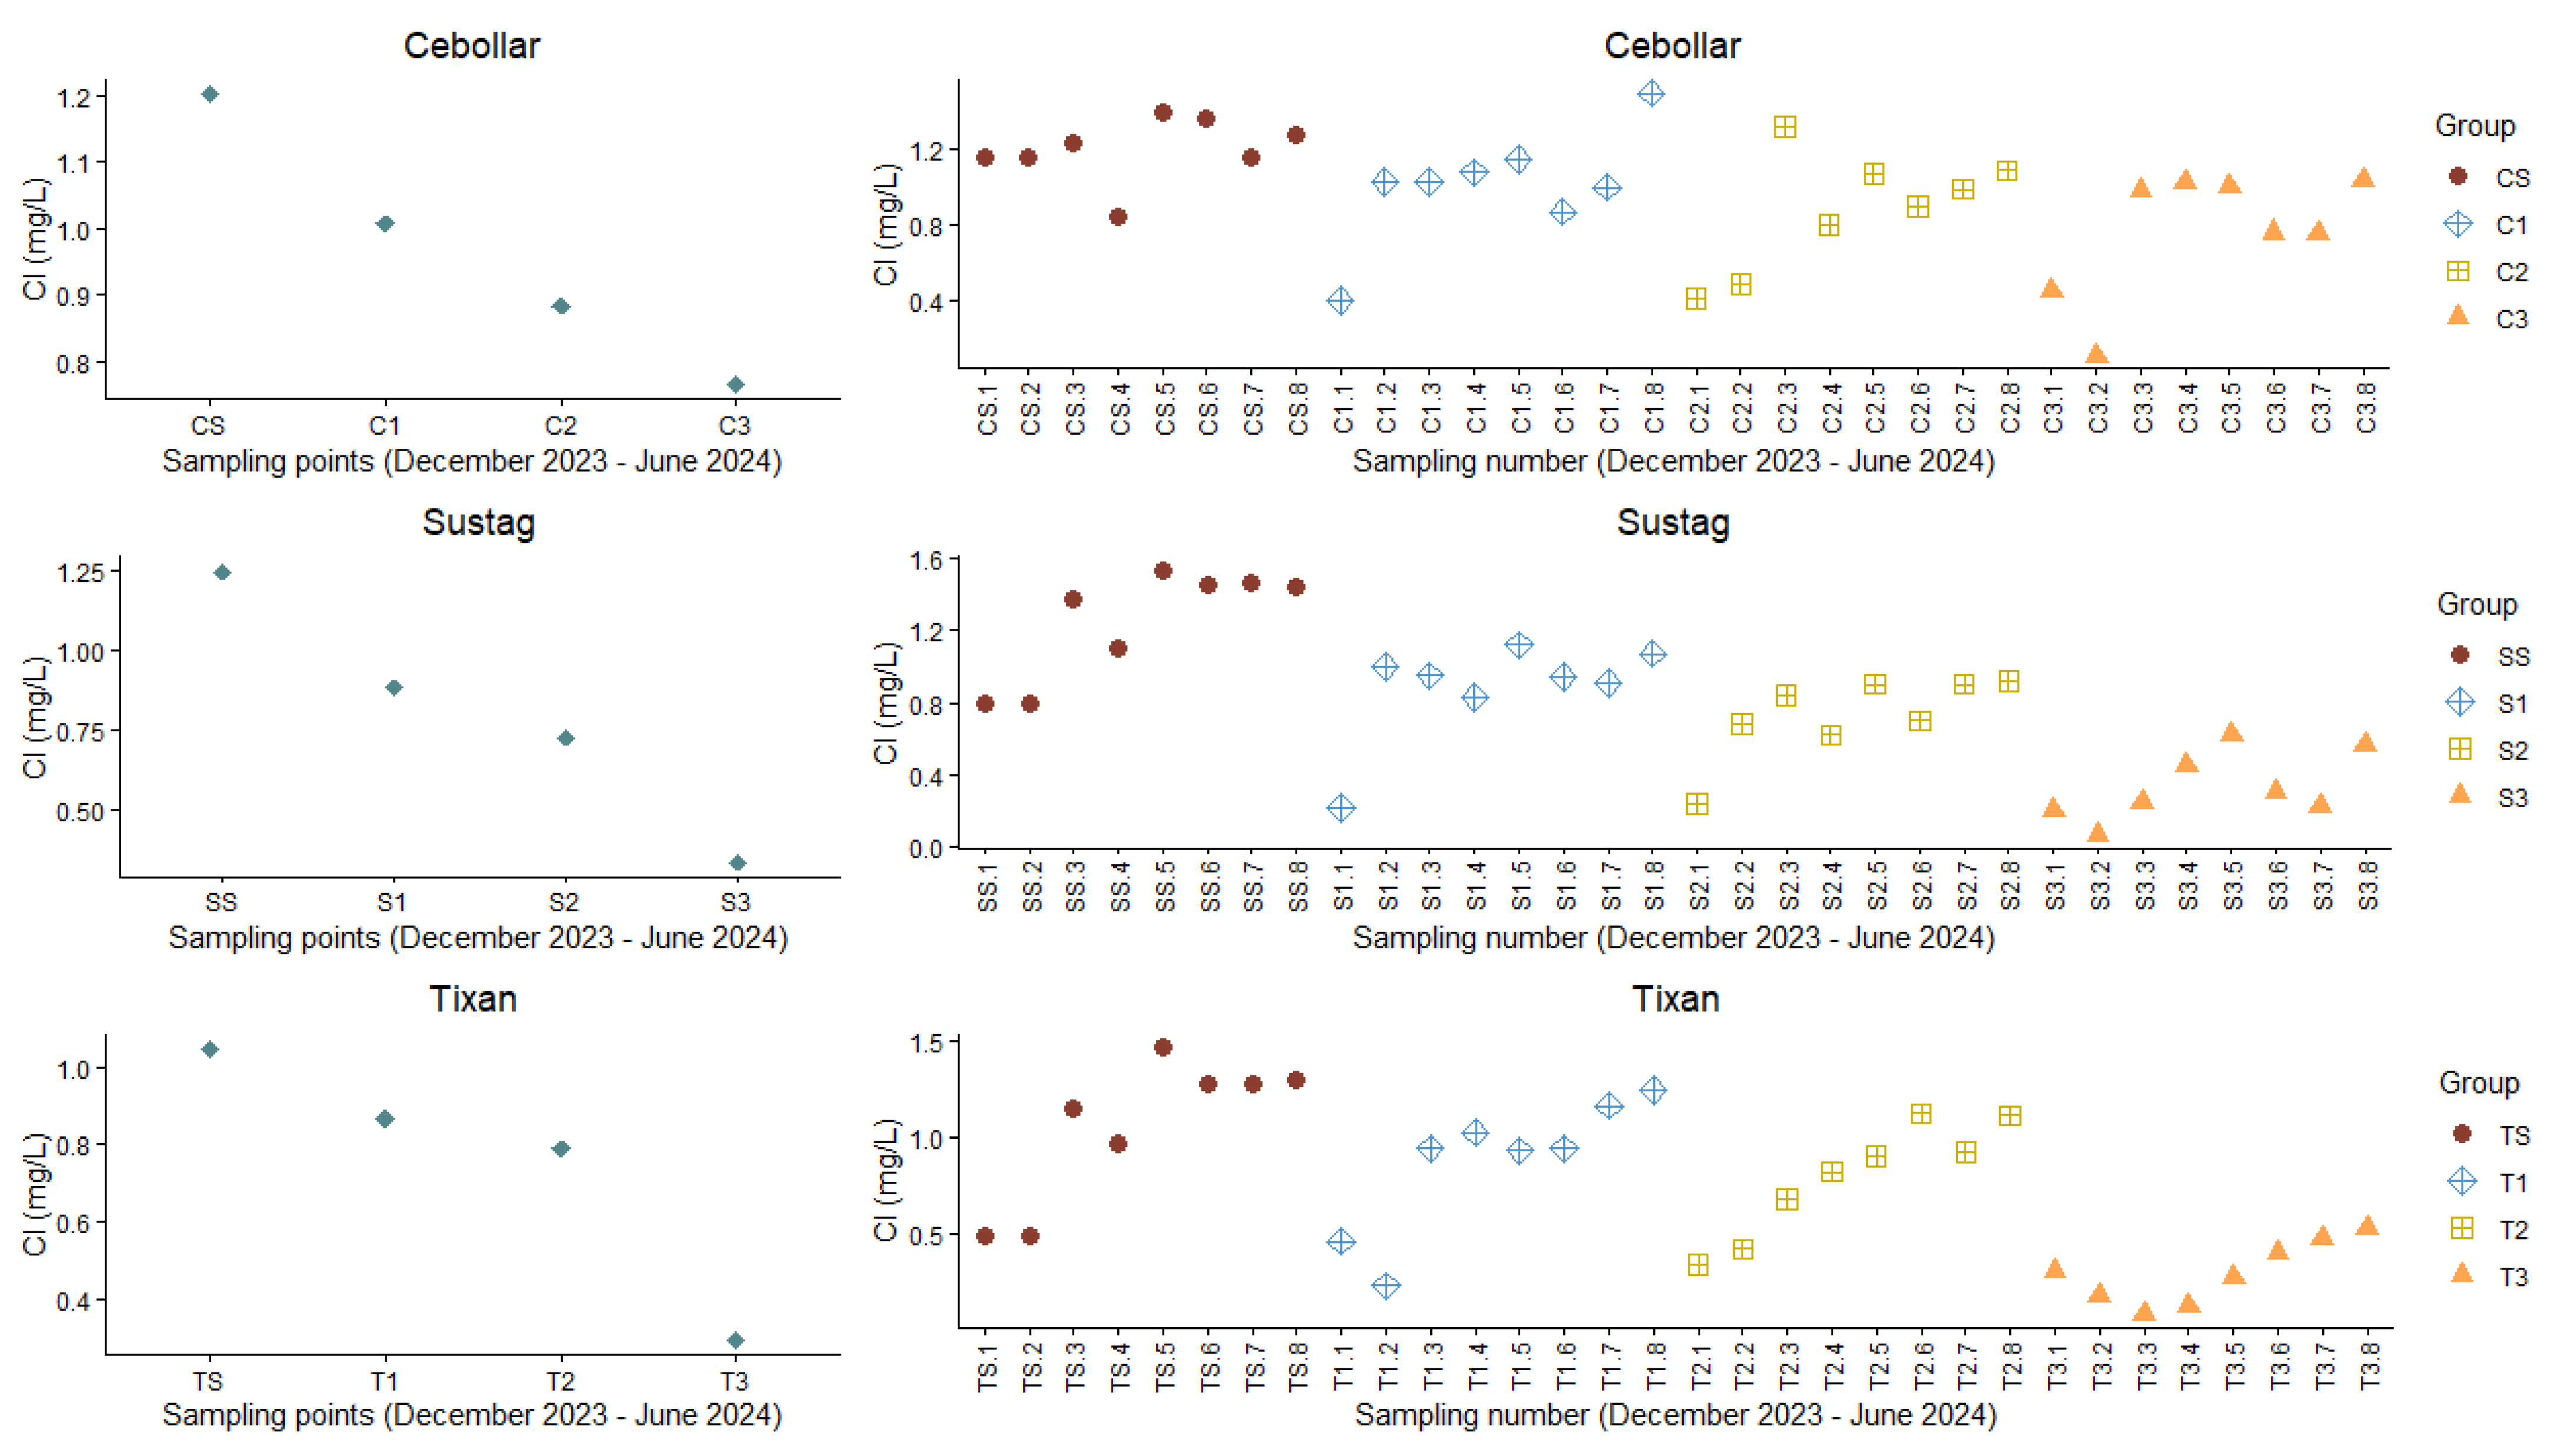
3.2. Free Chlorine Levels

The Kruskal–Wallis test applied to the free Cl concentrations in the three water treatment systems results in a p-value of 1.114 × 10⁻⁶ (Table S1), indicating that there are statistically significant differences between the various sampling points within each water system. Dunn’s test shows that, in the Cebollar plant, there is a significant difference between sampling points CS and C3; in the Sustag plant, between points SS and S2, SS and S3, and S1 and S3; and in the Tixan plant, between points TS and T2, TS and T3, and T1 and T3 (p < 0.05, in all cases).
The box plot (Figure 3) compares the variability of free Cl concentration (mg/L) at different sampling points along the three water systems. Each sampling point on the X-axis represents a specific site within the distribution network, starting from the initial storage of treated water (CS, SS, TS) and progressing along the network to the extremity (C3, S3, T3). Cebollar shows lower variability at the initial sampling points (CS, C1), but increases towards the intermediate and end points (C2, C3). Sustag shows higher initial chlorine concentrations in SS, with a pronounced decrease towards points S2 and S3. Tixan shows a greater dispersion in free Cl values at its first points (TS and T2), and stabilization is observed towards points T1 and T3. The differences in chlorine variability among the three plants could be associated with the specific conditions of each system, such as the type of source water, the treatment applied, the design of the distribution network, and the water residence time.
Figure 4 shows a decreasing trend in the average free Cl concentration as a function of the sampling points. This progressive decrease in the three plants suggests a reduced free Cl throughout the treatment process, probably due to the chlorine demand by organic matter and other compounds in the water. In addition, the graphs on the right (Figure 4) show the concentration of free Cl at each sampling point over time, differentiated by groups. Free chlorine concentrations show temporal variations at each point, with noticeable fluctuations at the initial points and relative stability at the endpoints, although with occasional peaks. These variations could be associated with changes in the quality of the raw water, adjustments in the doses of chlorine applied or variations in the operating conditions of each plant.

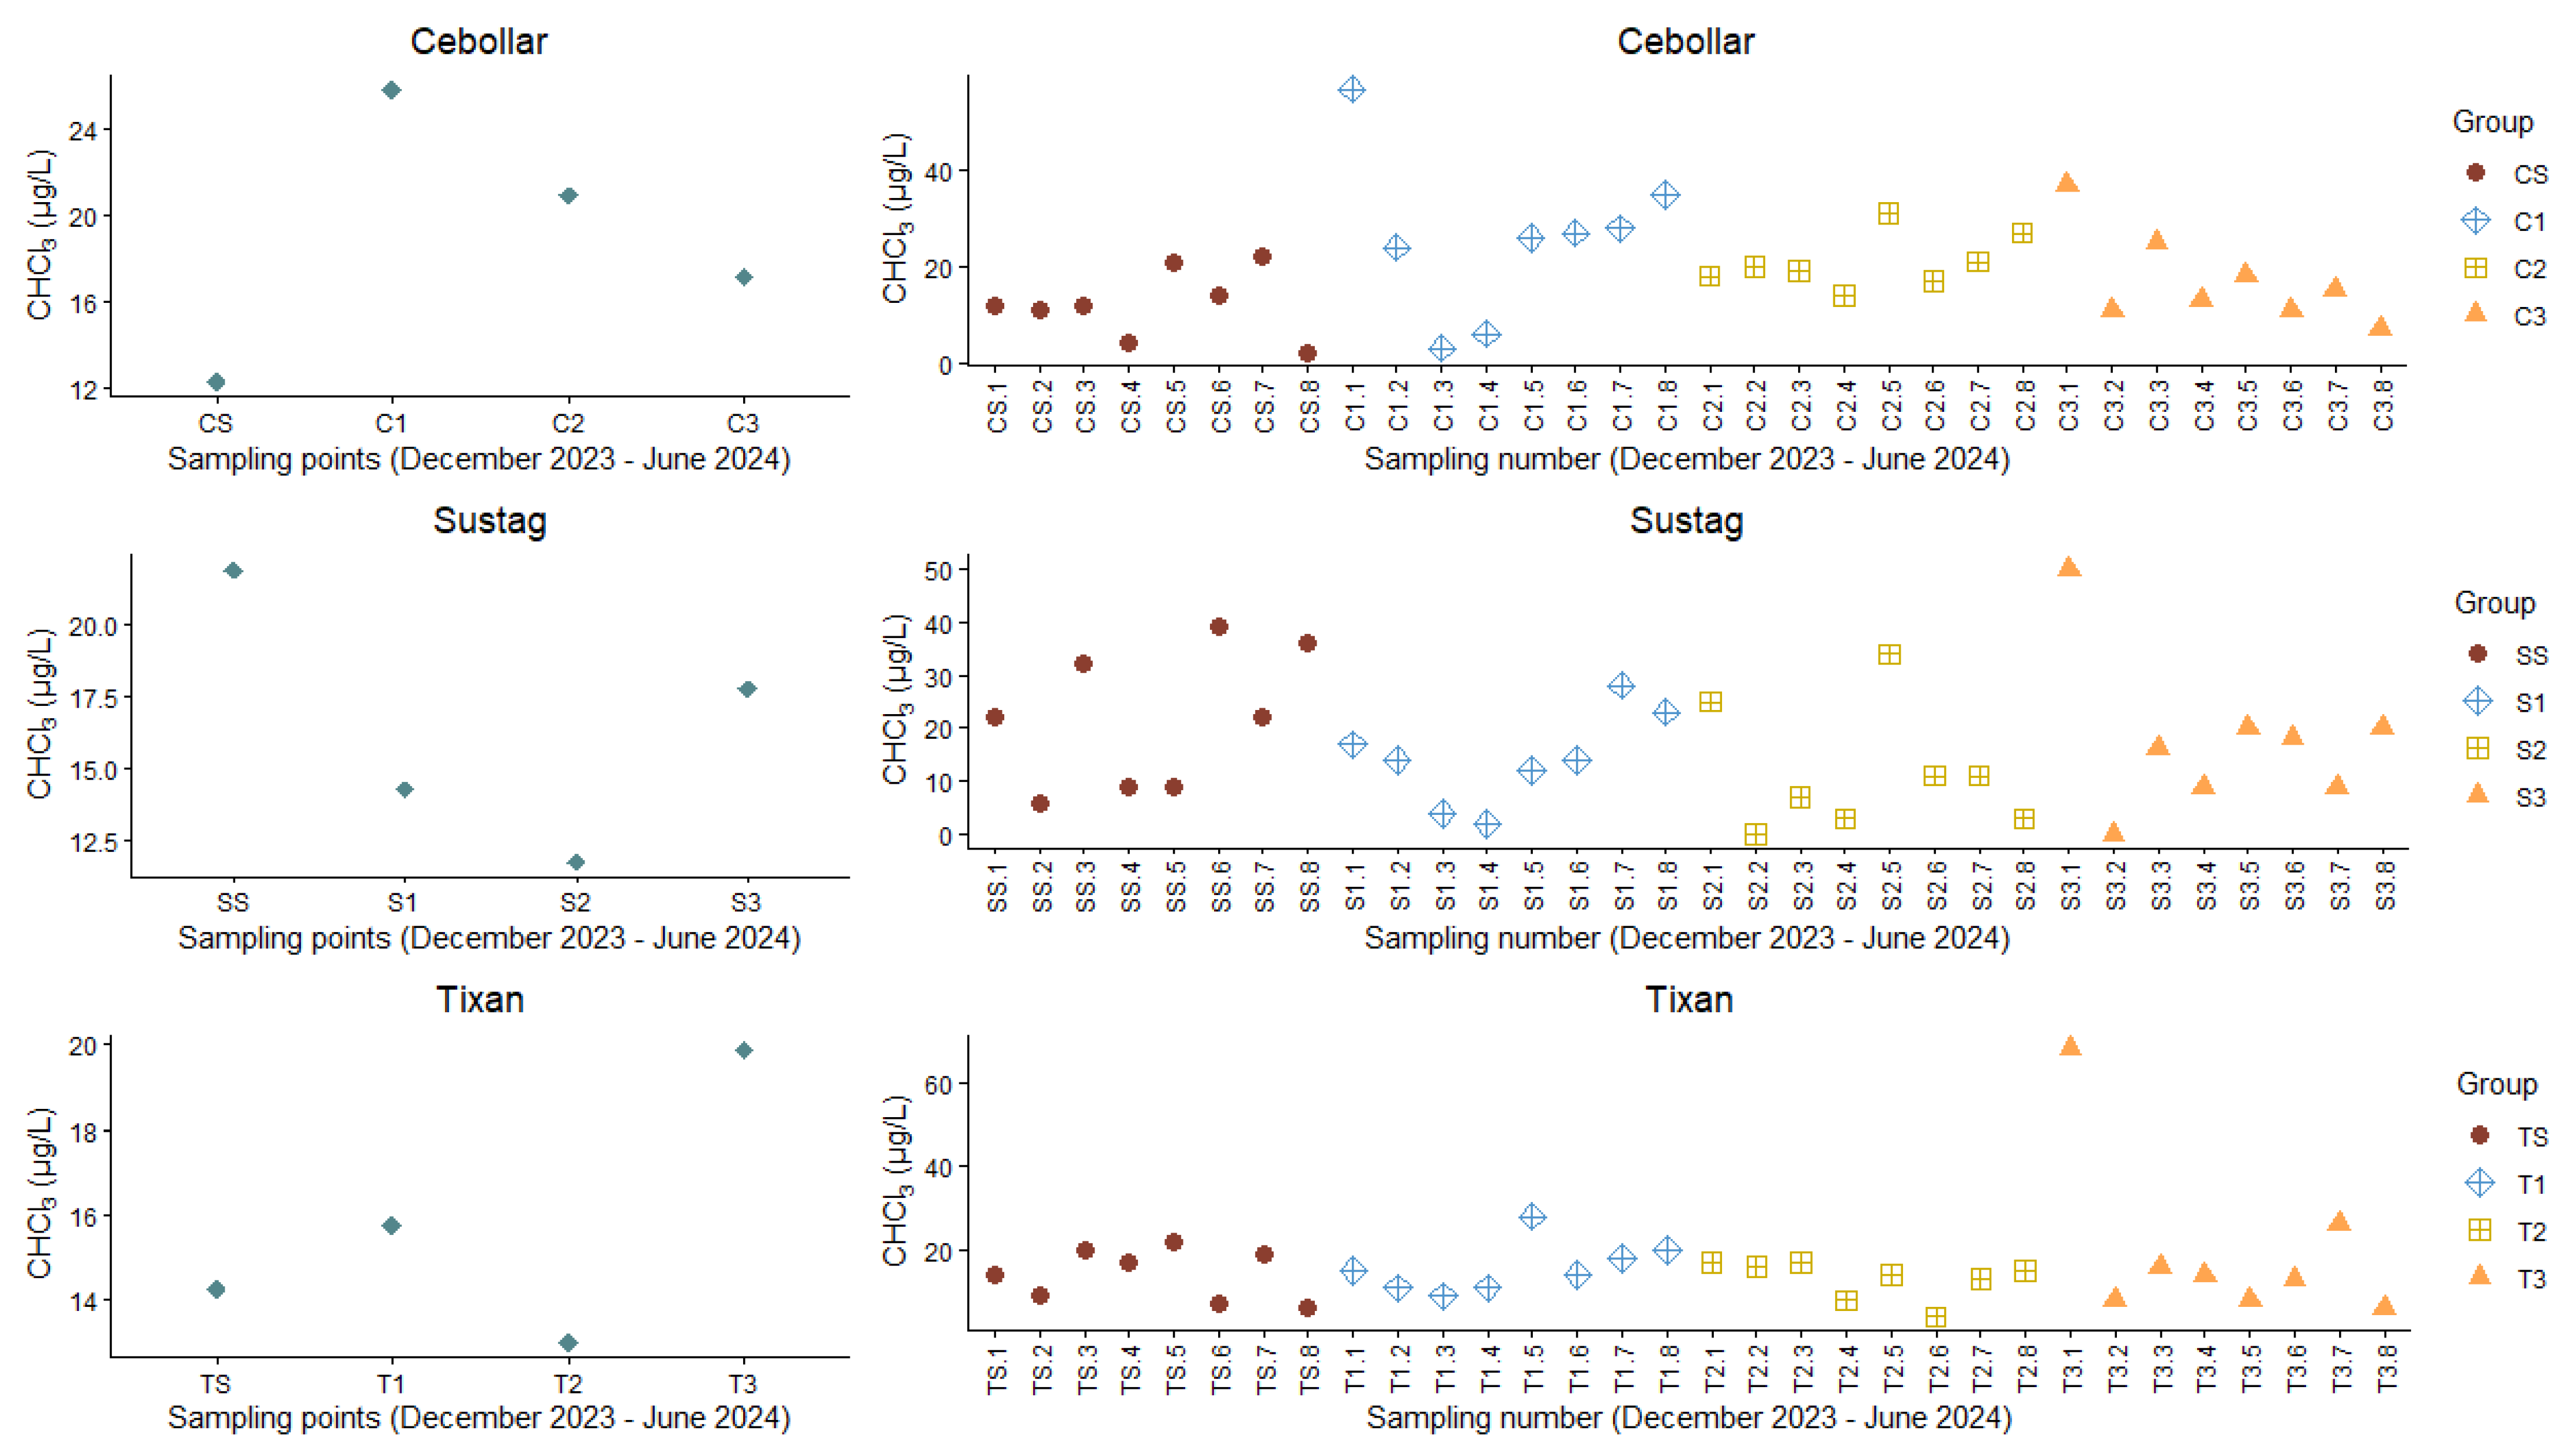
3.3. CHCl3 Concentrations

The concentrations of CHCl3 in the drinking water treatment systems analyzed show a relatively high variability, as detailed in Table 2. At Cebollar, concentrations fluctuate between 12.25 µg/L and 20.88 µg/L, with a slight decrease at sampling point C3, where 17.13 µg/L was recorded. At Sustag, concentrations range between 11.75 µg/L and 21.88 µg/L. Finally, at Tixan, CHCl3 concentrations range between 13.00 µg/L and 19.88 µg/L.
Figure 5 shows the spatial variations of CHCl3. In Cebollar, it is evident that the values start low and reach a peak around sampling point C1, before dropping at point C3. At Sustag, they show a downward trend from the initial sampling point SS, get a minimum at S2, and then increase again at point S3. At Tixan, the levels also have an undulating behavior, reaching a maximum at point T1, decreasing at T2, and rising again at T3. The graphs on the right (Figure 5) show the variability of CHCl3 in each sampling location group. Here, significant variability is observed in each group, indicating fluctuations across samples. At each location, the initial group has a higher concentration in some samples, while at other points, the concentrations appear to stabilize or fluctuate.
In general, Cebollar seems to have higher CHCl3 values compared to Sustag and Tixan. In Sustag, fluctuations are more considerable compared to Tixan, where variations are smoother, which could indicate differences in treatment conditions or water quality in each area.

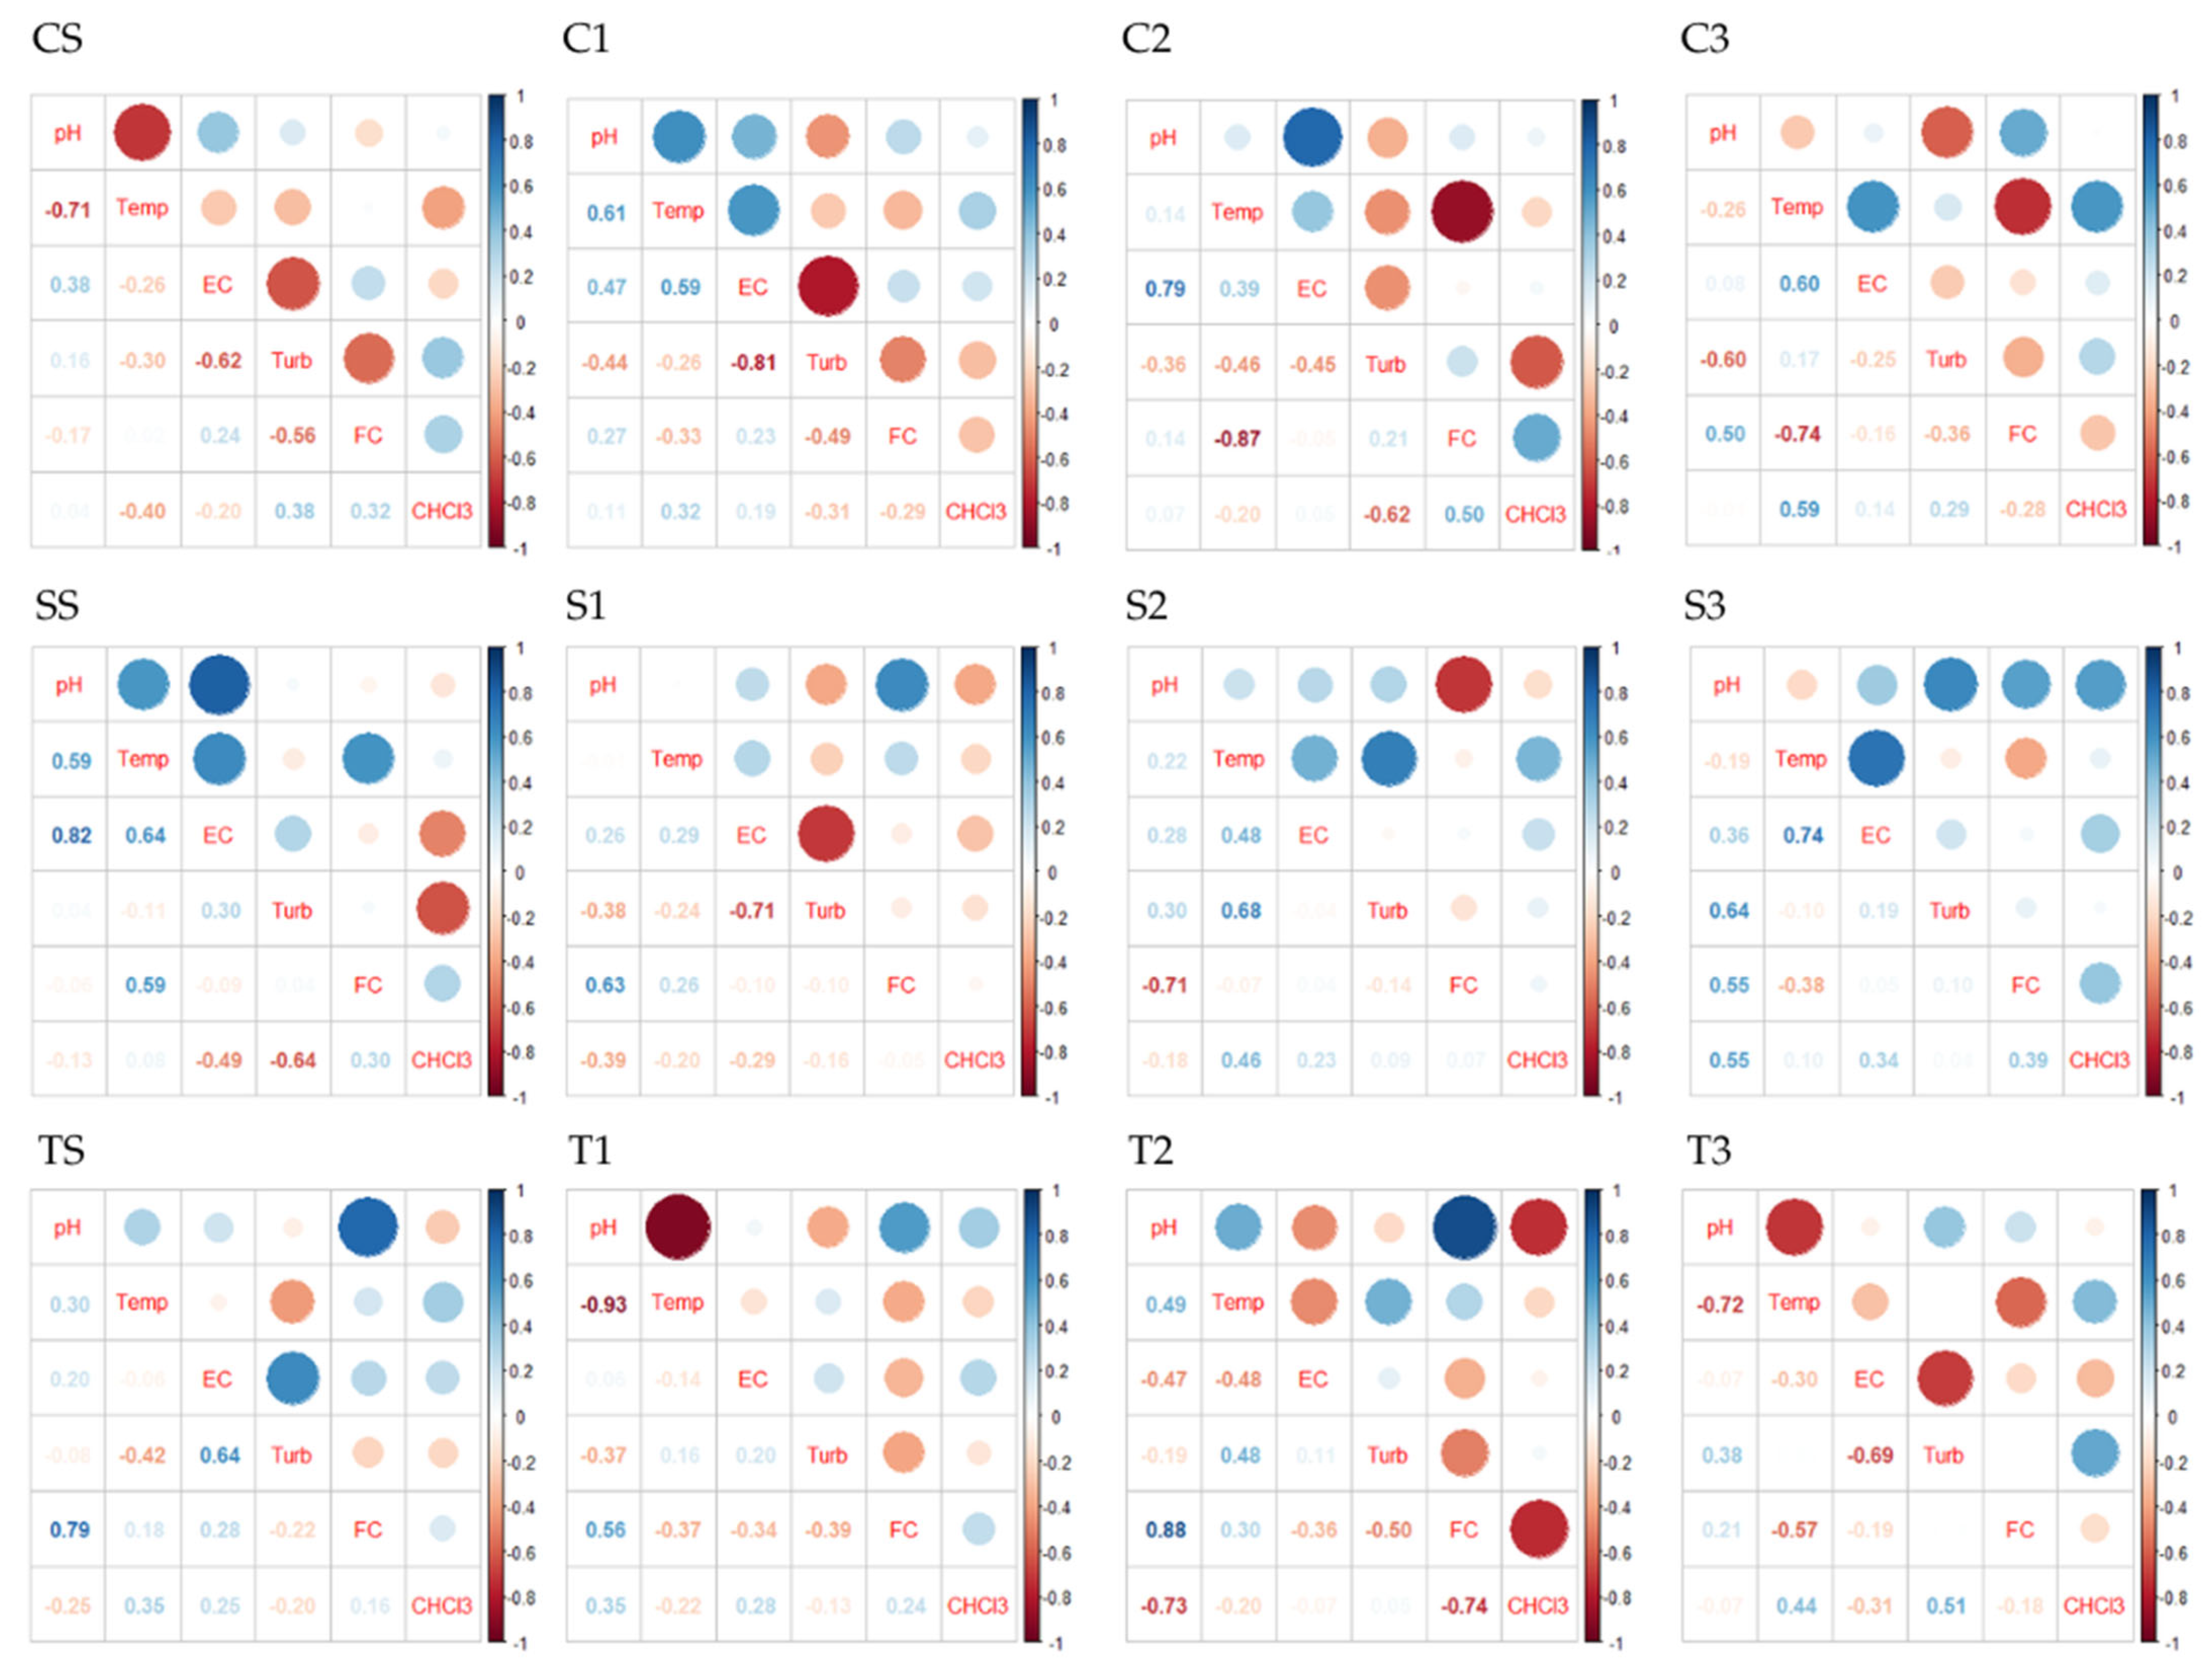
3.4. Spearman’s Correlation Analysis

The variables analyzed in this section include pH, Temp (temperature), EC (electrical conductivity), Turb (turbidity), FC (free chlorine), and CHCl3.
Free chlorine presents both positive and negative correlations with CHCl3 at the different sampling points. For example, at the Cebollar plant points, the correlation coefficients are 0.32 at CS, −0.29 at C1, 0.50 at C2, and −0.28 at C3 (Table S2). In the Sustag plant, the values are 0.30 in SS, −0.05 in S1, 0.07 in S2, and 0.39 in S3 (Table S3). Finally, in the Tixan plant, correlations of 0.16 in TS, 0.24 in T1, −0.74 in T2, and −0.18 in T3 are observed (Table S4). These results indicate that the relationship between free chlorine and chloroform does not follow a consistent pattern among plants or sampling points. In addition, other variables such as pH, temperature, electrical conductivity, and turbidity also do not show a uniform trend of correlation with CHCl3, which could reflect local differences in treatment conditions and water characteristics (Figure 6).

4. Discussion

The present study evaluated the presence of CHCl3 as an indicator of THMs in the drinking water supply of Cuenca, Ecuador, considering three different drinking water treatment systems (Cebollar, Sustag, and Tixan). A fundamental aspect of this analysis was the monitoring of free chlorine, given its critical role in contributing to DBP formation. In addition, key parameters such as temperature, pH, and electrical conductivity were studied because, according to Padhi et al. [16], these parameters directly influence the chemical reactions that lead to the generation of THMs.
Water pH ranged from 6.76 to 7.70, which is within the optimal range for THM formation. According to previous studies, THMs concentration decreases, and HAAs increase as pH decreases. Furthermore, pH also plays a vital role in determining the type and amount of DBPs formed, as lower and acidic pHs (pH ≤ 7) result in the formation of less CHCl3 [46,47]. As for temperature, the observed variations (15.01 °C to 22.61 °C) could significantly influence the reaction kinetics of free chlorine with natural organic matter since higher temperatures usually increase the rate of DBP formation [48,49]. Electrical conductivity (77.77 and 123.25 μS/cm), although the relationship is not fully established, plays an indirect role in THMs formation and would be associated with the availability of inorganic compounds that modulate chlorine demand in the system, as suggested by Amarasooriya et al. [50]. Also, turbidity, which ranged from 0.46 to 1.57 NTU, reflected the number of suspended particles, which may interfere with the efficiency of the disinfection process by demanding available chlorine [51]. In this context, despite the theoretical influence of these parameters on chlorine demand and THMs formation, especially CHCl3, the statistical analysis of this study failed to establish a clear correlation between them. This can be explained by the complexity of chemical interactions in the treatment system, where multiple reactions occur simultaneously, making it difficult to identify individual factors with a direct bearing on THMs formation, as reported by Padhi et al. [16].
Free chlorine concentrations ranged from 0.29 to 1.24 mg/L, showing a progressively decreasing pattern during the water travel within the distribution network. This can be explained by the chlorine demand induced by the organic matter present in the water, as well as by other compounds that interact with chlorine in the disinfection stages. Previous studies [10,14,15,16] have pointed out that natural organic matter (NOM) is a key factor in reducing the concentration of free residual chlorine. In addition, aspects such as hydraulic residence time, pipe length, diameter, roughness, material type, and age, as well as water quality conditions, including pH, electrical conductivity, temperature, and turbidity, have a considerable impact on residual chlorine decay [52]. These factors also contribute to the observed fluctuations in free chlorine concentrations, underscoring the need for continuous monitoring of this parameter and for operational adjustments of treatment processes (e.g., organic matter removal and chlorine doses) to minimize DBP formation and ensure the quality of the drinking water supply.
Chloroform occurrence in all the analyzed points shows fluctuations from 11.75 µg/L to 21.88 µg/L. These values are below the maximum permissible limit of 300 µg/L for chloroform according to Ecuadorian regulations [39]. These results are consistent with previous studies in Ecuador, such as that of Salazar-Flores et al. [40], who reported that CHCl3 concentrations in drinking water in the cities of Pedro Vicente Maldonado and Latacunga during 2018 and 2019 ranged between 18 µg/L and 20 µg/L, and between 12 µg/L and 16 µg/L, respectively.
Studies conducted in the region and other countries have shown significant variability in THMs concentrations in drinking water. In Panama, for example, total THMs concentrations ranged from 0.01 to 4.15 µg/L, with CHCl3 being the predominant compound (52.1%) [53]. In Venezuela, according to the study by Sarmiento et al. [54], total THMs concentrations fluctuated between 47.84 and 93.23 µg/L, where CHCl3 was the main compound, representing 83% of total THMs. In other Latin American countries, variable levels of THMs have also been recorded. To mention a few, in Brazil, the average concentrations were 58.5 µg/L, in Mexico 47.4 µg/L, in Colombia 31.3 µg/L, in Peru 31.7 µg/L, in Argentina 31.7 µg/L, and in Chile 16.5 µg/L, while in countries outside the region such as the United States (33.6 µg/L) and Spain (85 µg/L) a high variability was also evident [10].

5. Conclusions

Monitoring and evaluating the formation of THMs, specifically chloroform, in drinking water supplies is crucial to ensure public health and compliance with water quality standards. The results obtained in this study underscore the importance of understanding the factors that influence the formation of these compounds, such as the presence of natural organic matter, the physicochemical conditions of the water, the disinfection process, and the behavior of free residual chlorine during the distribution network. Although the chloroform levels found in Cuenca’s drinking water treatment systems were below the maximum regulatory limit, the need for rigorous monitoring and operational adjustments in the disinfection processes is highlighted. The variability of THM concentrations in different contexts highlights the importance of adopting efficient disinfection practices tailored to the specific characteristics of each water source to minimize long-term public health risks. This study provides a solid basis for future efforts to improve water treatment systems to benefit the population.

Supplementary Materials

The following supporting information can be downloaded at https://www.mdpi.com/article/10.3390/w17040591/s1, Figure S1: Physicochemical parameters measured at the sampling points of the Cebollar Plant; Figure S2: Physicochemical parameters measured at the sampling points of the Sustag Plant; Figure S3: Physicochemical parameters measured at the sampling points of the Tixan Plant; Table S1: Kruskal-Wallis test of the Free Chlorine values measured at the three sampling zones (Cebollar, Sustag, and Tixan); Table S2: Results of the Spearman correlation test in the Cebollar sampling system; Table S3: Results of the Spearman correlation test in the Sustag sampling system; Table S4: Results of the Spearman correlation test in the Tixan sampling system.

Author Contributions

Conceptualization, B.H. and P.D.-S.; methodology, M.J.R. and C.R.G.-S.; validation, P.D.-S. and V.P.-V.; formal analysis, B.H. and M.A.-G.; research, B.H. and P.D.-S.; data curation, B.H.; writing-original draft preparation, B.H.; writing-review and editing, P.D.-S.; supervision, P.D.-S., V.P.-V. and M.D.T.; project administration, P.D.-S. and M.D.T.; funding acquisition, P.D.-S.; project administration, P.D.-S. and M.D.T.; supervision, P.D.-S., V.P.-V. and M.D.T.; project administration, P.D.-S.; funding acquisition, P.D.-S. and M.J.R. All authors have read and agreed to the published version of the manuscript.

Funding

This research was funded by Salesian Polytechnic University, project number 006-001-2024-01-18.

Data Availability Statement

The raw data supporting the conclusions of this article will be available upon request from the authors.

Acknowledgments

The authors would like to thank the following institutions for funding the project on the detection of trihalomethanes in water: the VIUC of the University of Cuenca, the Salesian Polytechnic University for the approval of project 006-001-2024-01-18, Research on Drinking water of Université Laval for support in logistics, in particular Cristian García for field and laboratory help, and ETAPA EP for the facilities provided during the sampling process.

Conflicts of Interest

The authors declare no conflicts of interest.

References

  1. Duque-Sarango, P.; Romero-Martínez, L.; Pinos-Vélez, V.; Sánchez-Cordero, E.; Samaniego, E. Comparative Study of UV Radiation Resistance and Reactivation Characteristics of E. coli ATCC 8739 and Native Strains: Implications for Water Disinfection. Sustainability 2023, 15, 9559. [Google Scholar] [CrossRef]
  2. Duque-Sarango, P.; Delgado-Armijos, N.; Romero-Martínez, L.; Pinos-Vélez, V. Assessing the potential of ultraviolet irradiation for inactivating waterborne fungal spores: Kinetics and photoreactivation studies. Front. Environ. Sci. 2023, 11, 1212807. [Google Scholar] [CrossRef]
  3. Cheswick, R.; Moore, G.; Nocker, A.; Hassard, F.; Jefferson, B.; Jarvis, P. Chlorine disinfection of drinking water assessed by flow cytometry: New insights. Environ. Technol. Innov. 2020, 19, 101032. [Google Scholar] [CrossRef]
  4. Srivastav, A.L.; Patel, N.; Chaudhary, V.K. Disinfection by-products in drinking water: Occurrence, toxicity and abatement. Environ. Pollut. 2020, 267, 115474. [Google Scholar] [CrossRef]
  5. Romero-Martínez, L.; Duque-Sarango, P.; González-Martín, C.; Moreno-Andrés, J.; Acevedo-Merino, A.; Nebot, E. Inactivation efficacy and reactivation of fecal bacteria with a flow-through LED ultraviolet reactor: Intraspecific response prevails over interspecific differences. J. Water Process Eng. 2023, 52, 103497. [Google Scholar] [CrossRef]
  6. WHO. “Drinking-Water”, World Health Organization. Available online: https://lc.cx/wNxWH5 (accessed on 29 September 2024).
  7. Chawla, H.; Chandra, A.; Ingole, P.P.; Garg, S. Recent advancements in enhancement of photocatalytic activity using bismuth-based metal oxides Bi2MO6 (M = W, Mo, Cr) for environmental remediation and clean energy production. J. Ind. Eng. Chem. 2021, 95, 1–15. [Google Scholar] [CrossRef]
  8. Tsitsifli, S.; Kanakoudis, V. Disinfection Impacts to Drinking Water Safety—A Review. In EWaS3 2018; MDPI: Basel Switzerland, 2018; p. 603. [Google Scholar] [CrossRef]
  9. Dubey, S.; Gusain, D.; Sharma, Y.C.; Bux, F. The occurrence of various types of disinfectant by-products (trihalomethanes, haloacetic acids, haloacetonitrile) in drinking water. In Disinfection By-Products in Drinking Water; Elsevier: Amsterdam, The Netherlands, 2020; pp. 371–391. [Google Scholar] [CrossRef]
  10. Villanueva, C.M.; Evlampidou, I.; Ibrahim, F.; Donat-Vargas, C.; Valentin, A.; Tugulea, A.M.; Echigo, S.; Jovanovic, D.; Lebedev, A.T.; Lemus-Pérez, M.; et al. Global assessment of chemical quality of drinking water: The case of trihalomethanes. Water Res. 2023, 230, 119568. [Google Scholar] [CrossRef] [PubMed]
  11. Brown, D.; Bridgeman, J.; West, J.R. Predicting chlorine decay and THM formation in water supply systems. Rev. Environ. Sci. Biotechnol. 2011, 10, 79–99. [Google Scholar] [CrossRef]
  12. Hu, G.; Mian, H.R.; Mohammadiun, S.; Rodriguez, M.J.; Hewage, K.; Sadiq, R. Appraisal of machine learning techniques for predicting emerging disinfection byproducts in small water distribution networks. J. Hazard. Mater. 2023, 446, 130633. [Google Scholar] [CrossRef] [PubMed]
  13. Sathasivan, A.; Kastl, G.; Korotta-Gamage, S.; Gunasekera, V. Trihalomethane species model for drinking water supply systems. Water Res. 2020, 184, 116189. [Google Scholar] [CrossRef]
  14. Hua, P.; Gao, Q.; Wang, Z.; Jiang, S.; de Oliveira, K.R.F.; Macedo, D.O. Modeling and elucidation the effects of iron deposits on chlorine decay and trihalomethane formation in drinking water distribution system. Water Res. 2021, 207, 117804. [Google Scholar] [CrossRef] [PubMed]
  15. Clayton, G.E.; Thorn, R.M.S.; Reynolds, D.M. Comparison of Trihalomethane Formation Using Chlorine-Based Disinfectants Within a Model System; Applications Within Point-of-Use Drinking Water Treatment. Front. Environ. Sci. 2019, 7, 35. [Google Scholar] [CrossRef]
  16. Padhi, R.K.; Subramanian, S.; Mohanty, A.K.; Satpathy, K.K. Comparative assessment of chlorine reactivity and trihalomethanes formation potential of three different water sources. J. Water Process Eng. 2019, 29, 100769. [Google Scholar] [CrossRef]
  17. Kumari, M.; Gupta, S.K. Occurrence and Exposure to Trihalomethanes in Drinking Water: A Systematic Review and Meta-analysis. Expo. Health 2022, 14, 915–939. [Google Scholar] [CrossRef]
  18. Tovar, S.S.T.; Susa, M.R. Cancer risk assessment from exposure to trihalomethanes in showers by inhalation. Environ. Res. 2021, 196, 110401. [Google Scholar] [CrossRef] [PubMed]
  19. Kaufman, J.A.; Wright, J.M.; Evans, A.; Rivera-Núñez, Z.; Meyer, A.; Narotsky, M.G. Disinfection by-product exposures and the risk of musculoskeletal birth defects. Environ. Epidemiol. 2020, 4, e081. [Google Scholar] [CrossRef] [PubMed]
  20. Medgyesi, D.N.; Mohan, S.; Bangia, K.; Spielfogel, E.S.; Fisher, J.A.; Jones, R.R.; Ward, M.H.; Lacey, J.V., Jr.; Sanchez, T.R. Trihalomethanes from residential community water supplies and chronic kidney disease risk among women in California. In Proceedings of the ISEE 2024: 36th Annual Conference of the International Society of Environmental Epidemiology, Santiago, Chile, 25–28 August 2024. [Google Scholar] [CrossRef]
  21. An, S.L.; Xiong, S.M.; Shen, X.B.; Ni, Y.Q.; Chen, W.; He, C.D.; Zhou, Y.Z. The associations between exposure to trihalomethanes during pregnancy and adverse birth outcomes: A systematic review and meta-analysis. Chemosphere 2022, 293, 133524. [Google Scholar] [CrossRef] [PubMed]
  22. Zhang, M.; Deng, Y.-L.; Liu, C.; Lu, W.-Q.; Zeng, Q. Impacts of disinfection byproduct exposures on male reproductive health: Current evidence, possible mechanisms and future needs. Chemosphere 2023, 331, 138808. [Google Scholar] [CrossRef] [PubMed]
  23. Deng, Y.L.; Luo, Q.; Liu, C.; Zeng, J.Y.; Lu, T.T.; Shi, T.; Cui, F.P.; Yuan, X.Q.; Miao, Y.; Zhang, M.; et al. Urinary biomarkers of exposure to drinking water disinfection byproducts and ovarian reserve: A cross-sectional study in China. J. Hazard. Mater. 2022, 421, 126683. [Google Scholar] [CrossRef]
  24. Evlampidou, I.; Font-Ribera, L.; Rojas-Rueda, D.; Gracia-Lavedan, E.; Costet, N.; Pearce, N.; Vineis, P.; Jaakkola, J.J.; Delloye, F.; Makris, K.C.; et al. Trihalomethanes in Drinking Water and Bladder Cancer Burden in the European Union. Environ. Health Perspect. 2020, 128, 017001. [Google Scholar] [CrossRef]
  25. Helte, E.; Säve-Söderbergh, M.; Larsson, S.C.; Martling, A.; Åkesson, A. Disinfection by-products in drinking water and risk of colorectal cancer: A population-based cohort study. JNCI J. Natl. Cancer Inst. 2023, 115, 1597–1604. [Google Scholar] [CrossRef] [PubMed]
  26. Hu, G.; Wang, H.; Yu, K.; Shen, W.; Hou, Y.; Ji, M.; Zhu, Y.; Tian, W.; Li, X. Determination of four trihalomethanes in ship ballast water by gas chromatography-negative chemical ionization-mass spectrometry. Chin. J. Chromatogr. 2022, 40, 584–589. [Google Scholar] [CrossRef] [PubMed]
  27. Tafesse, N.; Porcelli, M.; Hirpessa, B.B.; Gasana, J.; Padhi, R.K.; Robele, S.; Ambelu, A. Trihalomethanes and physicochemical quality of drinking water in Addis Ababa, Ethiopia. Heliyon 2023, 9, e19446. [Google Scholar] [CrossRef]
  28. Sánchez-Duque, G.; Lozada-Castro, J.J.; Hara, E.L.Y.; Grassi, M.T.; Rosero-Moreano, M.; Ríos-Acevedo, J.J. Alternative Ecosorbent for the Determination of Trihalomethanes in Aqueous Samples in SPME Mode. Molecules 2022, 27, 8653. [Google Scholar] [CrossRef] [PubMed]
  29. Momeniha, F.; Oskouie, A.A.; Esrafili, A.; Janani, L.; Jafari, A.J. Trihalomethanes in exhaled air, indoor air and water: A parallel design trial in chlorine and ozone-chlorine disinfected swimming pools. Build. Environ. 2021, 205, 108316. [Google Scholar] [CrossRef]
  30. Jin, M.; Wen, Z.F.; Liu, Y.J.; Qian, M.; Zhou, Y.; Bian, Y.; Zhang, Y.; Feng, X.S. Trihalomethanes in water samples: Recent update on pretreatment and detection methods. Chemosphere 2023, 341, 140005. [Google Scholar] [CrossRef]
  31. Mahato, J.K.; Gupta, S.K. Exploring applicability of artificial intelligence and multivariate linear regression model for prediction of trihalomethanes in drinking water. Int. J. Environ. Sci. Technol. 2022, 19, 5275–5288. [Google Scholar] [CrossRef]
  32. Cheshmekhezr, S.; Alimoradi, S.; Torabian, A.; Pardakhti, A.; Babaei, L. Investigation of the formation and effects of upstream trihalomethanes in Tehran’s raw and drinking water using the spectrophotometric method. J. Water Process Eng. 2021, 44, 102426. [Google Scholar] [CrossRef]
  33. Shariati-Rad, M.; Fattahi, F. A simple equipment and colorimetric method for determination of chloroform in water. Anal. Chim. Acta 2020, 1100, 208–214. [Google Scholar] [CrossRef] [PubMed]
  34. Rasheduzzaman, M.; O’Connell, B.; Krometis, L.-A.; Brown, T.; Cohen, A. Point-of-use chlorine residuals and disinfection byproduct occurrences in rural households served by public water utilities in Appalachian Virginia. J. Water Health 2024, 22, 1064–1074. [Google Scholar] [CrossRef]
  35. Ali, S.I.; Arnold, M.; Liesner, F.; Fesselet, J.-F. Characterization of Disinfection By-Products Levels at an Emergency Surface Water Treatment Plant in a Refugee Settlement in Northern Uganda. Water 2019, 11, 647. [Google Scholar] [CrossRef]
  36. EPA. “Current EPA Microbial and Disinfection Byproduct Regulations”, Agencia de Protección Ambiental de los Estados Unidos. Available online: https://archive.epa.gov/enviro/html/icr/web/html/regulations.html (accessed on 20 November 2024).
  37. WHO. Guidelines for Drinking-Water Quality: Fourth Edition Incorporating the First Addendum, 4th ed.; World Health Organization: Geneva, Switzerland, 2017; Available online: https://www.who.int/publications/i/item/9789241549950 (accessed on 20 November 2024).
  38. EU. Directive (Eu) 2020/2184 of the European Parliament and of The Council of 16 December 2020 on the Quality of Water Intended for Human Consumption (Recast). The European Parliament and the Council of the European Union. 2020. Available online: https://eur-lex.europa.eu/legal-content/EN/TXT/PDF/?uri=CELEX:32020L2184&from=EN (accessed on 20 November 2024).
  39. NTE INEN 1108. Agua Potable. Requisitos, 5th ed.; Norma Técnica Ecuatoriana: Quito, Ecuador, 2014; Available online: https://lc.cx/EEUYoT (accessed on 10 November 2024).
  40. Salazar-Flores, C.A.; Kurbatova, A.I.; Mikhaylichenko, K.Y.; Milutka, A.C. Health risk assessment of drinking water: Case study of city of Latacunga and the canton of Pedro Vicente Maldonado (Ecuador). Hyg. Sanit. 2022, 101, 344–356. [Google Scholar] [CrossRef]
  41. Cuenca, G.A. Plan de Desarrollo y Ordenamiento Territorial del Cantón Cuenca—Actualización 2022. Cuenca—Ecuador: Gobierno Autónomo Descentralizado del Cantón Cuenca. 2022. Available online: https://lc.cx/rBKHuI (accessed on 11 November 2024).
  42. Arcentales-Ríos, R.; Carrión-Méndez, A.; Cipriani-Ávila, I.; Acosta, S.; Capparelli, M.; Moulatlet, G.M.; Pinos-Vélez, V. Assessment of metals, emerging contaminants, and physicochemical characteristics in the drinking water and wastewater of Cuenca, Ecuador. J. Trace Elem. Miner. 2022, 2, 100030. [Google Scholar] [CrossRef]
  43. ETAPA. “Plantas de Potabilización”, Empresa Pública Municipal de Telecomunicaciones, Agua Potable, Saneamiento y Gestión Ambiental del Cantón Cuenca. Available online: https://www.etapa.net.ec/agua-potable-y-saneamiento/operacion-y-mantenimiento-agua-potable-y-saneamiento/plantas-de-potabilizacion-agua-potable/ (accessed on 11 November 2024).
  44. HACH. “THM PlusTM Method: Hach Method 10132—Total Trihalomethanes (THM) Reagent Set”, HACH. Available online: https://ca.hach.com/product.detail-print.version.jsa?id=14533963759 (accessed on 11 November 2024).
  45. HACH. “Trihalomethanes: Method 10132”, HACH COMPANY. 2017. Available online: https://lc.cx/Sv_ZL6 (accessed on 11 November 2024).
  46. Hung, Y.-C.; Waters, B.W.; Yemmireddy, V.K.; Huang, C.-H. pH effect on the formation of THM and HAA disinfection byproducts and potential control strategies for food processing. J. Integr. Agric. 2017, 16, 2914–2923. [Google Scholar] [CrossRef]
  47. Sriboonnak, S.; Induvesa, P.; Wattanachira, S.; Rakruam, P.; Siyasukh, A.; Pumas, C.; Wongrueng, A.; Khan, E. Trihalomethanes in Water Supply System and Water Distribution Networks. Int. J. Environ. Res. Public Health 2021, 18, 9066. [Google Scholar] [CrossRef]
  48. Valdivia-Garcia, M.; Weir, P.; Graham, D.W.; Werner, D. Predicted Impact of Climate Change on Trihalomethanes Formation in Drinking Water Treatment. Sci. Rep. 2019, 9, 9967. [Google Scholar] [CrossRef] [PubMed]
  49. Masoud, M.S.; Ismail, A.M.; El-Hoshy, M.M. Kinetics and thermodynamics of the formation of trihalomethanes. Appl. Water Sci. 2019, 9, 99. [Google Scholar] [CrossRef]
  50. Amarasooriya, A.A.G.D.; Weragoda, S.K.; Makehelwala, M.; Weerasooriya, R. Occurrence of trihalomethane in relation to treatment technologies and water quality under tropical conditions. H2Open J. 2018, 1, 69–83. [Google Scholar] [CrossRef]
  51. Kalantary, R.R.; Oshidari, Y.; Amoohadi, V.; Niknejad, H.; Zeraatkar, R.; Arani, M.H. Investigating the relationship between free chlorine concentration and heterotrophs in water of swimming pool in Iran. Heliyon 2024, 10, e36804. [Google Scholar] [CrossRef] [PubMed]
  52. Kwio-Tamale, J.C.; Onyutha, C. Influence of physical and water quality parameters on residual chlorine decay in water distribution network. Heliyon 2024, 10, e30892. [Google Scholar] [CrossRef] [PubMed]
  53. Saldaña-González, I.; Ávila, H. Evaluación de la concentración de compuestos trihalometanos en el agua potable distribuida en la Ciudad David, Panamá y sus riesgos a la salud humana. Rev. I+D Tecnológico 2022, 18, 2022. Available online: http://portal.amelica.org/ameli/journal/339/3393183007/ (accessed on 19 November 2024). [CrossRef]
  54. Sarmiento, A.; Rojas, M.; Medina, E.; Olivet, C.; Casanova, J. Investigación de trihalometanos en agua potable del Estado Carabobo, Venezuela. Gac. Sanit. 2003, 17, 137–143. [Google Scholar] [CrossRef] [PubMed]
Figure 1. Study area.
Water 17 00591 g001
Figure 2. Location of sampling points.
Water 17 00591 g002
Figure 3. Comparison of the variability of free chlorine concentrations in the three drinking water systems.
Water 17 00591 g003
Figure 4. Variability of free chlorine concentrations at the different sampling locations.
Water 17 00591 g004
Figure 5. Variability of CHCl3 levels at the different sampling locations.
Water 17 00591 g005
Figure 6. Spearman correlation analysis for pH, temperature, electrical conductivity, turbidity, free chlorine, and chloroform.
Water 17 00591 g006
Table 1. Average values of the physicochemical parameters of water (standard deviations into parenthesis).
Treatment PlantCodepHTemperature (°C)CE
(µS/cm)
Turbidity (NTU)Free Cl
(mg/L)
CebollarCS7.20 ± 0.3115.01 ± 0.66114.48 ± 17.880.71 ± 0.681.20 ± 0.17
C17.34 ± 0.2420.23 ± 2.17123.25 ± 17.641.07 ± 0.581.01 ± 0.31
C27.26 ± 0.4820.36 ± 1.93115.50 ± 21.161.04 ± 0.320.88 ± 0.31
C37.33 ± 0.1520.64 ± 1.70123.08 ± 14.261.57 ± 1.350.77 ± 0.33
SustagSS7.06 ± 0.5015.18 ± 2.1177.14 ± 8.050.46 ± 0.241.24 ± 0.30
S16.76 ± 0.6522.61 ± 4.0282.38 ± 13.260.53 ± 0.390.88 ± 0.28
S26.81 ± 0.6521.50 ± 2.2877.77 ± 9.680.53 ± 0.180.73 ± 0.23
S37.01 ± 0.3219.98 ± 2.8083.63 ± 11.770.62 ± 0.330.34 ± 0.19
TixanTS7.54 ± 0.4915.15 ± 1.58110.50 ± 11.290.54 ± 0.481.05 ± 0.37
T17.44 ± 0.2519.55 ± 2.73103.75 ± 7.920.44 ± 0.250.87 ± 0.35
T27.46 ± 0.2520.16 ± 1.87106.13 ± 7.200.51 ± 0.260.79 ± 0.29
T37.70 ± 0.2120.01 ± 2.52118.13 ± 12.290.65 ± 0.410.29 ± 0.16
Table 2. Average concentrations of CHCl3 at the different sampling locations.
PTACodeCHCl3 (µg/L)
CebollarCS12.25 ± 5.07
C125.75 ± 6.82
C220.88 ± 5.54
C317.13 ± 3.69
SustagSS21.88 ± 3.98
S114.25 ± 5.73
S211.75 ± 4.87
S317.75 ± 6.74
TixanTS14.25 ± 6.23
T115.75 ± 6.18
T213.00 ± 5.66
T319.88 ± 6.44
Disclaimer/Publisher’s Note: The statements, opinions and data contained in all publications are solely those of the individual author(s) and contributor(s) and not of MDPI and/or the editor(s). MDPI and/or the editor(s) disclaim responsibility for any injury to people or property resulting from any ideas, methods, instructions or products referred to in the content.

