
Discharge Capacity of the Flood Discharge Shaft in a Tailings Reservoir: An Experimental and Numerical Study


Abstract
1. Introduction
2. Physical Model Test
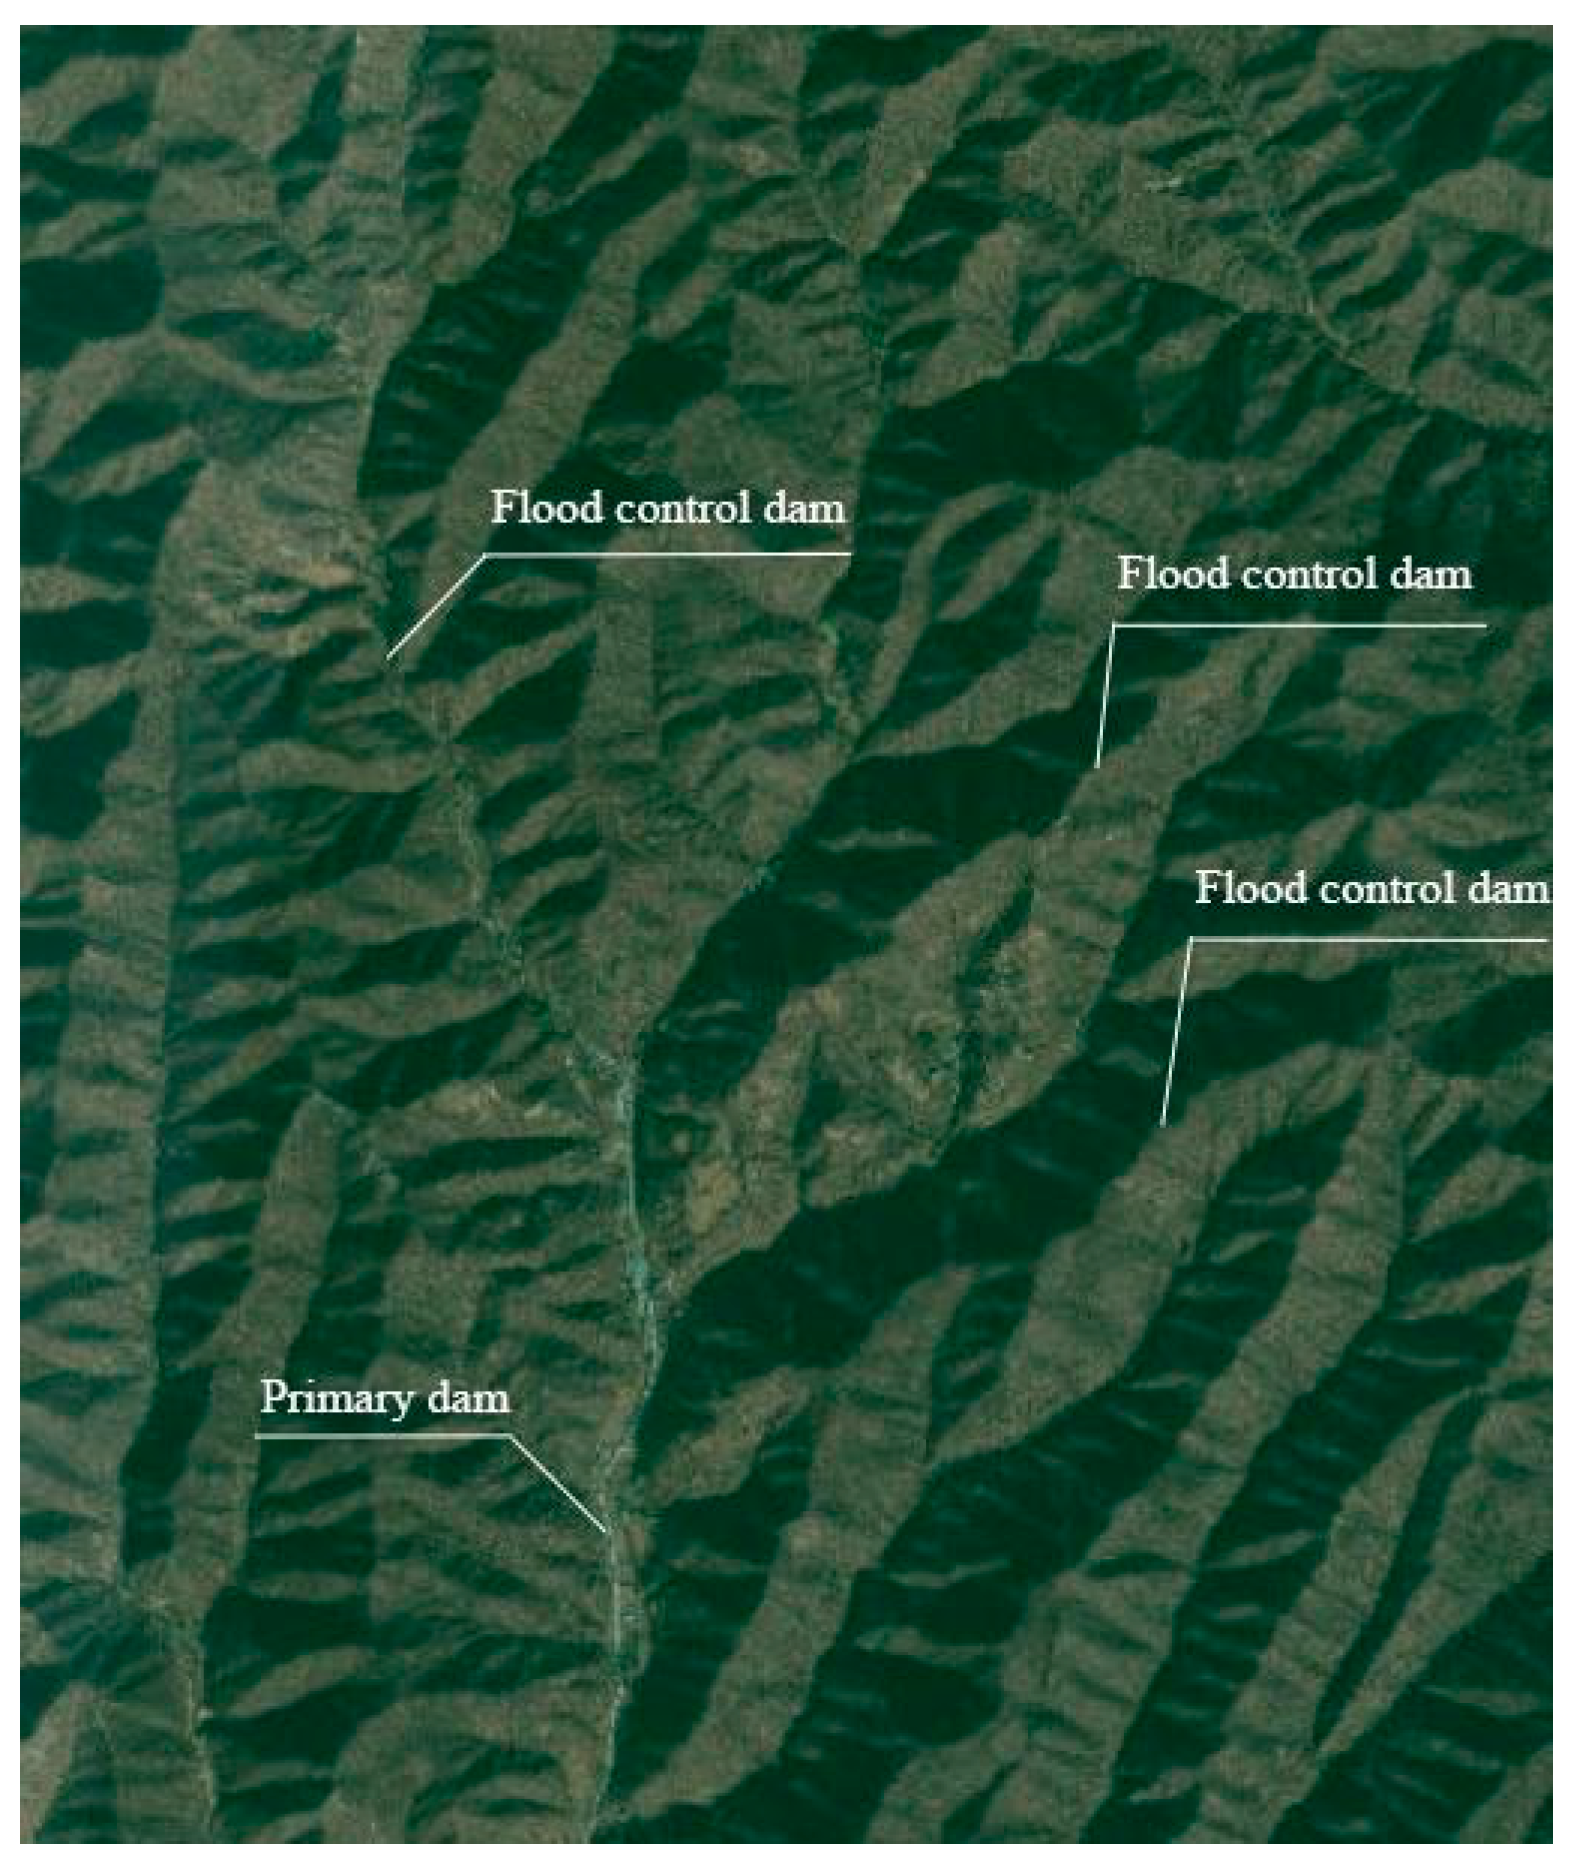
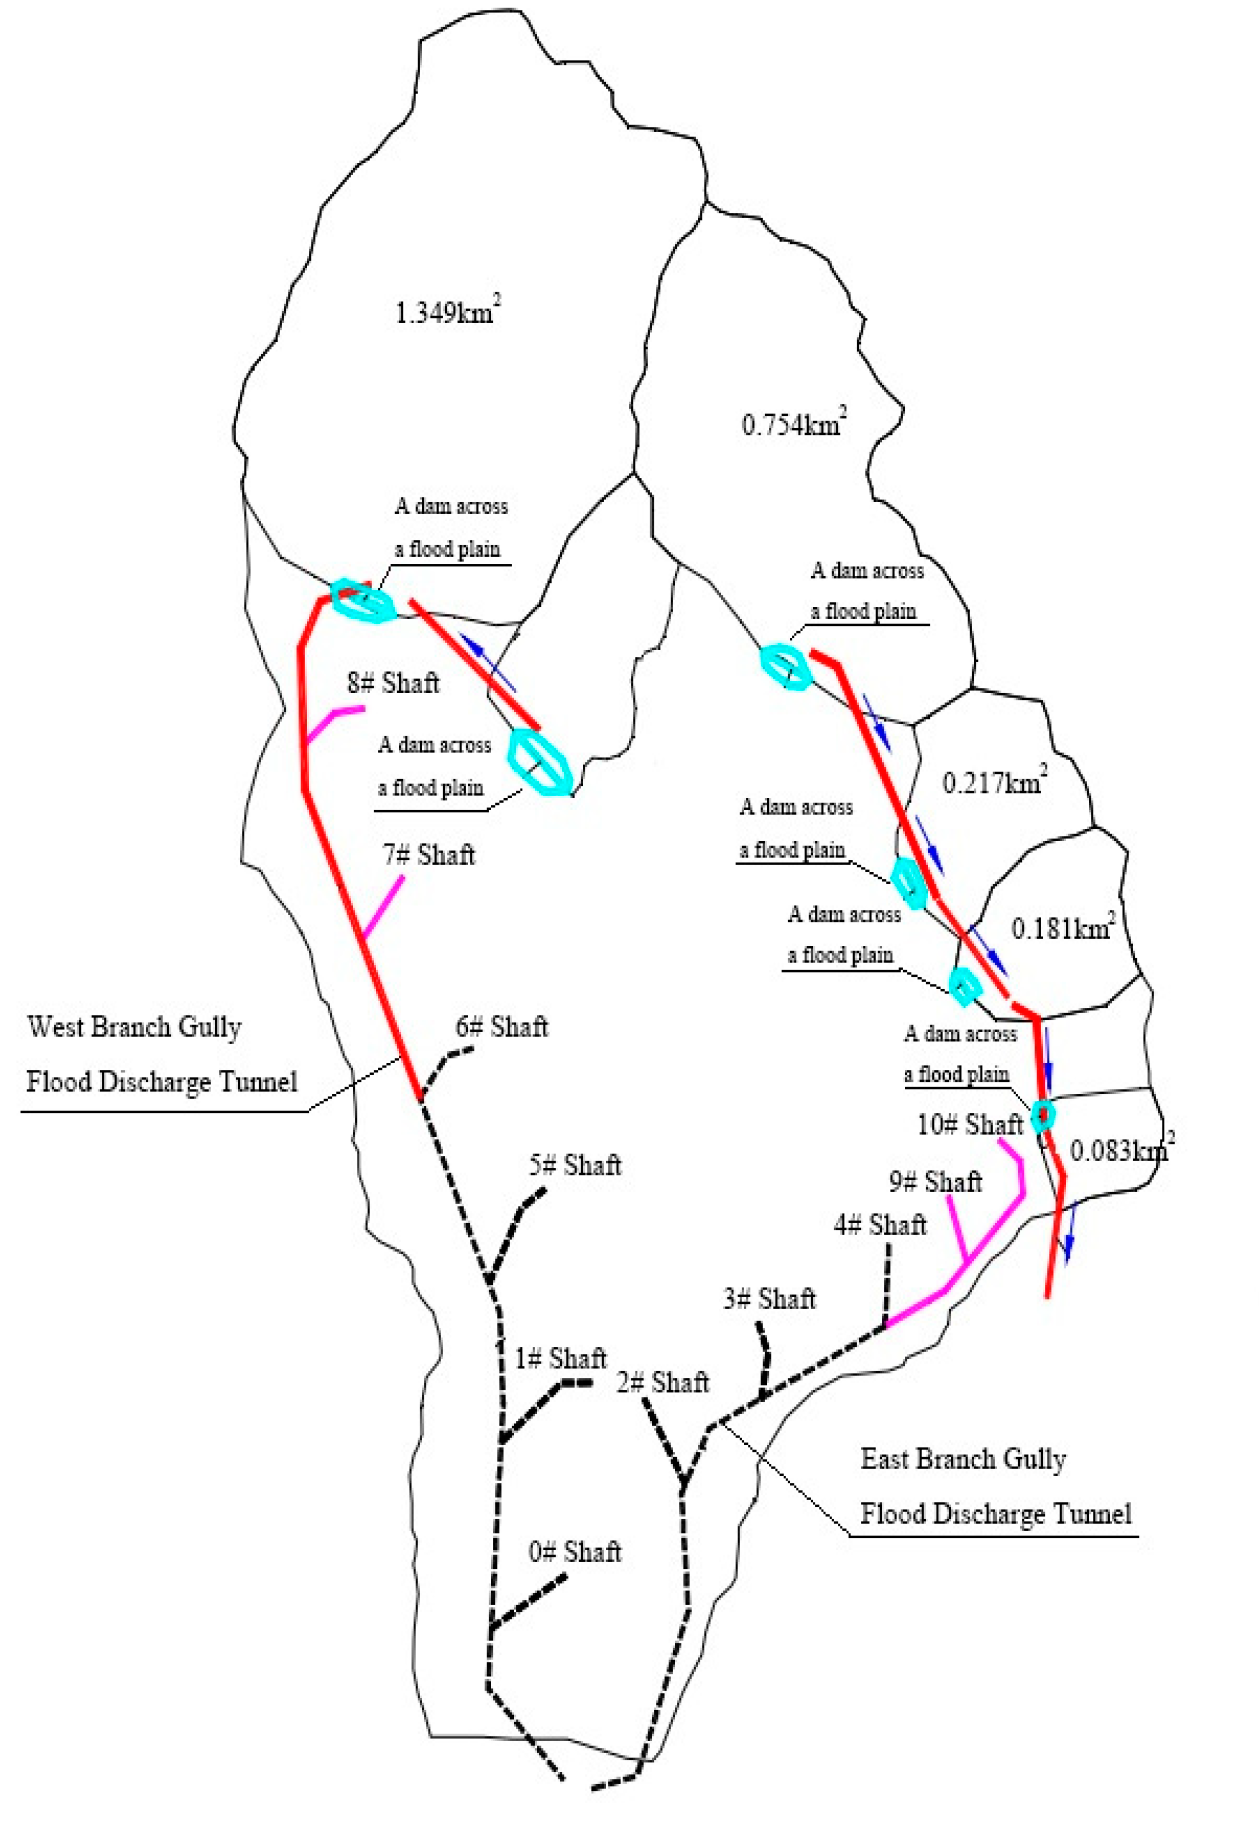
2.1. Test Prototype
2.2. Flood Management Algorithm
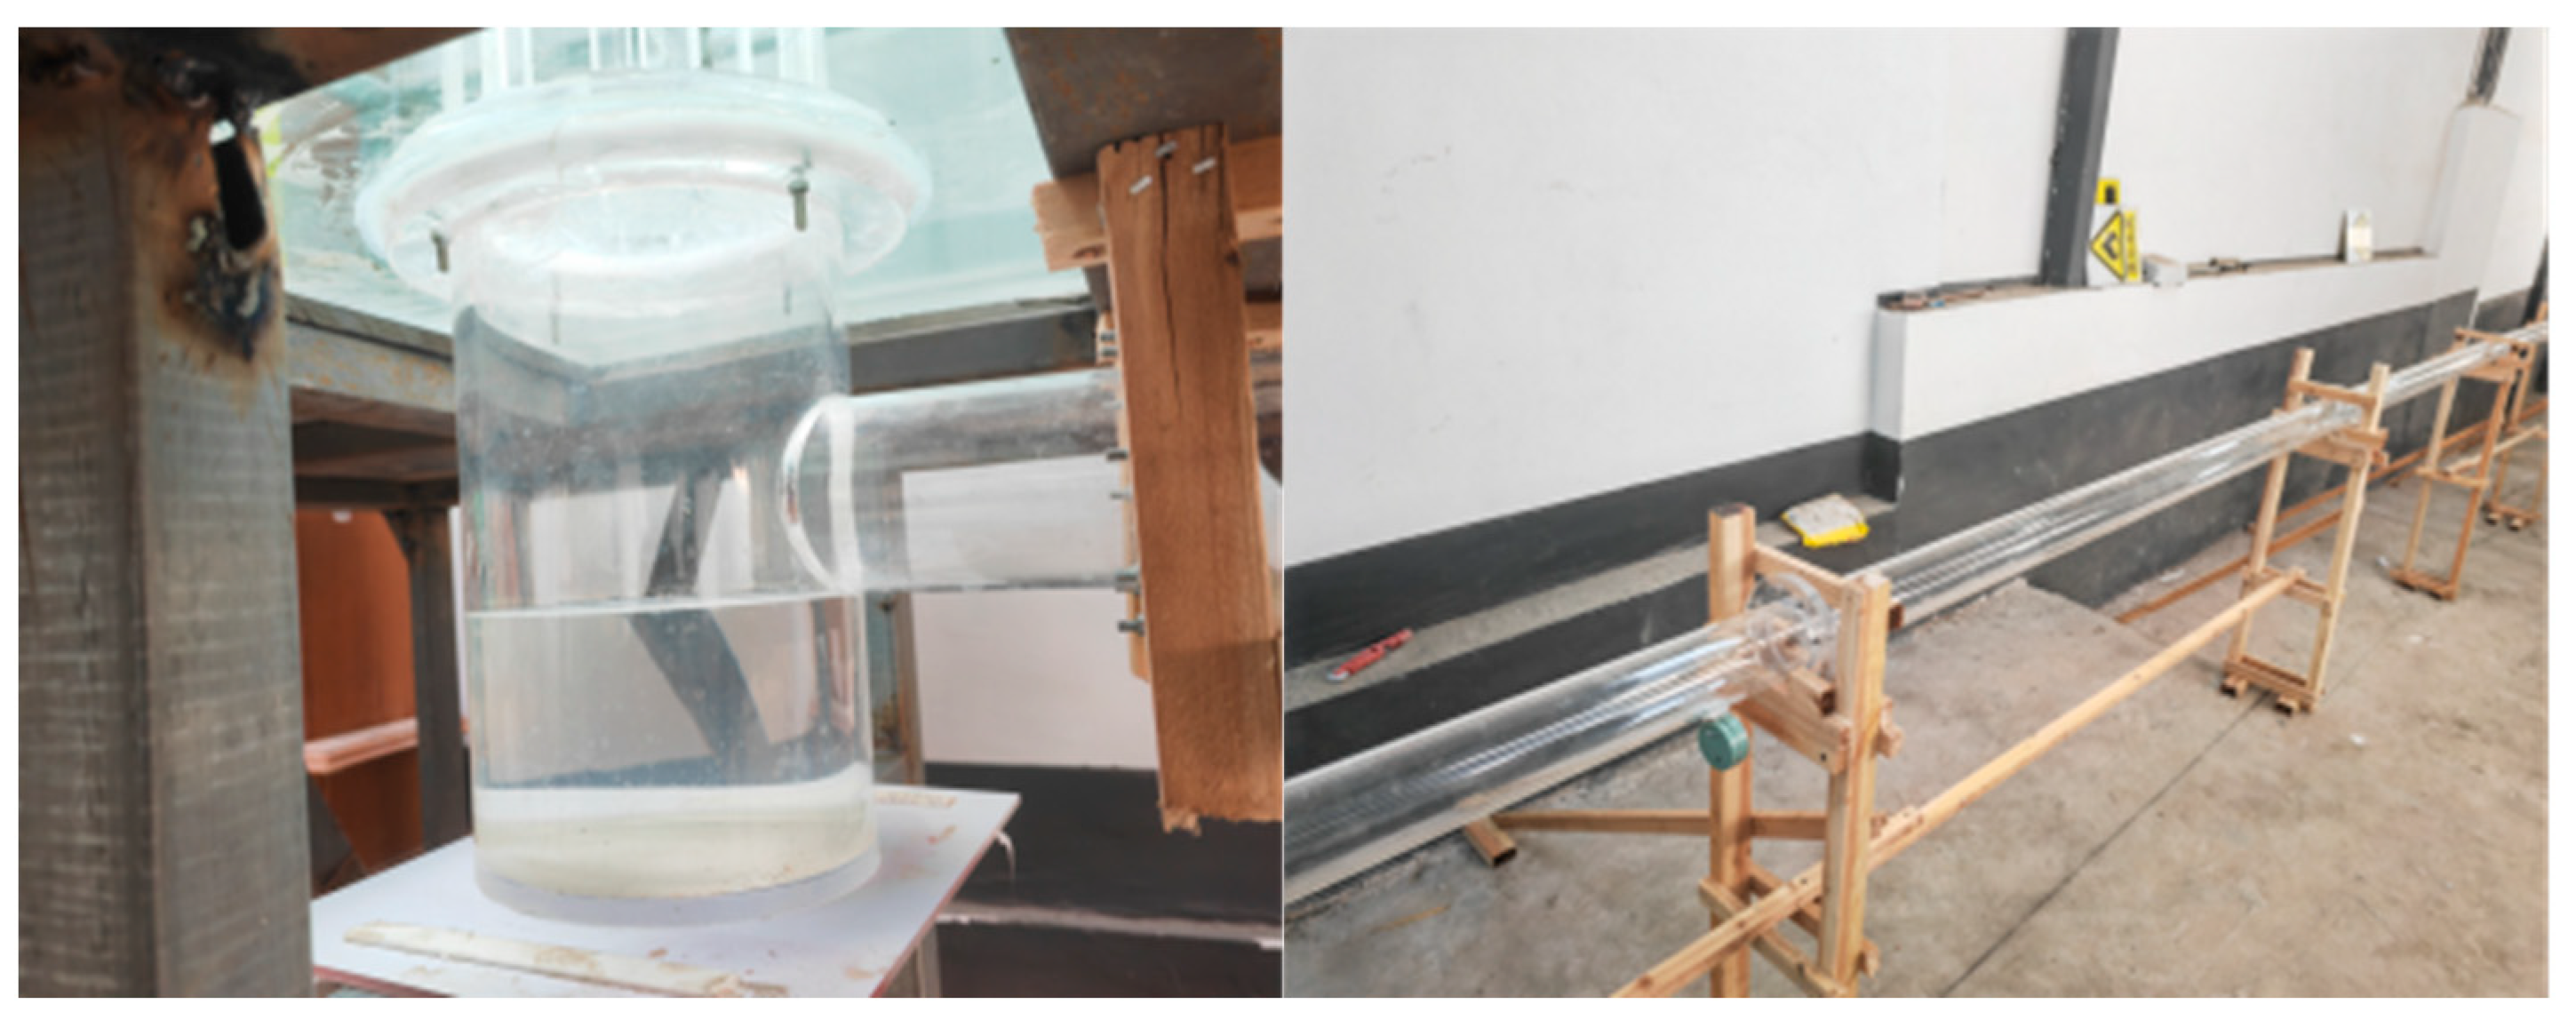
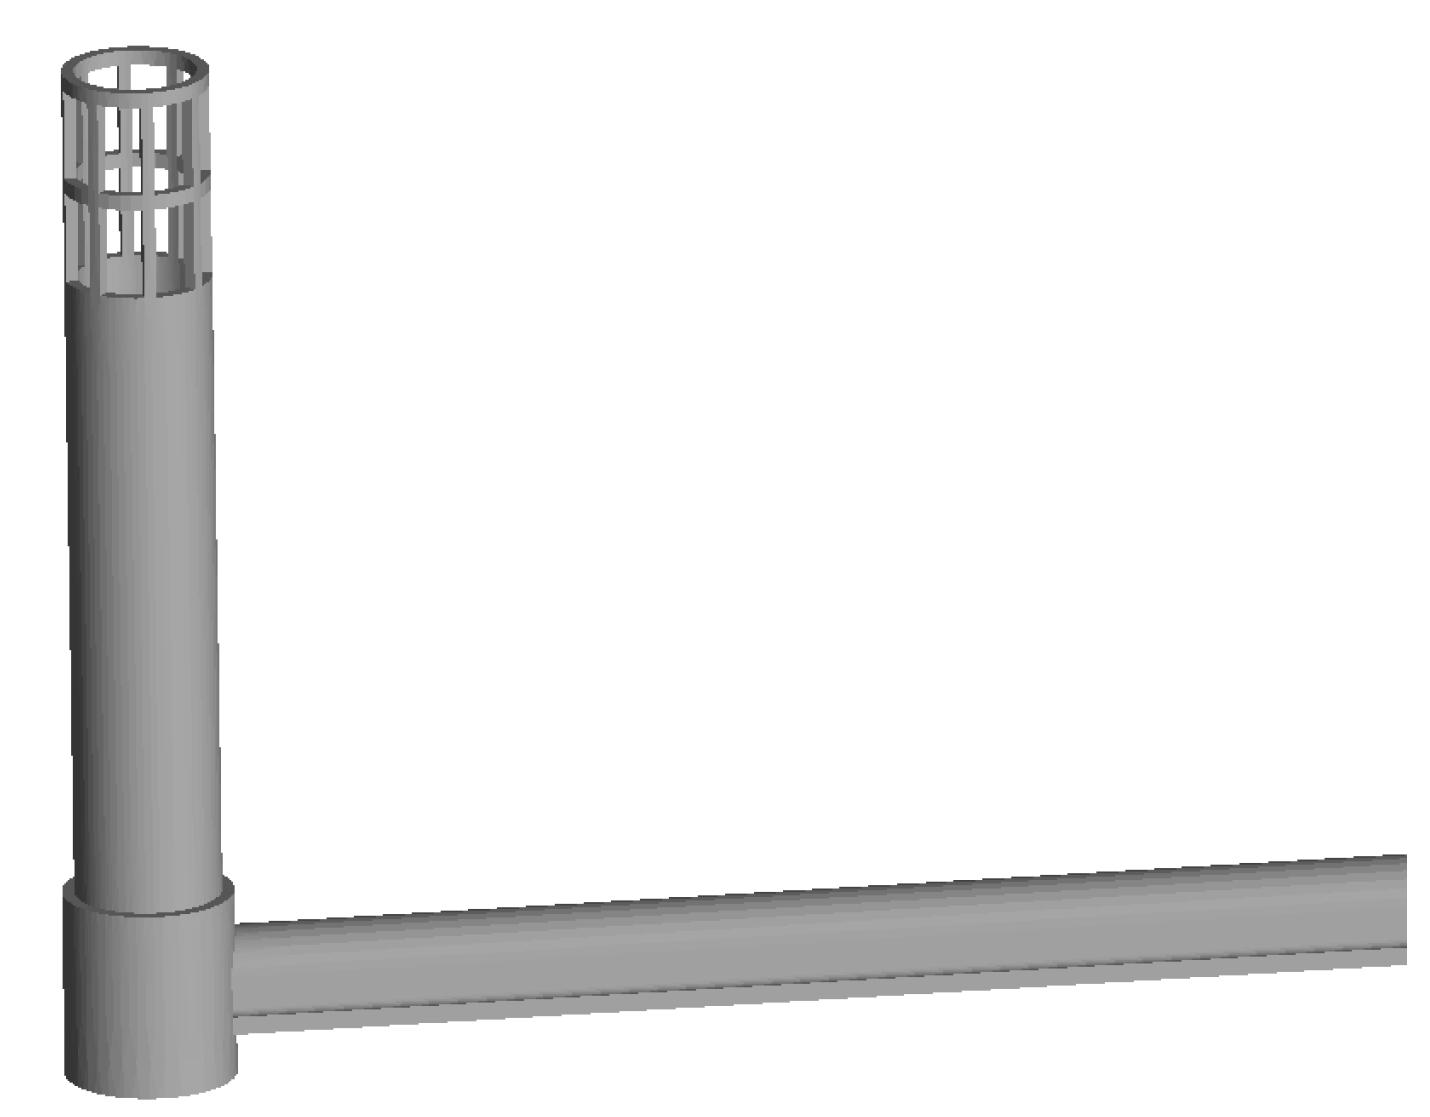
2.3. Test Setup
3. Numerical Simulation
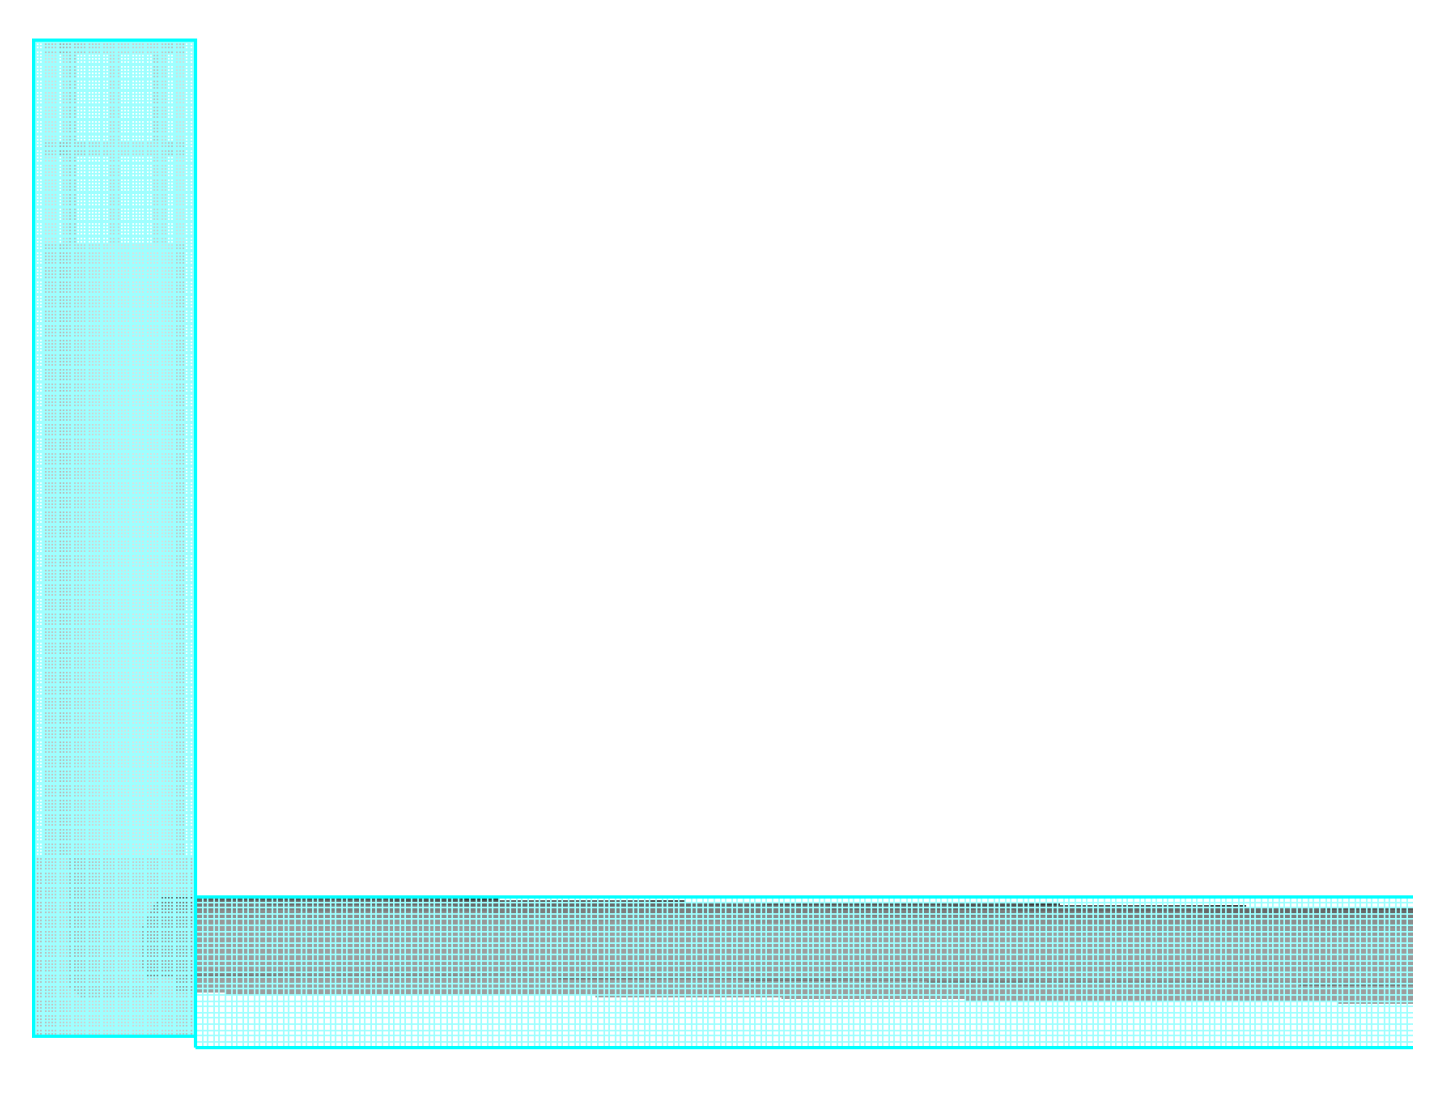
3.1. Experimental Setup and Grid Division
3.2. Governing Equation
3.2.1. Turbulence Model
3.2.2. Free Surface Tracking
3.3. Computational Method and Boundary Conditions
4. Analysis of Experimental and Simulation Results
4.1. Results and Analysis
4.1.1. Model Test Results
4.1.2. Flow Regime of the Flood Discharge System
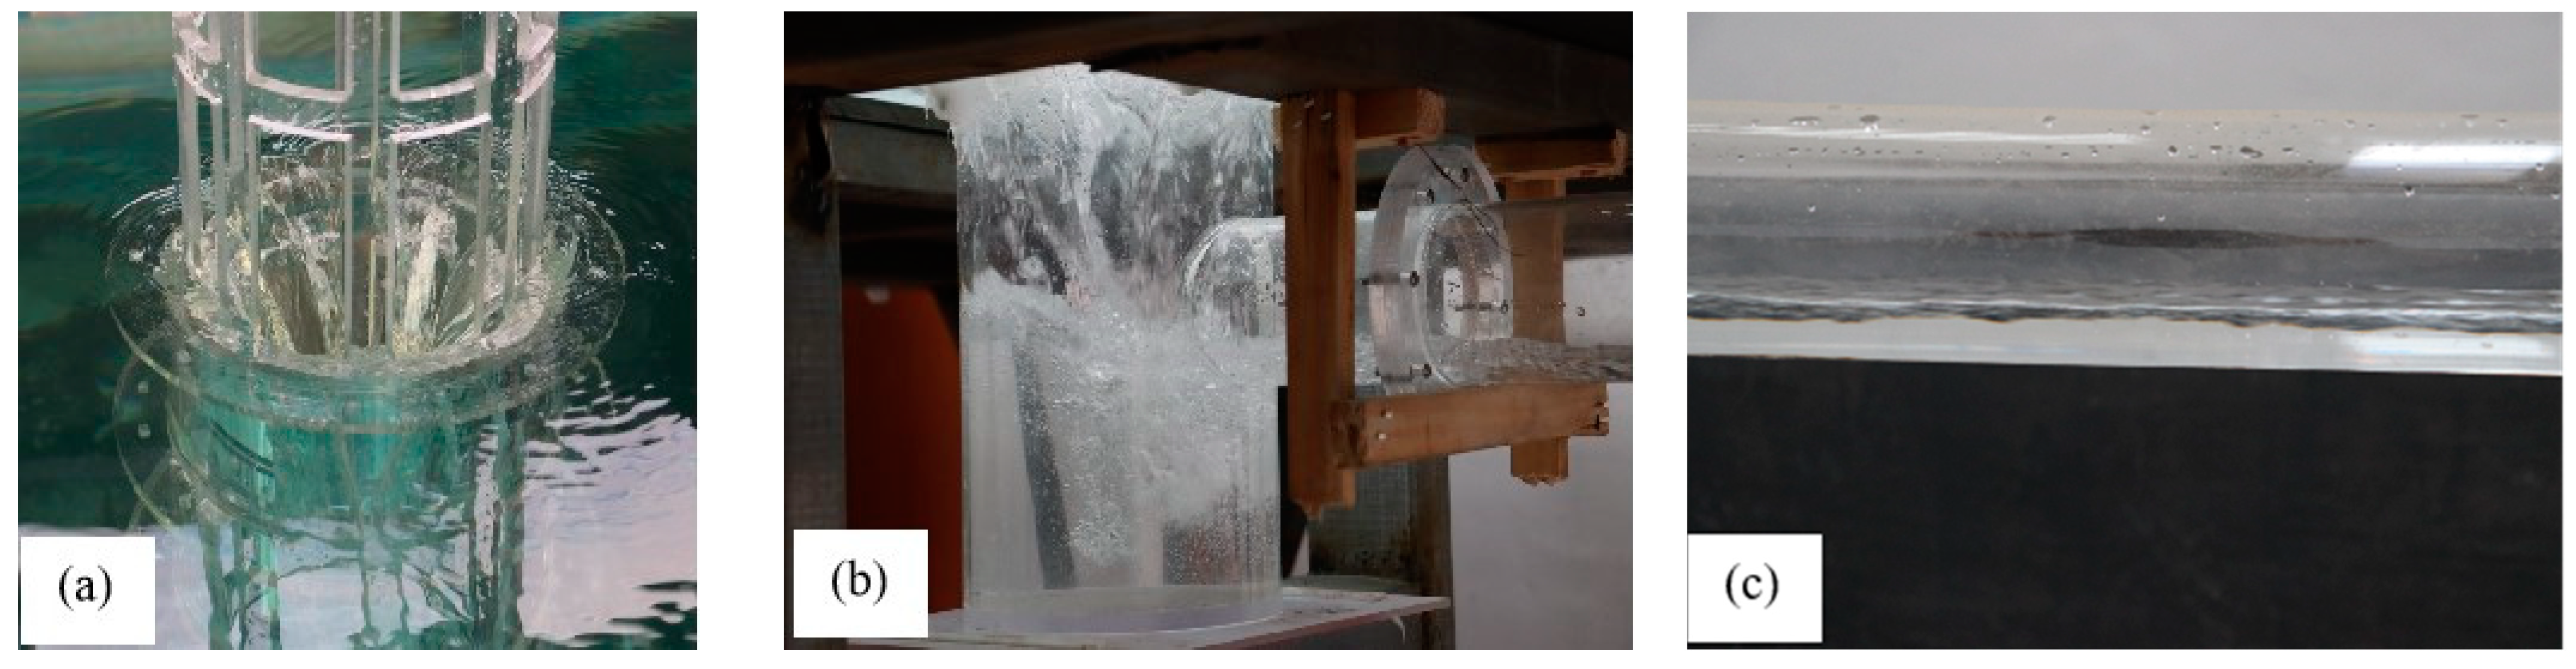
- (1)
- Free flow: As Figure 7 depicts, when water began to enter the upstream tank, the water level rose gradually. When the discharge head was below 0.8 m, the flow regime at the inlet of the shaft was characterized by weir flow formed by the bottom sill ring beam of the discharge window. The water flowed into the eight discharge windows and gradually descended along the wall. After the water dropped into the energy dissipation well, it rolled and collided with each other to dissipate energy, during which a small amount of gas was mixed in the energy dissipation well. When the water level at the bottom of the energy dissipation well rose to the bottom of the horizontal pipe, the water flowed gently out along the horizontal pipe, at which point the flow inside the horizontal pipe was in an unpressurized regime.
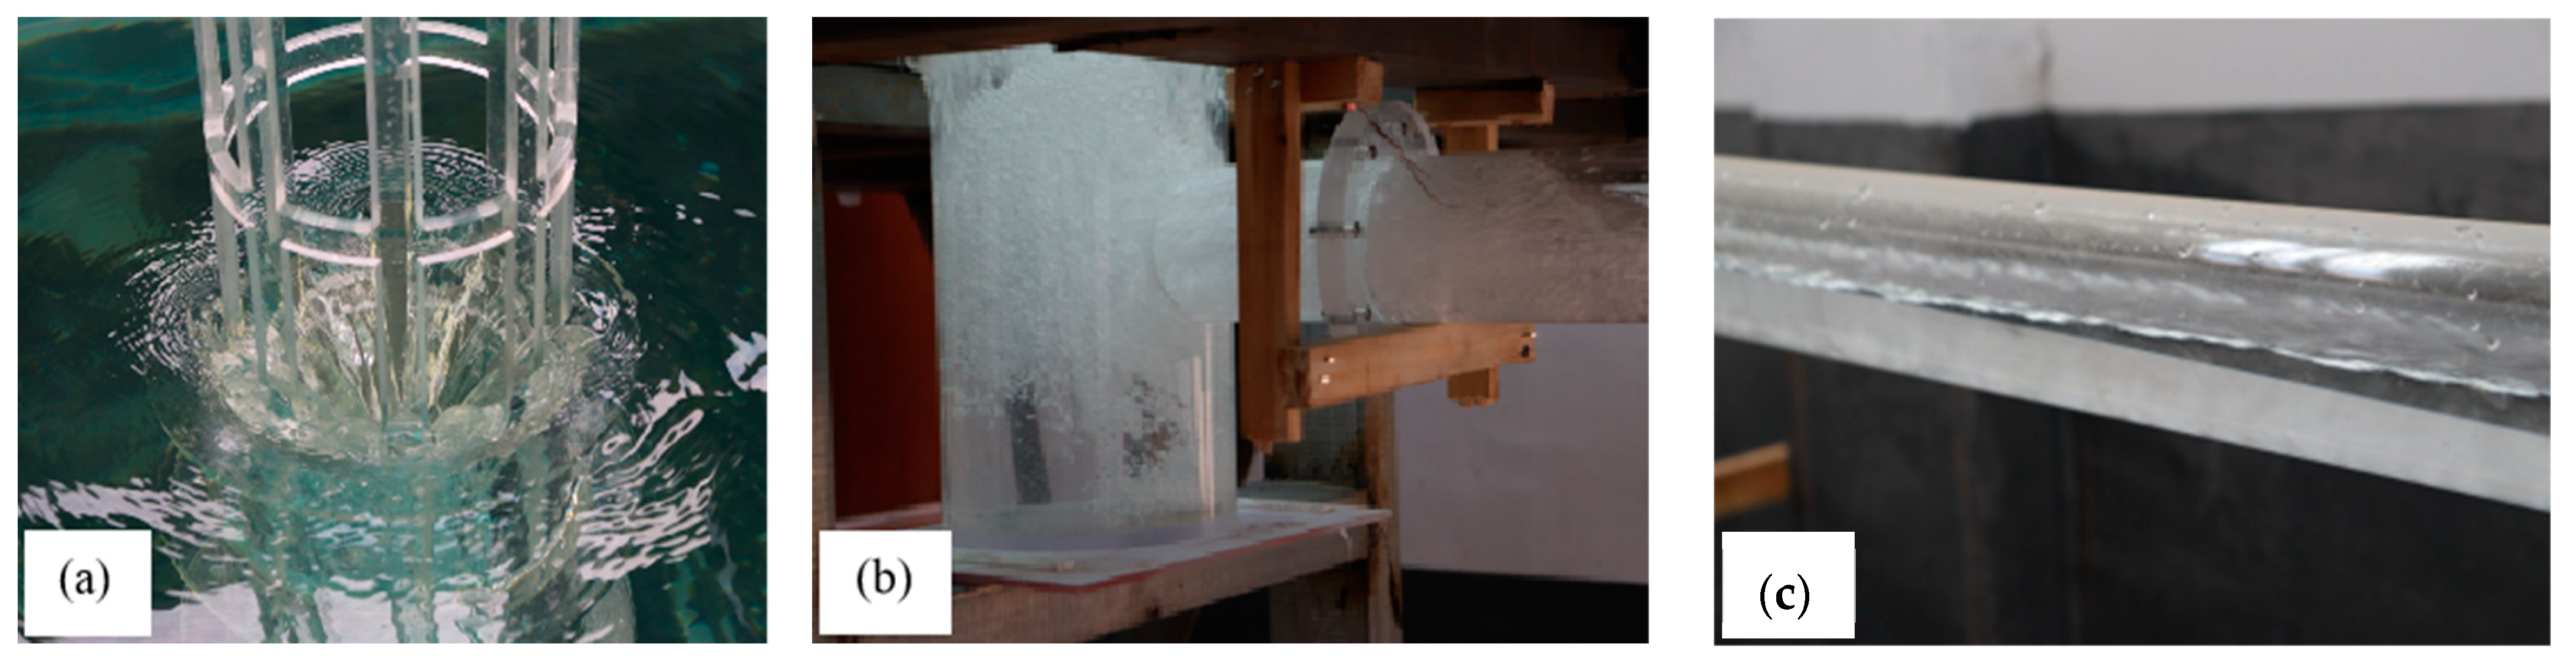
- (2)
- Partially pressurized flow: As Figure 8 presents, when the drainage head ranged from 0.8 m to 1.2 m, as the water head continued to rise, the eight water streams gradually converged into a single flow, and the water tongue became increasingly thicker. Eventually, a large volume of water flowed into the shaft, where the water tongues interfered with each other, causing the flow to carry a certain amount of air into the energy dissipation well. After energy dissipation through aeration, the gas escaped to the water surface and flowed into the discharge tunnel, resulting in the water flow being mixed with numerous bubbles, rolling violently, and incorporating a large amount of gas. At this point, a vortex began to form at the inlet of the energy dissipation well, while the inlet section of the horizontal pipe exhibited an alternating regime between open-channel flow and full-pipe flows, and the latter section of the pipe demonstrated an unpressurized flow regime.
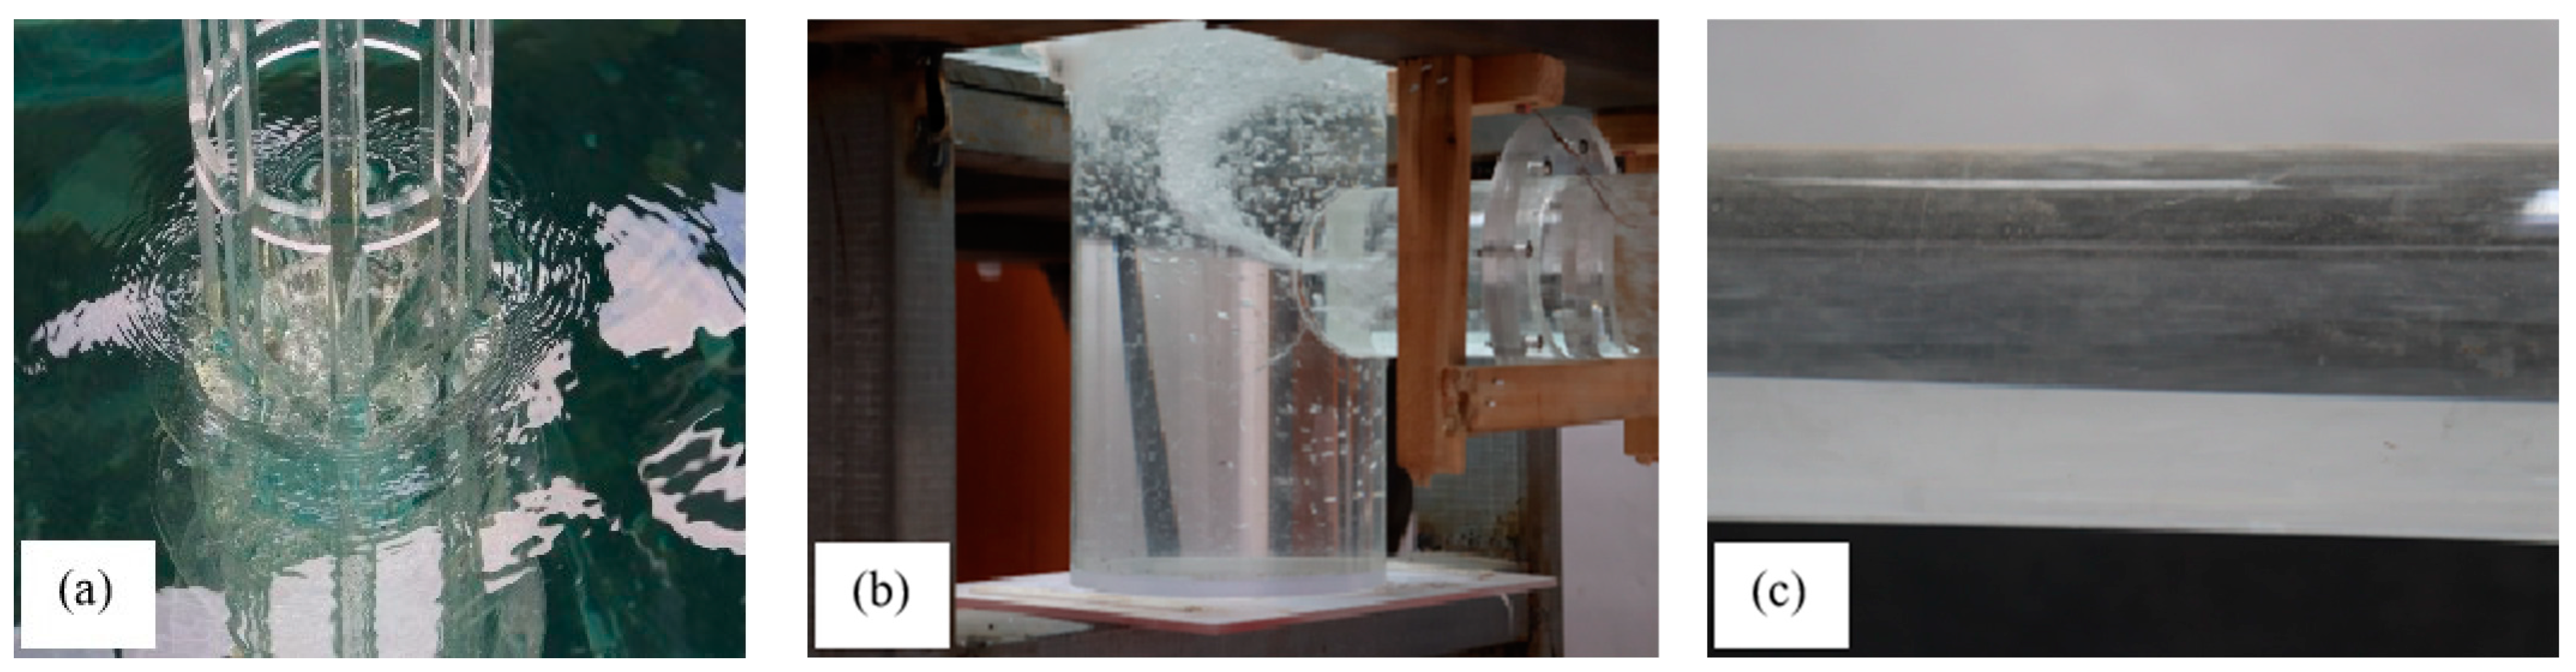
- (3)
- Pressurized flow: As Figure 9 illustrates, when the discharge head exceeded 1.2 m, the flow at the inlet gradually intensified downward and progressively filled the flood discharge system. When the head reached 1.6 m, the discharge situation stabilized, and the shaft gradually expelled air, resulting in a calm water surface. Full-pipe pressurized flow regimes developed in both the energy dissipation well and the horizontal pipe, at which point the discharge capacity experienced a turning point. The discharge flow approached a certain value, and as the water head increased, the discharge flow rate increased only slightly or remained essentially constant.
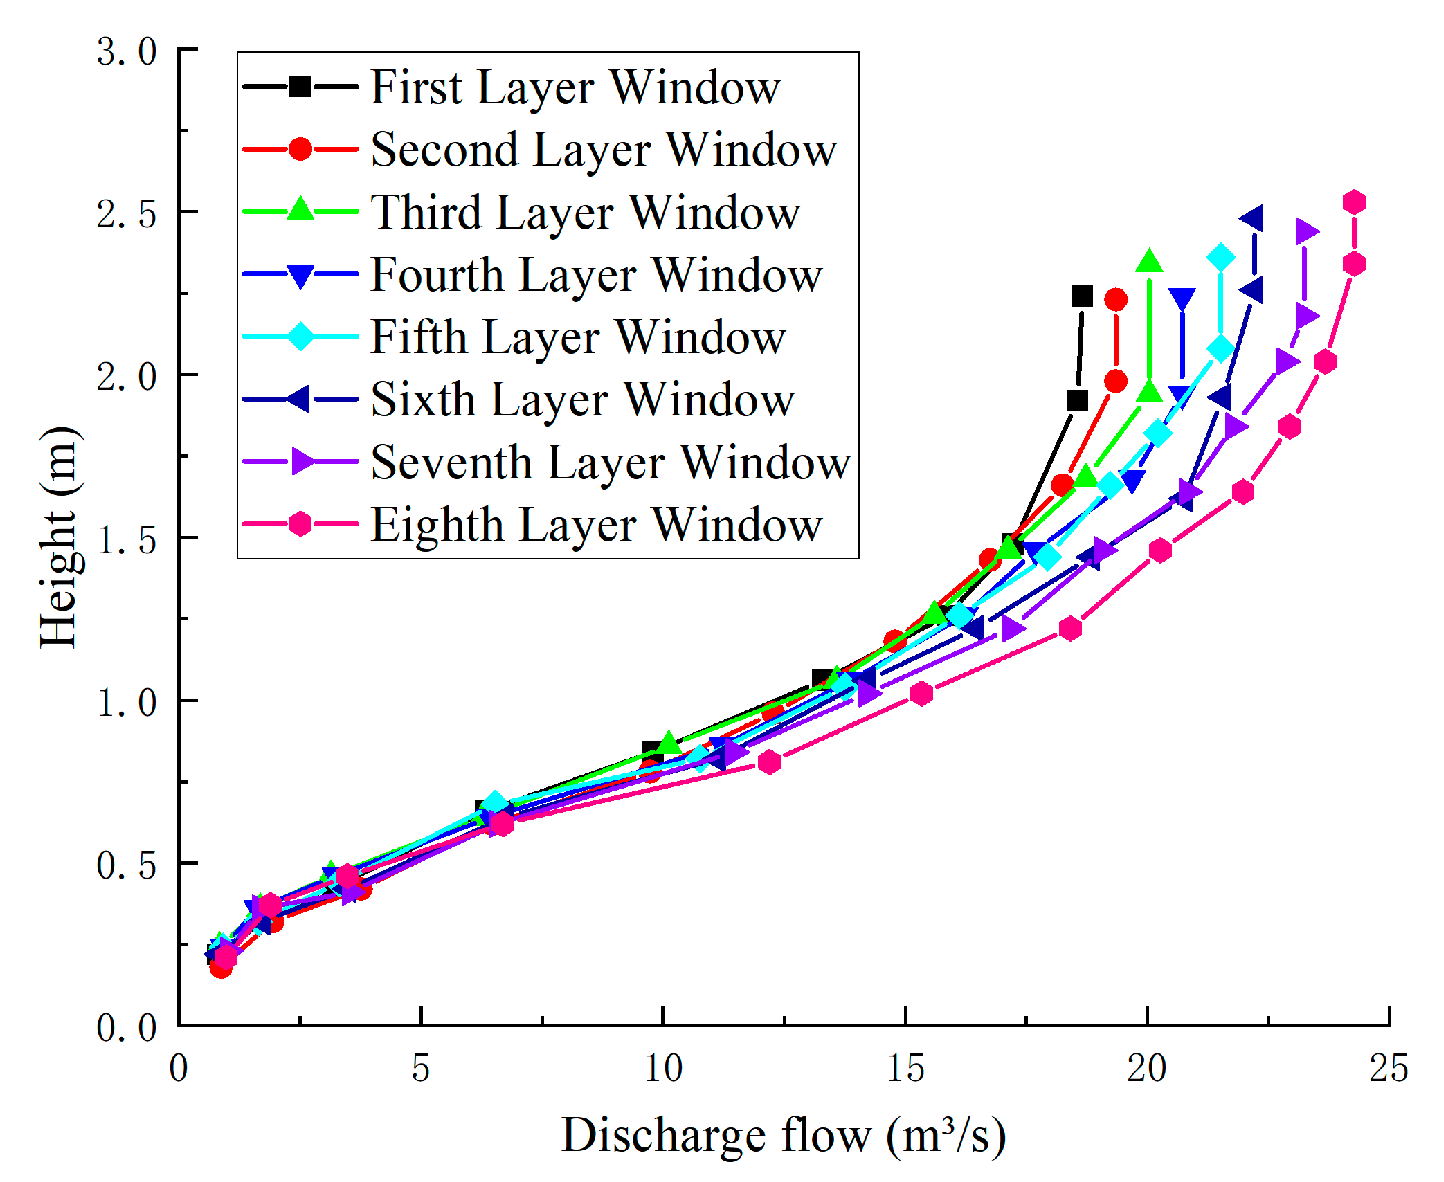
4.1.3. Flow Rate of the Flood Discharge System
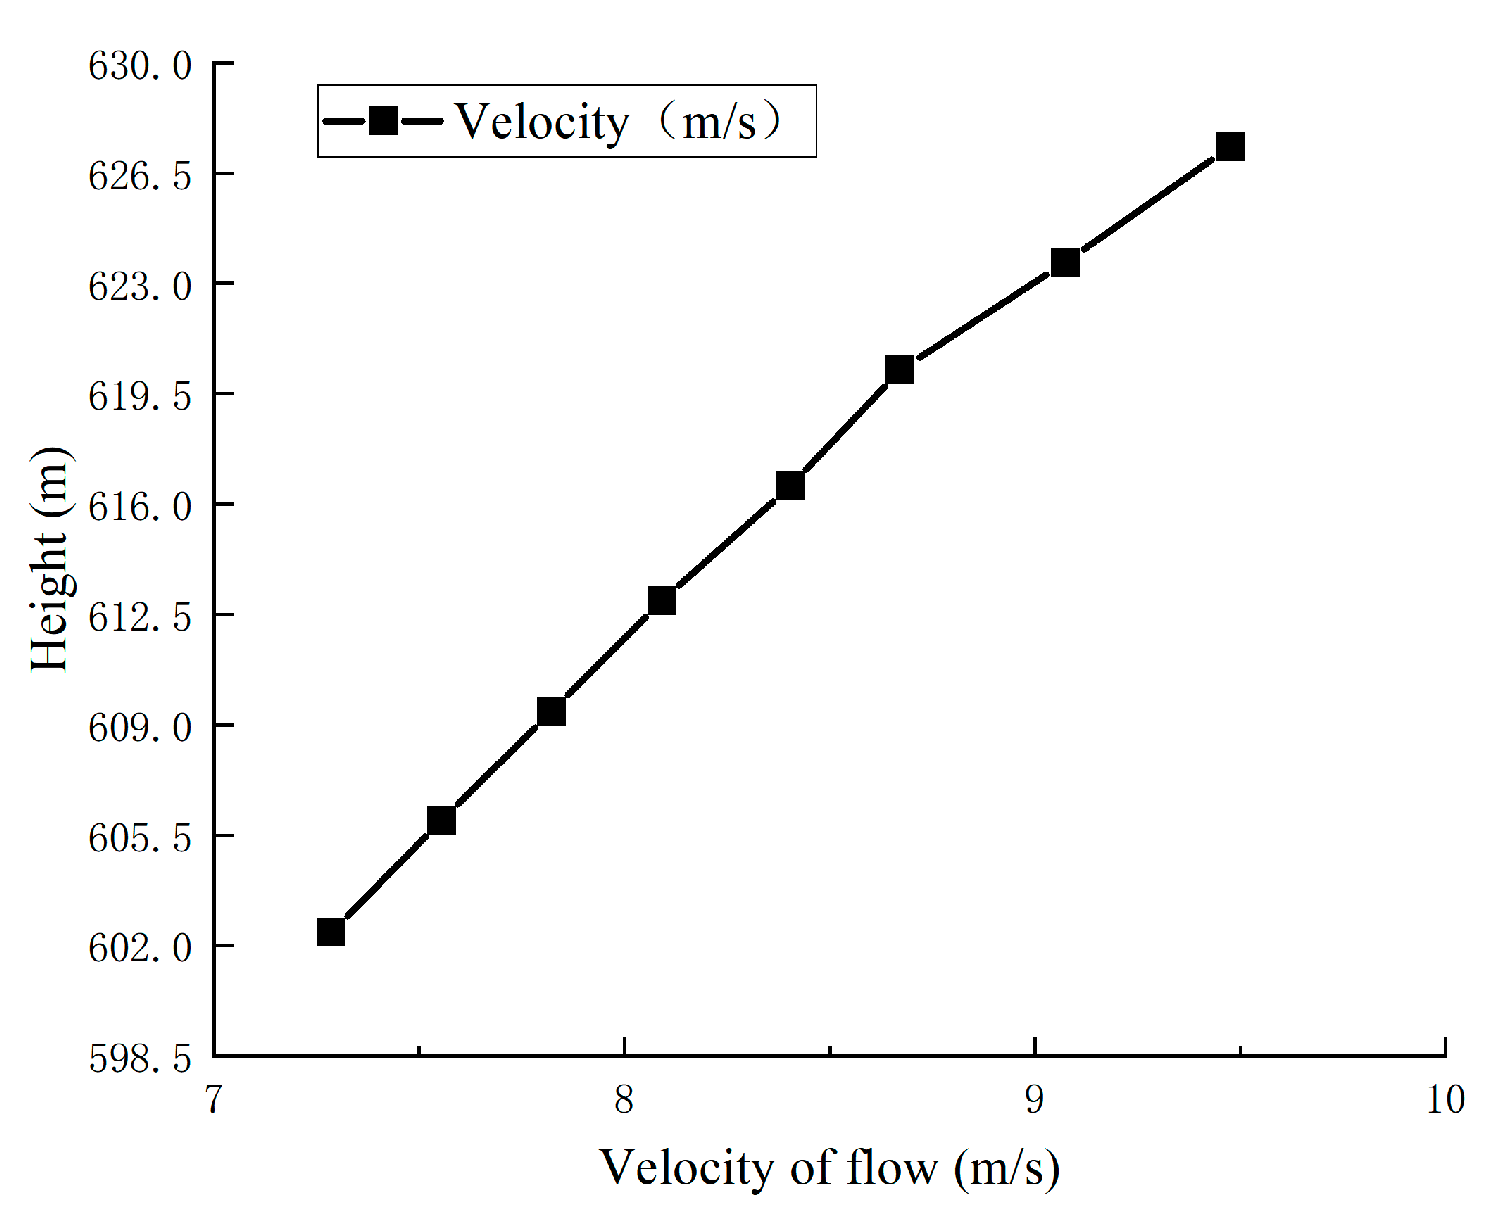
4.1.4. Analysis of Flood Tunnel Pressure
4.2. Numerical Simulation Results
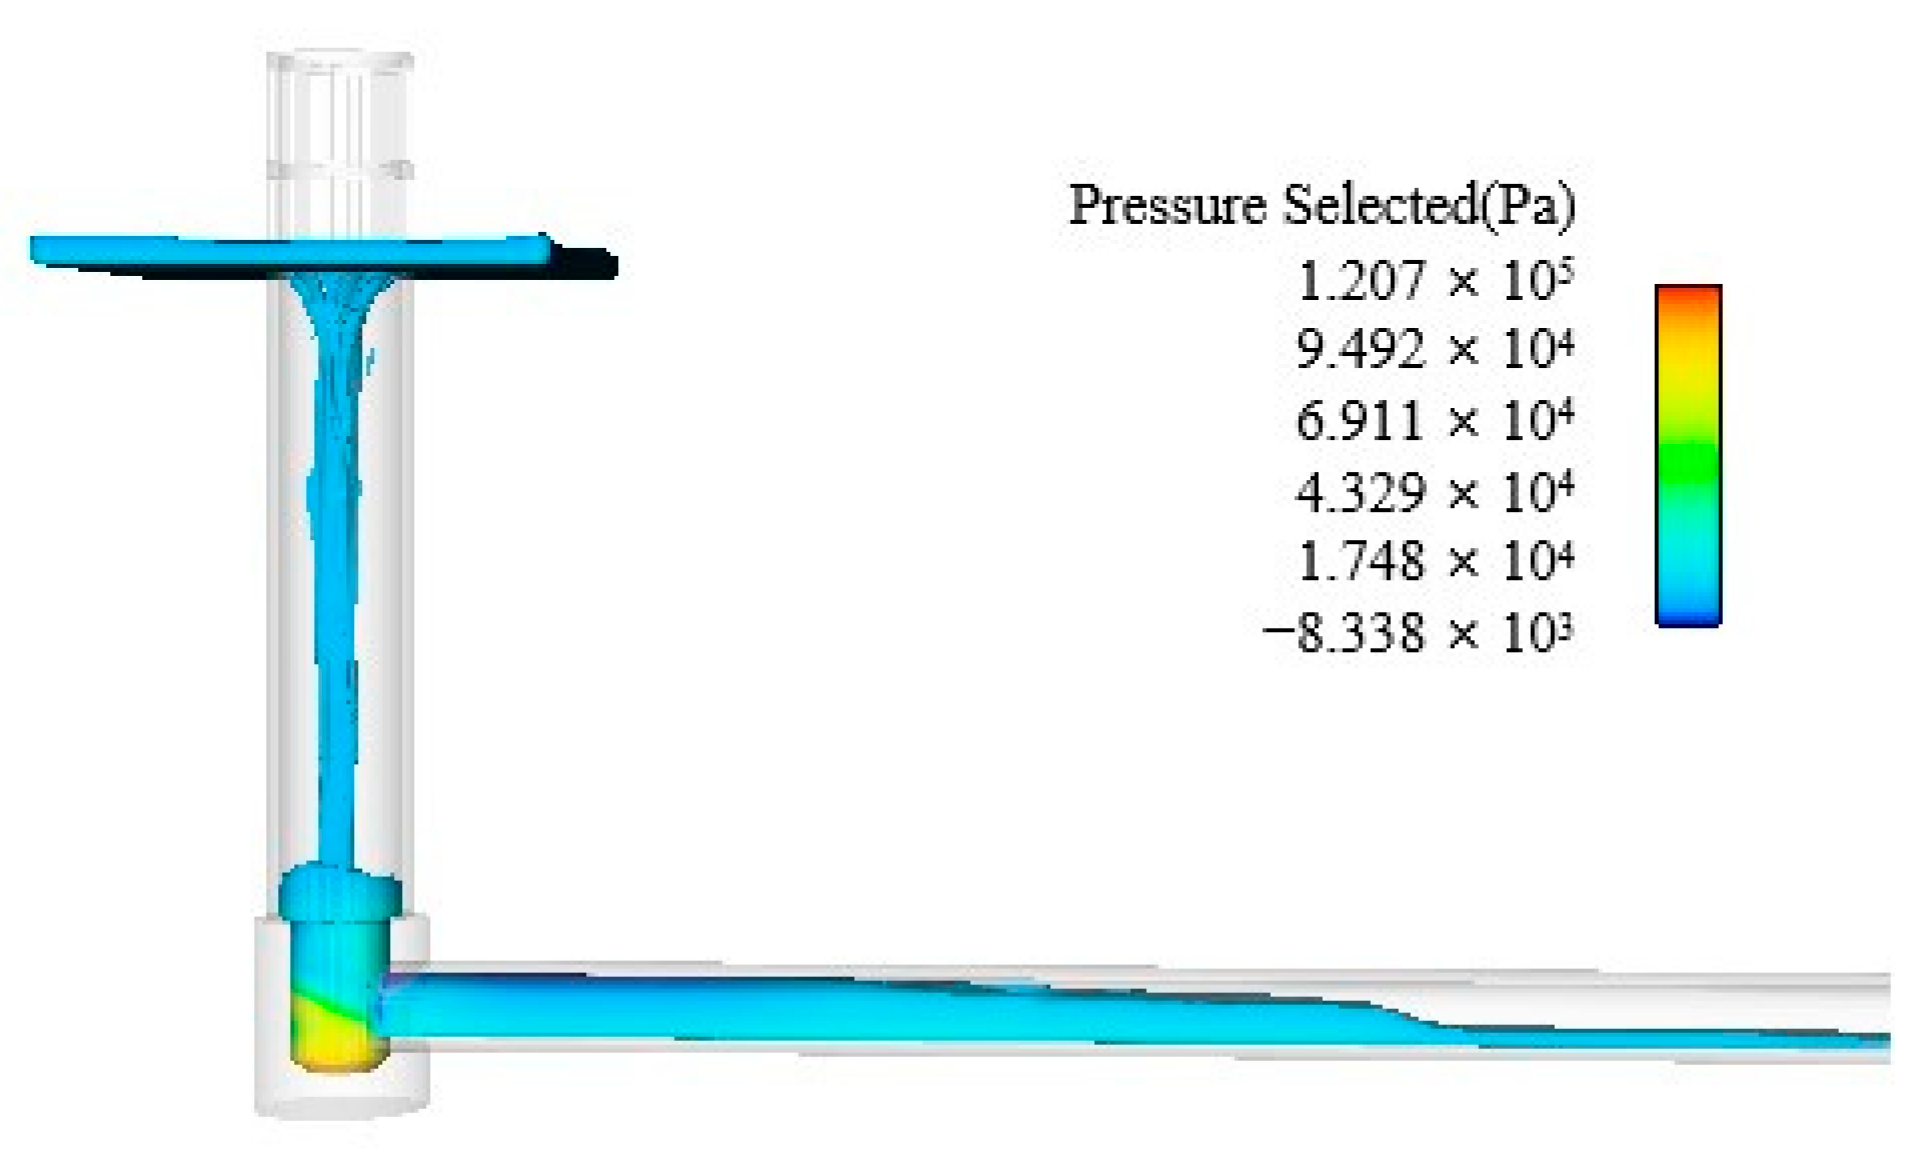
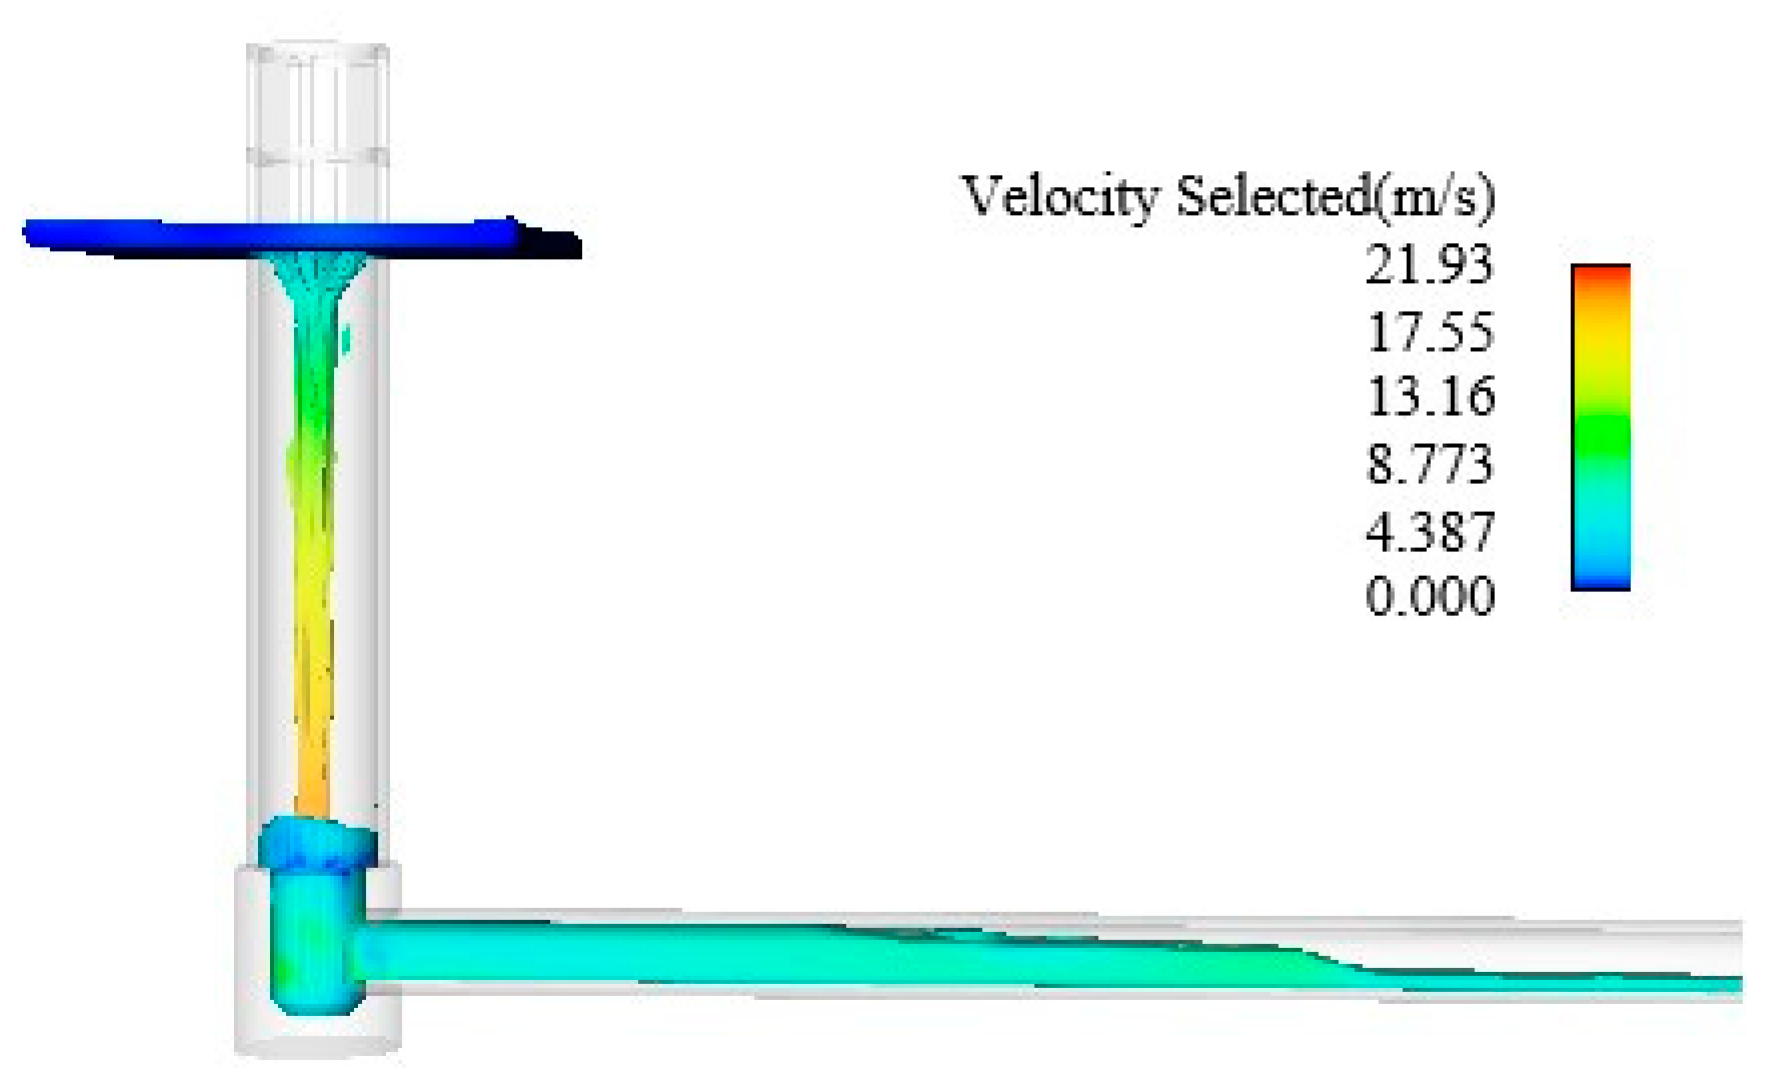
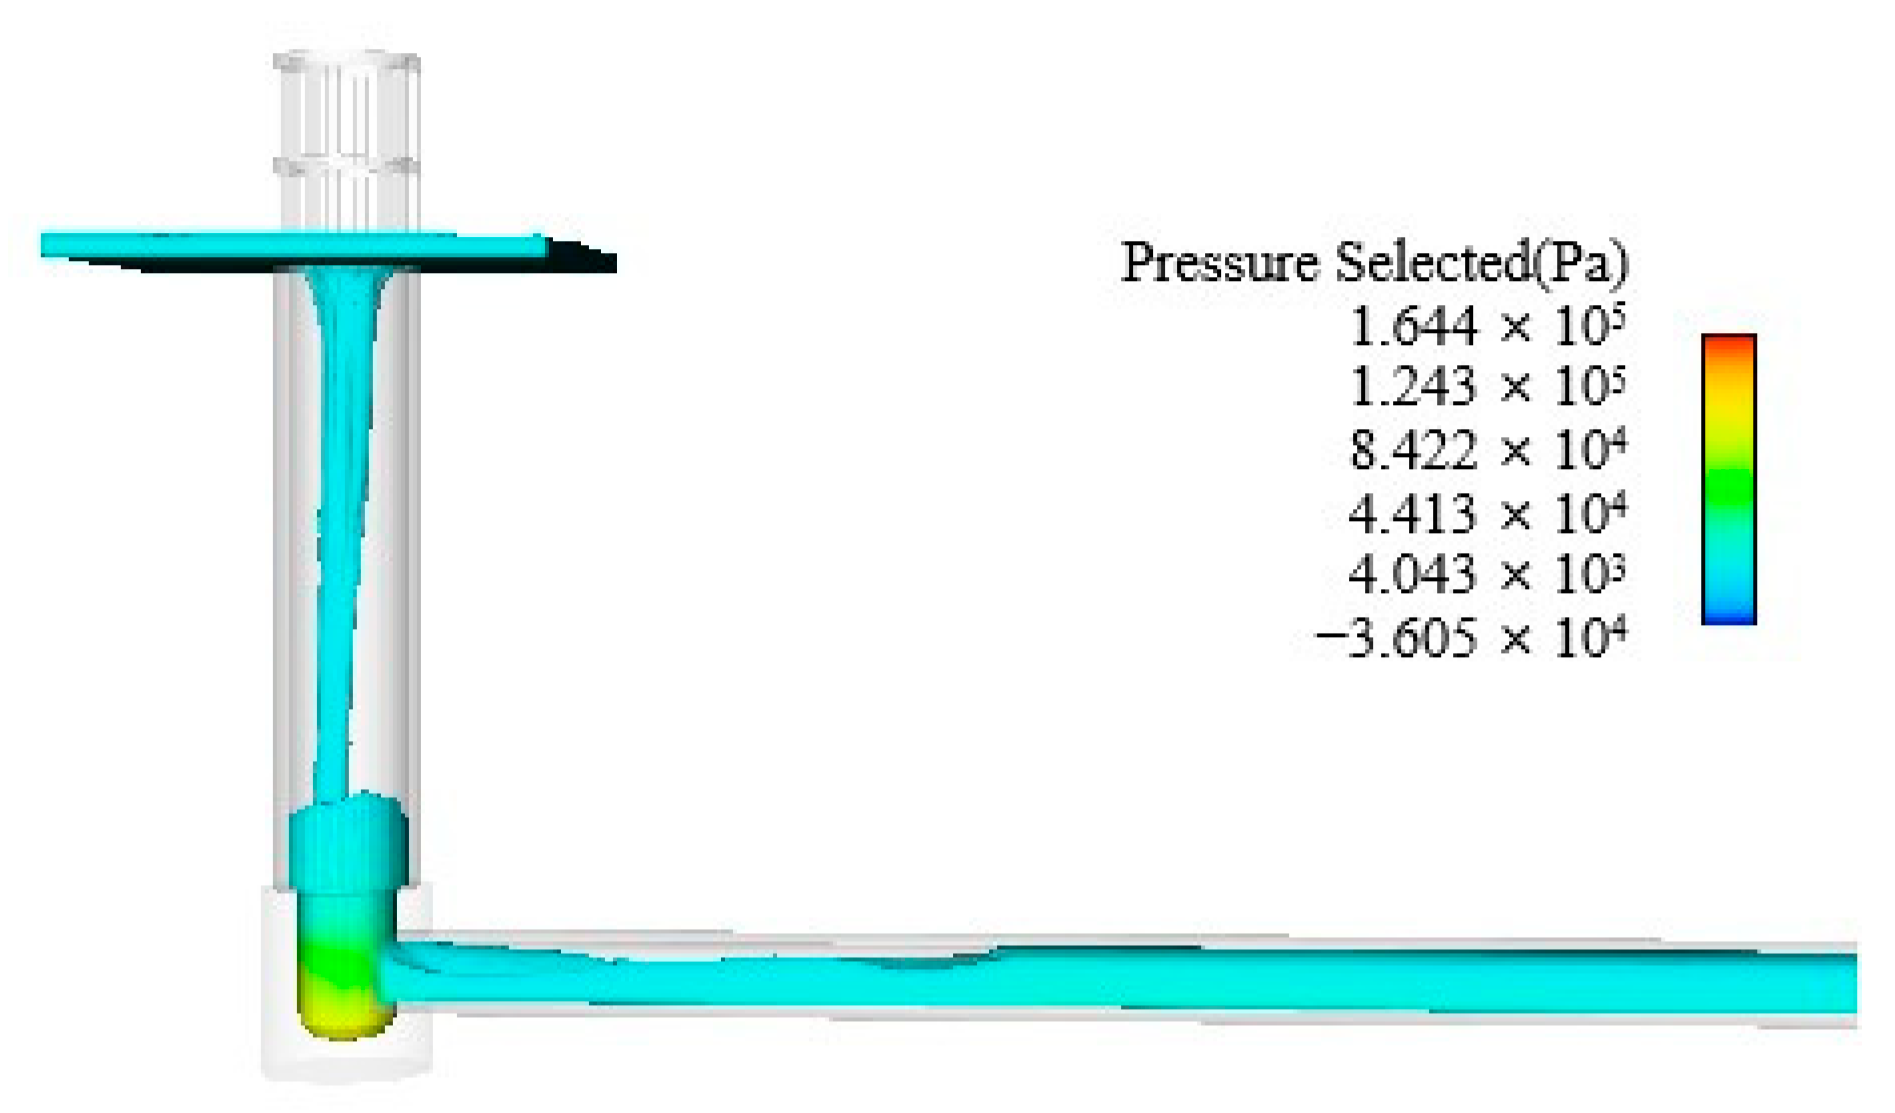
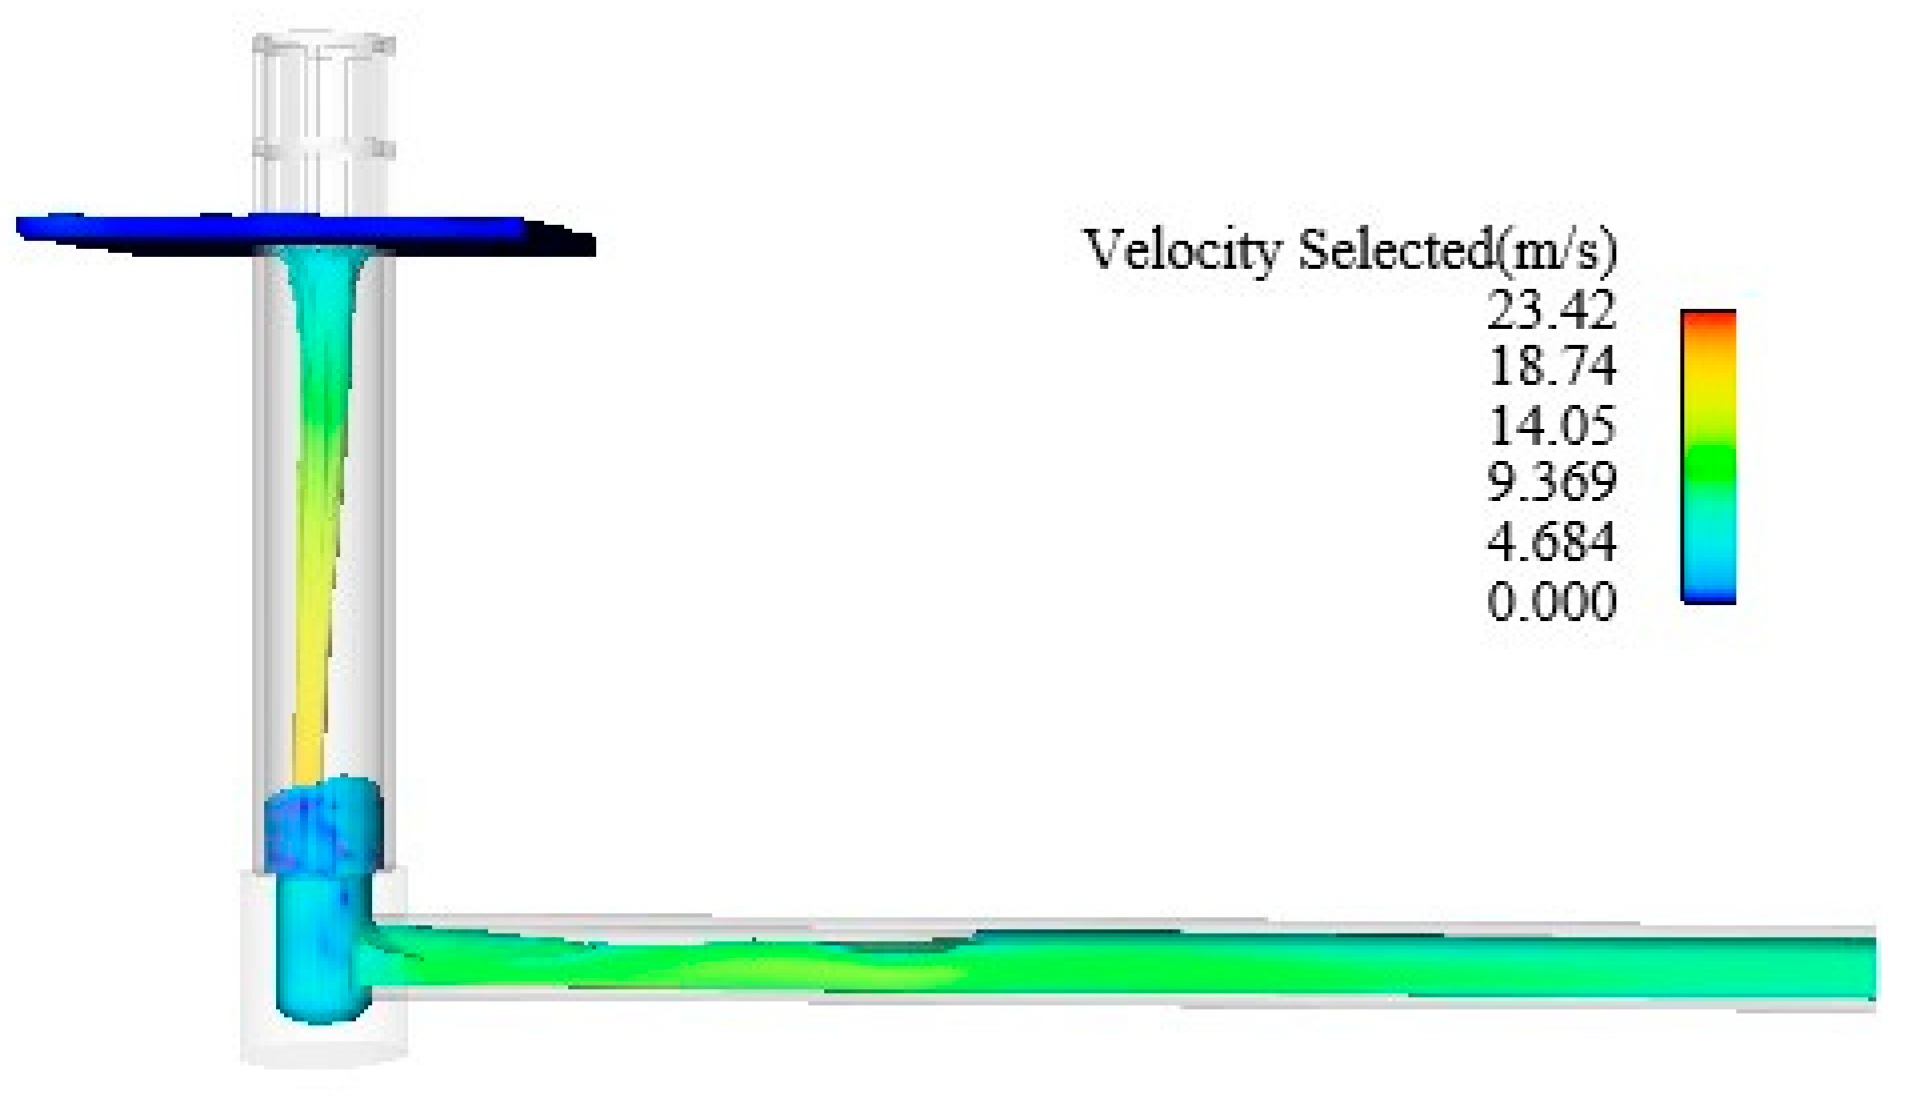
4.2.1. Normal Condition
4.2.2. Flood Condition
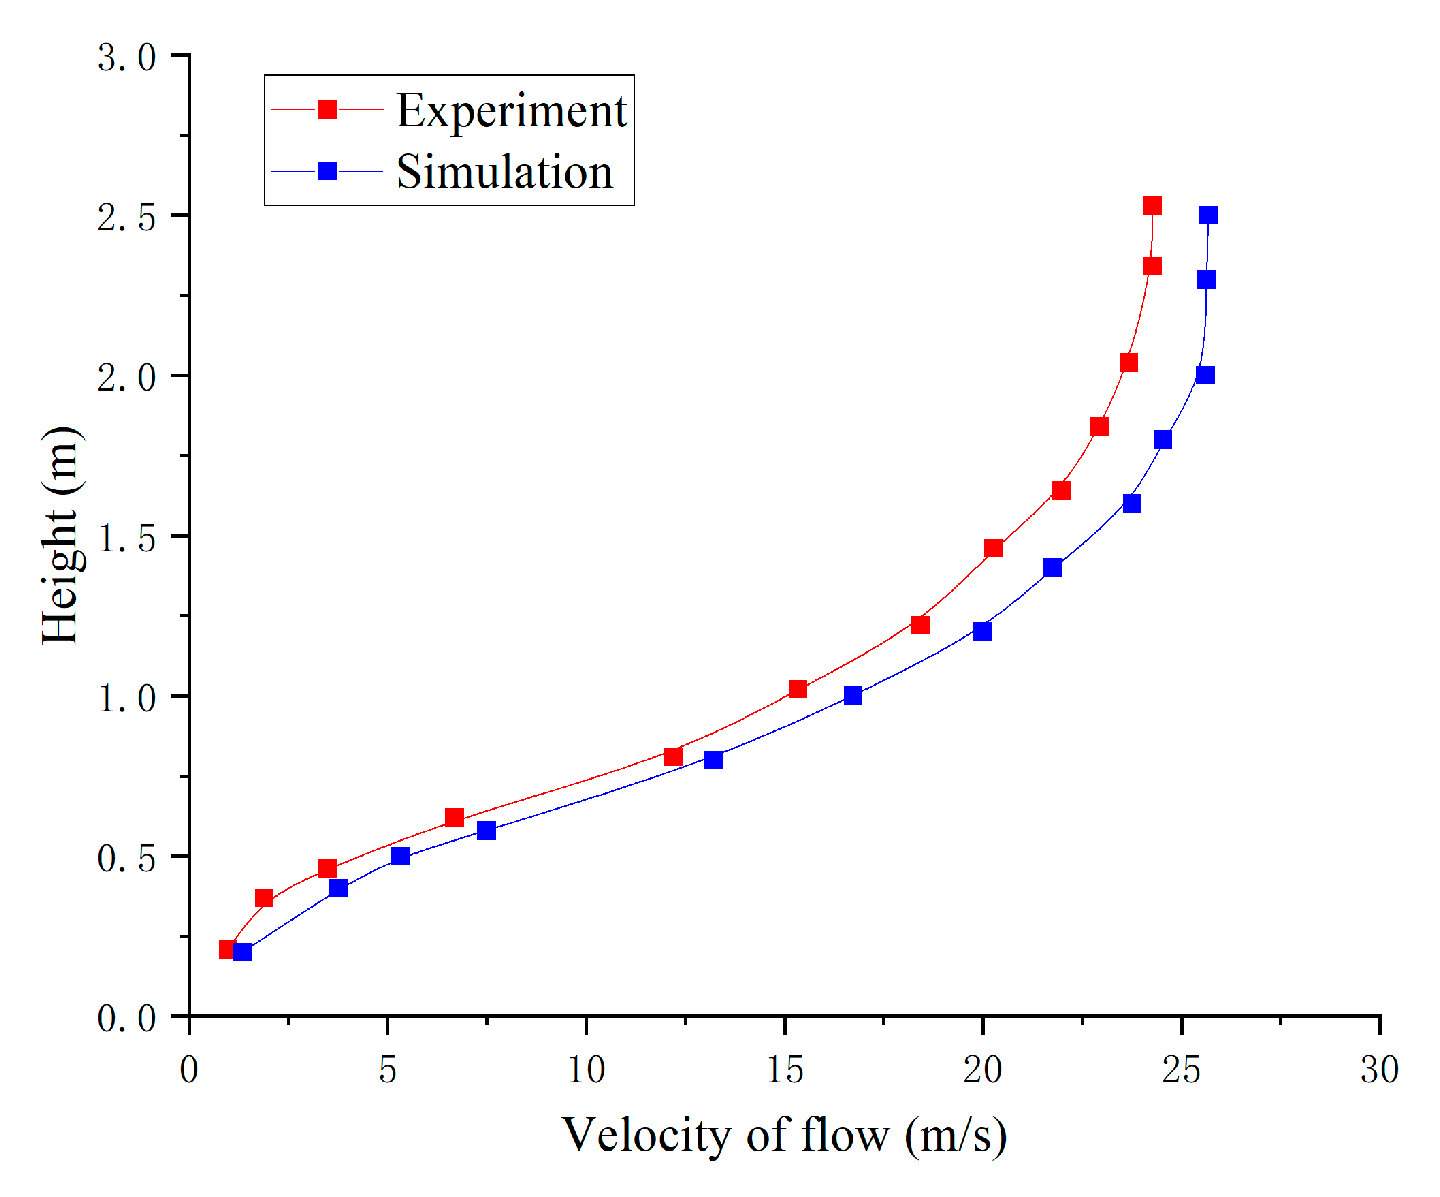
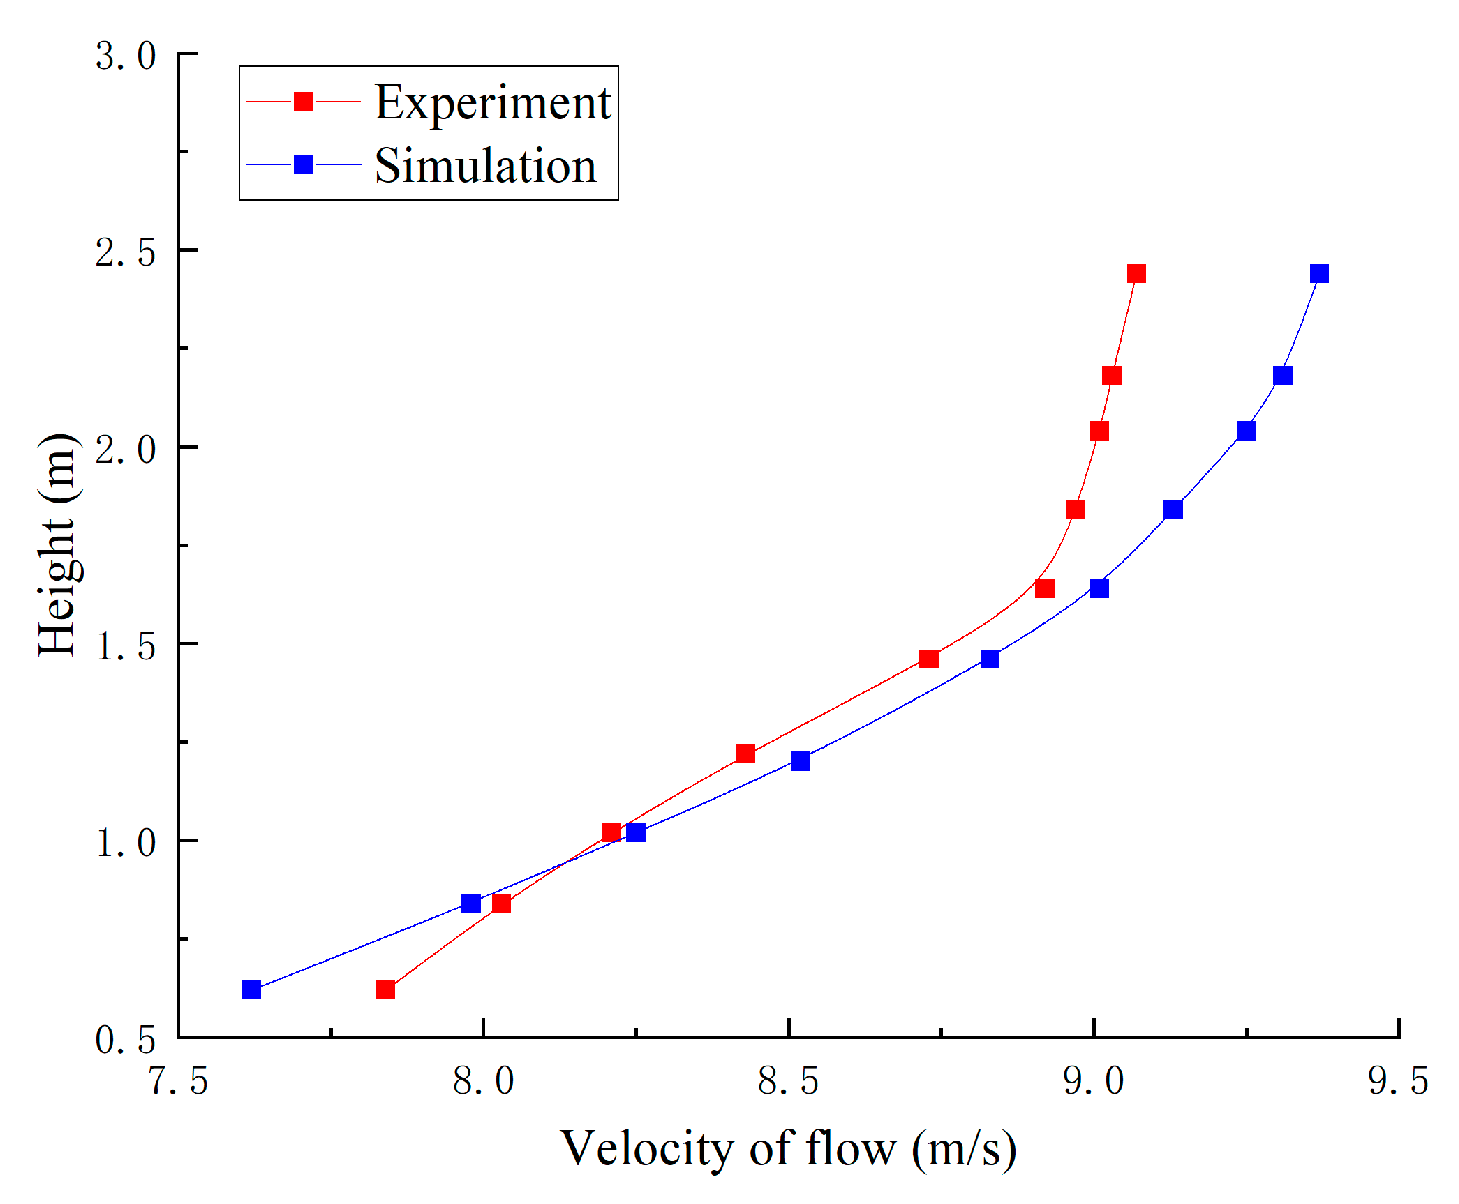
4.2.3. Comparison and Analysis of Test and Simulation Results
5. Conclusions
Author Contributions
Funding
Data Availability Statement
Conflicts of Interest
References
- Liu, L.; Chang, F.; Xiao, C.; Gao, Y.; Cheng, L. Research Progress on Dam-break Flood. J. Yangtze River Sci. Res. Inst. 2016, 33, 29. [Google Scholar]
- Komnitsas, K.; Kontopoulos, A.; Lazar, I.; Cambridge, M. Risk assessment and proposed remedial actions in coastal tailings disposal sites in Romania. Miner. Eng. 1998, 11, 1179–1190. [Google Scholar] [CrossRef]
- Zhou, J.; Yao, S.; Wang, M.; Zhu, Y.; Wang, M.; Chen, D. Review on overtopping failure and flood evolution of earth-rock dams. Adv. Water Sci. 2020, 31, 287–301. [Google Scholar]
- Aureli, F.; Maranzoni, A.; Petaccia, G. Review of historical dam-break events and laboratory tests on real topography for the validation of numerical models. Water 2021, 13, 1968. [Google Scholar] [CrossRef]
- Shakesby, R.A.; Whitlow, J.R. Failure of a mine waste dump in Zimbabwe: Causes and consequences. Environ. Geol. Water Sci. 1991, 18, 143–153. [Google Scholar] [CrossRef]
- Vischer, D.L.; Hager, W.H. Energy dissipators. Int. J. Rock Mech. Min. Sci. Geomech. Abstr. 1995, 32, 403A. [Google Scholar]
- Hager, W.H. Vortex Drop Inlet for Supercritical Approaching Flow. J. Hydraul. Eng. 1990, 116, 1048–1054. [Google Scholar] [CrossRef]
- Liu, Z.P.; Guo, X.L.; Xia, Q.F.; Fu, H.; Wang, T.; Dong, X.L. Experimental and numerical investigation of flow in a newly developed vortex drop shaft spillway. J. Hydraul. Eng. 2018, 144, 04018014. [Google Scholar] [CrossRef]
- Yang, Z.; Yin, J.; Lu, Y.; Liu, Z.; Yang, H.; Xu, G. Three-dimensional flow of a vortex drop shaft spillway with an elliptical tangential inlet. Water 2021, 13, 504. [Google Scholar] [CrossRef]
- Hernández-Perez, V.; Zangana, M.; Kaji, R.; Azzopardi, B. Effect of pipe diameter on pressure drop in vertical two-phase flow. In Proceedings of the 7th International Conference on Multiphase Flow (ICMF), Tampa, FL USA, 30 May–4 June 2010. [Google Scholar]
- Farman Ali, S.; Yeung, H. Experimental study of two-phase air–water flow in large-diameter vertical pipes. Chem. Eng. Commun. 2015, 202, 823–842. [Google Scholar] [CrossRef]
- Hanafizadeh, P.; Eshraghi, J.; Taklifi, A.; Ghanbarzadeh, S. Experimental identification of flow regimes in gas–liquid two phase flow in a vertical pipe. Meccanica 2016, 51, 1771–1782. [Google Scholar] [CrossRef]
- Djillali, K.; Abderrezak, B.; Petrovic, G.A.; Sourenevna, B.E. Discharge capacity of shaft spillway with a polygonal section: A case study of Djedra dam (East Algeria). Water Supply 2021, 21, 1202–1215. [Google Scholar] [CrossRef]
- Mojadami, M.J.; Kabiri-Samani, A.R. Effects of Daisy-Shape Inlet on Free Flow over Shaft Spillways. سّردم نارمع یسدنهم 2016, 16, 202. [Google Scholar]
- Taştan, K.; Yıldırım, N. Effects of intake geometry on the occurrence of a free-surface vortex. J. Hydraul. Eng. 2018, 144, 04018009. [Google Scholar] [CrossRef]
- Shemshi, R.; Kabiri-Samani, A. Swirling flow at vertical shaft spillways with circular piano-key inlets. J. Hydraul. Res. 2017, 55, 248–258. [Google Scholar] [CrossRef]
- Savic, L.; Kapor, R.; Kuzmanovic, V.; Milovanovic, B. Shaft spillway with deflector downstream of vertical bend. In Proceedings of the Institution of Civil Engineers-Water Management; Thomas Telford Ltd.: London, UK, 2014; Volume 167, pp. 269–278. [Google Scholar]
- Aydin, M.C.; Ulu, A.E. Numerical investigation of labyrinth-shaft spillway. Appl. Water Sci. 2023, 13, 89. [Google Scholar] [CrossRef]
- Alkhamis, M.T. Numerical evaluation of discharge coefficient and energy dissipation of flow over a stepped bell moth spillway. J. Eng. Res. 2014, 9, 60–80. [Google Scholar]
- Mirhoseini, S.A.; Kabiri-Samani, A.; Keihanpour, M.; Izadinia, E. Parametric study of flow at circular piano-key inlets over the vertical shaft spillways. J. Hydraul. Res. 2024, 62, 125–143. [Google Scholar] [CrossRef]
- Kazemipour, S.; Kabiri-Samani, A.; Asghari, K. Numerical modelling of flow field at shaft spillways with the marguerite-shaped inlets. Proc. Inst. Civ. Eng.-Water Manag. 2024, 177, 413–424. [Google Scholar] [CrossRef]
- Keihanpour, M.; Kabiri-Samani, A. Effects of modern marguerite-shaped inlets on hydraulic characteristics of swirling flow in shaft spillways. Water Sci. Eng. 2021, 14, 246–256. [Google Scholar] [CrossRef]
- Kabiri-Samani, A.; Keihanpour, M. Hydraulic characteristics of swirling flow at shaft spillways with the marguerite-shaped inlets. J. Hydraul. Res. 2021, 59, 724–738. [Google Scholar] [CrossRef]
- Ghorai, S.; Nigam, K.D.P. CFD modeling of flow profiles and interfacial phenomena in two-phase flow in pipes. Chem. Eng. Process. Process Intensif. 2006, 45, 55–65. [Google Scholar] [CrossRef]
- Gubaidullin, D.A.; Snigerev, B.A. Numerical simulation of the turbulent upward flow of a gas-liquid bubble mixture in a vertical pipe: Comparison with experimental data. High Temp. 2018, 56, 61–69. [Google Scholar] [CrossRef]
- Ebrahimi-Mamaghani, A.; Sotudeh-Gharebagh, R.; Zarghami, R.; Mostoufi, N. Dynamics of two-phase flow in vertical pipes. J. Fluids Struct. 2019, 87, 150–173. [Google Scholar] [CrossRef]
- Evdokimenko, I.A.; Lobanov, P.D.; Pakhomov, M.A.; Terekhov, V.I.; Das, P.K. The Effect of Gas Bubbles on the Flow Structure and Turbulence in a Downward Two-Phase Flow in a Vertical Pipe. J. Eng. Thermophys. 2020, 29, 414–423. [Google Scholar] [CrossRef]
- Aydin, M.C.; Ulu, A.E. Aeration performance of high-head siphon-shaft spillways by CFD models. Appl. Water Sci. 2021, 11, 165. [Google Scholar] [CrossRef]
- Aydin, M.C.; Ulu, A.E. Developing and testing a novel pressure-controlled hydraulic profile for siphon-shaft spillways. Flow Meas. Instrum. 2023, 90, 102332. [Google Scholar] [CrossRef]
- Babaeyan-Koopaei, K.; Valentine, E.M.; Ervine, D.A. Case study on hydraulic performance of Brent Reservoir siphon spillway. J. Hydraul. Eng. 2002, 128, 562–567. [Google Scholar] [CrossRef]
- Yakhot, V.; Orszag, S.A. Renormalization group analysis of turbulence. I. Basic theory. J. Sci. Comput. 1986, 1, 3–51. [Google Scholar] [CrossRef]
- Hirt, C.W.; Nichols, B.D. Volume of fluid (VOF) method for the dynamics of free boundaries. J. Comput. Phys. 1981, 39, 201–225. [Google Scholar] [CrossRef]
- Xiao, Y.Z.; Wang, W.E.; Hu, X.T. The numerical simulation of the hydraulic performance of a portable short-throated slot in the field based on FLOW-3D. J. Agric. Eng. 2016, 32, 55–61. [Google Scholar]


| P | Elevation of the Beach Crest (m) | Flood Protection Height (m) | Flood Protection Storage Capacity (m3/s) | Length of Tailings Pond (m) |
|---|---|---|---|---|
| 0.5% | 626 | 3.0 | 41.75 × 10⁴ | 1150 |
| 0.2% | 647 | 3.0 | 80.77 × 10⁴ | 1257 |
| 0.2% | 674 | 3.0 | 175.82 × 10⁴ | 1688 |
| 0.1% | 687 | 3.0 | 225.45 × 10⁴ | 1756 |
| 0.1% | 696 | 3.0 | 270.82 × 10⁴ | 1865 |
| 0.1% | 738 | 3.0 | 513.33 × 10⁴ | 2160 |
| P | Elevation of the Beach Crest (m) | Normal Water Level (m) | Flood Storage Capacity (m3) | Maximum Underflow (m3/s) | Highest Flood Level (m) | Safe and Ultra-High (m) | Length of Dry Beach (m) |
|---|---|---|---|---|---|---|---|
| 0.5% | 626 | 623 | 105,797 | 11.99 | 623.90 | 2.10 | 210 |
| 0.2% | 647 | 644 | 206,631 | 11.40 | 644.87 | 2.13 | 213 |
| 0.2% | 674 | 671 | 331,816 | 7.59 | 671.64 | 2.36 | 236 |
| 0.1% | 687 | 684 | 366,154 | 7.32 | 684.54 | 2.46 | 246 |
| 0.1% | 696 | 693 | 386,462 | 5.95 | 693.46 | 2.54 | 254 |
| 0.1% | 738 | 735 | 480,249 | 3.11 | 735.30 | 2.70 | 270 |
| Physical Parameter | Flow Velocity | Flow Rate | Roughness | Time | Pressure |
|---|---|---|---|---|---|
| Scale relationship | |||||
| Scale factor of physical parameters | 4.47 | 1788.85 | 1.65 | 4.47 | 20 |
| Number of Drainage Window Layers | H = 0.4 m | H = 0.8 m | H = 1.2 m | H = 1.6 m | H = 2.4 m | |||||
|---|---|---|---|---|---|---|---|---|---|---|
| Flow Rate /(m3/s) | Flow Regime | Flow Rate /(m3/s) | Flow Regime | Flow Rate /(m3/s) | Flow Regime | Flow Rate /(m3/s) | Flow Regime | Flow Rate /(m3/s) | Flow Regime | |
| 1 | 3.17 | Free flow | 9.79 | Partially pressurized flow | 15.62 | Partially pressurized flow | 17.93 | Pressurized flow | 18.66 | Pressurized flow |
| 2 | 3.62 | Free flow | 9.83 | Partially pressurized flow | 15.36 | Partially pressurized flow | 18.25 | Pressurized flow | 19.35 | Pressurized flow |
| 3 | 3.14 | Free flow | 10.12 | Partially pressurized flow | 15.87 | Partially pressurized flow | 18.73 | Pressurized flow | 20.04 | Pressurized flow |
| 4 | 3.24 | Free flow | 11.23 | Partially pressurized flow | 16.23 | Partially pressurized flow | 19.38 | Pressurized flow | 20.72 | Pressurized flow |
| 5 | 3.32 | Free flow | 10.76 | Partially pressurized flow | 16.12 | Partially pressurized flow | 19.84 | Pressurized flow | 21.52 | Pressurized flow |
| 6 | 3.49 | Free flow | 11.13 | Partially pressurized flow | 16.46 | Partially pressurized flow | 20.98 | Pressurized flow | 22.21 | Pressurized flow |
| 7 | 3.54 | Free flow | 11.46 | Partially pressurized flow | 17.18 | Partially pressurized flow | 20.82 | Pressurized flow | 23.24 | Pressurized flow |
| 8 | 3.48 | Free flow | 12.21 | Partially pressurized flow | 18.41 | Partially pressurized flow | 21.98 | Pressurized flow | 24.27 | Pressurized flow |
Disclaimer/Publisher’s Note: The statements, opinions and data contained in all publications are solely those of the individual author(s) and contributor(s) and not of MDPI and/or the editor(s). MDPI and/or the editor(s) disclaim responsibility for any injury to people or property resulting from any ideas, methods, instructions or products referred to in the content. |
© 2025 by the authors. Licensee MDPI, Basel, Switzerland. This article is an open access article distributed under the terms and conditions of the Creative Commons Attribution (CC BY) license (https://creativecommons.org/licenses/by/4.0/).
Share and Cite
Liu, X.; Wang, G.; Zhao, B.; Liu, G.; Sang, Y. Discharge Capacity of the Flood Discharge Shaft in a Tailings Reservoir: An Experimental and Numerical Study. Water 2025, 17, 606. https://doi.org/10.3390/w17050606
Liu X, Wang G, Zhao B, Liu G, Sang Y. Discharge Capacity of the Flood Discharge Shaft in a Tailings Reservoir: An Experimental and Numerical Study. Water. 2025; 17(5):606. https://doi.org/10.3390/w17050606
Chicago/Turabian StyleLiu, Xinjie, Guangjin Wang, Bing Zhao, Gaolin Liu, and Yongshuai Sang. 2025. "Discharge Capacity of the Flood Discharge Shaft in a Tailings Reservoir: An Experimental and Numerical Study" Water 17, no. 5: 606. https://doi.org/10.3390/w17050606
APA StyleLiu, X., Wang, G., Zhao, B., Liu, G., & Sang, Y. (2025). Discharge Capacity of the Flood Discharge Shaft in a Tailings Reservoir: An Experimental and Numerical Study. Water, 17(5), 606. https://doi.org/10.3390/w17050606