
CFD Study of Submarine Hydrodynamics near the Free Surface in Snorkel Conditions


Abstract
1. Introduction
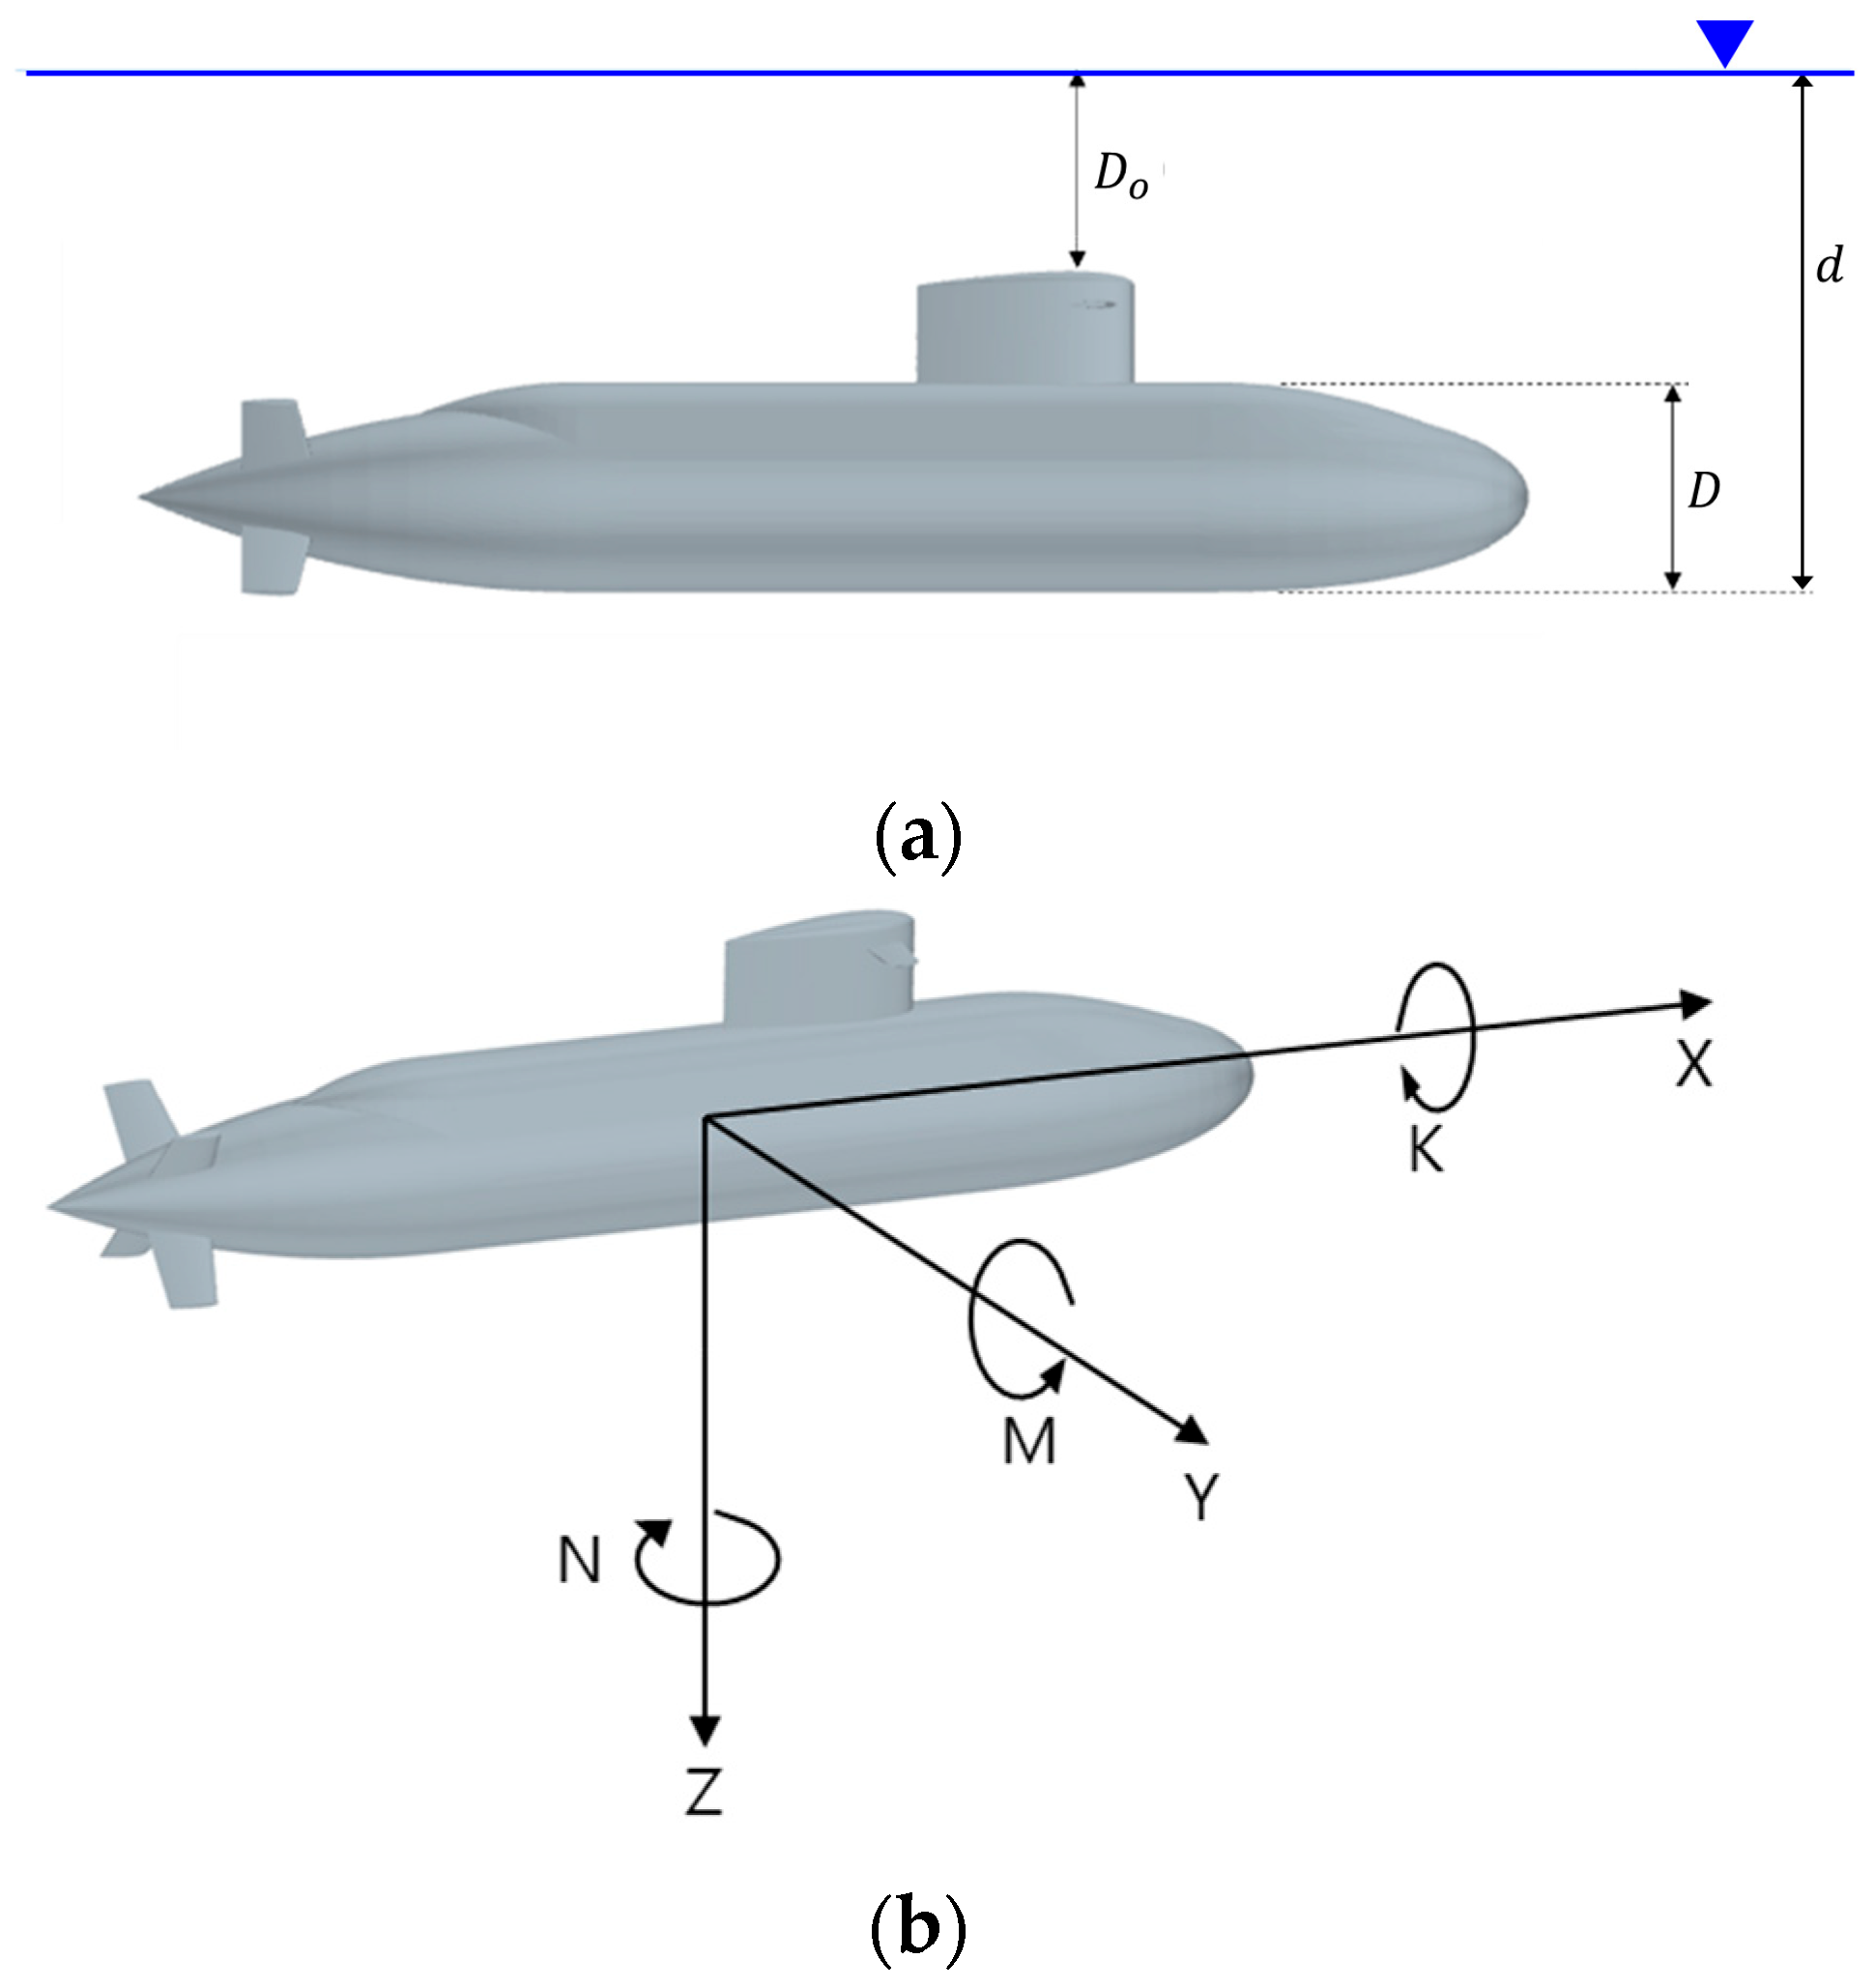
2. Problem Description
3. Computational Methods
3.1. Governing Equations and Numerical Method
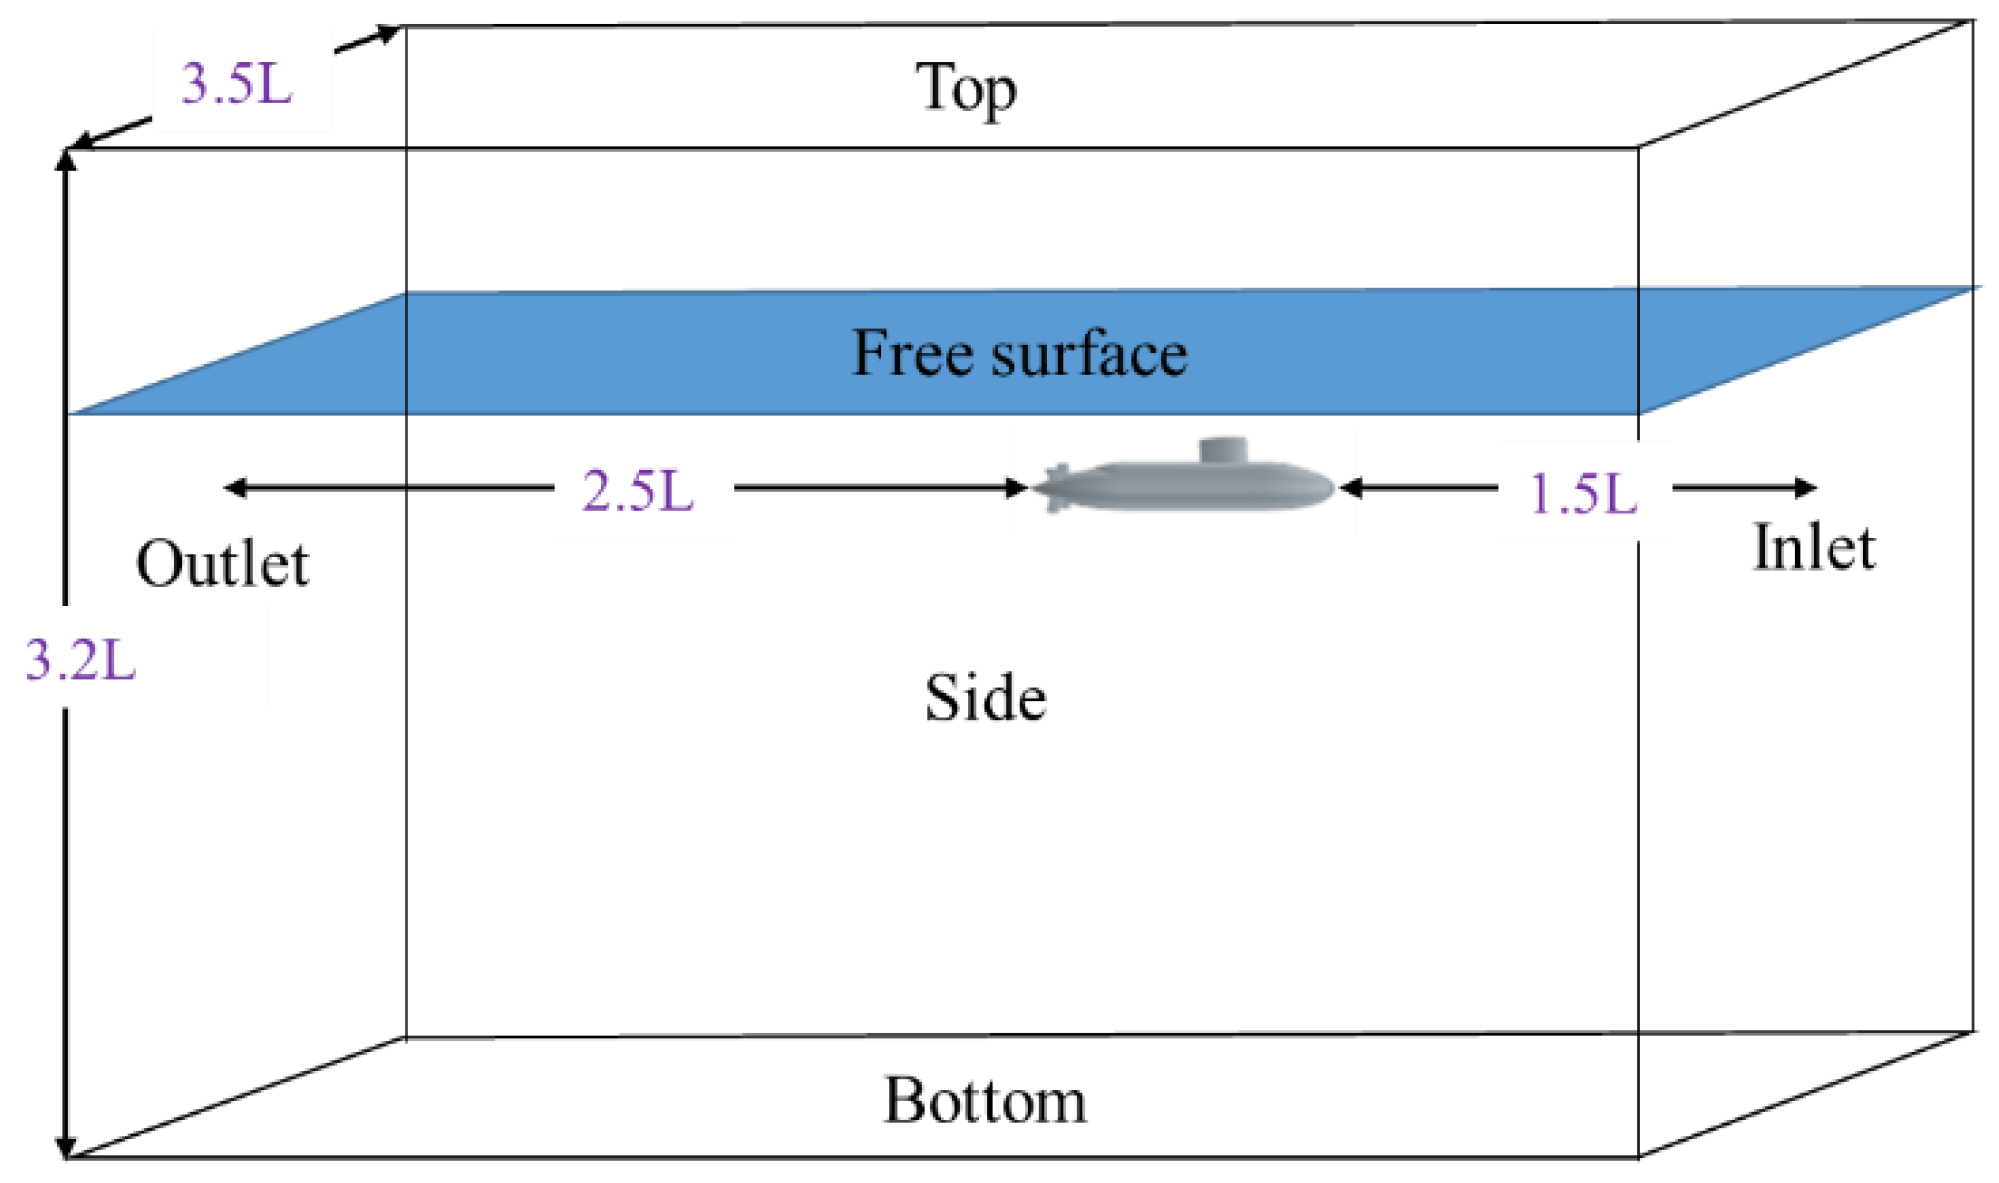
3.2. Boundary Conditions and Domain Extent
3.3. Grid Convergence Test
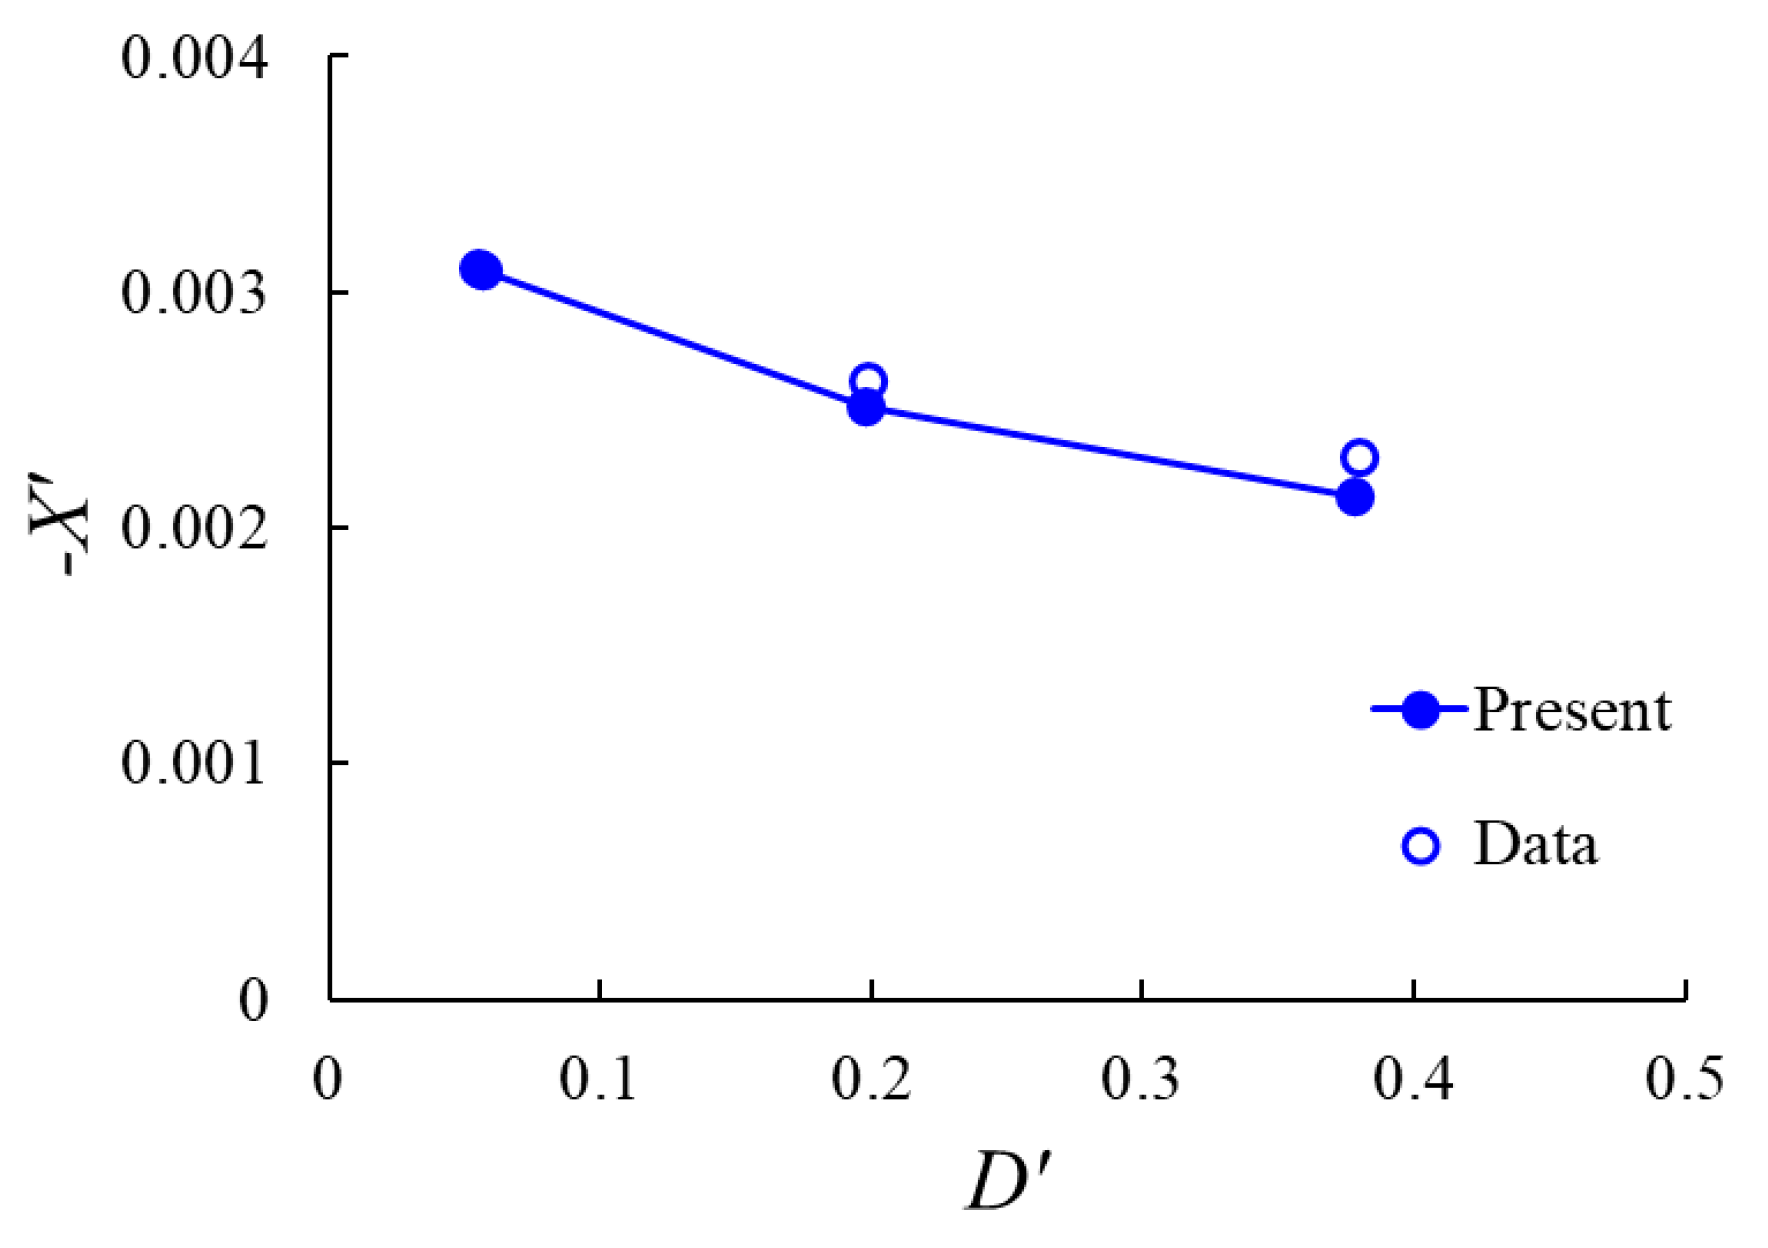
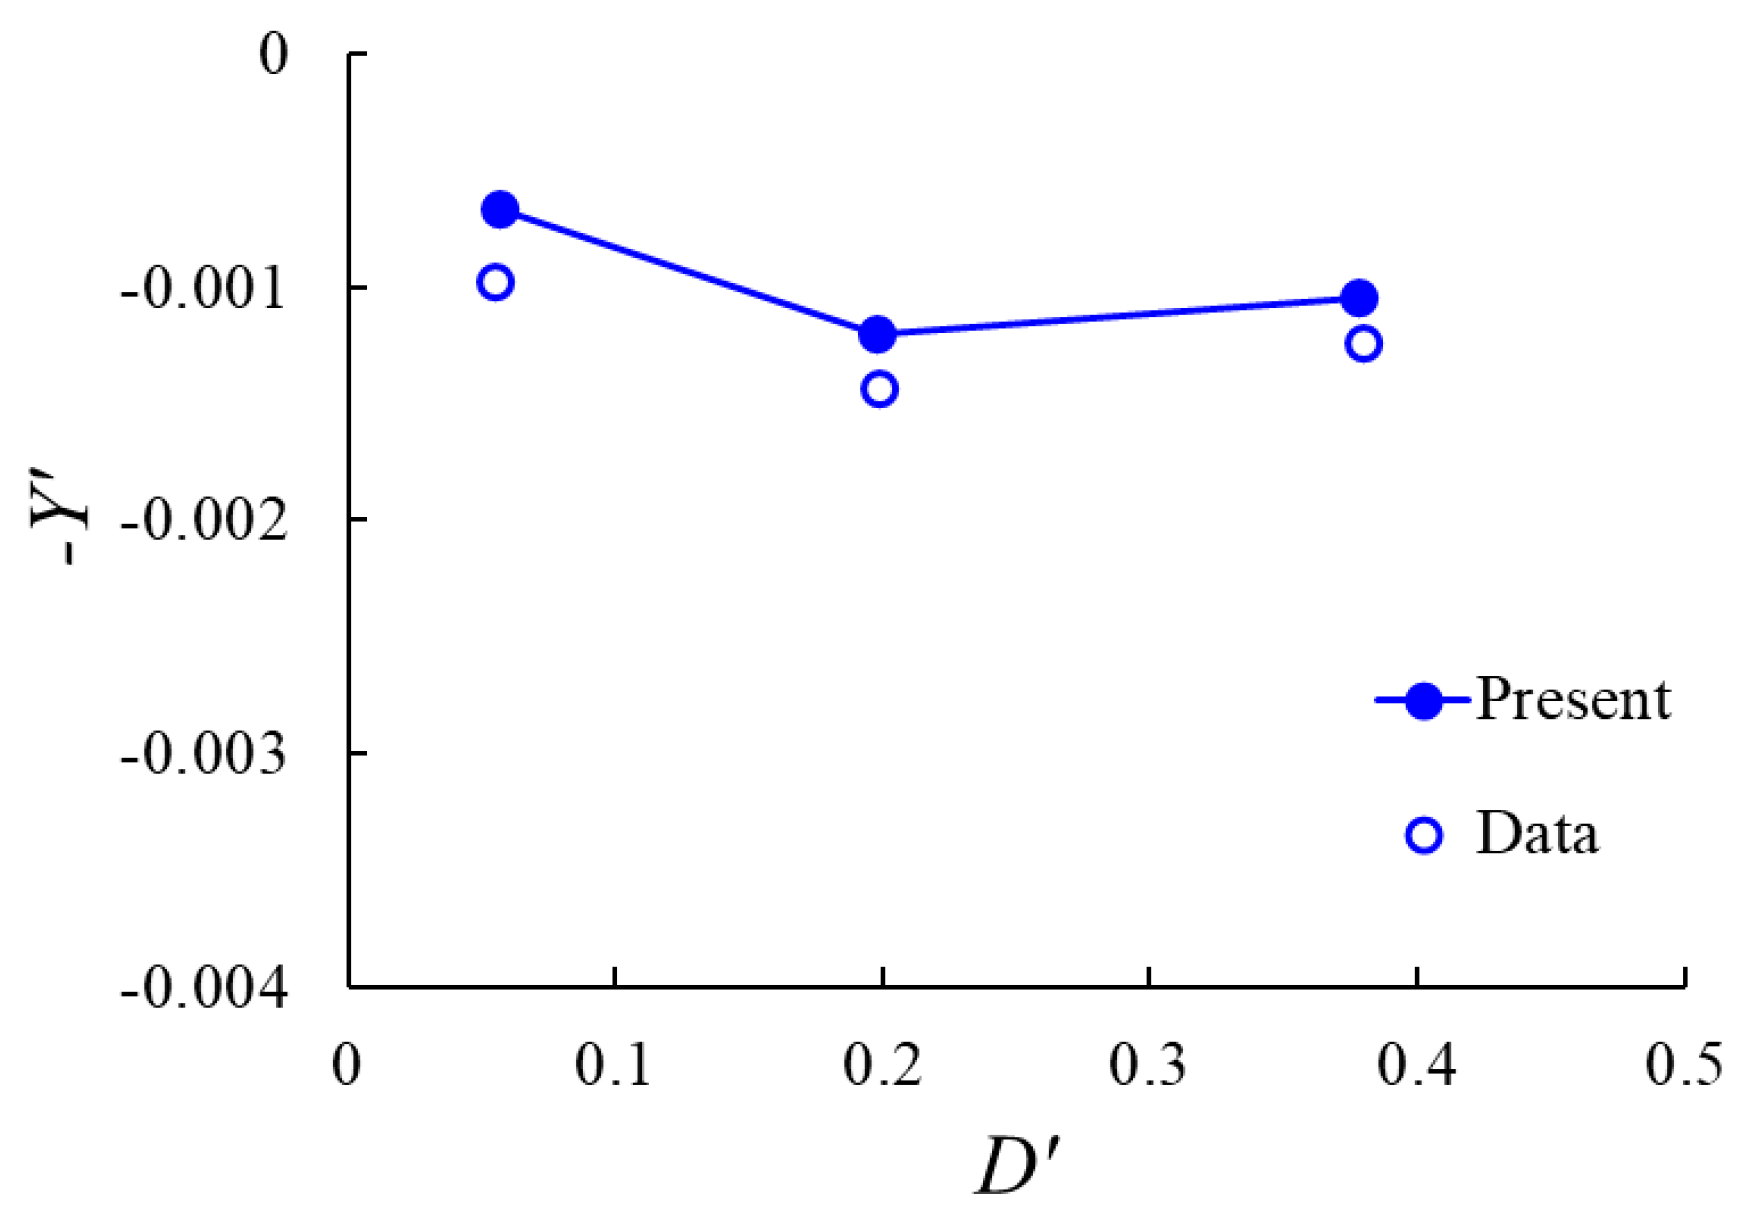
4. Results and Discussion
5. Concluding Remarks
Author Contributions
Funding
Data Availability Statement
Conflicts of Interest
Nomenclature
| Symbols | |
| depth below an equivalent free surface | |
| Maximum diameter of the submarine’s hull | |
| Sail depth relative to the same reference surface. | |
| Non-dimensional sail depth | |
| Froude number | |
| Non-dimensional depth | |
| Overall length | |
| Longitudinal center of gravity | |
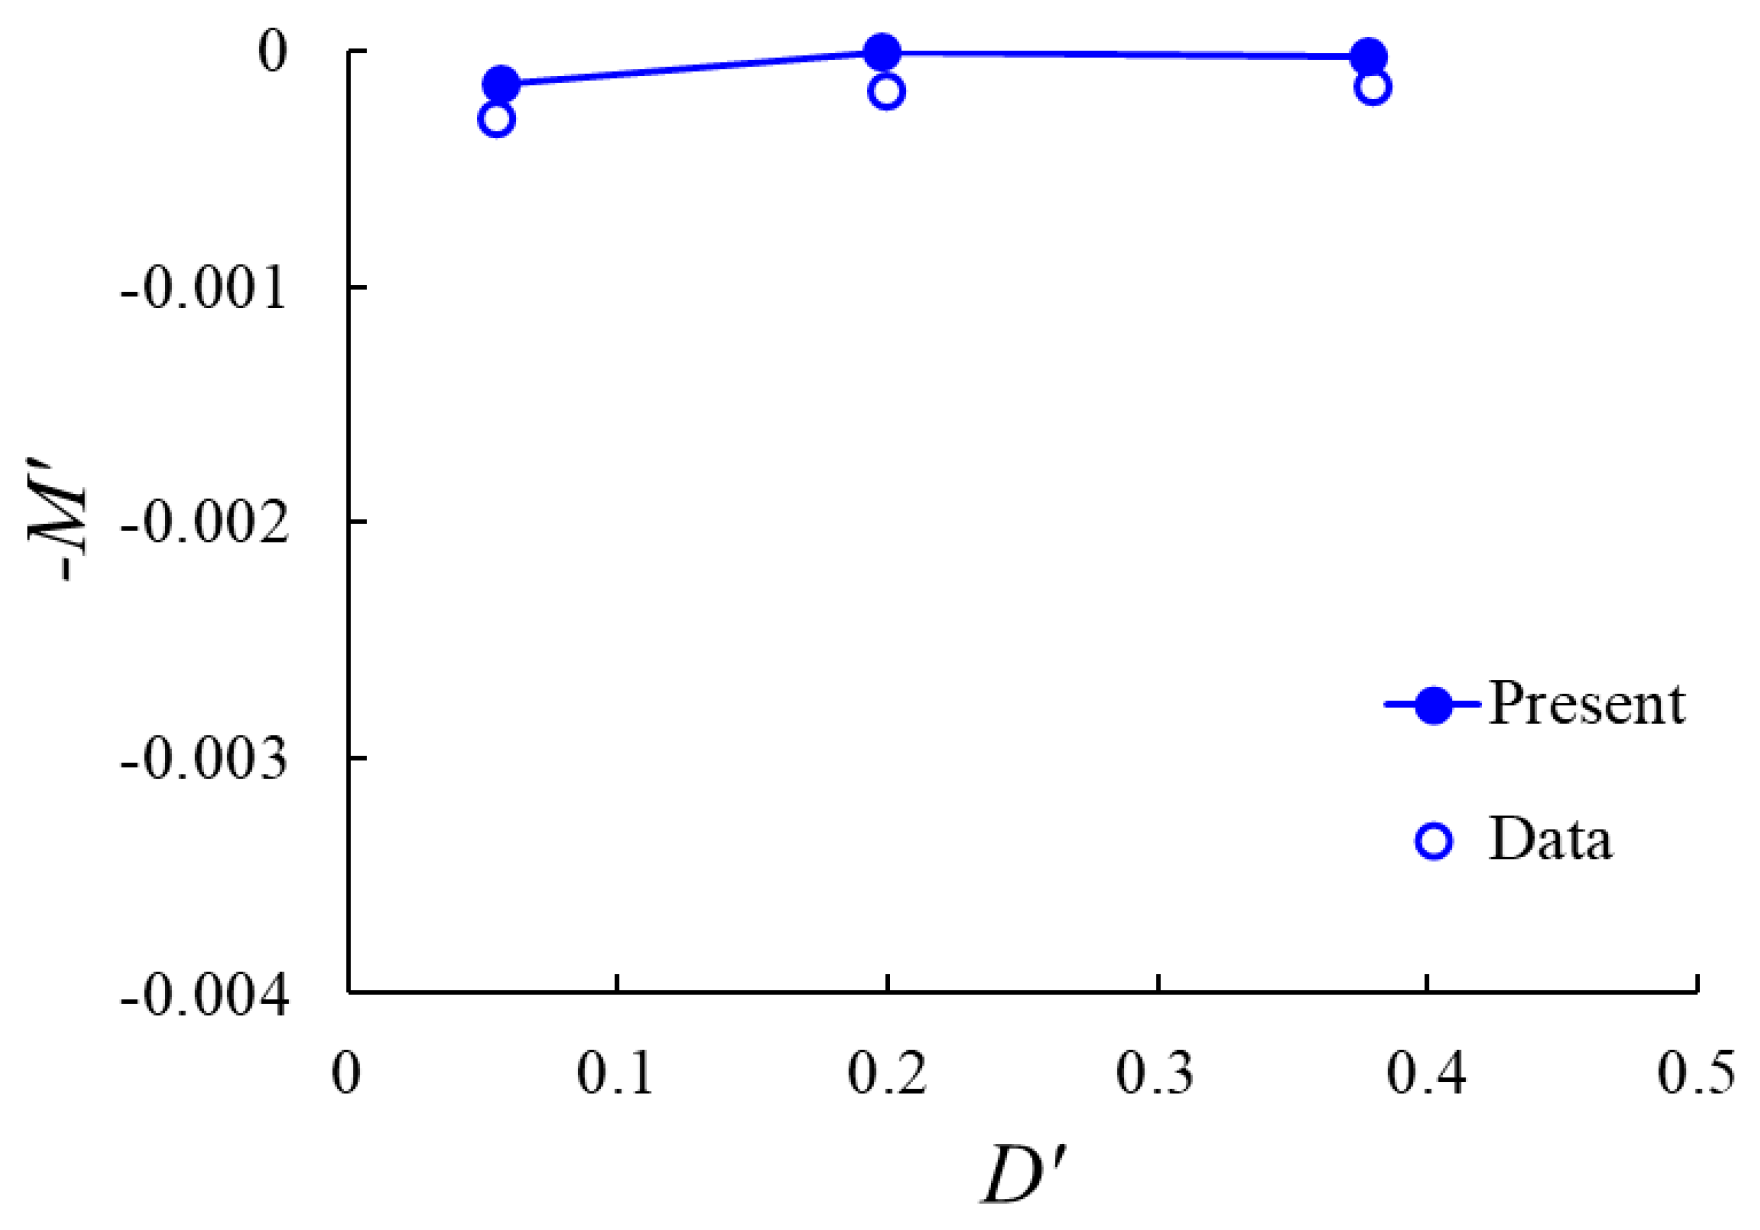
| pitch moment | |
| Non-dimensional pitch moment | |
| Refinement ratio | |
| Grid convergence ratio | |
| Solution valuable | |
| Velocity | |
| Surge force | |
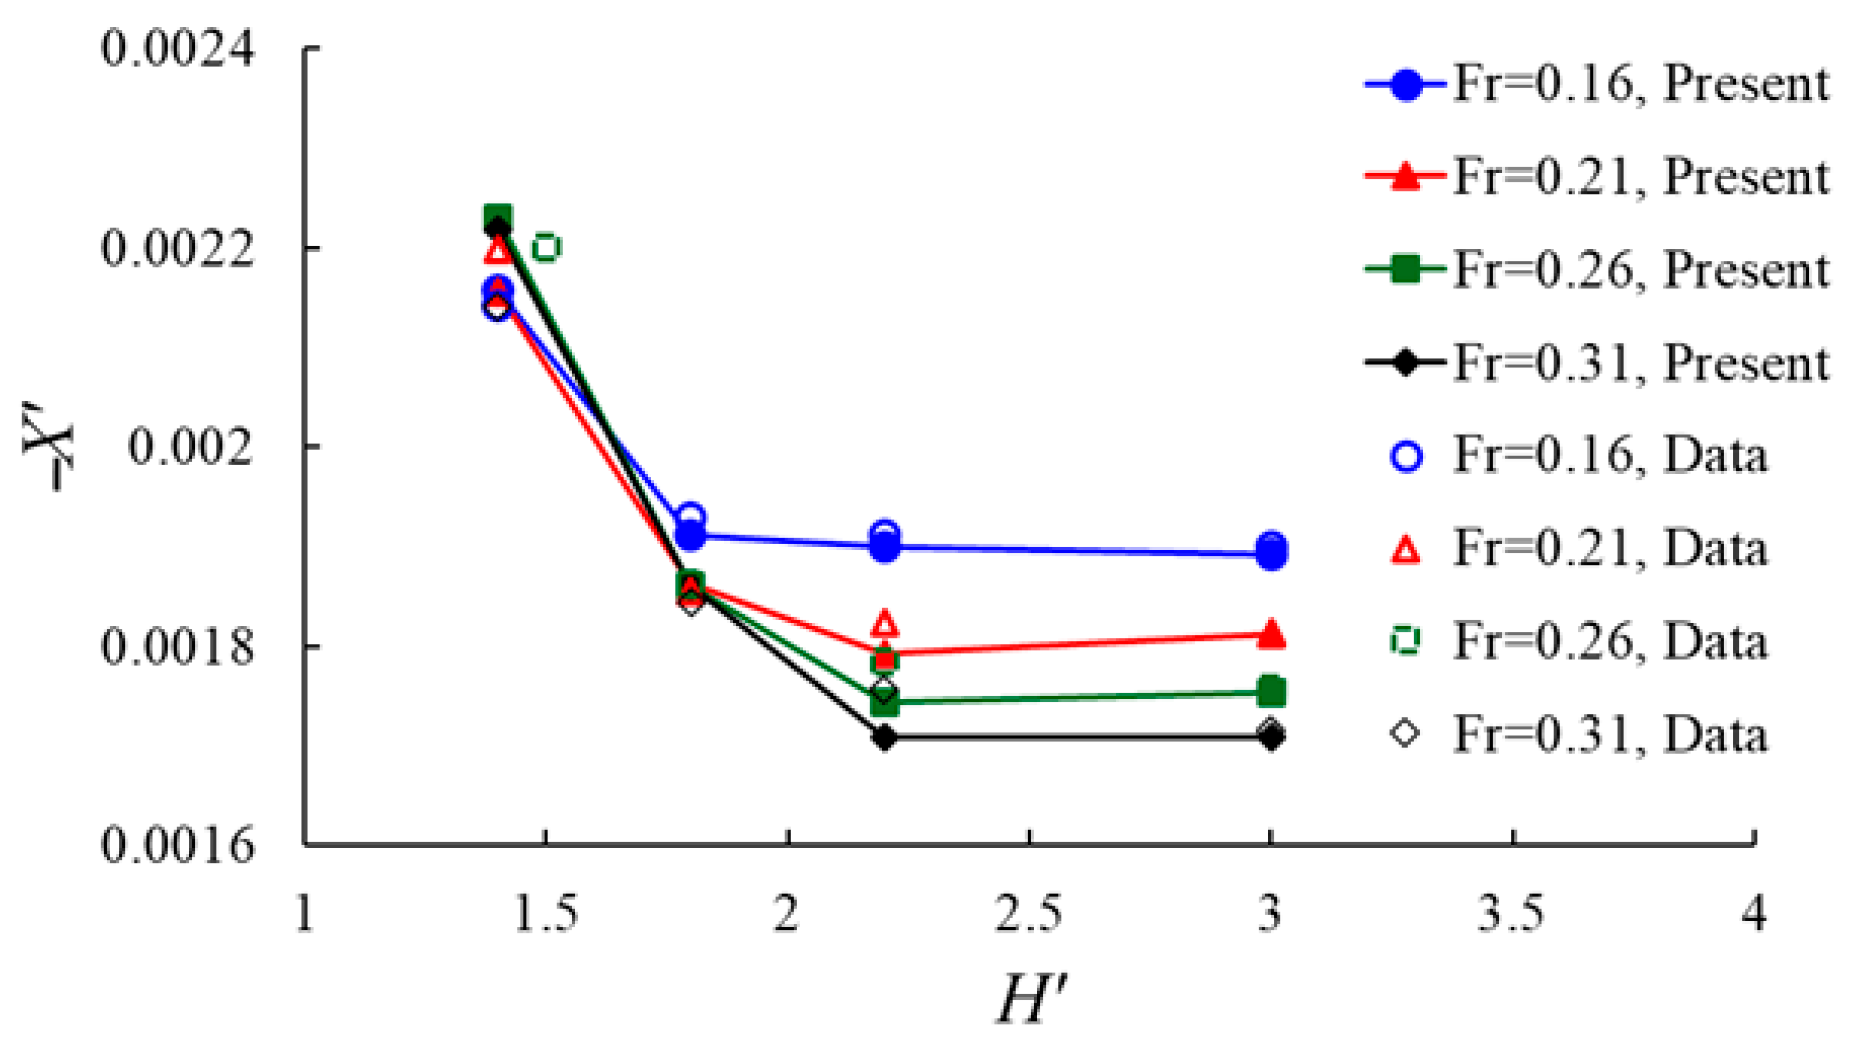
| Non-dimensional surge force | |
| Heave force | |
| Non-dimensional heave forces | |
| Greek | |
| Volume fraction | |
| Density | |
| Dynamic viscosity |
References
- Krishna, G.D.; Krishnankutty, P. Roll motion control of submarines at free surface using juxta-positioned stern planes. In Proceedings of the International Seminar on Current and Future Challenges in Design and Construction of Underwater Vehicles, New Delhi, India, 22 November 2016. [Google Scholar]
- Renilson, M. Submarine Hydrodynamics; Springer International Publishing AG: Cham, Switzerland, 2015. [Google Scholar]
- Park, J.Y.; Kim, N.; Yoon, H.K.; Cho, H. Adaptive depth controller design for a submerged body moving near free surface. Appl. Ocean Res. 2016, 58, 83–94. [Google Scholar] [CrossRef]
- Jung, S.; Brizzolara, S.; Woolsey, C.A. Parameter computation for a Lagrangian mechanical system model of a submerged vessel moving near a free surface. Ocean Eng. 2021, 230, 108988. [Google Scholar] [CrossRef]
- Sarraf, S.; Abbaspour, M.; Dolatshahi, K.M.; Sarraf, S.; Sani, M. Experimental and numerical investigation of squat submarines hydrodynamic performances. Ocean Eng. 2022, 266, 112849. [Google Scholar] [CrossRef]
- Kwon, C.S.; Kim, D.J.; Kim, K.H.; Kim, Y.G. A captive model test on hydrodynamic force and natural level flight of BB2 submarine in straight operation at near free surface with different depths. J. Soc. Nav. Archit. Korea 2022, 59, 288–295. [Google Scholar] [CrossRef]
- Kim, D.J.; Kwon, C.S.; Lee, Y.Y.; Kim, Y.G.; Yun, K. Practical 6-DoF manoeuvring simulation of a BB2 submarine near the free surface. Ocean Eng. 2024, 312, 119334. [Google Scholar] [CrossRef]
- Griffin, M. Numerical Prediction of the Maneuvering Characteristics of Submarines Operating near the Free Surface. Ph.D. Thesis, MIT, Cambridge, MA, USA, 2002. [Google Scholar]
- Boger, D.A.; Dreyer, J.J. Prediction of Hydrodynamic Forces and Moments for Underwater Vehicles Using Overset Grids. In Proceedings of the 44th AIAA Aerospace Science Meeting and Exhibition, Reno, NV, USA, 9–12 January 2006. [Google Scholar]
- Conway, A.S.T.; Valentinis, F.; Seil, G. Characterization of suction effects on a submarine body operating near the free surface. In Proceedings of the 21st Australasian Fluid Mechanics Conference, Adelaide, WA, Australia, 10–13 December 2018. [Google Scholar]
- Amiri, M.M.; Esperança, P.T.; Vitola, M.A.; Sphaier, S.H. How does the free surface affect the hydrodynamics of a shallowly submerged submarine? Appl. Ocean Res. 2018, 76, 34–50. [Google Scholar] [CrossRef]
- Vasileva, A.; Kyulevcheliev, S. Numerical investigation of the free surface effects on underwater vehicle resistance. In Proceedings of the Fourteenth International Conference on Marine Science and Technologies, Varna, Bulgaria, 10–12 October 2018; pp. 10–12. [Google Scholar]
- Courdier, M.; Leong, Z.; Duffy, J.; Binns, J.; Conway, A. Numerical validation of the hydrodynamic drag of a surfaced and fully appended underwater vehicle. Int. J. Marit. Eng. 2002, 164, 17–26. [Google Scholar] [CrossRef]
- Carrica, P.M.; Kim, Y.; Martin, J.E. Near-surface self-propulsion of a generic submarine in calm water and waves. Ocean Eng. 2019, 183, 87–105. [Google Scholar] [CrossRef]
- Wang, L.; Martin, J.E.; Felli, M.; Carrica, P.M. Experiments and CFd for the propeller wake of a generic submarine operating near the surface. Ocean Eng. 2020, 206, 107304. [Google Scholar] [CrossRef]
- Dong, K.; Wang, X.; Zhang, D.; Liu, L.; Feng, D. CFD research on the hydrodynamic preformance of submarine sailing near the free surface with long-crested waves. J. Mar. Sci. Eng. 2022, 10, 90. [Google Scholar] [CrossRef]
- Dogrul, A. Numerical prediction of scale effects on the propulsion performance of Joubert BB2 submarine. Brodogradnja 2022, 73, 17–42. [Google Scholar]
- Cao, L.S.; Gao, G.; Guo, E.K.; Wan, D.C. Hydrodynamic performances and wakes induced by a generic submarine operating near the free surface in continuously stratified fluid. J. Hydrodyn. 2023, 35, 396–406. [Google Scholar] [CrossRef]
- Li, L.; Zhao, B.; Sun, B. Surface waves induced by a moving submarine model. J. Mar. Sci. Appl. 2023, 22, 84–91. [Google Scholar] [CrossRef]
- Guo, E.; Wang, Y.; Cao, L.; Wan, D. Numerical investigation on steady turning motion of a generic submarine near the free surface. Ocean Eng. 2024, 313, 119375. [Google Scholar] [CrossRef]
- Ghafoorian, F.; Enayati, E.; Mirmotahari, S.R.; Wan, H. Self-Starting Improvement and Performance Enhancement in Darrieus VAWTs Using Auxiliary Blades and Deflectors. Machines 2024, 12, 806. [Google Scholar] [CrossRef]
- Ghafoorian, F.; Rad, S.H.; Moghimi, M. Enhancing Self-Starting Capability and Efficiency of Hybrid Darrieus–Savonius Vertical Axis Wind Turbines with a Dual-Shaft Configuration. Machines 2025, 13, 87. [Google Scholar] [CrossRef]
- Liu, B.; Park, S. Effect of wavelength on turbine performances and vortical wake flows for various submersion depths. J. Mar. Sci. Eng. 2024, 12, 560. [Google Scholar] [CrossRef]
- Liu, T.; Diao, F.; Yao, W.; Likeufack Mdemaya, F.A.; Xu, G. Study on Motion Response Prediction of Offshore Platform Based on Multi-Sea State Samples and EMD Algorithm. Water 2024, 16, 3441. [Google Scholar] [CrossRef]
- Wu, C.; Jia, X.; Xu, T.; Zhang, W. Numerical Simulation of the Hydrodynamic Behavior of an Offshore Platform Supported by a Jacket Structure in Waves. Water 2024, 16, 3707. [Google Scholar] [CrossRef]
- ITTC. ITTC-Recommended Procedures and Guidelines-Guideline on Use of RANS Tools for Manoeuvring Prediction, ITTC Quality System Manual. 2017. Available online: https://www.ittc.info/media/8173/75-03-04-01.pdf (accessed on 1 January 2024).
- Jeon, W.; Park, S.; Cho, S.K. Moored motion prediction of a semi-submersible offshore platform in waves using a OpenFOAM and MoorDyn coupled solver. Int. J. Nav. Archit. Ocean Eng. 2023, 15, 100544. [Google Scholar] [CrossRef]
- Celik, I.B.; Ghi, U.; Roache, P.J.; Freitas, C.J.; Coleman, H.; Raad, P.E. Procedure for estimation and reporting of uncertainty due to discretization in CFD applications. J. Fluids Eng. 2008, 130, 078001. [Google Scholar]


| Item | Full Scale | Model Scale |
|---|---|---|
| Scale ratio | 1 | 1/15 |
| [m] | 70.2 | 4.68 |
| [m] | 9.6 | 0.64 |
| [m] | 10.6 | 0.707 |
| Displacement [m3] | 4365.2 | 1.293 |
| [m] | 32.29 | 2.153 |
| [m] | 0.5 | 0.033 |
| Index | Layer Number | Layer Expansion Ratio | Mean y+ | Maximum Skewness | Minimum Skewness | Normalized Grid Size (m) | Number of Grid (×106) |
|---|---|---|---|---|---|---|---|
| Coarse grid | 6 | 1.3 | 100 | 120 | 0 | 0.092 | 1.8 |
| Medium grid | 6 | 3 | 90 | 100 | 0 | 0.074 | 3.1 |
| Fine grid | 6 | 3 | 80 | 80 | 0 | 0.059 | 6.3 |
| Variable | Heave Force (N) | Pitch Moment (N-m) |
|---|---|---|
| (Fine grid) | 18.42 | 10.15 |
| (Medium grid) | 18.20 | 10.14 |
| (Coarse grid) | 17.40 | 9.21 |
| −0.224 | −0.010 | |
| −0.787 | −0.928 | |
| 0.285 | 0.011 |
| Parameters | Values |
|---|---|
| Froude number () | 0.16, 0.21, 0.26, and 0.31 |
| Non-dimensional sail depth () | 0.057, 0.198, and 0.378 |
| Non-dimensional depth () | 1.4, 1.8, 2.2, and 3.0 |
Disclaimer/Publisher’s Note: The statements, opinions and data contained in all publications are solely those of the individual author(s) and contributor(s) and not of MDPI and/or the editor(s). MDPI and/or the editor(s) disclaim responsibility for any injury to people or property resulting from any ideas, methods, instructions or products referred to in the content. |
© 2025 by the authors. Licensee MDPI, Basel, Switzerland. This article is an open access article distributed under the terms and conditions of the Creative Commons Attribution (CC BY) license (https://creativecommons.org/licenses/by/4.0/).
Share and Cite
Jung, D.; Park, S. CFD Study of Submarine Hydrodynamics near the Free Surface in Snorkel Conditions. Water 2025, 17, 734. https://doi.org/10.3390/w17050734
Jung D, Park S. CFD Study of Submarine Hydrodynamics near the Free Surface in Snorkel Conditions. Water. 2025; 17(5):734. https://doi.org/10.3390/w17050734
Chicago/Turabian StyleJung, Doojin, and Sunho Park. 2025. "CFD Study of Submarine Hydrodynamics near the Free Surface in Snorkel Conditions" Water 17, no. 5: 734. https://doi.org/10.3390/w17050734
APA StyleJung, D., & Park, S. (2025). CFD Study of Submarine Hydrodynamics near the Free Surface in Snorkel Conditions. Water, 17(5), 734. https://doi.org/10.3390/w17050734