
Oxygen and Sulfur Isotope Systematics of Dissolved Sulfate in a Nonvolcanic Geothermal System: Sulfate Source, Evolution and Impact on Geothermometers


Abstract
1. Introduction
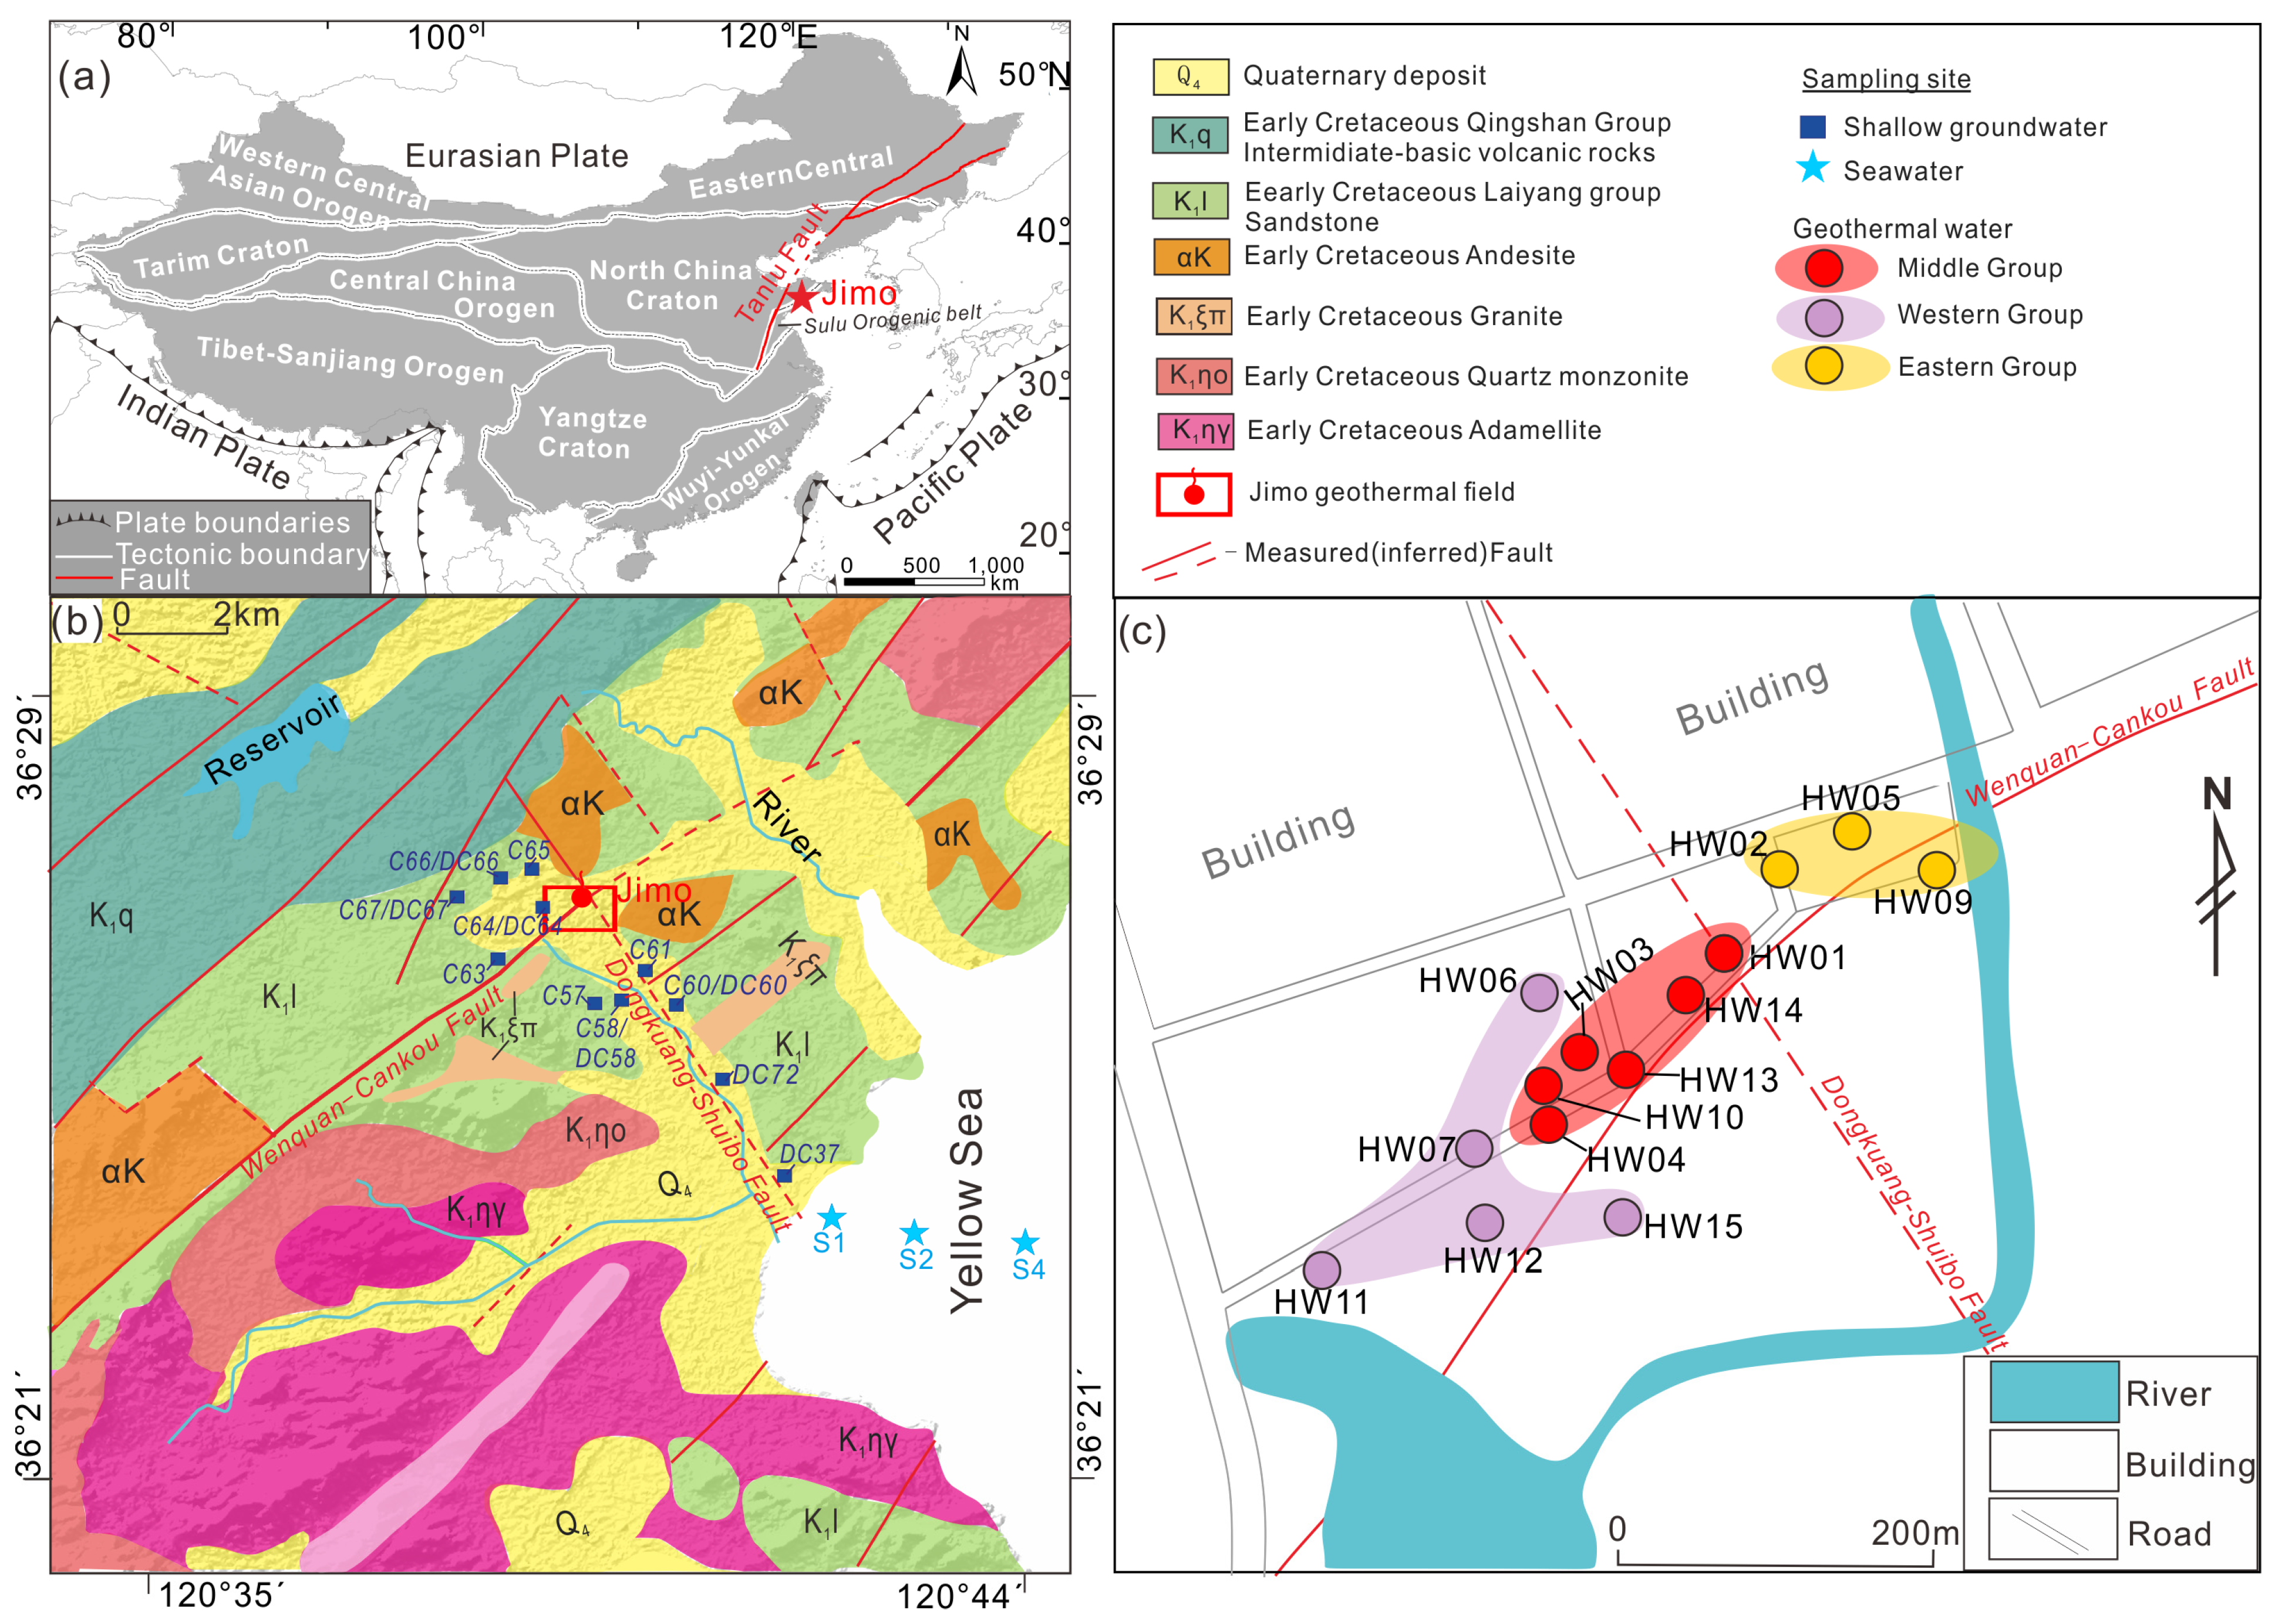
2. Geologic Setting
3. Materials and Methods
3.1. Sampling and Laboratory Analysis
3.2. Interpretation Techniques
4. Results
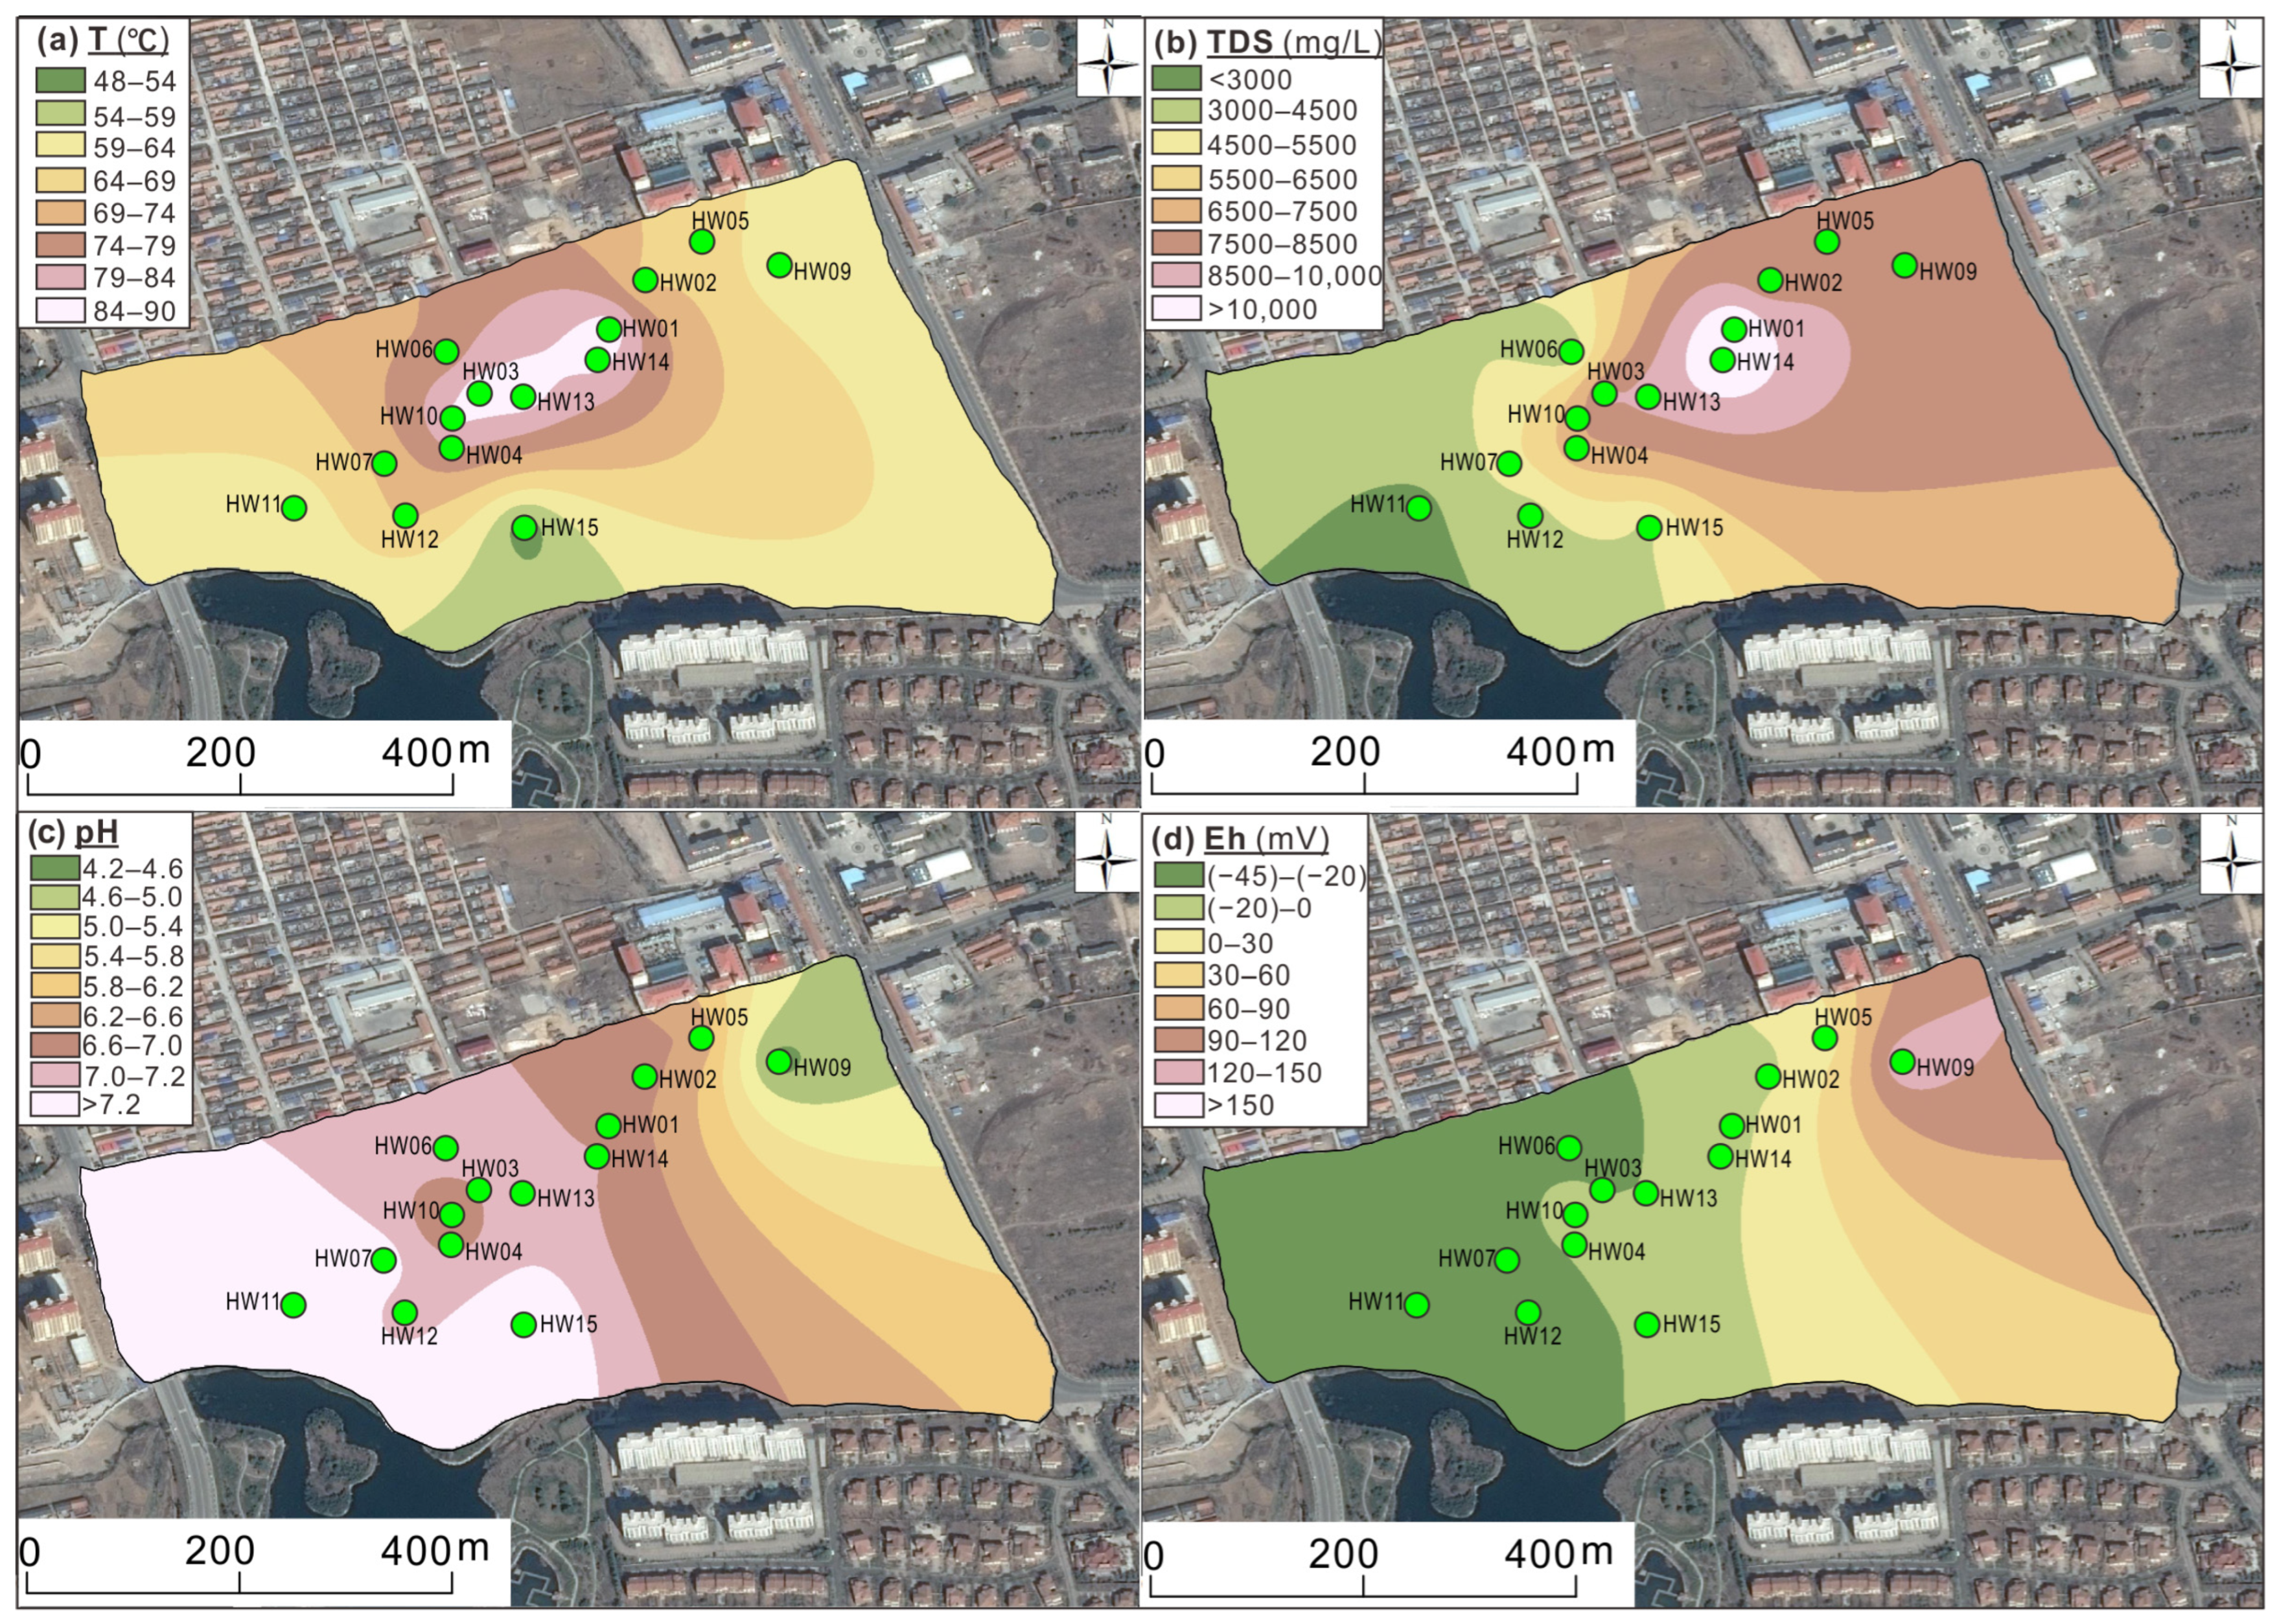
4.1. Geochemical Characteristics of Geothermal Fluids
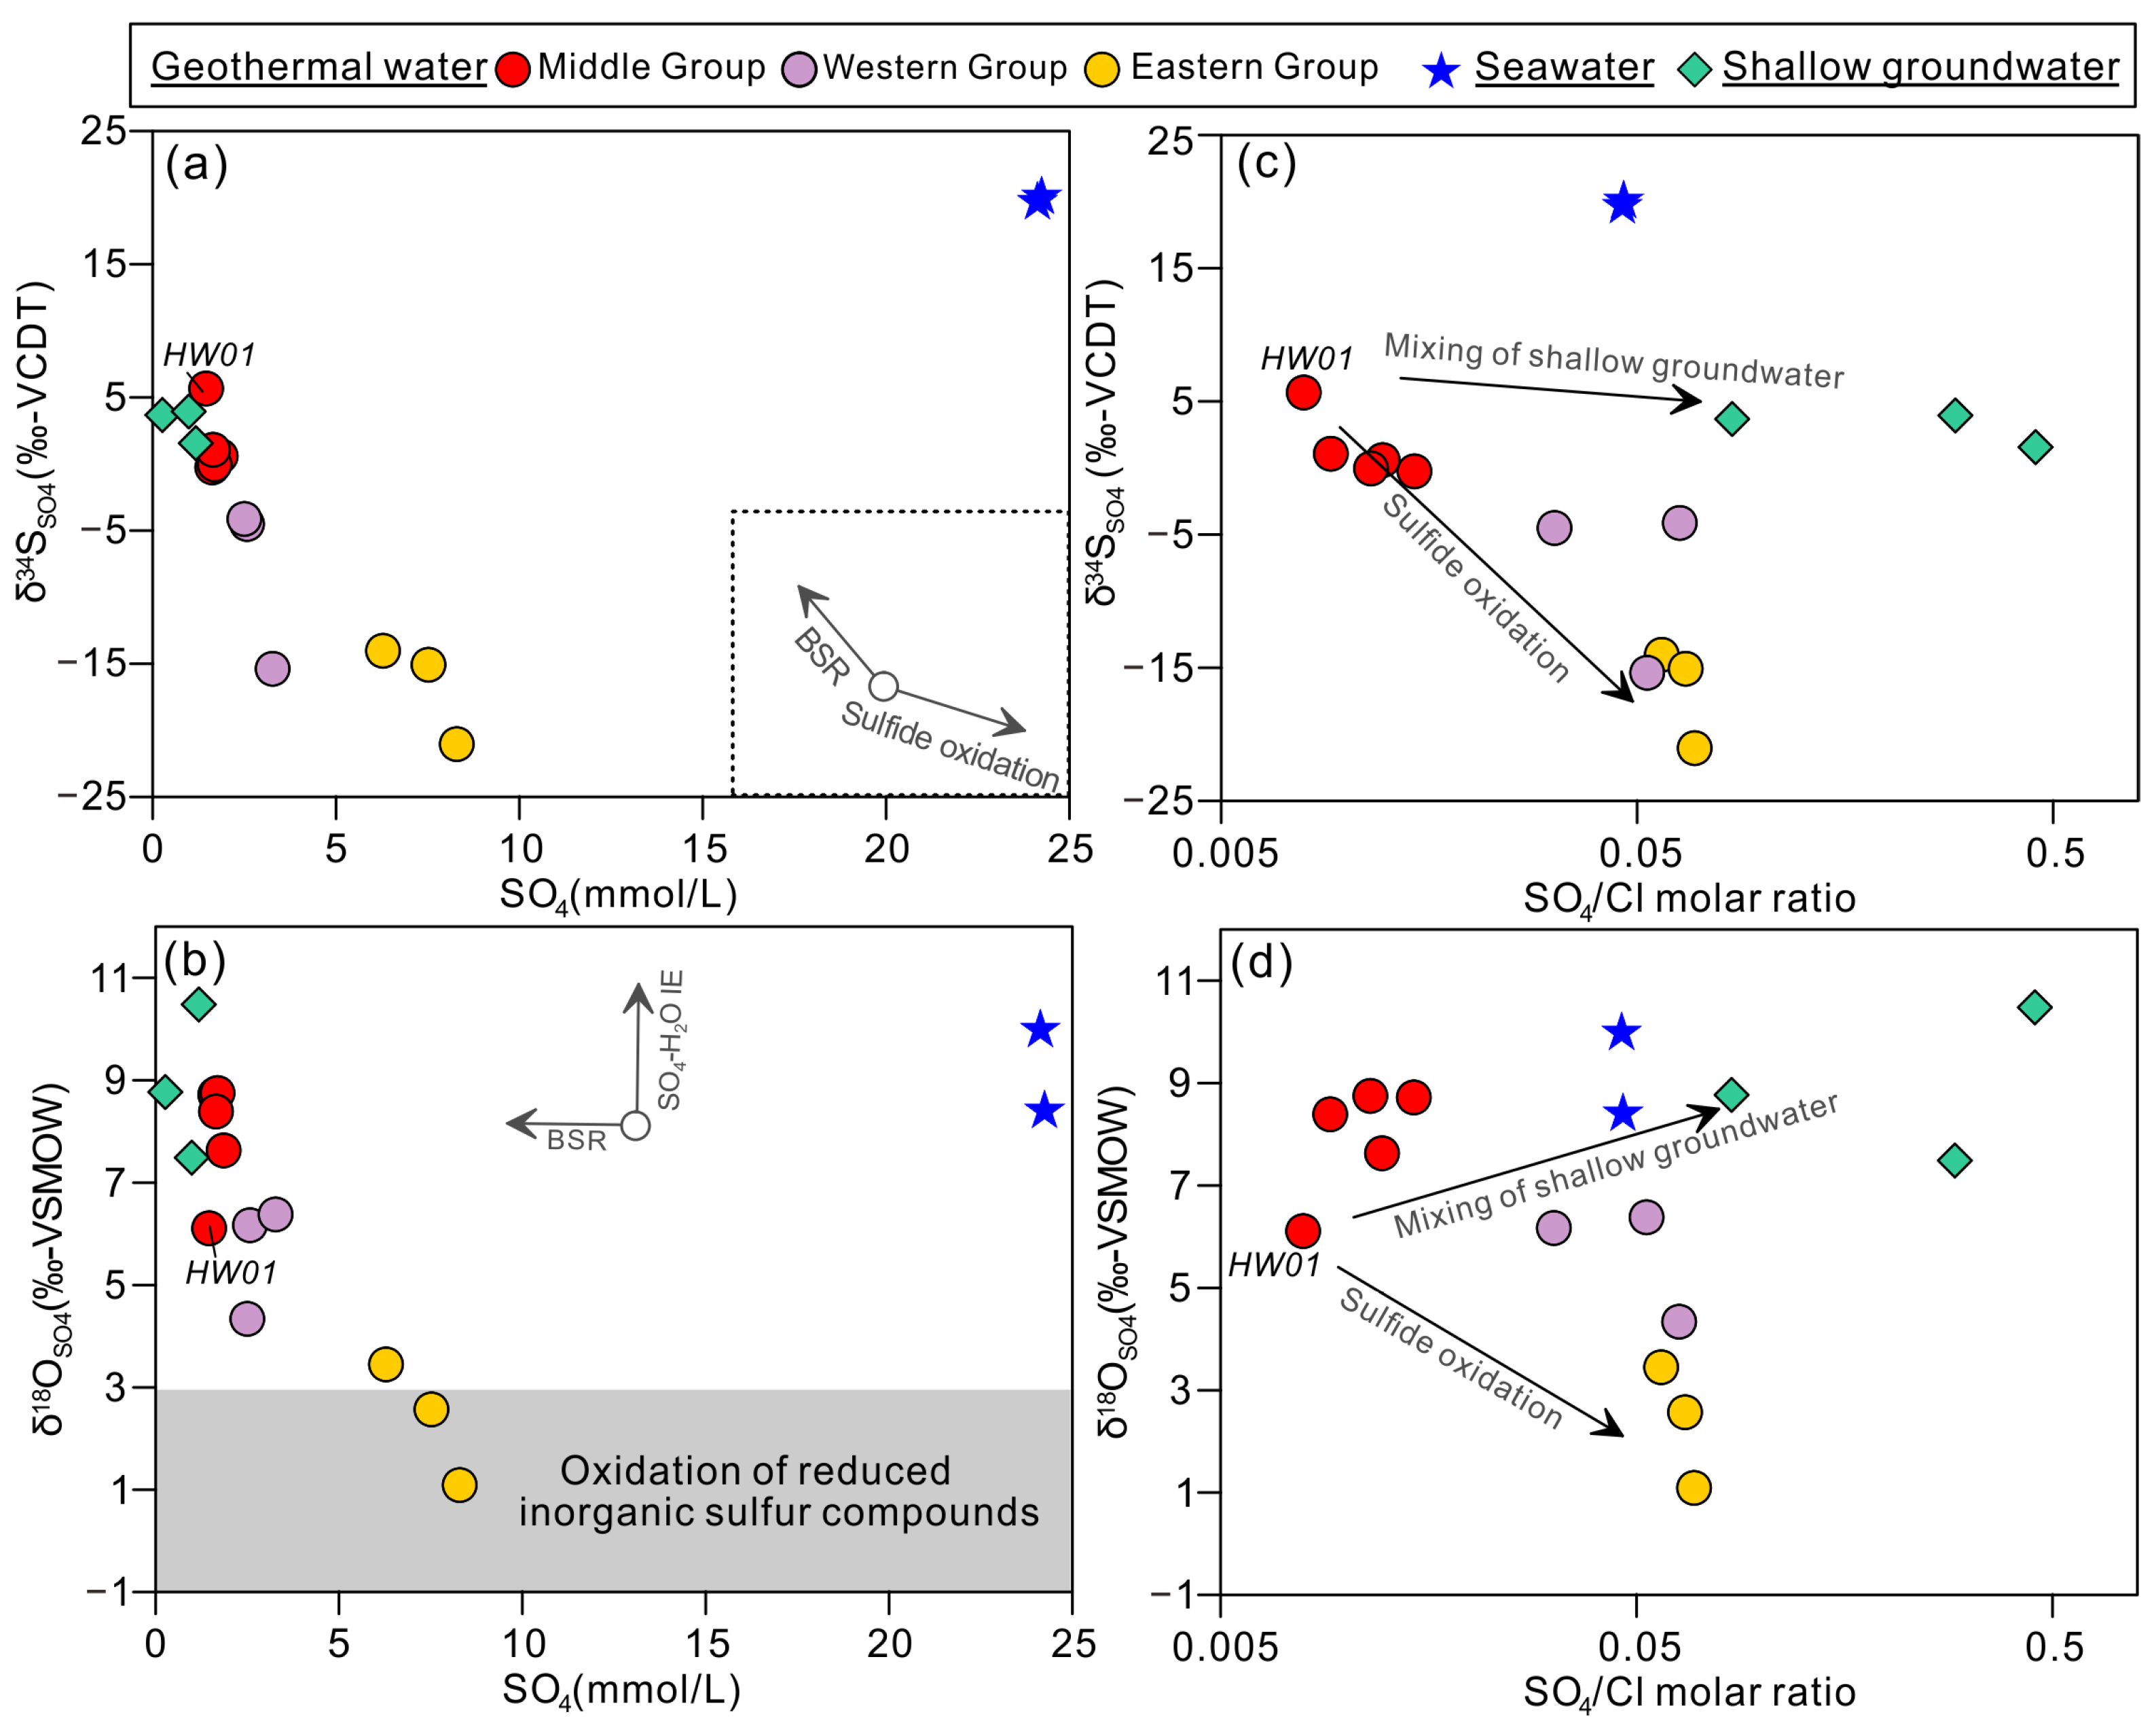
4.2. Sulfur and Oxygen Isotopes (δ18OSO4 and δ34SSO4) in Sulfate
5. Discussion
5.1. Geochemical Evolution of Geothermal Water
5.2. Sources of Sulfate Constrained by Sulfur and Oxygen Isotope Systematics
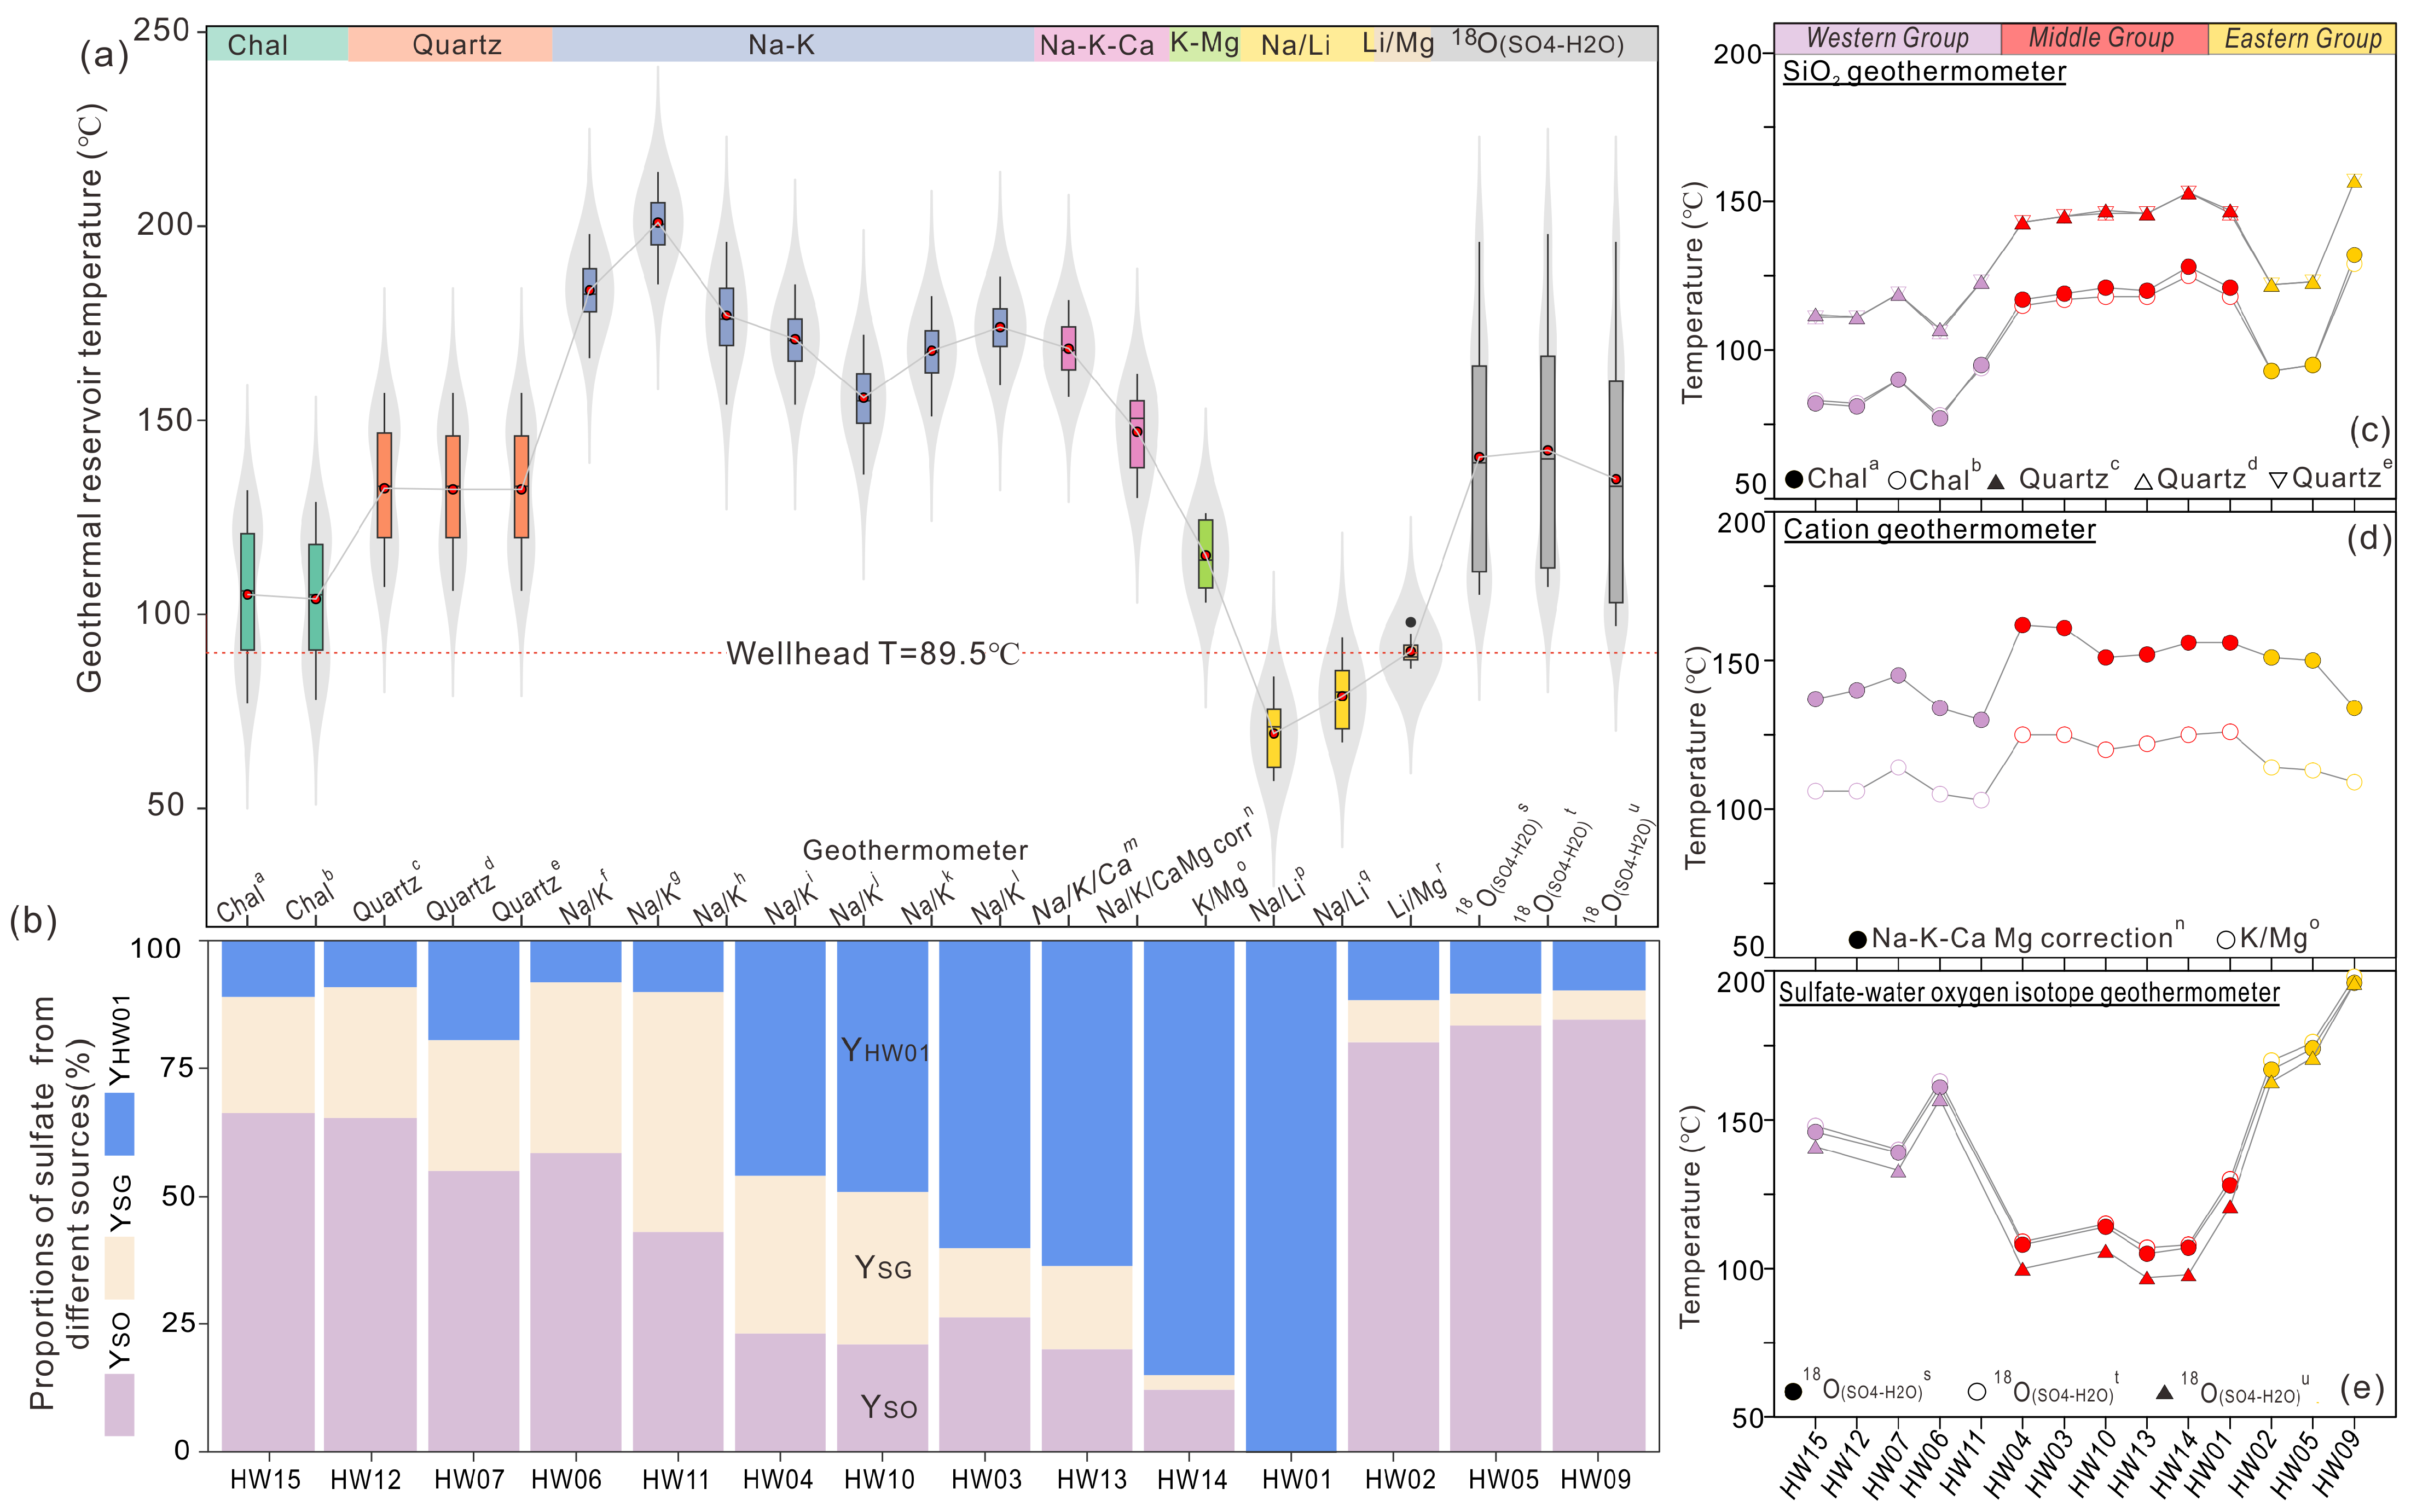
5.3. Quantitative Contributions of Sulfate Sources and Sulfur Isotope of Sulfides
- (1)
- The proportion of solutes from shallow groundwater (x) in the mixing process of shallow groundwater and HW01 is determined based on the Cl mass balance model:
- (2)
- The expected SO4 concentrations formed by the mixing of shallow groundwater and HW01 are as follows:
- (3)
- The excess sulfate derived from sulfide oxidation:
- (4)
- Contributions from different sources:
5.4. Impact on Geothermometers and Estimation of Geothermal Reservoir Temperature
5.4.1. Evaluation of the Influence of Secondary Processes on Different Geothermometers
5.4.2. Geothermal Reservoir Temperature
5.5. Conceptual Model of the Sulfur and Oxygen Isotope Evolution of Sulfate
6. Conclusions
Supplementary Materials
Author Contributions
Funding
Data Availability Statement
Conflicts of Interest
References
- Arnórsson, S.; D’Amore, F. Isotopic and Chemical Techniques in Geothermal Exploration, Development and Use: Sampling Methods, Data Handling, Interpretation; Arnórsson, S., Ed.; International Atomic Energy Agency: Vienna, Austria, 2000; pp. 152–212. [Google Scholar]
- Wei, Z.; Huang, S.; Wang, C. Geochemistry and sources of boron and strontium of geothermal waters from the Pearl River Delta region, South China: Implications for water-rock interactions. J. Geochem. Explor. 2024, 262, 107492. [Google Scholar] [CrossRef]
- Hao, Y.; Zhou, H.; Kuang, X.; Gong, Q.; Feng, Y.; Zhu, M.; Li, N.; Shi, X. Lithium isotopes in the geothermal waters of the India–Asia continental convergent margin: Source and evolution. Geosci. Front. 2025, 16, 102001. [Google Scholar] [CrossRef]
- Jolie, E.; Scott, S.; Faulds, J.; Isabelle Chambefort, I.; Axelsson, G.; Gutiérrez-Negrín, L.C.; Regenspurg, S.; Ziegler, M.; Ayling, B.; Richter, A.; et al. Geological controls on geothermal resources for power generation. Nat. Rev. Earth Env. 2021, 2, 324–339. [Google Scholar] [CrossRef]
- Halas, S.; Trembaczowski, A.; Soltyk, W.; Walendziak, J. Sulphur and Oxygen Isotopes in Sulphates in Natural Waters: (2) Deep-Waters from Horizons Below Baltic Sea Floor. Isot. Isot. Environ. Health Stud. 1993, 28, 229–235. [Google Scholar] [CrossRef]
- Boschetti, T. Oxygen isotope equilibrium in sulfate–water systems: A revision of geothermometric applications in low-enthalpy systems. J. Geochem. Explor. 2013, 124, 92–100. [Google Scholar] [CrossRef]
- Spycher, N.; Peiffer, L.; Sonnenthal, E.L.; Saldi, G.; Reed, M.H.; Kennedy, B.M. Integrated multicomponent solute geothermometry. Geothermics 2014, 51, 113–123. [Google Scholar] [CrossRef]
- Fournier, R.O. Chemical geothermometers and mixing models for geothermal systems. Geothermics 1977, 5, 41–50. [Google Scholar] [CrossRef]
- Fournier, R.O.; Potter, R.W. Magnesium correction to the Na-K-Ca chemical geothermometer. Geochim. Cosmochim. Acta 1979, 43, 1543–1550. [Google Scholar] [CrossRef]
- Fournier, R.O.; Potter, R.W. An equation correlating the solubility of quartz in water from 25 to 900 °C at pressures up to 10,000 bars. Geochim. Cosmochim. Acta 1982, 46, 1975–1978. [Google Scholar] [CrossRef]
- Fournier, R.O. A revised equation for the Na/K geothermometer. Geotherm. Res. Counc. Trans. 1979, 3, 221–224. [Google Scholar]
- Arnórsson, S. Interpretation of Chemical and Isotopic Data on Fluids Discharged from Wells in the Momotombo Geothermal Field with Notes on Gas Chromatography Analysis; Project NIC/8/008-05; IAEA Report: Seoul, Republic of Korea, 1998; 28p. [Google Scholar]
- Giggenbach, W.F. Geothermal solute equilibria. Derivation of Na–K–Mg–Ca geoindicators. Geochim. Cosmochim. Acta 1988, 52, 2749–2765. [Google Scholar] [CrossRef]
- Fournier, R.O.; Truesdell, A.H. An empirical Na–K–Ca geothermometer for natural waters. Geochim. Cosmochim. Acta 1973, 37, 1255–1275. [Google Scholar] [CrossRef]
- Kharaka, Y.K.; Lico, M.S.; Law, L.M. Chemical geothermometers applied to formation waters, Gulf of Mexico and California Basins (abstract). Am. Ass. Petrol. Geol. Bull. 1982, 66, 588. [Google Scholar]
- Lloyd, R.M. Oxygen isotope behavior in the sulfate-water system. J. Geophys. Res. 1968, 73, 6099. [Google Scholar] [CrossRef]
- Pang, Z.H.; Reed, M. Theoretical chemical thermometry on geothermal waters: Problems and methods. Geochim. Cosmochim. Acta 1998, 62, 1083–1091. [Google Scholar] [CrossRef]
- Sanjuan, B.; Millot, R.; Ásmundsson, R.; Brach, M.; Giroud, N. Use of two new Na/Li geothermometric relationships for geothermal fluids in volcanic environments. Chem. Geol. 2014, 389, 60–81. [Google Scholar] [CrossRef]
- Pang, Z.H.; Yang, F.T.; Luo, L. Determination method of reservoir temperature in geothermal field. In Solid Earth Science Research Methods; Zhongli, D., Ed.; Science Press: Bejing, China, 2013; pp. 219–242. [Google Scholar]
- Ferguson, G.; Grasby, S.E.; Hindle, S.R. What do aqueous geothermometers really tell us? Geofluids 2009, 9, 39–48. [Google Scholar] [CrossRef]
- Serpen, U. Hydrogeological investigations on Balcoa geothermal system in Turkey. Geothermics 2004, 33, 309–335. [Google Scholar] [CrossRef]
- Liao, Z. Thermal Springs and Geothermal Energy in the Qinghai-Tibetan Plateau and the Surroundings; Springer Hydrogeology; Springer: Singapore, 2018; 311p. [Google Scholar]
- Hao, Y.; Pang, Z.; Kong, Y.; Tian, J.; Wang, Y.; Liao, D.; Fan, Y. Chemical and isotopic constraints on the origin of saline waters from a hot spring in the eastern coastal area of China. Hydrogeol. J. 2020, 28, 2457–2475. [Google Scholar] [CrossRef]
- Zheng, T.; Stefánsson, A.; Kang, F.; Shi, M.; Jiang, H.; Sui, H. Geochemical and isotope constraints on the hydrogeology and geochemistry of the geothermal waters in the Shandong Peninsula, China. Geothermics 2023, 108, 102628. [Google Scholar] [CrossRef]
- Stefánsson, A.; Keller, N.S.; Robin, J.G.; Ono, S. Multiple sulfur isotope systematics of Icelandic geothermal fluids and the source and reactions of sulfur in volcanic geothermal systems at divergent plate boundaries. Geochim. Cosmochim. Acta 2015, 165, 307–323. [Google Scholar] [CrossRef]
- Bao, Y.; Pang, Z.; Huang, T.; Li, Y.; Tian, J.; Luo, J.; Qian, T. Chemical and isotopic evidences on evaporite dissolution as the origin of high sulfate water in a karst geothermal reservoir. Appl. Geochem. 2022, 145, 105419. [Google Scholar] [CrossRef]
- Li, B.; Kong, Q.; Liao, F.; Wang, G.; Liu, F.; Guo, L.; Liu, C.; Shi, Z. Sulphur evolution in acidic and alkaline geothermal water related to magma in the Rehai geothermal field in the southeastern Tibet Plateau based on stable hydrogen, oxygen, sulphur isotopes. Geothermics 2024, 119, 102931. [Google Scholar] [CrossRef]
- Krouse, H.R.; Mayer, B. Sulfur and oxygen isotopes in sulfate. In Environmental Tracers in Subsurface Hydrology; Cook, P.G., Herczeg, A.L., Eds.; Kluwer: Boston, MA, USA, 2000; Chapter 7; pp. 195–231. [Google Scholar]
- Seal, R.R., II. Sulfur Isotope Geochemistry of Sulfide Minerals. Rev. Min. Geochem. 2006, 61, 633–677. [Google Scholar] [CrossRef]
- Marini, L.; Moretti, R.; Accornero, M. Sulfur isotopes in magmatic-hydrothermal systems, melts, and magmas. Rev. Min. Geochem. 2011, 73, 423–492. [Google Scholar] [CrossRef]
- Taylor, B.E.; Wheeler, M.C. Sulfur- and oxygen-isotope geochemistry of acid mine drainage in the western US: Field and experimental studies revisited. In Environmental Geochemistry of Sulfide Oxidation; Alpers, C.N., Blowes, D.W., Eds.; ACS Symposium Series 550; American Chemical Society: Washington, DC, USA, 1994; pp. 481–514. [Google Scholar]
- Balci, N.; Mayer, B.; Shanks, W.; Mandernack, K. Oxygen and sulfur isotope systematics of sulfate produced during abiotic and bacterial oxidation of sphalerite andelemental sulfur. Geochem. Cosmochim. Acta 2012, 77, 335–351. [Google Scholar] [CrossRef]
- Hosono, T.; Lorphensriand, O.; Onodera, S.; Okawa, H.; Nakano, T.; Yamanaka, T.; Tsujimura, M.; Taniguchi, M. Different isotopic evolutionary trends of δ34S and δ18O compositions of dissolved sulfate in an anaerobic deltaic aquifer system. Appl. Geochem. 2014, 46, 30–42. [Google Scholar] [CrossRef]
- Long, Y.; Huang, T.; Zhang, F.; Li, Z.; Pang, Z. Origin of sulfate in the unsaturated zone and groundwater of a loess aquifer. Hydrol. Process. 2021, 35, e14166. [Google Scholar] [CrossRef]
- Mizutani, Y.; Rafter, T.A. Oxygen isotopic composition of sulphates—Part 4. N. Z. J. Sci. 1969, 12, 60–68. [Google Scholar]
- Zhang, D.; Li, X.; Zhao, Z.; Liu, C. Using dual isotopic data to track the sources and behaviors of dissolved sulfate in the western North China Plain. Appl. Geochem. 2015, 52, 43–56. [Google Scholar] [CrossRef]
- Li, L.; Wei, S.; Sherwood Lollar, B.; Wing, B.; Bui, T.H.; Ono, S.; Lau Vetter, M.C.Y.; Onstott, T.C.; Kieft, T.L.; Borgonie, G.; et al. In situ oxidation of sulfide minerals supports widespread sulfate reducing bacteria in the deep subsurface of the Witwatersrand Basin (South Africa): Insights from multiple sulfur and oxygen isotopes. Earth Planet. Sci. Lett. 2022, 577, 117247. [Google Scholar] [CrossRef]
- Zeebe, R.E. A new value for the stable oxygen isotope fractionation between dissolved sulfate ion and water. Geochim. Cosmochim. Acta 2010, 74, 818–828. [Google Scholar] [CrossRef]
- Zhang, T.; Zhang, Y.Q. Late Mesozoic tectono-magmatic evolution history of the Jiaobei Uplift, Shandong Peninsula. Acta Geol. Sin. 2008, 82, 1210–1218, (In Chinese with English abstract). [Google Scholar]
- Liu, Y.; Fu, Y.; Wu, S. δD and δ18O compositions in geothermal water of Jimo hot spring and its geological significance. Coast. Eng. 2009, 28, 52–60, (In Chinese with English abstract). [Google Scholar]
- Zhang, L.; Wang, C.; Cao, K.; Wang, Q.; Tan, J. High elevation of Jiaolai Basin during the Late Cretaceous: Implication for the coastal mountains along the East Asian margin. Earth Planet. Sci. Lett. 2016, 456, 112–113. [Google Scholar] [CrossRef]
- Ji, Q. On the Cretaceous stratigraphic framework and the Cretaceous-Paleogene boundary of Eastern Shandong Province. J. Geol. 2017, 4, 1–25, (In Chinese with English abstract). [Google Scholar]
- Hao, Y.; Pang, Z.; Tian, J.; Wang, Y.; Li, Z.; Li, L.; Xing, L. Origin and evolution of hydrogen-rich gas discharges from a hot spring in the eastern coastal area of China. Chem. Geol. 2020, 538, 119477. [Google Scholar] [CrossRef]
- Liu, Y.; Cao, X.; Fu, Y.; Wu, S. Dynamic change characteristics of geothermal water quality in Jimo Hot Springs. Land. Resour. Shandong Prov. 2010, 26, 19–24. [Google Scholar]
- Fang, B. Perspective Prognosis on Geothermal Resource in Synthetic Information in Shandong Province. Ph.D. Thesis, Jilin University, Changchun, China, 2006. [Google Scholar]
- Jiang, G.; Hu, S.; Shi, Y.; Zhang, C.; Wang, Z.; Hu, D. Terrestrial heat flow of continental China: Updated dataset and tectonic implications. Tectonophysics 2019, 753, 36–48. [Google Scholar] [CrossRef]
- Torres-Martínez, J.A.; Mora, A.; Knappett, P.S.K.; Ornelas-Soto, N.; Mahlknecht, J. Tracking nitrate and sulfate sources in groundwater of an urbanized valley using a multi-tracer approach combined with a Bayesian isotope mixing model. Water Res. 2020, 182, 115962. [Google Scholar] [CrossRef]
- Reed, M.; Spycher, N. Calculation of pH and mineral equilibria in hydrothermal waters with application to geothermometry and studies of boiling and dilution. Geochim. Cosmochim. Acta 1984, 48, 1479–1492. [Google Scholar] [CrossRef]
- Reed, M.; Spycher, N.; Palandri, J. Manual of SOLVEQ-XPT: A Computer Program for Computing Aqueous-Mineral-Gas Equilibria; Lawrence Berkeley Laboratory, Department of Energy: Berkeley, CA, USA, 2010; 41p.
- Peters, C.; Strauss, H.; Haase, K.; Bach, W.; de Ronde, C.E.J.; Kleint, C.; Stucker, V.; Diehl, A. SO2 disproportionation impacting hydrothermal sulfur cycling: Insights from multiple sulfur isotopes for hydrothermal fluids from the Tonga-Kermadec intraoceanic arc and the NE Lau Basin. Chem. Geol. 2021, 586, 120586. [Google Scholar] [CrossRef]
- Rees, C.E.; Jenkins, W.J.; Monster, J. The sulphur isotope geochemistry of ocean water sulphate. Geochim. Cosmochim. Acta 1978, 42, 377–382. [Google Scholar] [CrossRef]
- Nriagu, J.O.; Ress, C.E.; Mekhtiyeva, V.L.; Lein, A.Y.; Fritz, P.; Drimmie, R.J.; Pankina, R.G.; Robinson, R.W.; Krouse, H.R. Hydrosphere. In Stable Isotopes in the Assessment of Natural and Anthropogenic Sulphur in the Environment; Krouse, H.R., Grinenko, V.A., Eds.; SCOPE 43; John and Wiley and Sons: Hoboken, NJ, USA, 1991; pp. 177–265. [Google Scholar]
- Claypool, G.E.; Holser, W.T.; Kaplan, I.R.; Sakai, H.; Zak, I. The age curves of sulfur and oxygen isotopes in marine sulfate and their mutual interpretation. Chem. Geol. 1980, 28, 199–260. [Google Scholar] [CrossRef]
- Bojar, A.-V.; Halas, S.; Bojar, H.-P.; Trembaczowski, A. Late Permian to Triassic isotope composition of sulfates in the Eastern Alps: Palaeogeographic implications. Geol. Mag. 2018, 155, 797–810. [Google Scholar] [CrossRef]
- González-Partida, E.; Carrillo-Chávez, A.; Levresse, G.; Tello-Hinojosa, E.; Venegas-Salgado, S.; Ramirez-Silva, G.; Pal-Verma, M.; Tritlla, J.; Camprubi, A. Hydrogeochemical and isotopic fluid evolution of the Los Azufres geothermal field, Central Mexico. Appl. Geochem. 2005, 20, 23–39. [Google Scholar] [CrossRef]
- Martinez Serrano, R.G.; Jacquier, B.; Arnold, M. The δ34S composition of sulfates and sulfides at the Los Humeros geothermal system, Mexico and their application to physicochemical fluid evolution. J. Volcanol. Geotherm. Res. 1996, 73, 99–118. [Google Scholar] [CrossRef]
- Taylor, B.E.; Wheeler, M.C.; Nordstrom, D.K. Stable isotope geochemistry of acid mine drainage: Experimental oxidation of pyrite. Geochim. Cosmochim. Acta 1984, 48, 2669. [Google Scholar] [CrossRef]
- Gilhooly, W.P., III; Reinhard, C.T.; Lyons, T.W. A comprehensive sulfur and oxygen isotope study of sulfur cycling in a shallow, hyper-euxinic meromictic lake. Geochim. Cosmochim. Acta 2016, 189, 1–23. [Google Scholar] [CrossRef]
- Toran, L.; Harris, R.F. Interpretation of sulfur and oxygen isotopes in biological and abiological sulfide oxidation. Geochim. Cosmochim. Acta 1989, 53, 2341–2348. [Google Scholar] [CrossRef]
- Dogramaci, S.; McLean, L.; Skrzypek, G. Hydrochemical and stable isotope indicators of pyrite oxidation in carbonate-rich environment; the Hamersley Basin, Western Australia. J. Hydrol. 2017, 545, 288–298. [Google Scholar] [CrossRef]
- Migaszewski, Z.M.; Gałuszka, A.; Dołęgowska, S. Stable isotope geochemistry of acid mine drainage from the Wiśniówka area (south-central Poland). Appl. Geochem. 2018, 95, 45–56. [Google Scholar] [CrossRef]
- Van Everingden, R.O.; Krouse, H.R. Isotope composition of sulphates generated by bacterial and abiological oxidation. Nature 1985, 315, 395–396. [Google Scholar] [CrossRef]
- Tuttle, M.L.W.; Breit, G.N.; Cozzarelli, I.M. Processes affecting δ34S and δ18O values of dissolved sulfate in alluvium along the Canadian River, central Oklahoma, USA. Chem. Geol. 2009, 265, 455–467. [Google Scholar] [CrossRef]
- Arnórsson, S.; Gunnlaugsson, E.; Svavarsson, H. The chemistry of geothermal waters in Iceland.3. Chemical geothermometry in geothermal investigations. Geochim. Cosmochim. Acta 1983, 47, 567–577. [Google Scholar] [CrossRef]
- Truesdell, A.H. Summary of section III. Geochemical techniques in exploration. In Proceedings of the Second United States Symposium on the Development and Use of Geothermal Resources, San Francisco, CA, USA, 20–29 May 1975; US Government Printig Office: Washington, DC, USA, 1976; pp. 53–79. [Google Scholar]
- Tonani, F. Some remarks on the application of geochemical techniques in geothermal exploration. In Advances in European Geothermal Research; Springer: Dordrecht, The Netherlands, 1980; pp. 428–443. [Google Scholar]
- Nieva, D.; Nieva, R. Developments in geothermal energy in Mexico, Part 12. A cationic geothermometer for prospecting of geothermal resources. Heat Recovery Syst. CHP 1987, 7, 243–258. [Google Scholar] [CrossRef]
- Can, I. A new improved Na/K geothermometer by artificial neural networks. Geothermics 2002, 31, 751–760. [Google Scholar] [CrossRef]
- Fouillac, C.; Micard, G. Sodium/Lithium ratios in water applied to geothermetry of geothermal reservoirs. Geothermics 1981, 10, 55–70. [Google Scholar] [CrossRef]
- Verma, S.P.; Santoyo, E. New improved equations for Na/K, Na/Li and SiO2 geothermometers by outlier detection and rejection. J. Volcanol. Geotherm. Res. 1997, 79, 9–23. [Google Scholar] [CrossRef]
- Kharaka, Y.K.; Mariner, R.H. Chemical Geothermometers and Their Application to Formation Waters from Sedimentary Basins. In Thermal History of Sedimentary Basins; Naeser, N.D., McCulloh, T.H., Eds.; Springer: New York, NY, USA, 1989; pp. 99–117. [Google Scholar]
- Seal, R.R., II; Rye, R.O.; Alpers, C.N. Stable isotope systematics of sulfate minerals. Rev. Miner. Geochem. 2000, 40, 541–602. [Google Scholar] [CrossRef]
- Peiffer, L.; Wanner, C.; Spycher, N.; Sonnenthal, E.; Kennedy, B.M. Multicomponent vs. classical geothermometry: An evaluation using reactive transport modeling. Procedia Earth Planet. Sci. 2013, 7, 665–668. [Google Scholar] [CrossRef]


| Sample ID | Water Type | Tem a | pH a | Eh a | TDS a | SO4 a | δ18OH2O | δ34SSO4 | δ18OSO4 |
|---|---|---|---|---|---|---|---|---|---|
| °C | mV | mg/L | mg/L | ‰V-SMOW | ‰V-CDT | ‰V-SMOW | |||
| C63 | SG | 14.2 | 7.0 | −19.8 | 651 | 113 | −6.2 | 1.6 | 10.5 |
| C64 | SG | 18.2 | 7.7 | −64.4 | 661 | 25.4 | −6.9 | 3.7 | 8.8 |
| C66 | SG | 15.2 | 7.2 | −31.6 | 889 | 94.5 | −6.4 | 3.9 | 7.5 |
| S2 | SW | nd | 7.9 | −40.2 | 33,778 | 2316 | −0.2 | 19.7 | 10.0 |
| S3 | SW | nd | 8.0 | −49.3 | 33,731 | 2327 | −0.3 | 20.1 | 8.4 |
| HW01 | GW-M | 89.5 | 6.8 | −7.1 | 10,832 | 140 | −8.3 | 5.7 | 6.1 |
| HW03 | GW-M | 88.0 | 7.0 | −21.9 | 8961 | 178 | −8.3 | 0.6 | 7.6 |
| HW04 | GW-M | 80.0 | 6.9 | −16.4 | 6723 | 156 | −7.9 | −0.3 | 8.7 |
| HW10 | GW-M | 86.0 | 6.7 | 1.3 | 6982 | 153 | −7.9 | nd | nd |
| HW13 | GW-M | 88.1 | 7.2 | −19.5 | 8600 | 162 | −8.2 | −0.0 | 8.8 |
| HW14 | GW-M | 86.7 | 7.1 | −9.0 | 10,462 | 158 | −8.4 | 1.1 | 8.4 |
| HW06 | GW-W | 74.3 | 7.2 | −30.5 | 2722 | 240 | −7.1 | −4.1 | 4.3 |
| HW07 | GW-W | 70.0 | 7.4 | −44.6 | 5077 | 247 | −7.2 | −4.5 | 6.2 |
| HW11 | GW-W | 60.0 | 7.3 | −39.6 | 2472 | 174 | −6.1 | nd | nd |
| HW12 | GW-W | 70.2 | 7.1 | −27.6 | 3609 | 299 | −6.6 | nd | nd |
| HW15 | GW-W | 48.2 | 7.5 | −18.3 | 4189 | 314 | −6.4 | −15.4 | 6.4 |
| HW02 | GW-E | 66.8 | 6.8 | −5.4 | 7182 | 603 | −7.5 | −14.0 | 3.5 |
| HW05 | GW-E | 66.9 | 6.7 | −1.7 | 7725 | 722 | −7.9 | −15.1 | 2.6 |
| HW09 | GW-E | 60.0 | 4.2 | 157.2 | 8057 | 796 | −7.9 | −21.0 | 1.1 |
| Sample ID | Water Type | Si a | Sr a | Al a | Fe | Mn | Mo | Zn | Tl | Pb |
|---|---|---|---|---|---|---|---|---|---|---|
| mg/L | mg/L | μg/L | μg/L | μg/L | μg/L | μg/L | μg/L | μg/L | ||
| HW01 | GW-M | 54.9 | 52.8 | 4.21 | 242 | 243 | 13.9 | 16.0 | 7.9 | 0.11 |
| HW03 | GW-M | 54.9 | 40.6 | 1.30 | 27 | 280 | 63.8 | 57.3 | 6.7 | 0.49 |
| HW04 | GW-M | 51.7 | 34.6 | 2.36 | 7 | 256 | 35.7 | 11.6 | 8.2 | 2.08 |
| HW10 | GW-M | 53.5 | 32.1 | 1.98 | 37 | 210 | 45.8 | 55.4 | 7.1 | 1.75 |
| HW13 | GW-M | 54.6 | 41.1 | 0.81 | 21 | 280 | 36.4 | 16.5 | 7.5 | 0.03 |
| HW14 | GW-M | 61.4 | 49.8 | 0.91 | 8 | 275 | 22.9 | 19.9 | 10.8 | 0.03 |
| HW06 | GW-W | 25.7 | 7.89 | 1.47 | 11 | 118 | 63.4 | 148 | 3.4 | 9.97 |
| HW07 | GW-W | 33.0 | 23.1 | 2.48 | 14 | 359 | 36.5 | 11.4 | 15.2 | 0.34 |
| HW11 | GW-W | 35.8 | 6.53 | 0.61 | 42 | 79.7 | 9.9 | 32.8 | 0.8 | 0.28 |
| HW12 | GW-W | 28.0 | 12.9 | 2.18 | 25 | 365 | 67.7 | 52.9 | 22.4 | 0.29 |
| HW15 | GW-W | 28.5 | 16.5 | 0.81 | 94 | 366 | 10.1 | 18.4 | 4.0 | 1.74 |
| HW02 | GW-E | 35.0 | 32.1 | 0.56 | 20 | 693 | 12.6 | 39.4 | 5.8 | 133 |
| HW05 | GW-E | 35.9 | 36.6 | 0.47 | <0.002 | 1280 | 10.7 | 51.7 | 19.4 | 80.6 |
| HW09 | GW-E | 65.2 | 34.8 | 272 | 12,100 | 3390 | 1.4 | 245 | 161 | 99.4 |
| Methods | Geothermal Reservoir Temperature, T (°C) | Partial Correlation Coefficient | ΔT = (T − THW01)/THW01 (%) | |||||
|---|---|---|---|---|---|---|---|---|
| HW01 | HW09 | Average ± SD a (n = 14) | YSO | YSG | YHW01 | Max-Derivation | Average ± SD b | |
| Chalcedony [8] | 121 | 132 | 105 ± 19 | −0.395 | −0.562 * | 0.383 | −36 | −14 ± 15 (n = 13) |
| Chalcedony [64] | 118 | 129 | 104 ± 18 | −0.395 | −0.562 * | 0.383 | −34 | −13 ± 15 (n = 13) |
| Quartz [10] | 147 | 157 | 132 ± 17 | −0.395 | −0.562 * | 0.383 | −27 | −11 ± 11 (n = 13) |
| Quartz [8] | 146 | 157 | 132 ± 17 | −0.396 | −0.562 * | 0.383 | −27 | −10 ± 12 (n = 13) |
| Quartz [65] | 146 | 157 | 132 ± 17 | −0.396 | −0.562 * | 0.383 | −27 | −10 ± 12 (n = 13) |
| Na-K-Ca Mg corr [9] | 156 | 134 | 147 ± 11 | −0.447 | −0.424 | 0.306 | −17 | −6 ± 7 (n = 13) |
| K-Mg [13] | 126 | 109 | 115 ± 8 | −0.730 *** | −0.652 ** | 0.437 | −18 | −9 ± 6 (n = 13) |
| 18O(SO4-H2O) [72] | 128 | 196 | 141 ± 31 | 0.898 *** | −0.624 * | −0.725 ** | 53 | 11 ± 24 (n = 10) |
| 18O(SO4-H2O) [16] | 130 | 198 | 142 ± 30 | 0.899 *** | −0.624 * | −0.730 ** | 52 | 10 ± 24 (n = 10) |
| 18O(SO4-H2O) [35] | 121 | 196 | 135 ± 34 | 0.897 *** | −0.623 * | −0.718 ** | 62 | 13 ± 28 (n = 10) |
Disclaimer/Publisher’s Note: The statements, opinions and data contained in all publications are solely those of the individual author(s) and contributor(s) and not of MDPI and/or the editor(s). MDPI and/or the editor(s) disclaim responsibility for any injury to people or property resulting from any ideas, methods, instructions or products referred to in the content. |
© 2025 by the authors. Licensee MDPI, Basel, Switzerland. This article is an open access article distributed under the terms and conditions of the Creative Commons Attribution (CC BY) license (https://creativecommons.org/licenses/by/4.0/).
Share and Cite
Hao, Y.; Pang, Z.; Gong, Q.; Li, N.; Liao, D.; Luo, Z. Oxygen and Sulfur Isotope Systematics of Dissolved Sulfate in a Nonvolcanic Geothermal System: Sulfate Source, Evolution and Impact on Geothermometers. Water 2025, 17, 788. https://doi.org/10.3390/w17060788
Hao Y, Pang Z, Gong Q, Li N, Liao D, Luo Z. Oxygen and Sulfur Isotope Systematics of Dissolved Sulfate in a Nonvolcanic Geothermal System: Sulfate Source, Evolution and Impact on Geothermometers. Water. 2025; 17(6):788. https://doi.org/10.3390/w17060788
Chicago/Turabian StyleHao, Yinlei, Zhonghe Pang, Qinghua Gong, Nianqing Li, Dawei Liao, and Zhengyu Luo. 2025. "Oxygen and Sulfur Isotope Systematics of Dissolved Sulfate in a Nonvolcanic Geothermal System: Sulfate Source, Evolution and Impact on Geothermometers" Water 17, no. 6: 788. https://doi.org/10.3390/w17060788
APA StyleHao, Y., Pang, Z., Gong, Q., Li, N., Liao, D., & Luo, Z. (2025). Oxygen and Sulfur Isotope Systematics of Dissolved Sulfate in a Nonvolcanic Geothermal System: Sulfate Source, Evolution and Impact on Geothermometers. Water, 17(6), 788. https://doi.org/10.3390/w17060788