
Experimental Study on the Evolution Law of Loess Cracks Under Dry–Wet Cycle Conditions

 , ,
, ,
Abstract
:1. Introduction
2. Materials and Methods
2.1. Material
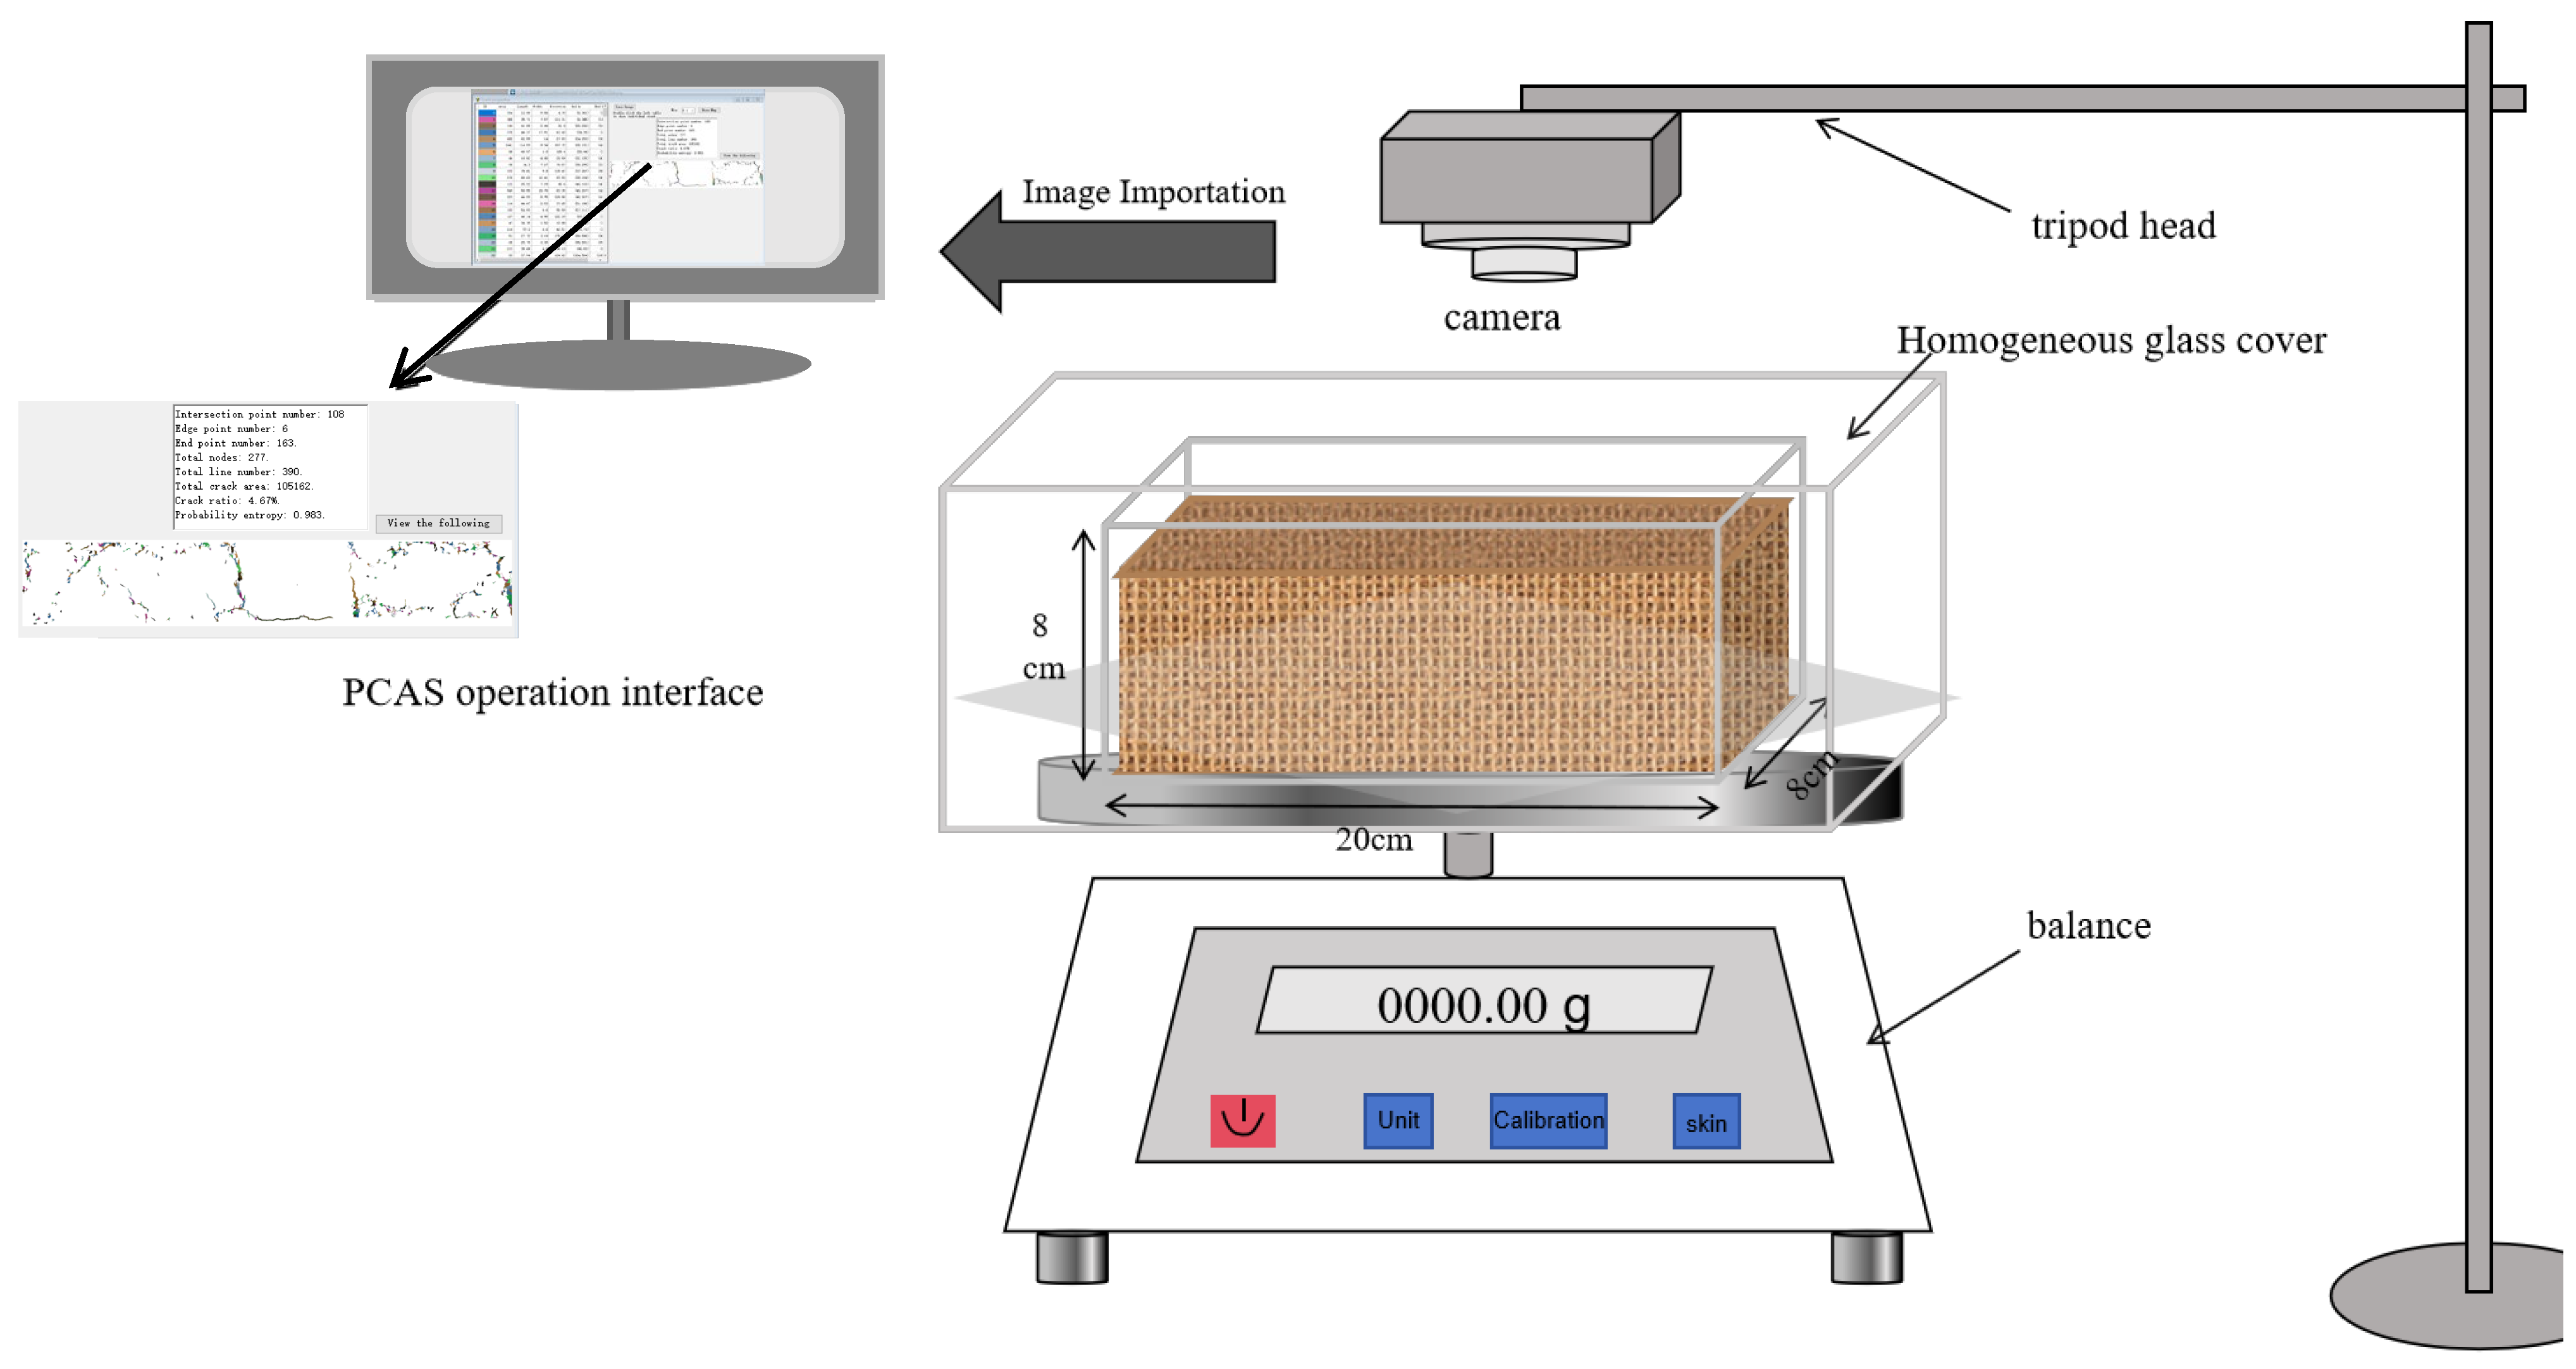
2.2. Equipment
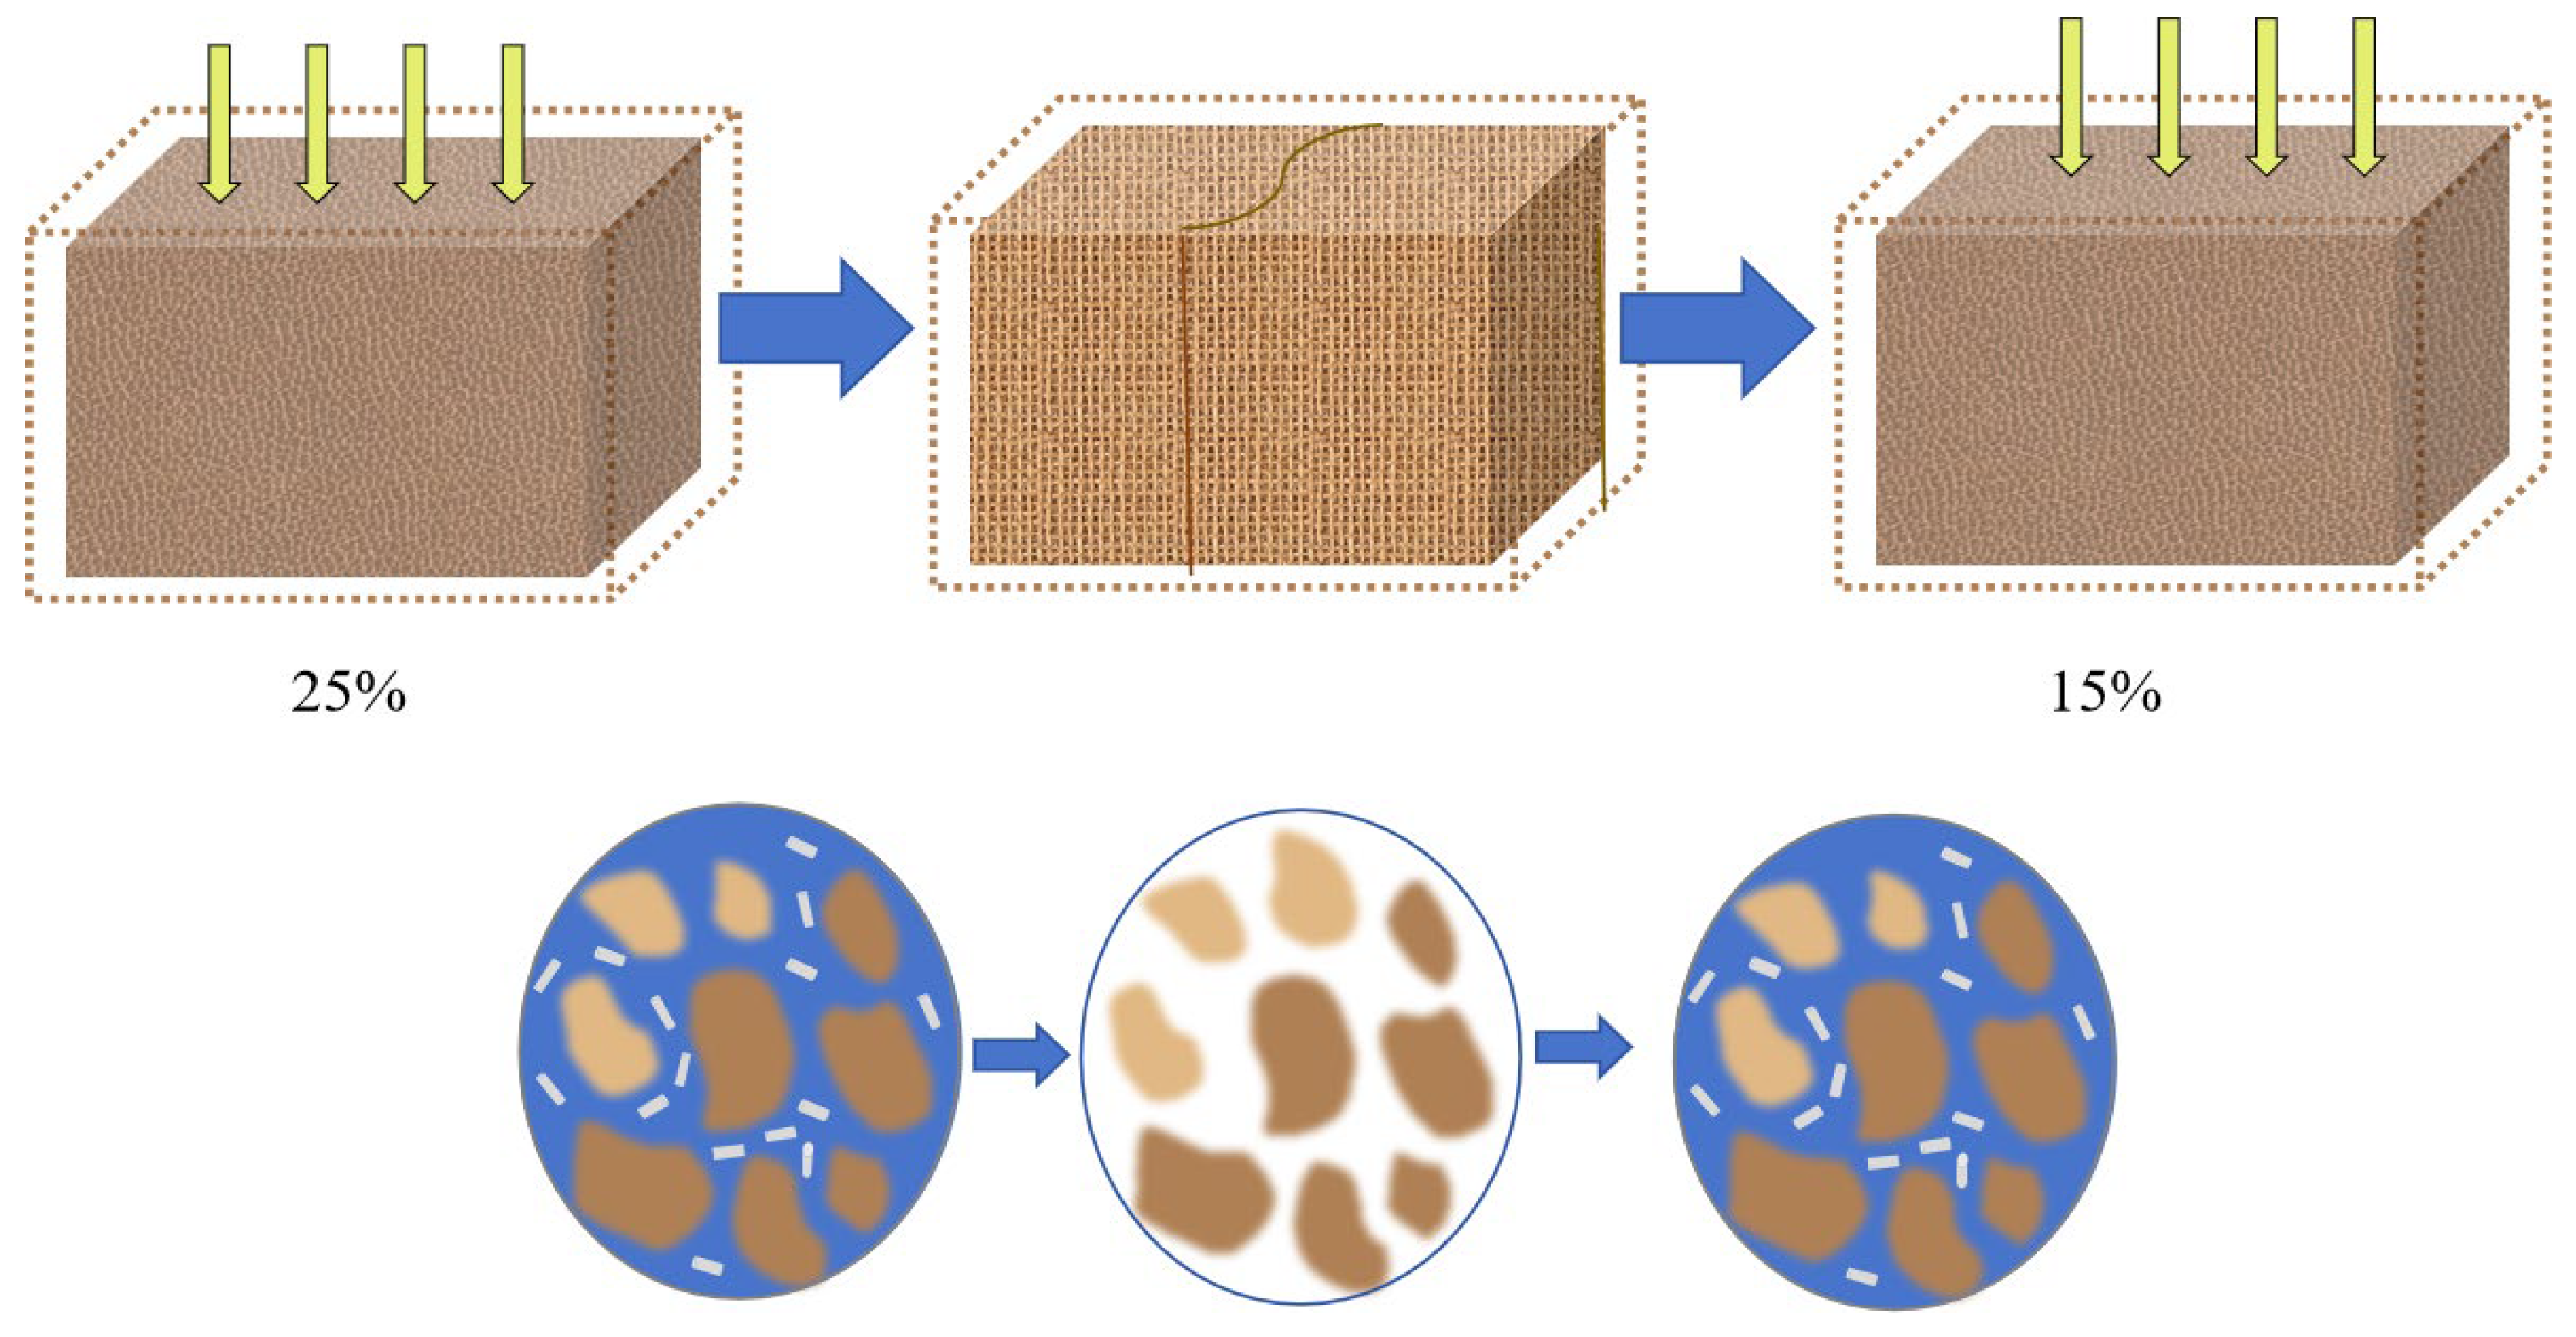
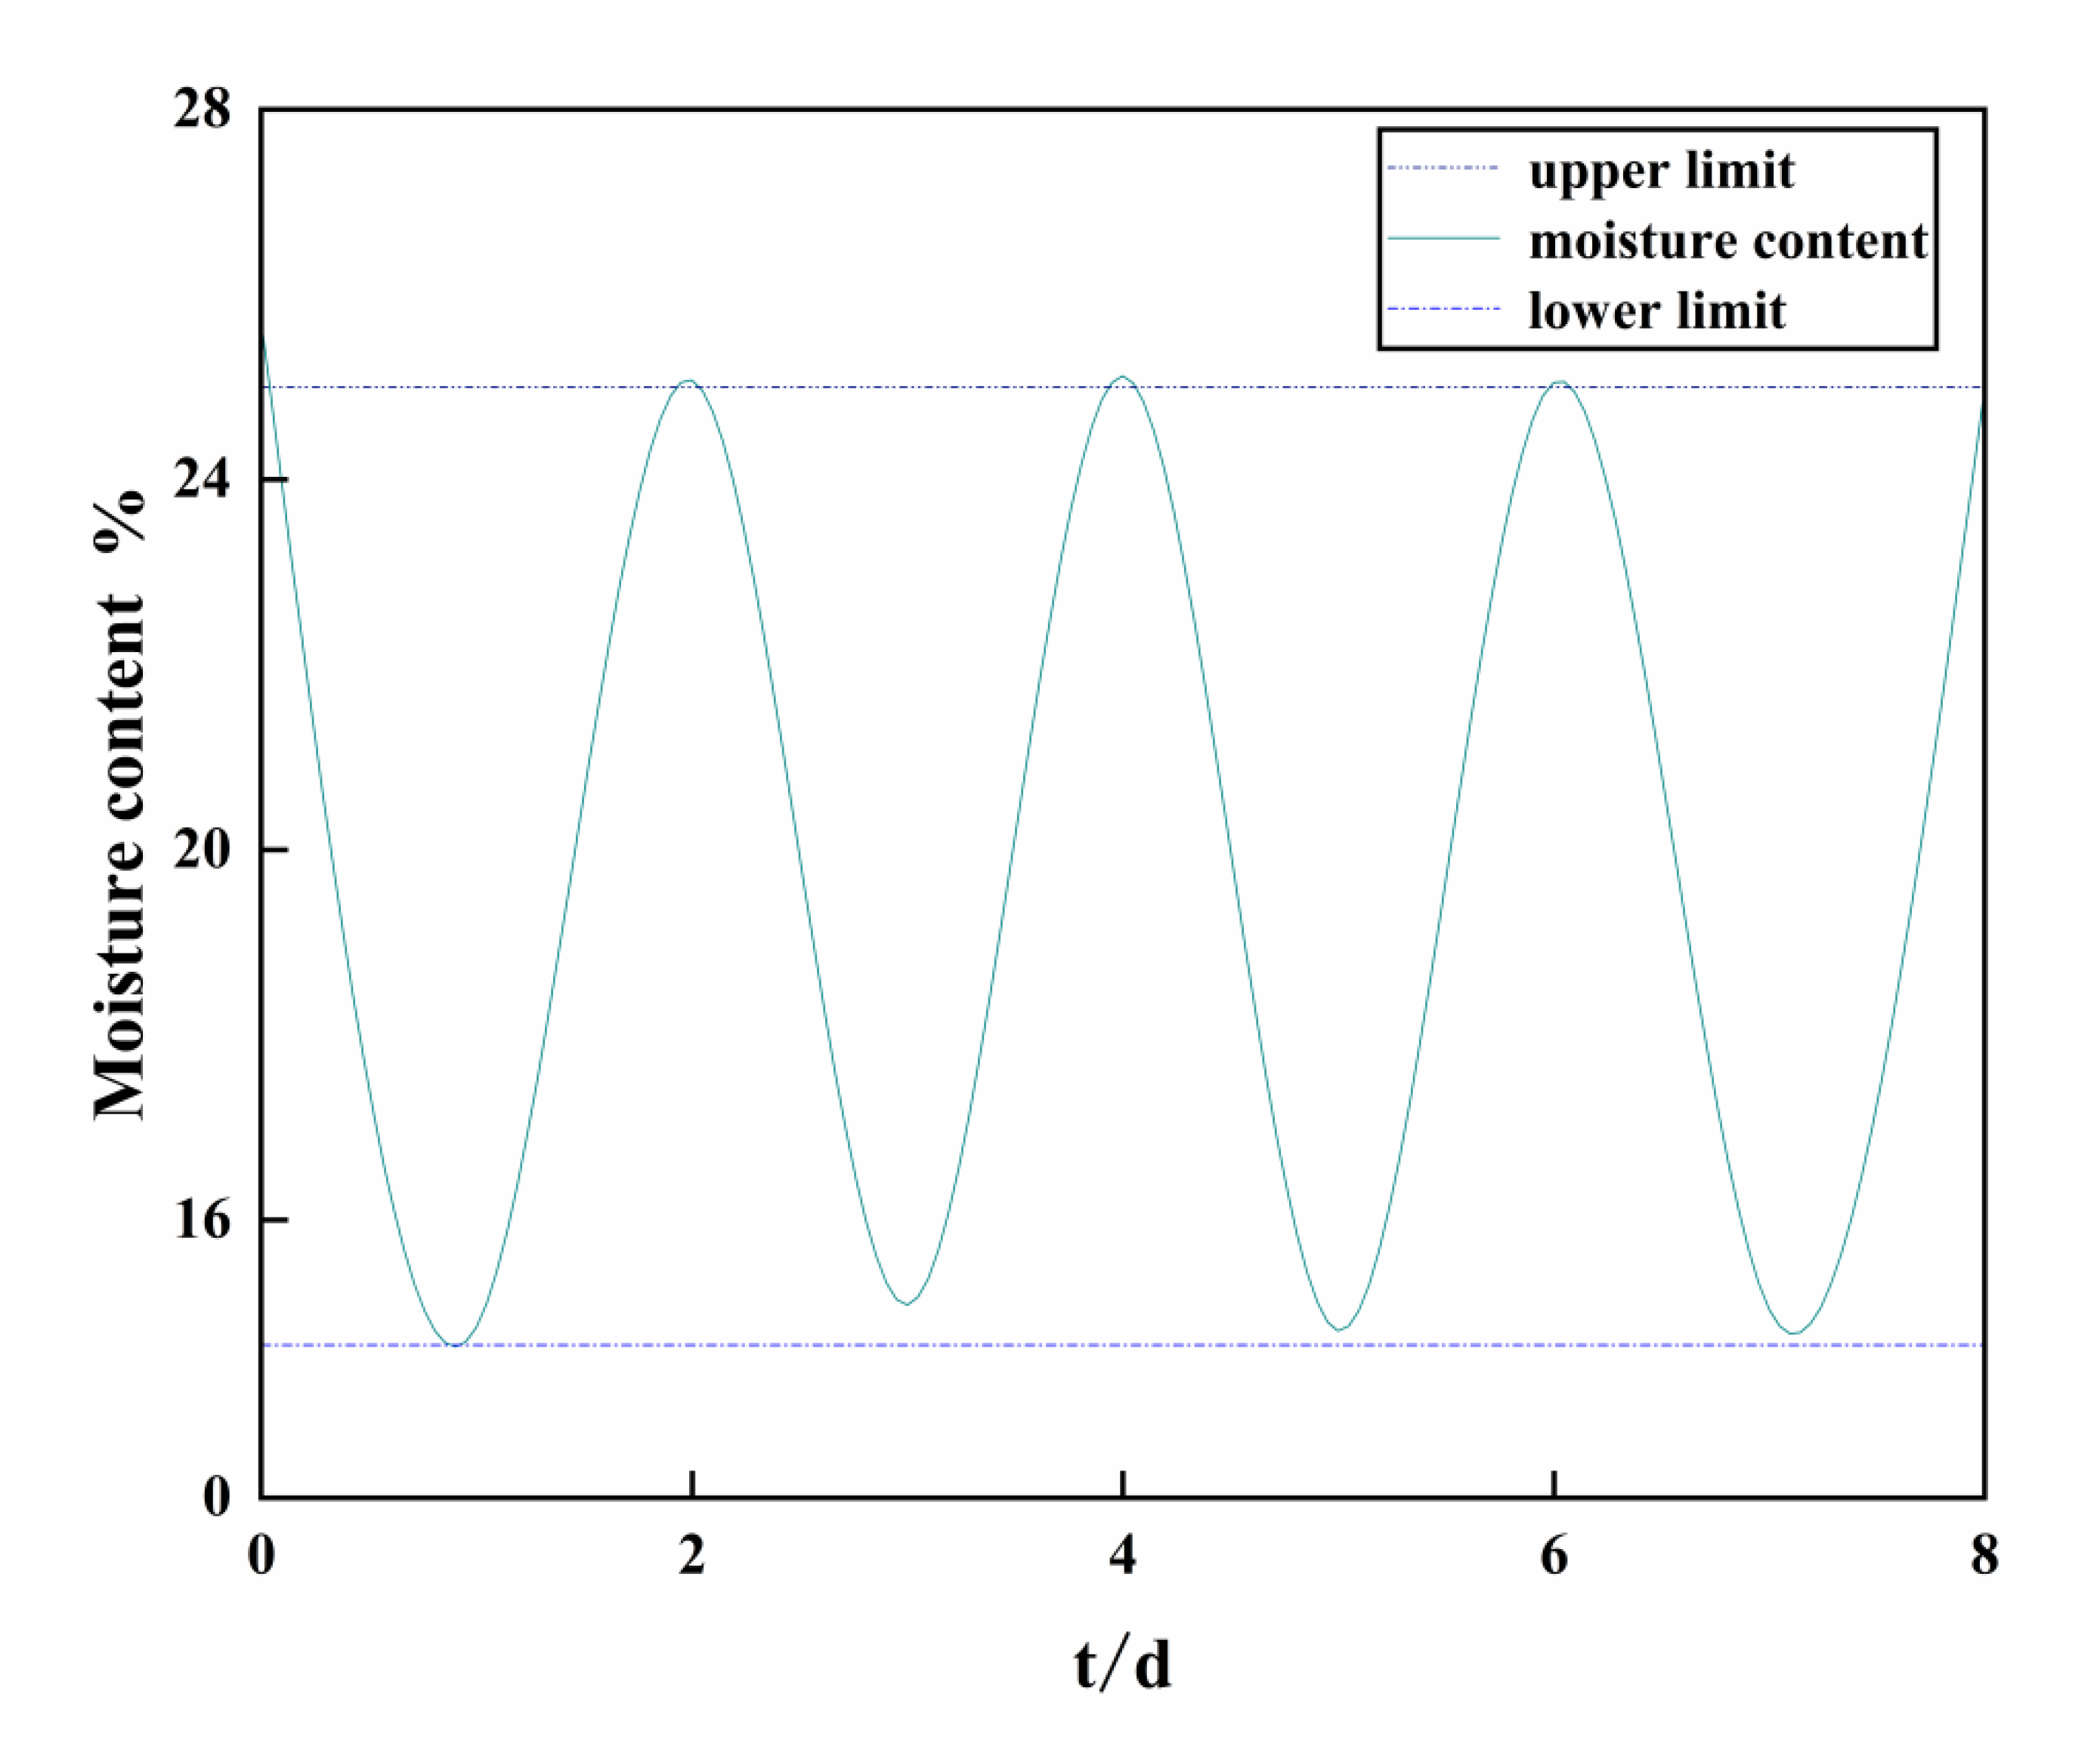
2.3. Test Procedure
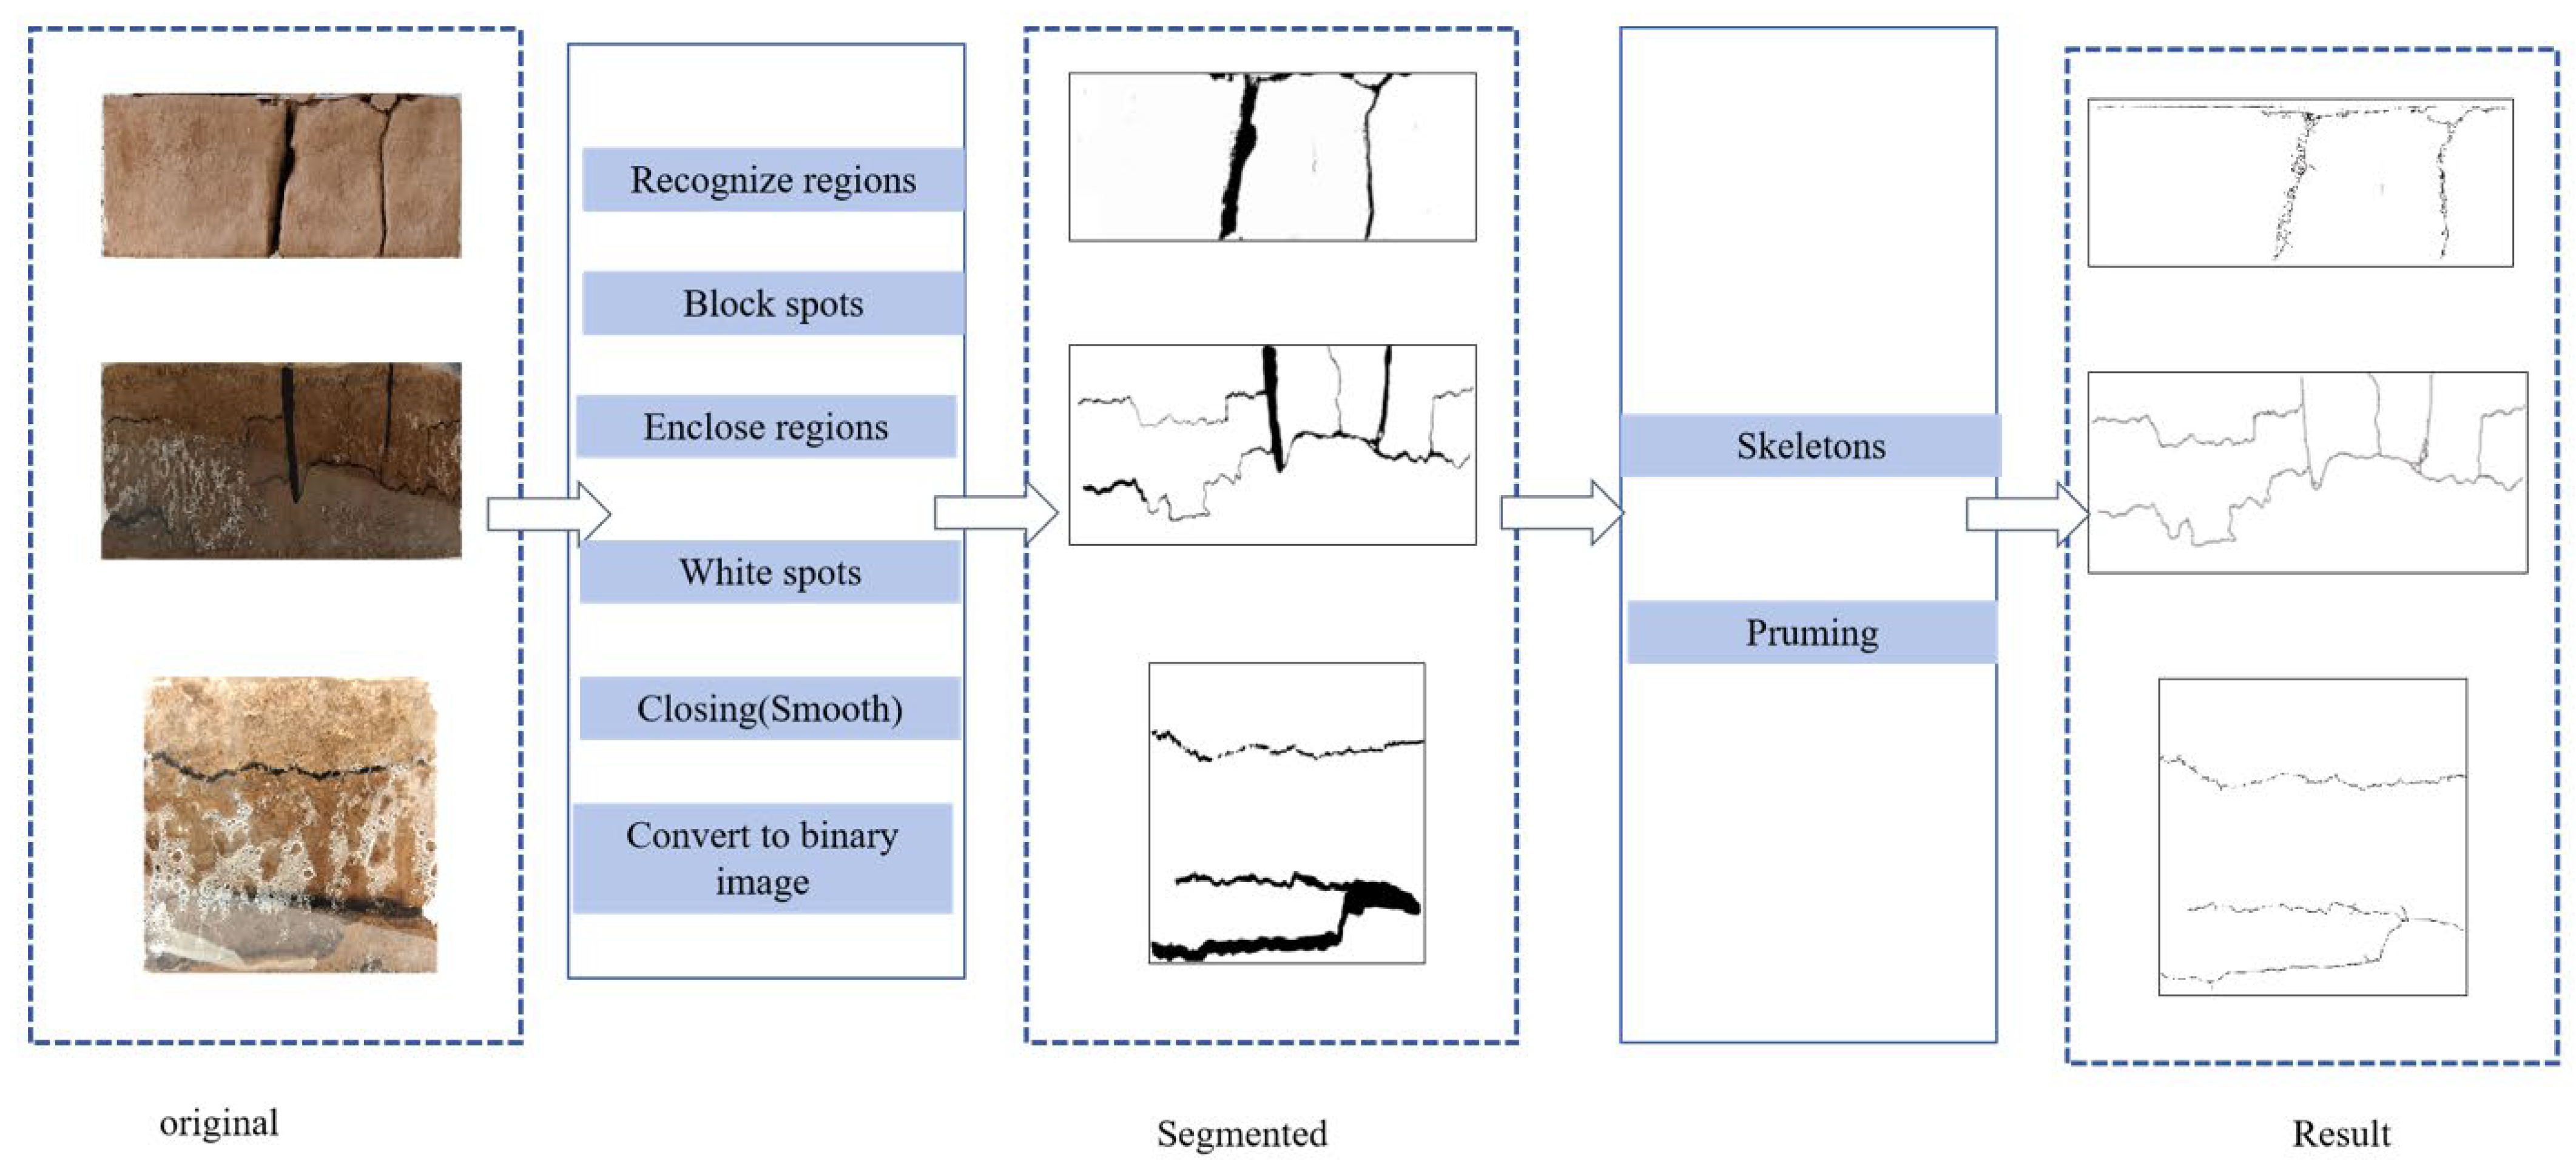
2.4. Extraction Method of Crack Development Parameters
2.5. Theoretical Formula
3. Result
3.1. Evolution of Mean Width of Cracks
3.2. Crack Rate
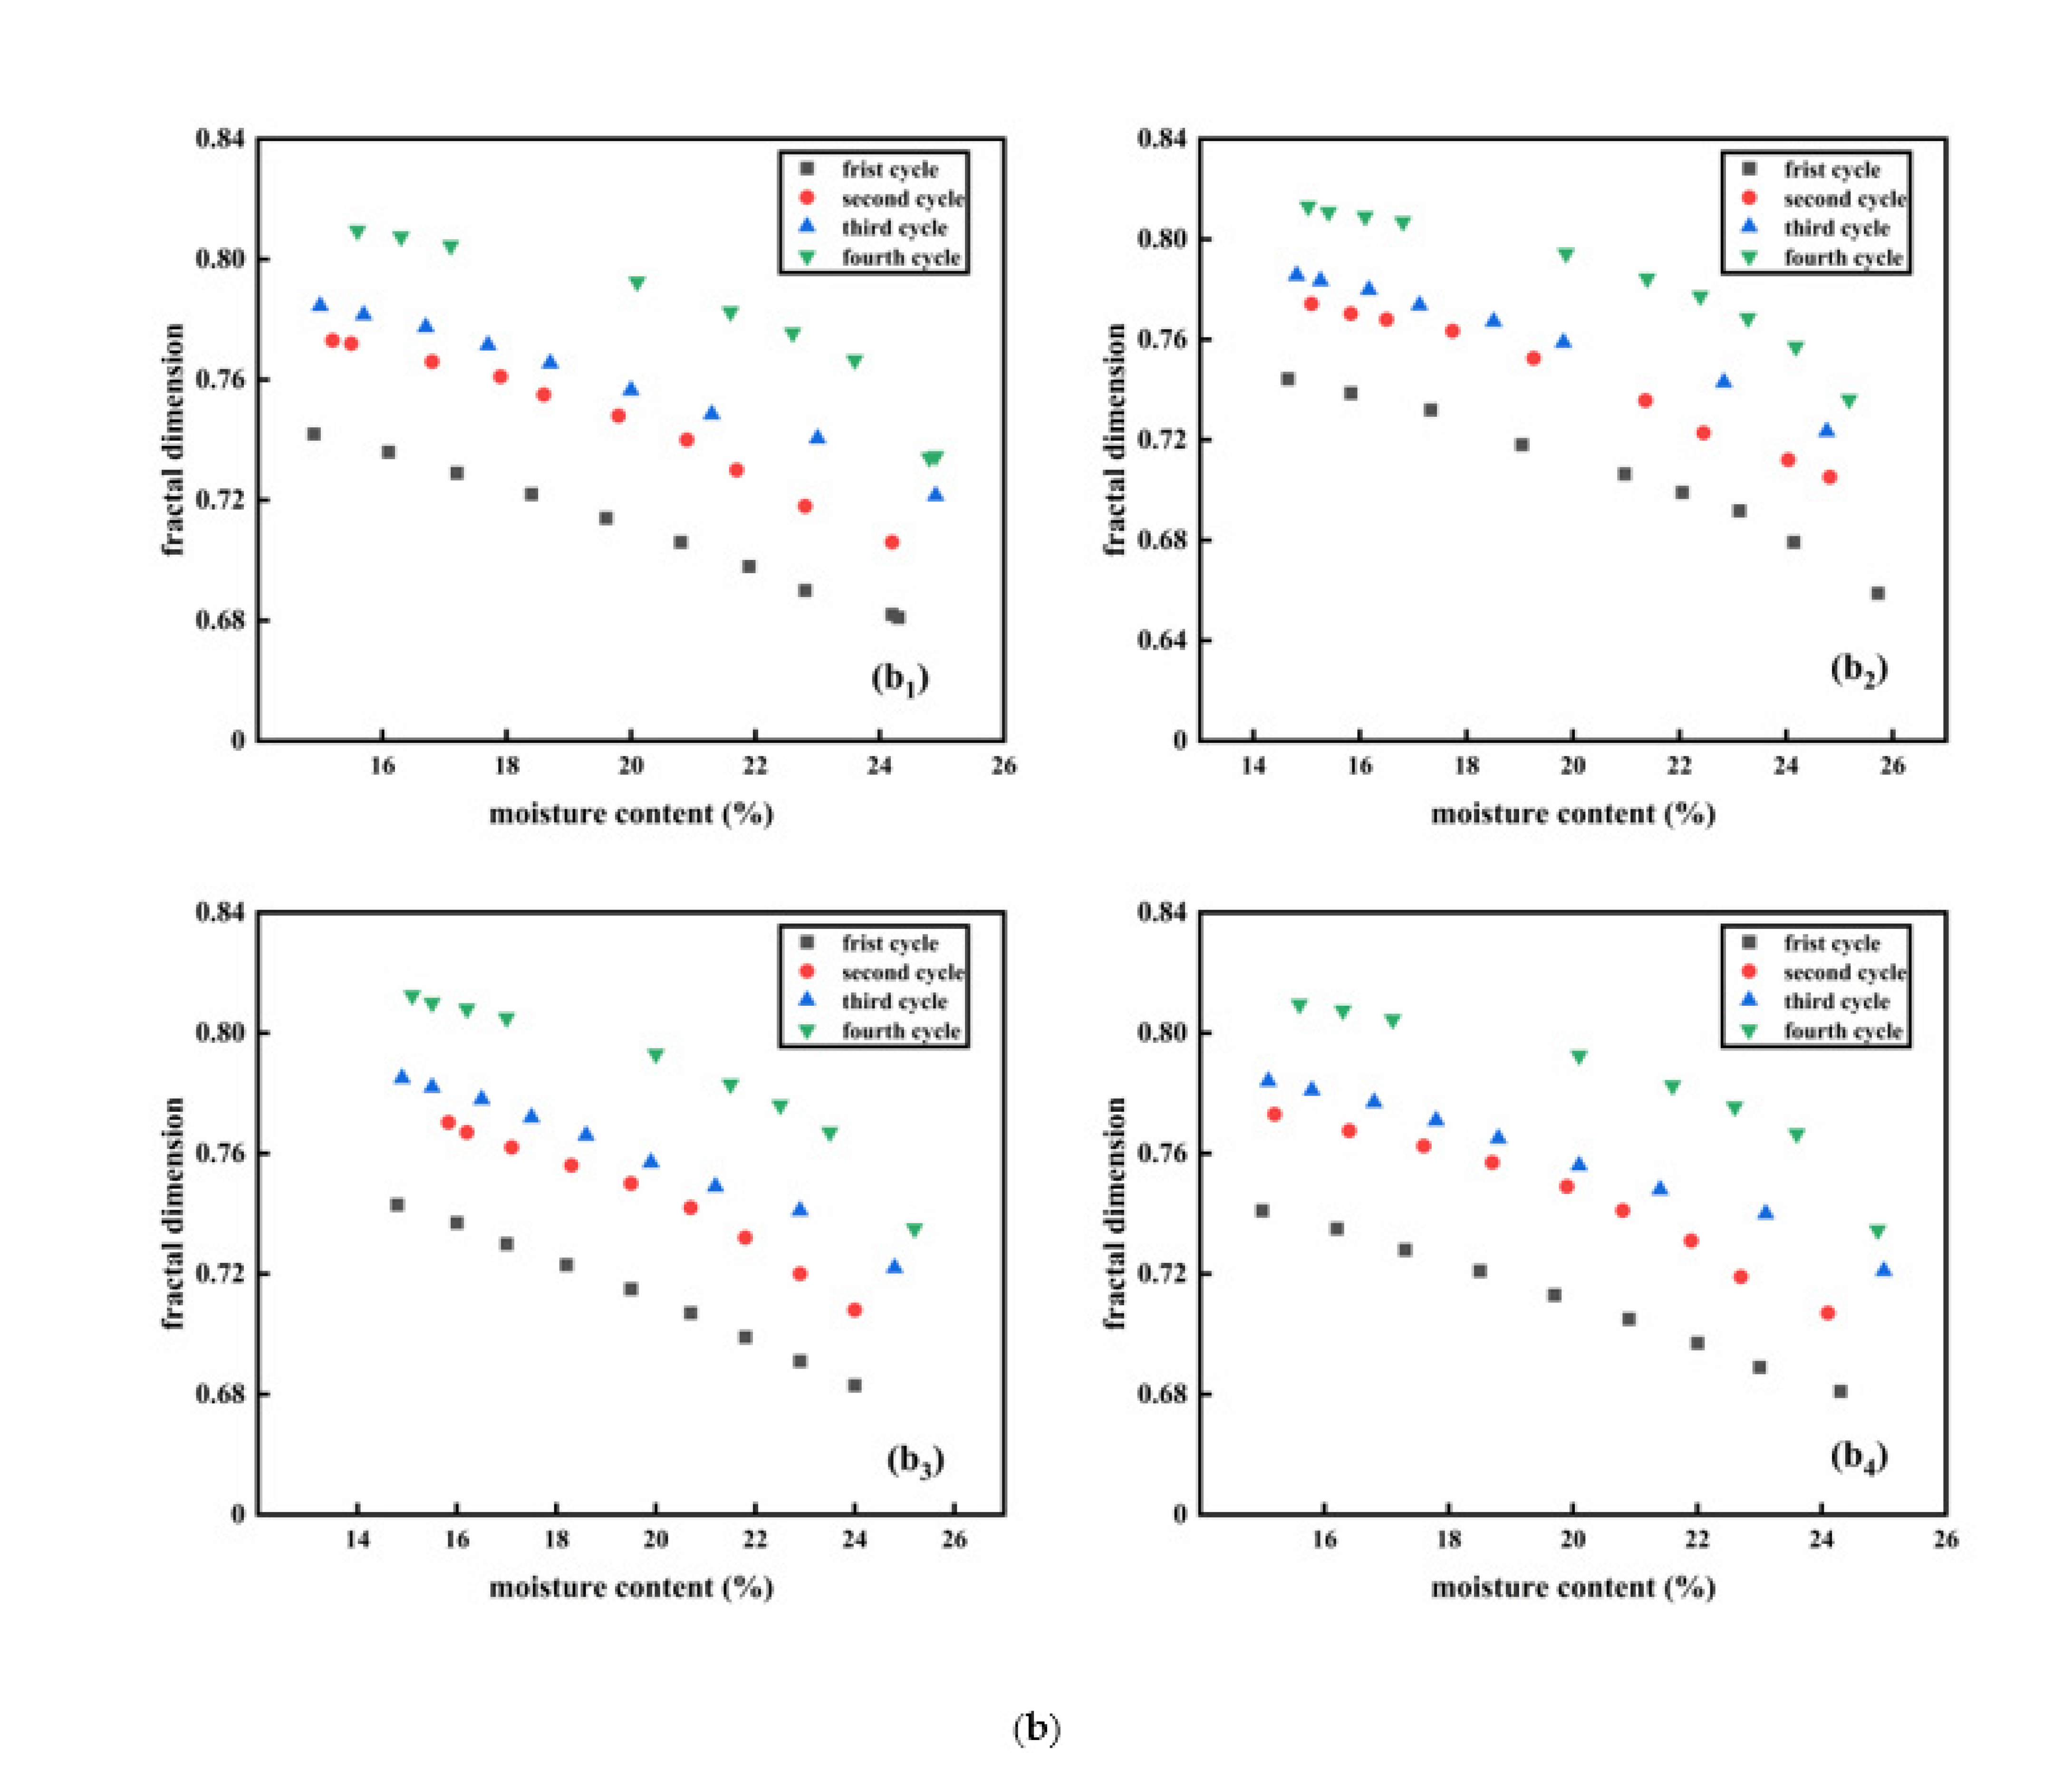
3.3. The Outcomes of the Calculation for Fractal Dimension
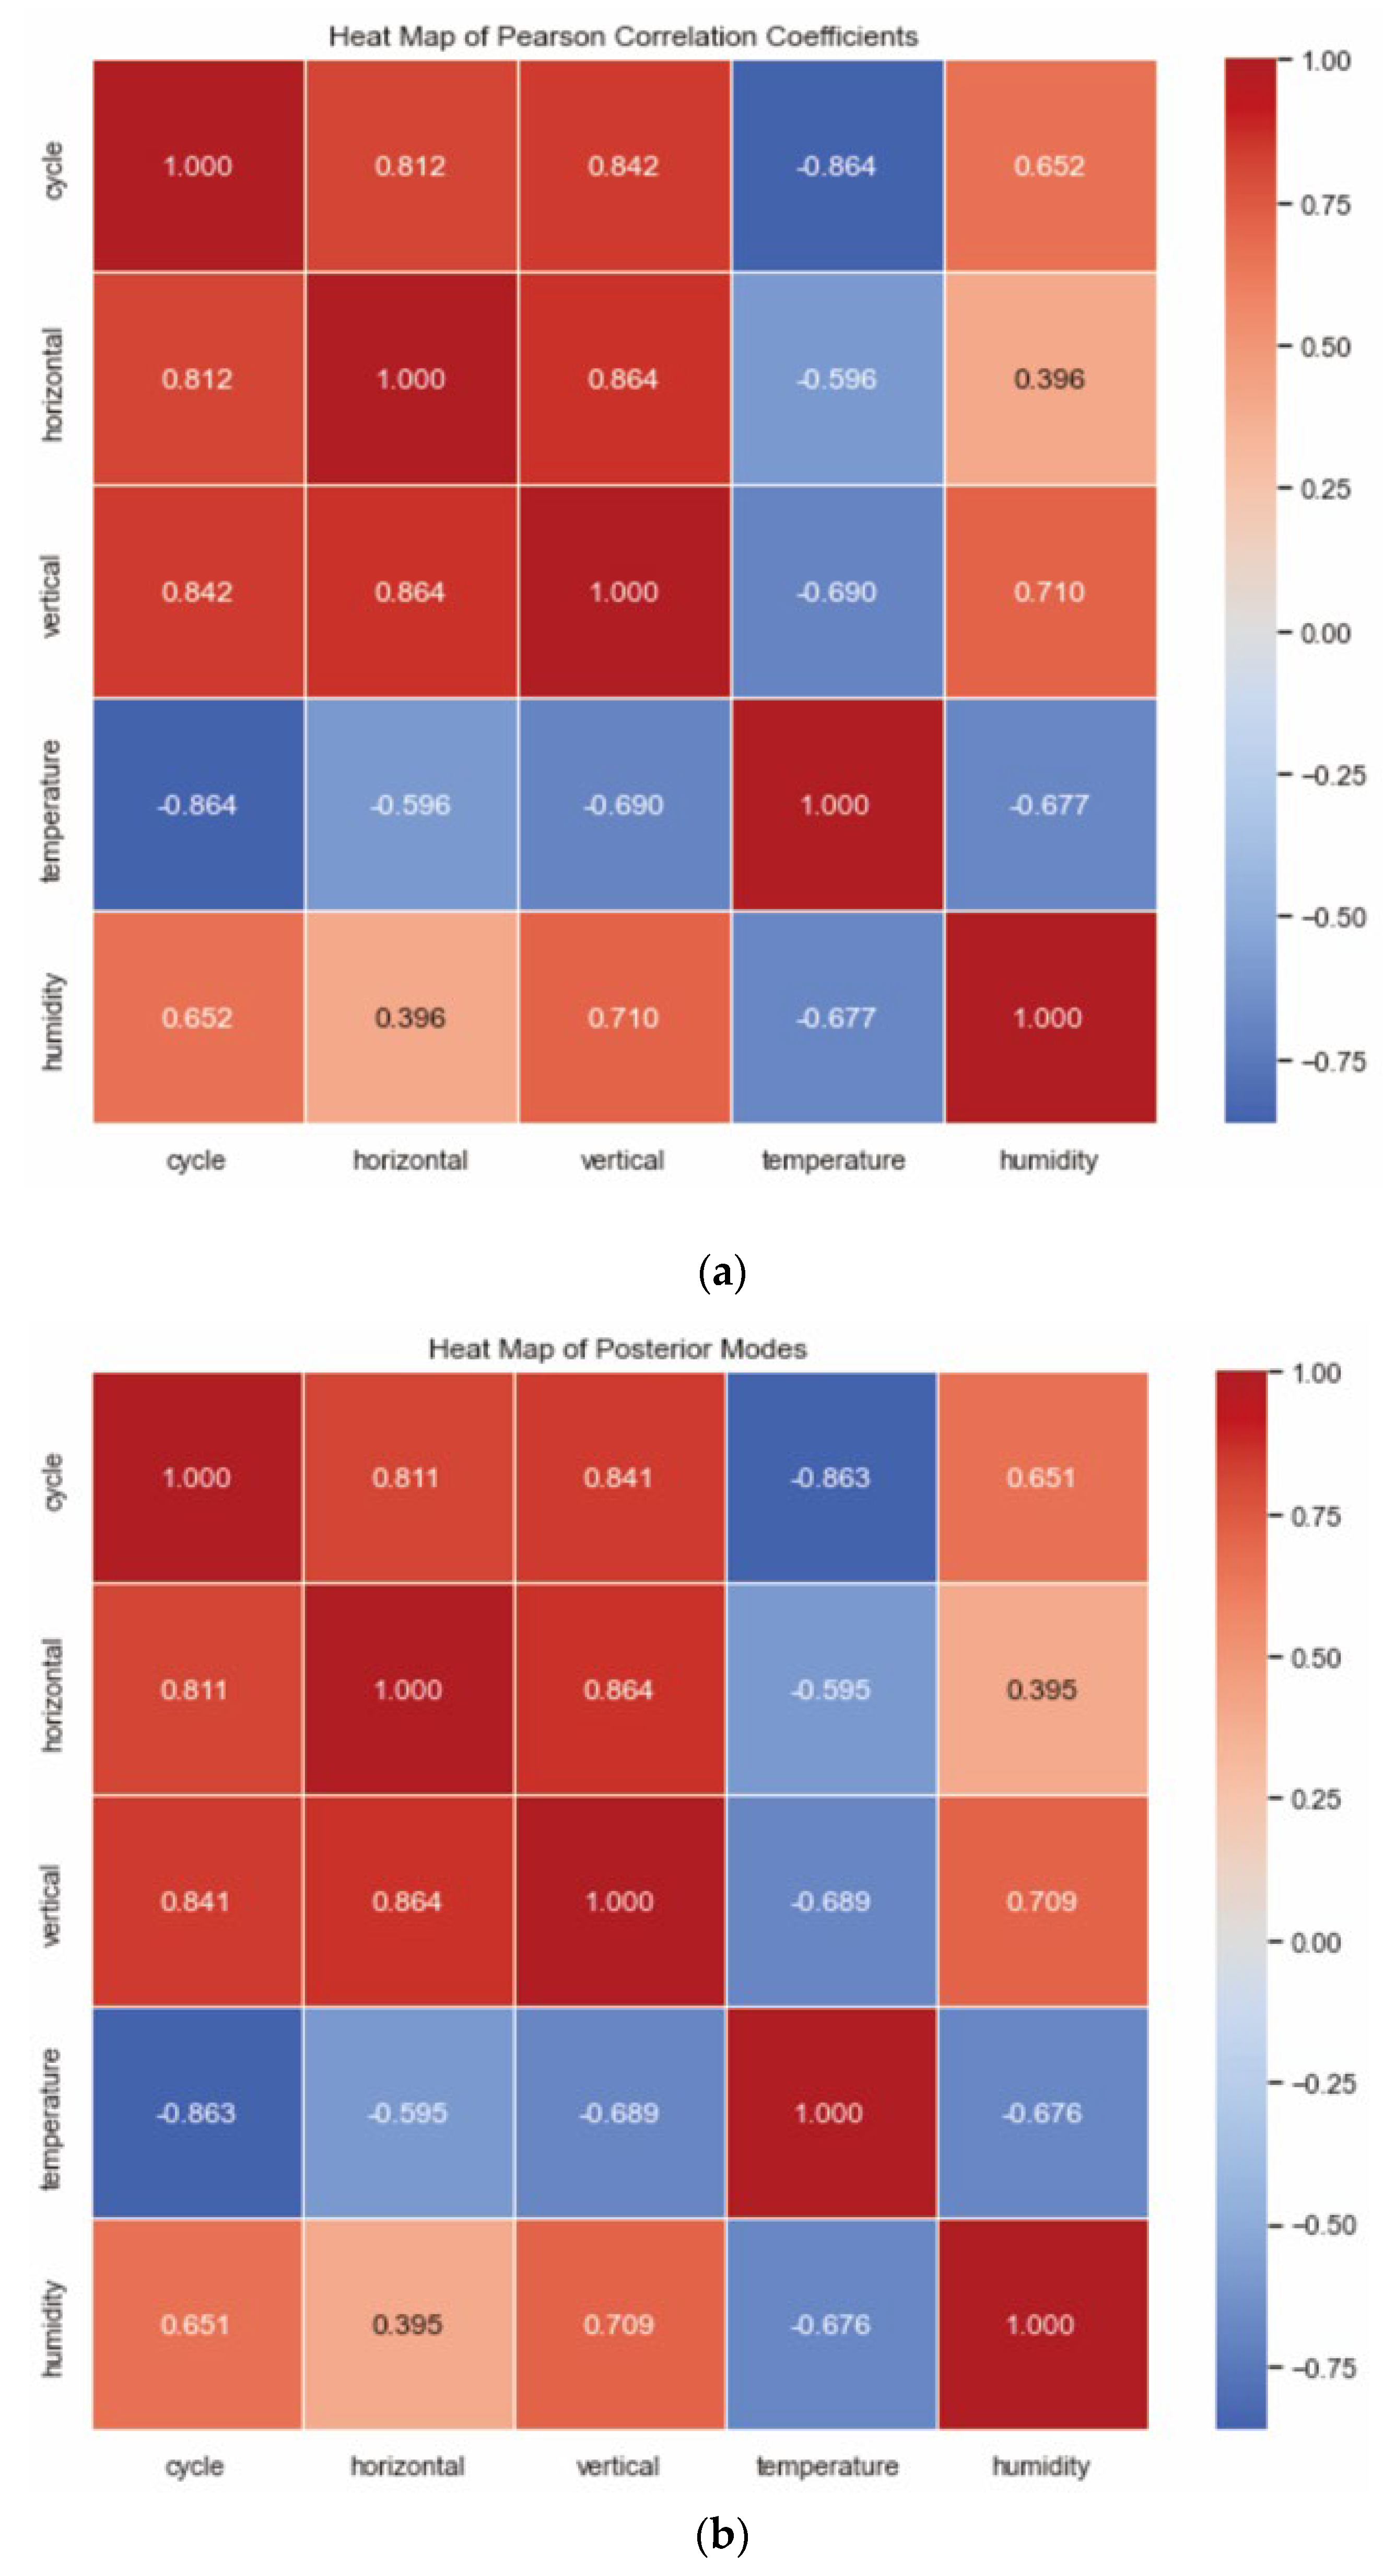
3.4. The Correlation of Temperature and Humidity with the Crack Parameters
4. Discussion
5. Conclusions
Supplementary Materials
Author Contributions
Funding
Data Availability Statement
Conflicts of Interest
References
- Cheng, Y.; Huo, A.; Zhao, Z.; Peng, J. Analysis of loess fracture on slope stability based on centrifugal model tests. Bull. Eng. Geol. Environ. 2021, 80, 3647–3657. [Google Scholar] [CrossRef]
- Fan, W.; Deng, L.; Yuan, W. Double parameter binary-medium model of fissured loess. Eng. Geol. 2018, 236, 22–28. [Google Scholar] [CrossRef]
- Wang, L.; Li, X.A.; Qin, B.; Zheng, H.; Zheng, Z. Genesis and evolution mechanism of loess tunnels in the Loess Plateau, China. Catena 2024, 239, 107919. [Google Scholar] [CrossRef]
- Zhang, Y.; Hu, Z.; Li, L.; Xue, Z. Improving the structure and mechanical properties of loess by acid solutions—An experimental study. Eng. Geol. 2018, 244, 132–145. [Google Scholar] [CrossRef]
- Liu, K.; Ye, W.; Jing, H. Multiscale evaluation of the structural characteristics of intact loess subjected to wet/dry cycles. Nat. Hazards 2024, 120, 1215–1240. [Google Scholar] [CrossRef]
- Li, H.; Yang, M.; Dang, T. Influence of the fracture on the seepage stability of loess slopes. Front. Mater. 2023, 10, 1193527. [Google Scholar] [CrossRef]
- Qin, B.; Li, X.A.; Wang, L.; Gao, R.; Chai, H. Model interpretation and microscopic characteristics of collapsibility evolution of compacted loess under dry-wet cycles. Catena 2024, 246, 108413. [Google Scholar] [CrossRef]
- Zhou, W.; Cheng, J.; Zhang, G.; Li, H.; Cheng, Y.; Ma, G.; Ji, X. Effects of wetting–drying cycles on the breakage characteristics of slate rock grains. Rock Mech. Rock Eng. 2021, 54, 6323–6337. [Google Scholar] [CrossRef]
- Wang, X.; Zhan, H.; Wang, J.; Li, P. On the mechanical damage to tailings sands subjected to dry–wet cycles. Bull. Eng. Geol. Environ. 2019, 78, 4647–4657. [Google Scholar] [CrossRef]
- Lu, Q.Z.; Peng, J.B.; Chen, Z.X.; Li, X.A. Research on Characteristics of Cracks and Fissures of Loess and Their Distribution in Loess Plateau of China. J. Soil Water Conserv. 2005, 19, 193–196. [Google Scholar]
- Wang, Y.; Chen, Y.; He, Y.; Li, C. Experimental Study of Loess Mechanical Properties with Different Water Content. KSCE J. Civ. Eng. 2024, 28, 2210–2220. [Google Scholar] [CrossRef]
- Wei, L.; Zeng, Z.; Yan, J. Factors Affecting the Stability of Loess Landslides: A Review. Appl. Sci. 2024, 14, 2735. [Google Scholar] [CrossRef]
- Mao, Y.C.; Li, G.Y.; Lei, J.X.; Zhang, L.R.; Chen, Z.Y. Experimental study on the effects of wetting-drying cycles of compacted loess. Adv. Mater. Res. 2014, 831, 326–330. [Google Scholar] [CrossRef]
- Wei, X.; Zhou, Y.; Chen, X. An Experimental and Numerical Investigation of the Characteristics and Mechanism of Spacing Cracks in Loess Considering the Size Effect. Sustainability 2023, 15, 12482. [Google Scholar] [CrossRef]
- Wu, R.; Zhang, Y.S.; Zhang, J.C.; Zhang, T. Tests on strength properties of fractured loess in Songpan area, western Sichuan. Sci. Technol. Eng. 2019, 19, 236–242. [Google Scholar]
- Tang, D.; Deng, L.; Fan, W.; Yang, Y.; Fang, R. Extension mechanism and failure mode investigation on a fissured loess slope induced by loading. Bull. Eng. Geol. Environ. 2024, 83, 294. [Google Scholar] [CrossRef]
- Hu, Z.; Li, H.; Yin, Y.; Zhang, B.; Zhang, L. Study on the mechanical properties and microstructural evolution of loess under different wet–dry and freeze–thaw coupled cycling paths. Case Stud. Constr. Mater. 2024, 21, e03924. [Google Scholar]
- Su, L.J.; Zhao, Q.; Liu, H.; Qian, W.J.; He, J.T.; Yang, J.X. Swelling and Shrinkage Behaviors and Evolution Law of Crack Morphology of Undisturbed Loess During Wetting-Drying Cycles. J. Tianjin Univ. (Sci. Technol.) 2021, 54, 255–267. [Google Scholar]
- Chen, C.; Wang, L.; Liu, R.; Zhu, P.; Liu, H.; Wang, X.; Yu, J.; Chen, Y. Chloride penetration of concrete exposed to dry-wet cycle with various dry-wet ratios and temperature. Constr. Build. Mater. 2023, 400, 132883. [Google Scholar] [CrossRef]
- Li, J.; Chen, H.; Gao, X.; Ding, Q.; Shan, W.; Guo, H.; Zhuo, J. Cracks evolution and micro mechanism of compacted clay under wet-dry cycles and wet-dry-freeze-thaw cycles. Cold Reg. Sci. Technol. 2023, 214, 103944. [Google Scholar] [CrossRef]
- Rapin, W.; Dromart, G.; Clark, B.C.; Schieber, J.; Kite, E.S.; Kah, L.C.; Thompon, L.M.; Gasnault, O.; Lasue, J.; Meslin, P.-Y.; et al. Sustained wet-dry cycling on early Mars. Nature 2023, 620, 299–302. [Google Scholar] [CrossRef] [PubMed]
- Wanjun, Y.; Yuyu, Z. Effect of Dry-wet Cycle on the Formation of Loess Slope Spalling Hazards. Civ. Eng. J. 2018, 4, 785. [Google Scholar]
- Xu, J.; Hu, K.; Zhou, L.; Li, Y.; Ye, W.; Wang, S. Influence of wet–dry cycles on uniaxial compression behavior of fissured loess. Environ. Earth Sci. 2023, 82, 5. [Google Scholar] [CrossRef]
- Dong, Q.; Sun, X.; Lei, N.; Liu, B. Effect of Dry–Wet Cycling on the Degradation Characteristics and Mechanisms of Red Sandstone. Geofluids 2023, 2023, 9950331. [Google Scholar] [CrossRef]
- Xu, J.; Wu, Z.; Chen, H.; Shao, L.; Zhou, X.; Wang, S. Influence of dry-wet cycles on the strength behavior of basalt-fiber reinforced loess. Eng. Geol. 2022, 302, 106645. [Google Scholar] [CrossRef]
- Mu, Q.Y.; Dong, H.; Liao, H.J.; Zhou, C.; Li, S.B.; Zhang, J.W. Effects of in situ wetting–drying cycles on the mechanical behaviour of an intact loess. Can. Geotech. J. 2022, 59, 1281–1284. [Google Scholar] [CrossRef]
- Kong, L.; Sayem, H.M.; Tian, H. Influence of drying–wetting cycles on soil-water characteristic curve of undisturbed granite residual soils and microstructure mechanism by nuclear magnetic resonance (NMR) spin-spin relaxation time (T 2) relaxometry. Can. Geotech. J. 2018, 55, 208–216. [Google Scholar] [CrossRef]
- Gao, H.T. Multi-scale research on crack propagation of loess under dry-wet cycles. J. Liaoning Tech. Univ. (Nat. Sci.) 2023, 42, 53–60. [Google Scholar]
- Qin, P.; Liu, Y.; Yan, Q.; Xuan, L. Effect of cycles of drying at high temperature and wetting at ambient temperature on volume change and electrical resistivity behaviors of compacted loess. J. Eng. Geol. 2023, 31, 358–367. [Google Scholar]
- Zhao, Y.; Zhang, H.; Wang, G.; Yang, Y.; Ouyang, M. Development Characteristics and Mechanism of Crack in Expansive Soil under Wet–Dry Cycling. Appl. Sci. 2024, 14, 6499. [Google Scholar] [CrossRef]
- Hou, J.; Li, J.; Zhao, L. Experimental study on seepage-stress coupling failure characteristics and fracture fractal characteristics of cemented gangue-fly ash backfill with defects. Theor. Appl. Fract. Mech. 2022, 122, 103658. [Google Scholar] [CrossRef]
- Zhang, J.; Xu, A.; Zhao, C.; Wang, W.; Jiang, Y.; Vandeginste, V.; Xue, Z.; Guo, Y.; Miao, H. A new parameter for characterizing pore-fracture structure heterogeneity: Fractal dimension based on the mercury extrusion curve. Front. Earth Sci. 2024; Advance online publication. [Google Scholar] [CrossRef]
- Ma, G.; Ma, C.; Chen, Y. An investigation of nonlinear flow behaviour along rough-walled fractures considering the effects of fractal dimensions and contact areas. J. Nat. Gas Sci. Eng. 2022, 104, 104675. [Google Scholar] [CrossRef]
- Wu, X.; Wang, F. Research on the Capacity of Shale Fracture Network based on Fractal Dimension. J. Phys. Conf. Ser. 2023, 2651, 012081. [Google Scholar] [CrossRef]
- Liu, T.; Li, Y.; Chen, Z.; Zhang, J.; Lyu, L.; Pei, J. Damage evolution in asphalt mixtures based on in-situ CT scanning. Constr. Build. Mater. 2024, 438, 137266. [Google Scholar] [CrossRef]
- Maity, R.; Singh, A.; Paul, S.K. An innovative approach to planar mixed-mode fatigue crack growth study. Int. J. Fatigue 2024, 184, 108316. [Google Scholar] [CrossRef]
- Gao, D.Z. Revisions of the Code for Investigation of Geotechnical Engineering (GB50021-2001). J. Build. Struct. 2012, 62–65. [Google Scholar]
- Sun, Y.; Yu, C.; Jiang, S.; Chen, Y.; Wang, Z.; Duan, S.; Xie, J. Disintegration behaviors of red clay under wet-dry cycles. J. Rock Mech. Geotech. Eng. 2024, 09, 005. [Google Scholar]
- Liu, C.; Tang, C.S.; Shi, B.; Suo, W.B. Automatic quantification of crack patterns by image processing. Comput. Geosci. 2013, 57, 77–80. [Google Scholar] [CrossRef]
- Ajayi, K.M.; Shahbazi, K.; Tukkaraja, P.; Katzenstein, K. Estimation of radon diffusivity tensor for fractured rocks in cave mines using a discrete fracture network model. J. Environ. Radioact. 2019, 196, 104–112. [Google Scholar] [CrossRef]
- Zhang, J.; Xia, Y.; Zhao, C.; He, Y. Tight carbonate reservoir evaluation case study based on neural network assisted fracture identification and analytic hierarchy process. J. Pet. Explor. Prod. Technol. 2024, 14, 1825–1842. [Google Scholar] [CrossRef]
- Xu, H.; Tang, S.; Wang, J.; Dong, B.; Wang, X.; Zhao, K.; Zhu, Y.; Geng, J. Rock fracture identification algorithm based on the confidence score and non-maximum suppression. Bull. Eng. Geol. Enviroan. 2024, 83, 1–20. [Google Scholar] [CrossRef]
- Xie, J.; Hao, X.; Zhang, Y.; Zhang, J.; Xia, Y.; He, Y. Fracture identification and characteristics of carbonate underground gas storage: An example from the eastern area of Sulige gas field, ordos Basin, China. Sci. Rep. 2023, 13, 22446. [Google Scholar] [CrossRef]
- Zhang, Y.; Ma, J.; Wang, Y.; Wang, Y.; Wang, F.; Li, X.; Zhao, L. Quantification of the Fracture Complexity of Shale Cores After Triaxial Fracturing. Front. Earth Sci. 2022, 10, 863773. [Google Scholar] [CrossRef]
- Lim, M.; Kartiwa, A.; Napitupulu, H. Estimation of Citarum Watershed Boundary’s Length Based on Fractal’s Power Law by the Modified Box-Counting Dimension Algorithm. Mathematics 2023, 11, 384. [Google Scholar] [CrossRef]
- Bermudez-Edo, M.; Barnaghi, P.; Moessner, K. Analysing real world data streams with spatio-temporal correlations: Entropy vs. Pearson correlation. Autom. Constr. 2018, 88, 87–100. [Google Scholar] [CrossRef]
- Lissa, V.J.C.; Clapper, B.E.; Kuiper, R. A tutorial on aggregating evidence from conceptual replication studies using the product Bayes factor. Res. Synth. Methods 2024, 15, 1231–1243. [Google Scholar] [CrossRef]
- Kass, R.E.; Raftery, A.E. Bayes factors. J. Am. Stat. Assoc. 1995, 90, 773–795. [Google Scholar] [CrossRef]
- Wei, Z.; Zhou, W.; Xu, P.; Lei, M.; Yao, H. The arsenic determination in glass beads for pavement marking by two-factor ANOVA via hydride generation high-resolution continuous light source atomic absorption spectrometry. Constr. Build. Mater. 2025, 458, 139549. [Google Scholar] [CrossRef]


| Particle Size (mm) | Content Proportion (%) | Liquid Limit | Plastic Limit | Plasticity Index | Designation |
|---|---|---|---|---|---|
| 10 mm WL | Wp | IP | |||
| 0.25–0.075 | 15.3 | 30.8 | 18.3 | 12.5 | silty clay |
| 0.075–0.005 | 60.5 | ||||
| <0.005 | 24.2 |
| Items | Parameters | |
|---|---|---|
| Camera | Brand | iQOO 12, vivo |
| Maximum resolution | 4500 × 3072 pixel | |
| Field of view | 90°, 180° | |
| Balance | Brand | Lichen |
| LT1002 | 0.01 g | |
| Mold | Material | Dimension |
| plexiglass | 8 × 8 × 20 cm | |
| Homogenous transparent glass cover | Material | Dimension |
| glass | 40 × 23 × 25 cm | |
| Frist Cycle | Second Cycle | Third Cycle | Fourth Cycle | |||||
|---|---|---|---|---|---|---|---|---|
| Horizontal | Vertical | Horizontal | Vertical | Horizontal | Vertical | Horizontal | Vertical | |
| 0 | 0.24 | 0.52 | 9.24 | 2.32 | 11.94 | 6.04 | 13.75 | 8.04 |
| 1 | 2.48 | 1.24 | 10.60 | 3.04 | 14.06 | 6.40 | 16.54 | 10.56 |
| 2 | 4.74 | 1.98 | 11.66 | 4.72 | 15.66 | 7.06 | 17.24 | 11.98 |
| 3 | 7.92 | 2.68 | 13.38 | 5.96 | 16.92 | 8.78 | 18.08 | 14.68 |
| 4 | 10.50 | 2.92 | 15.96 | 6.08 | 17.40 | 9.32 | 18.46 | 16.16 |
| 5 | 13.10 | 3.02 | 16.52 | 6.24 | 18.06 | 10.18 | 18.88 | 16.68 |
| Subject Effects Test | |||||||
|---|---|---|---|---|---|---|---|
| Dependent Variable: Horizontal Crack | |||||||
| Source | Type III Sum of Squares | df | Mean Square | F | Significance | Noncentrality Parameter | Observed Powerb |
| Corrected Model | 905.568a | 80 | 11.32 | 138.717 | 0 | 11,097.34 | 1 |
| Intercept | 1636.497 | 1 | 1636.497 | 20054.545 | 0 | 20,054.55 | 1 |
| temperature | 46.074 | 38 | 1.212 | 14.858 | 0 | 564.613 | 1 |
| humidity | 26.272 | 35 | 0.751 | 9.199 | 0 | 321.95 | 1 |
| cycle | 19.84 | 3 | 6.613 | 81.044 | 0 | 243.131 | 1 |
| Error | 10.527 | 129 | 0.082 | 1 | |||
| Total | 10,604.75 | 210 | |||||
| Corrected Total | 916.095 | 209 | |||||
| a R2 = 0.989(Adjusted R2 = 0.981) | |||||||
| b Calculated using Alpha = 0.05 | |||||||
| Subject Effects Test | |||||||
|---|---|---|---|---|---|---|---|
| Dependent Variable: Vertical Crack | |||||||
| Source | Type III Sum of Squares | df | Mean Square | F | Significance | Noncentrality Parameter | Observed Powerb |
| Corrected Model | 796.852a | 80 | 9.96 | 451.482 | 0 | 36,118.58 | 1 |
| Intercept | 388.44 | 1 | 388.44 | 17,607.24 | 0 | 17,607.24 | 1 |
| temperature | 29.898 | 38 | 0.787 | 35.664 | 0 | 1355.23 | 1 |
| humidity | 50.208 | 35 | 1.435 | 65.024 | 0 | 2275.828 | 1 |
| cycle | 8.616 | 3 | 2.872 | 130.185 | 0 | 390.554 | 1 |
| Error | 2.846 | 129 | 0.022 | ||||
| Total | 3345.988 | 210 | |||||
| Corrected Total | 799.671 | 209 | |||||
| a R2 = 0.996 (Adjusted R2 = 0.994) | |||||||
| b Calculated using Alpha = 0.05 | |||||||
Disclaimer/Publisher’s Note: The statements, opinions and data contained in all publications are solely those of the individual author(s) and contributor(s) and not of MDPI and/or the editor(s). MDPI and/or the editor(s) disclaim responsibility for any injury to people or property resulting from any ideas, methods, instructions or products referred to in the content. |
© 2025 by the authors. Licensee MDPI, Basel, Switzerland. This article is an open access article distributed under the terms and conditions of the Creative Commons Attribution (CC BY) license (https://creativecommons.org/licenses/by/4.0/).
Share and Cite
Zhang, C.; Lin, D.; Zhao, G.; Qi, Z.; Suo, K.; Liu, H.; Jiang, C. Experimental Study on the Evolution Law of Loess Cracks Under Dry–Wet Cycle Conditions. Water 2025, 17, 796. https://doi.org/10.3390/w17060796
Zhang C, Lin D, Zhao G, Qi Z, Suo K, Liu H, Jiang C. Experimental Study on the Evolution Law of Loess Cracks Under Dry–Wet Cycle Conditions. Water. 2025; 17(6):796. https://doi.org/10.3390/w17060796
Chicago/Turabian StyleZhang, Chunyan, Dantong Lin, Guizhang Zhao, Zhenzhen Qi, Kui Suo, Hao Liu, and Chengyang Jiang. 2025. "Experimental Study on the Evolution Law of Loess Cracks Under Dry–Wet Cycle Conditions" Water 17, no. 6: 796. https://doi.org/10.3390/w17060796
APA StyleZhang, C., Lin, D., Zhao, G., Qi, Z., Suo, K., Liu, H., & Jiang, C. (2025). Experimental Study on the Evolution Law of Loess Cracks Under Dry–Wet Cycle Conditions. Water, 17(6), 796. https://doi.org/10.3390/w17060796