Article

Implementing Best Management Practices in Complex Agricultural Watersheds: Insights from High-Resolution Nitrogen Load Dynamics Analysis

by
Wanqi Shen
1,
Ruidong Chen
1,
Xingchen Zhao
1,
Xiaoming Lu
2,
Hao Yan
2 and
Lachun Wang
1,*
1
School of Geography and Ocean Science, Nanjing University, Nanjing 210023, China
2
Jiangsu Province Hydrology and Water Resources Investigation Bureau, Nanjing 210029, China
*
Author to whom correspondence should be addressed.
Water 2025, 17(6), 821; https://doi.org/10.3390/w17060821
Submission received: 22 January 2025 / Revised: 2 March 2025 / Accepted: 5 March 2025 / Published: 12 March 2025

Abstract

:
Agricultural activities such as fertilization and cultivation constitute a substantial source of non-point source (NPS) nitrogen (N) in aquatic ecosystems. Precise quantification of fluxes across diverse land uses and identification of critical source areas are essential for effectively mitigating nitrogen loads. In this study, the Soil Water Assessment Tool (SWAT) was employed to accurately model the watershed hydrology and total nitrogen (TN) transport in the Zhongtian River Basin, i.e., an agricultural watershed characterized by low mountainous terrain. The simulation results indicated that the average TN load intensity within the watershed was 21.34 kg ha−1 yr−1, and that TN load intensities for paddy fields and tea plantation were 34.96 and 33.04 kg ha−1 yr−1, respectively. Agricultural land, which covered 32.06% of the area, disproportionately contributed 52.88% of the N output in the watershed. Pearson and redundancy analysis (RDA) underscored land use as the primary driver of nitrogen emissions, with a contribution exceeding 50%. Building on a high-precision simulation analysis, a suite of best management practices (BMPs) was established. These findings highlight the superior performance of engineered BMPs over agricultural BMPs, with TN load reduction rates of 12.23 and 27.07% for filter strips and grassed waterways, respectively. Among three agricultural BMPs, the effect of fertilizer reduction was the most pronounced, achieving reductions of 6.44% for TN and 21.26% for nitrate. These results suggest that optimizing fertilizer management and implementing engineered BMPs could significantly reduce nitrogen pollution in agricultural watersheds, providing valuable insights for sustainable agricultural practices and water quality management.

1. Introduction

Excessive nitrogen loading in aquatic ecosystems is a significant anthropogenic alteration of the global environment [1]. Agricultural nutrient pollution has emerged as a primary contributor to non-point source (NPS) pollution in freshwater systems, particularly in regions where agricultural intensification has led to increased nutrient inputs, affecting >50% of the global freshwater systems [2,3]. Excessive fertilizer application can lead to nutrient accumulation in soils, which are subsequently transported to freshwater systems through runoff and leaching. Additionally, intensive cultivation practices (e.g., tillage and plowing) contribute to soil erosion and exacerbate nutrient export. Therefore, the enrichment of nitrogen in agricultural systems has emerged as a significant contributor to the eutrophication of lakes and rivers, representing an important environmental concern globally [4].
Nitrogen export from cultivated areas is influenced by a multitude of factors, including land use and cover, agricultural management practices, climate variables [5], soil properties [6] topography. Consequently, understanding the dynamics of nitrogen pollutants within watersheds and identifying contributions from different sources are crucial for the implementation of best management practices (BMPs). However, quantifying the impact of land use and diverse environmental factors on nitrogen loading poses significant challenges, primarily due to the resource-intensive and laborious nature of extensive field experiments. Therefore, comprehensive process-based hydrological models are frequently employed to assess the influence of anthropogenic and environmental factors on watershed hydrology and water quality [7,8]. Among these models, the Soil and Water Assessment Tool (SWAT) is widely recognized as an effective tool for simulating runoff and nitrogen load at the watershed scale. It has been extensively applied at both watershed and regional scales to explore the impacts of land use and management practices on water quality dynamics [9]. In the Taihu Basin, the SWAT has been successfully employed to evaluate the impacts of agricultural activities on nitrogen pollution, identify critical source areas of nitrogen pollution, and assess the effectiveness of various nitrogen management practices in reducing nitrogen losses from paddy fields [10,11].
The Zhongtian River Basin, located in the upper reaches of Tianmu Lake, is a low-mountainous agricultural watershed within the extensive Taihu Lake Basin in the Yangtze River Delta, Eastern China. Rapid economic growth within this region has driven notable expansion of agricultural activities, particularly tea cultivation, which has been accompanied by intensified fertilizer application, aimed at maximizing crop yield. Over the past decade, the tea plantation area along the river has tripled, coinciding with a decline in forested areas [12]. Notably, the average nitrogen fertilizer application rate for tea plantation has surpassed 300 kg N ha−1 yr−1 [10]. Watershed-scale modeling simulations reflecting such extensive agricultural expansion have underscored the potential elevation of the terrestrial nitrogen loading by >30% [13] This shift in land use has been associated with a rapid escalation in total nitrogen (TN) concentrations in water bodies, increasing from <2 mg L−1 to 10 mg L−1 [13]. Tea plantations, which are extensively dispersed across subtropical China, have experienced rapid expansion in recent years [14]. Similar trends have been observed in other major tea-producing regions globally, including India, Sri Lanka, and Kenya [15,16]. Consequently, the proliferation of tea plantations may intensify nitrogen loads in aquatic systems, potentially contributing to eutrophication [17]. Despite the ecological implications, assessments of the impact of tea cultivation on riverine nitrogen dynamics remain limited, and the efficacy of management measures to mitigate this impact is unclear. Therefore, the present study, conducted in the Zhongtian River Basin, investigates the impact of agricultural practices, particularly tea plantations, on nitrogen load. Additionally, a series of best management practices (BMPs), including source management and transport interception strategies, have been evaluated for their effectiveness in reducing nitrogen loads.
This study employed the SWAT model to simulate the effects of various factors, with a particular focus on land use, on the TN load within the Zhongtian River Basin. Furthermore, by leveraging the calibrated SWAT model, a series of agricultural and engineered BMPs were established to investigate effective measures for reducing the nitrogen load within the basin. The specific objectives were to: (i) calibrate and validate the SWAT model for streamflow and TN loads in the study area; (ii) quantify TN loads under various land use types across different seasons; (iii) examine the factors influencing the TN load through Pearson and redundancy analysis (RDA) analyses at the sub-basin and hydrologic response unit (HRU) scales; and (iv) use the calibrated model to simulate different BMP scenarios and assess their effectiveness in reducing TN exports relative to the baseline scenario. By achieving these objectives, this study aims to provide actionable insights for nitrogen management in agricultural watersheds, contributing to the global effort to mitigate non-point source pollution.

2. Materials and Methods
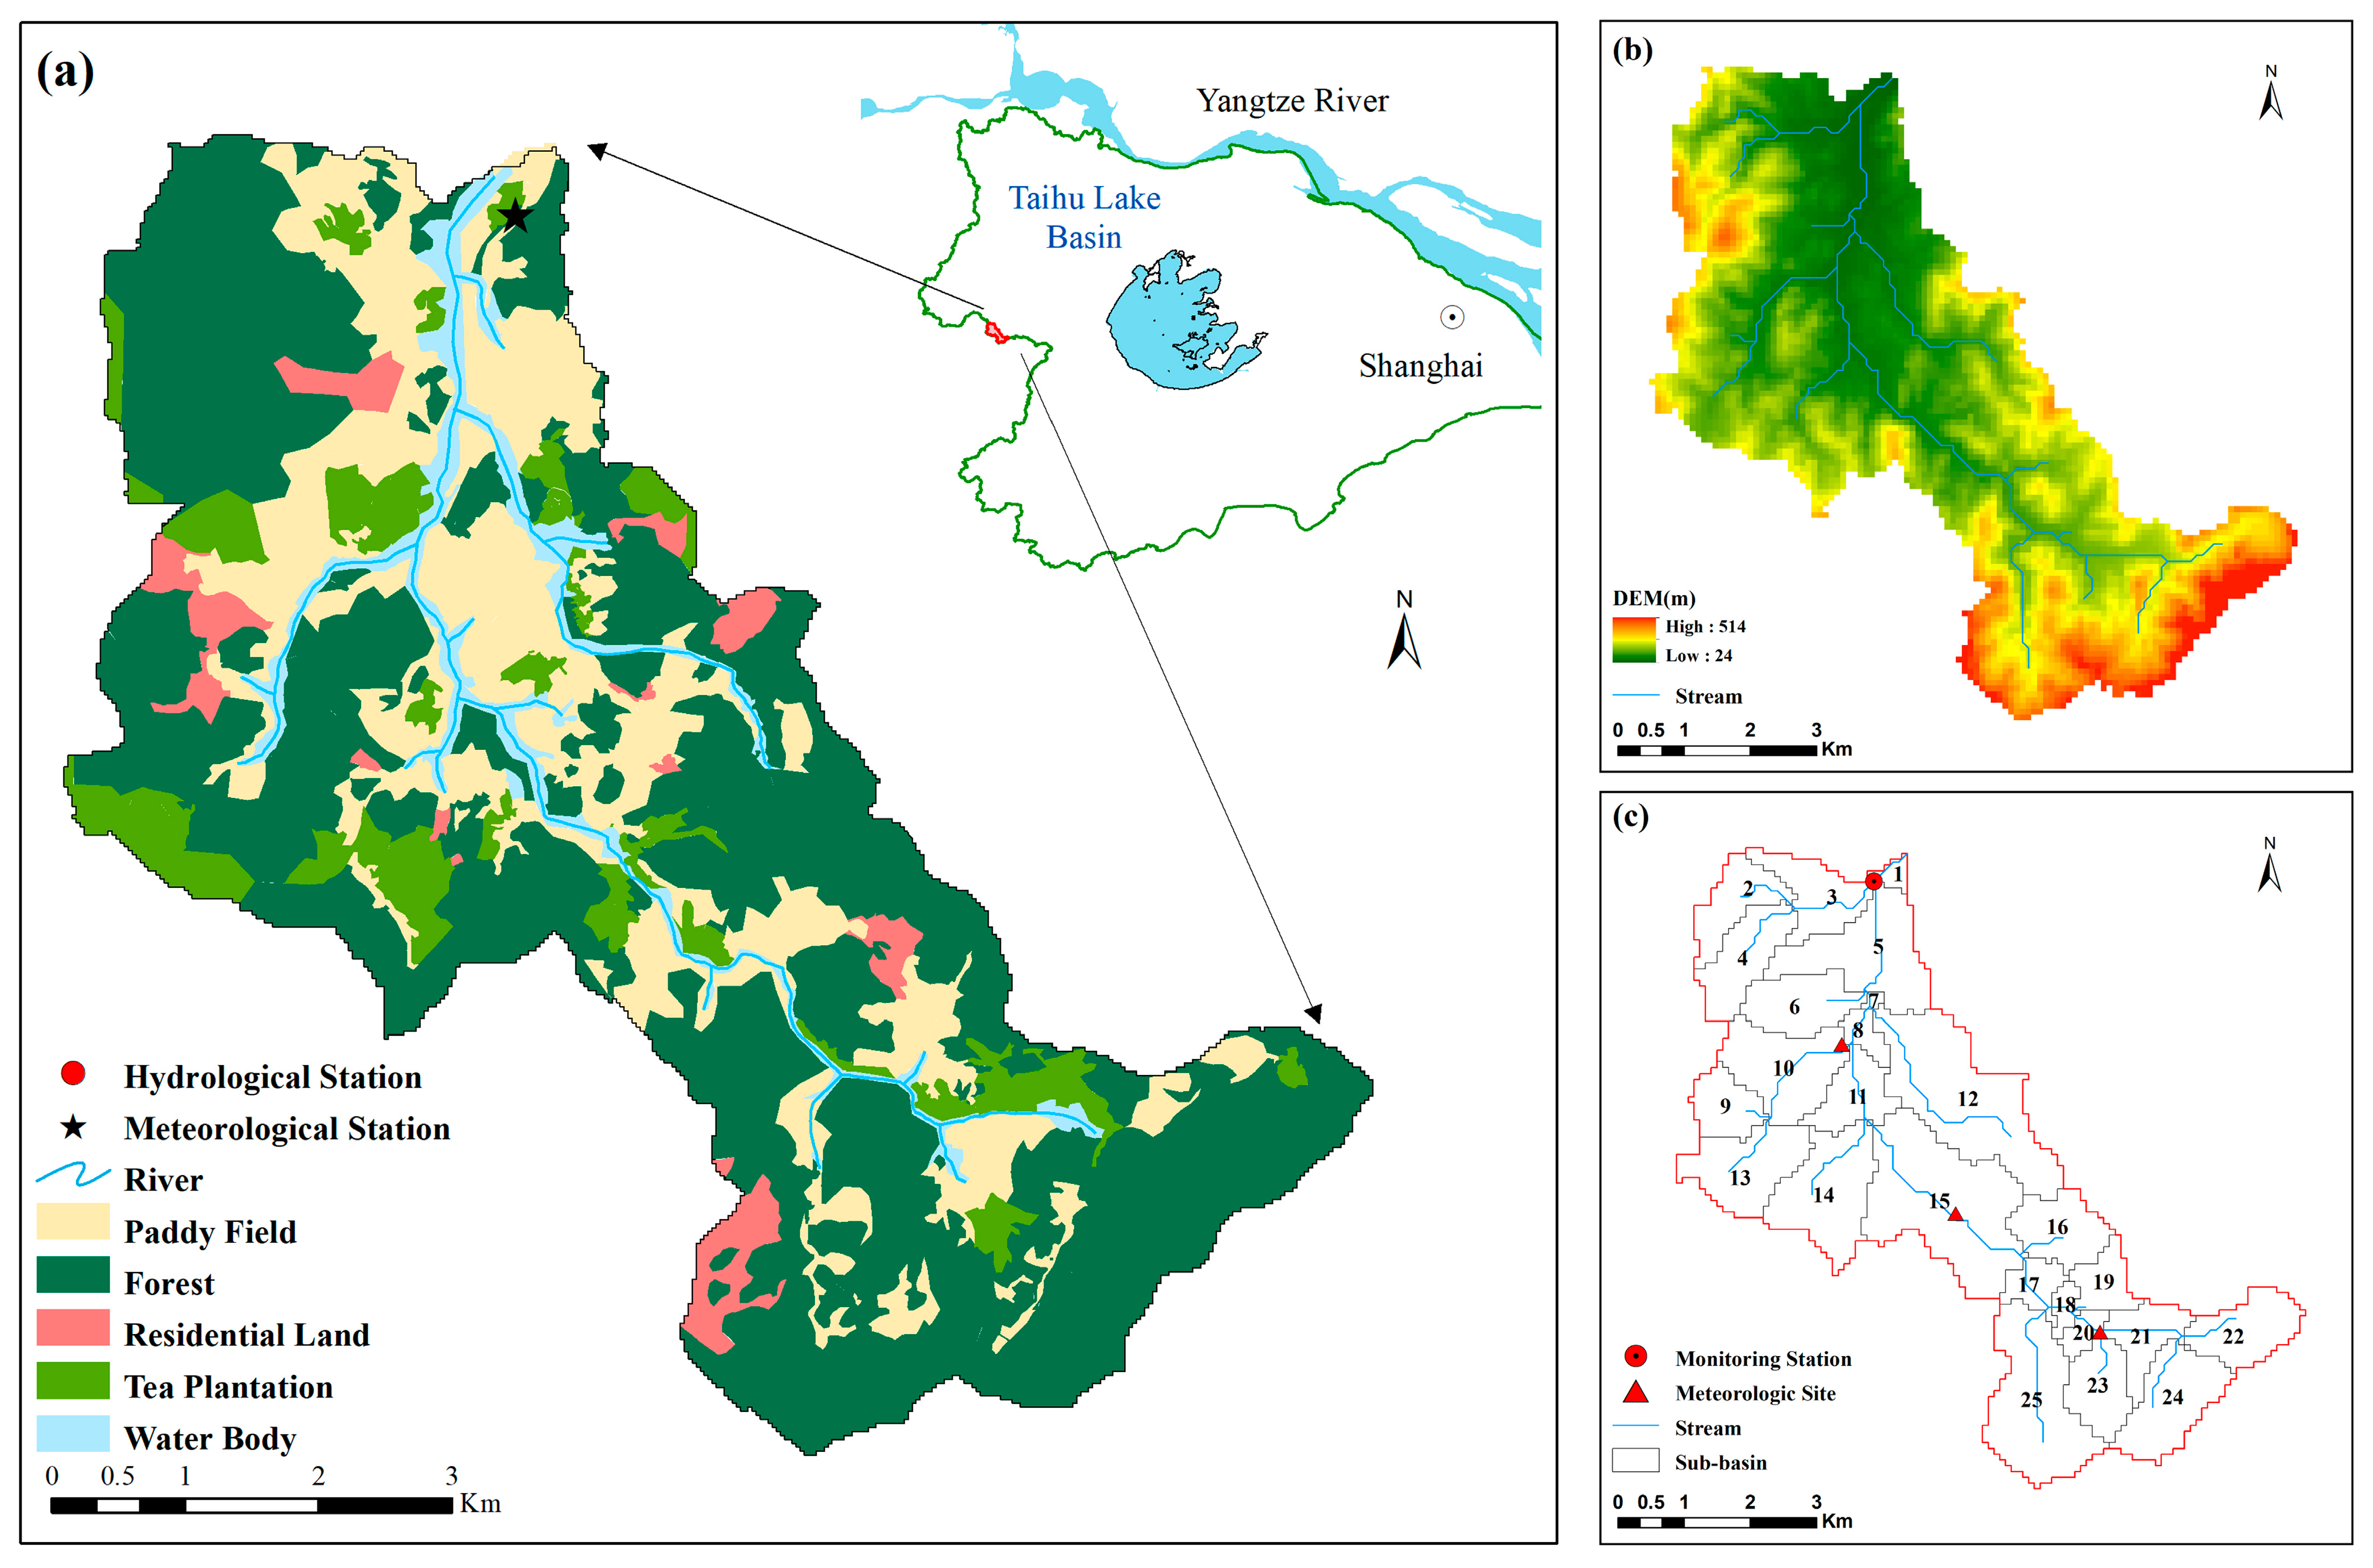
2.1. Study Area

The Zhongtian River Basin is a prototypical small watershed characterized by low mountains and hills situated in the upper reaches of Tianmu Lake, which is a component of the Taihu Basin (i.e., the third-largest lake in China; Figure 1a). The watershed covers an area of approximately 35.78 km2 and flows from south-north into Tianmu Lake, assuming a pivotal role in water conservation and serving as a primary drinking water source. The watershed has a subtropical monsoon climate, with an annual average temperature and rainfall of 17.5 °C and 1149.7 mm, respectively. More than 50% of the precipitation occurs from June–September, with significant seasonal variation [12,18]. This watershed is characterized by low mountainous topography, with elevations ranging from 24 to 514 m and slopes not exceeding 54 degrees. The soil is fertile, primarily composed of red, paddy, yellow-brown, and limestone soils, and is highly acidic. Land use patterns are dominated by forested land, paddy fields, tea plantations, water bodies, and residential zones, with the first three accounting for 60.47, 25.10, and 6.96% of the total watershed area, respectively.
As regional development progresses, human activities are increasingly affecting watersheds. Despite >50% of the study area being forested, the rapid expansion of agriculture in recent decades has led to the conversion of many forested hillslopes, some with gradients >25°, into tea plantations. Although the overall expansion of cultivated land may not be immediately apparent, tea plantation acreage in the watershed surged by 230% within just a decade from 2009–2018, resulting in significant agricultural contamination [10]. Conversely, point source pollution remained minimal due to the absence of industrial facilities, livestock farms, or municipal sewage treatment plants within the watershed boundaries.

2.2. SWAT Model Setup, Calibration, and Validation

The SWAT model relies on extensive datasets that encompass meteorological variables, topography, soil properties, land use data, and management practices. Detailed documentation of the input data used to configure the SWAT model in the watershed is provided in Table 1. Given the restricted availability of meteorological stations within the watershed, the kriging interpolation method was employed to extrapolate the meteorological data. Specifically, meteorological stations were interpolated at three key locations (i.e., upper, middle, and lower reaches of the watershed) with the aim of enhancing the precision of model simulations (Figure 1c). By leveraging these input data, the SWAT model discretized the watershed into 25 sub-basins, which were further subdivided into 285 HRUs based on analogous slope, soil, and land use attributes.
Agricultural practices, including fertilization, are recognized as significant contributors to nitrogen pollution within watersheds [19].
Based on field surveys and literature reviews [10], this study assessed the application rates of nitrogen fertilizers in the paddy fields and tea plantations of the Zhongtian River Basin. The timing and quantities of fertilizer application were determined using data from the local government yearbook of Liyang. The average annual fertilizer application rates were calculated as 172.5 kg/hm2 for paddy fields and 304.7 kg/hm2 for tea gardens. Specifically, fertilization in paddy fields primarily occurs in June or July, while in tea gardens, basal fertilizer is applied in November and top-dressing fertilizer is applied in February.
The hydrological model for the Zhongtian River Basin was developed using the SWAT, with the simulation period extending from January 2019 to December 2022. Calibration and validation of the model were conducted using observed streamflow and TN load data at the outlet of the Zhongtian River Basin, facilitated by the Sequential Uncertainty Fitting, version 2 (SUFI-2) algorithm of the SWAT Calibration and Uncertainty Programs. Detailed information on the model parameters employed in this study is provided in Table S1.
The Nash–Sutcliffe efficiency (NSE), correlation coefficient (R2), and percentage bias (PBIAS) are widely accepted metrics used to evaluate SWAT performance, and were calculated as follows:
N S E = 1 i = 1 n O i S i 2 i = 1 n O i O ¯ 2 ,
R 2 = i = 1 n O i O ¯ S i S ¯ i = 1 n O i O ¯ 2 i = 1 n S i S ¯ 2 ,   a n d
P B I A S = i = 1 n O i S i 100 i = 1 n O i ,
where O i is the observed value, O ¯ is the mean of the observed values, S i is the simulated value, S ¯ is the mean of the simulated values, and n is the total number of observations considered during the model evaluation. The NSE values, ranging from −∞ to 1, are considered satisfactory when they exceed 0.5. R2 was used to show the linear relationship between the observed and simulated data and ranges between 0–1, with values exceeding 0.6 considered satisfactory [20,21,22]. PBIAS measures the average tendency of the simulated values relative to the observations. The model is considered to perform satisfactorily when its PBIAS values are less than or equal to 15% for flow and 25% for TN [23].

2.3. Nitrogen Load Critical Source Areas Classification

Based on the simulation results from the SWAT model, the unit area load index method was employed to delineate critical source areas (CSAs) within the watershed [24]. The calculation formula for TN load intensity was as follows:
T N = O R G N + N S U R Q + L A T Q N O 3 + G W N O 3 ,
where O R G N is organic nitrogen, N S U R Q is surface runoff nitrate, L A T Q N O 3 is lateral flow nitrate, and G W N O 3 is groundwater nitrate. The unit is kg ha−1 yr−1. Furthermore, the natural breakpoint method was utilized to categorize the TN load intensity into five distinct levels.

2.4. Modeling BMP Scenario Design

Using the calibrated and validated SWAT model within the watershed, we aimed to elucidate the effects of BMPs on nitrogen export. The selection of BMPs was based on factors such as practicality, ease of adoption and acceptance by farmers, viability of implementation, and potential effectiveness in reducing sediment and phosphorous. A calibrated model representing the existing land use and management practices in the catchment was used as the baseline scenario (i.e., no BMP implementation). The analyzed scenarios included implementation of fertilizer reduction (FR), contour farming (CF), residue management (RM), filter strips (FS), and grassed waterways (GW) [25]. BMPs are commonly categorized into agricultural and engineered types. Agricultural BMPs encompassing FR, CF, and RM represent source management strategies enacted at the field level by farmers. Given the potential repercussions on crop yields linked to their application, it is essential to consider practical factors such as economic benefits and the willingness of farmers during the implementation process. Conversely, engineered BMPs, such as FS and GW, serve as process interception measures that are implemented beyond field perimeters. In the present study, the effectiveness of the BMPs in minimizing nitrogen export was evaluated by comparing the average outcomes of each implemented BMP scenario to the baseline scenario.
FR reduces fertilizer applications in regions with intensive agricultural activity, thereby weakening the external nitrogen load from human activities and alleviating the intensity of nitrogen loads in the watershed. Previous studies in the Taihu Basin have recommended nitrogen fertilizer application rates of 150–200 kg/ha for paddy fields and 150–250 kg/ha for tea gardens [10,11,26]. However, current fertilizer application rates in our study area (172.5 kg/hm2 for paddy fields and 304.7 kg/hm2 for tea gardens) exceed these recommended levels, suggesting that current practices may contribute to elevated nitrogen loads. We simulated the potential impacts of reducing fertilizer application rates by 10%, 20%, and 30% across the basin. Based on these simulations and considering the need to balance crop productivity with nitrogen load reduction, we selected a 30% reduction as a reasonable threshold. This reduction is expected to minimize nitrogen loads without causing significant yield penalties, aligning with findings from similar agricultural regions [27,28].
CF is an agricultural practice that involves cultivation, tilling, and harvesting in alignment with the natural contour lines of the terrain. CF enhances soil infiltration and diminish surface runoff, thereby mitigating soil erosion and NPS pollution loads discharged into streams, particularly during heavy rainfall events [29]. In the present study, CF was exclusively implemented for agricultural land within the watershed.
RM regulates the quantity and dispersion of crop/plant residues across the soil surface while minimizing the soil-disturbing activities that are essential for planting and nutrient application. This approach increases the amount of residue on the soil surface during the interval between the harvest and the subsequent planting season [30]. By bolstering ground cover and surface roughness, RM curtails surface runoff energy, enhances infiltration by impeding surface runoff, and diminishes erosion by reducing the surface runoff volume and velocity [25].
FS (also referred to as buffer zones) consist of vegetation (e.g., trees, shrubs, and grasses) planted along field edges to slow surface runoff, trap sediment, and intercept dissolved contaminants that could otherwise enter nearby watercourses. FS demonstrates heightened efficacy in regions where cultivated fields directly abut streams or water bodies [31]. The effectiveness of FS in contaminant removal (quantified as trapping efficiency [ T r a p e f ]) is contingent upon the filter strip width ( F I L T E R W ), and is calculated using the following equation [25]:
T r a p e f = 0.367 F I L T E R W 0.2967 ,
After thorough consideration, a 10 m FS width was selected for implementation in the present study.
GW are broad, shallow watercourses vegetated with grass that mitigate flow velocity and minimize channel erosion. GW exhibit greater resilience to elevated in-channel velocities than bare channels, as the vegetation retards the flow velocity and protects the soil. Unlike FS, GW are typically installed in drainage pathways [32].
The effectiveness of the BMPs was assessed in terms of load reduction rates, which were defined as the ratio of the reduction in pollution loads compared with the baseline scenario to the pollution loads in the baseline scenario, and was calculated as follows:
R = P r e B M P P o s t B M P P r e B M P × 100 % ,
where R is the pollution load reduction rate, and P r e B M P and P o s t B M P represent the annual average pollution loads (kg⋅ha−1) in the baseline scenario and after the implementation of BMPs in the entire watershed, respectively [33,34].

2.5. Statistical Analysis

Statistical analyses were conducted using Origin 2021 software and the SPSS Statistics 26.0 package to discern the sources and influencing factors contributing to the nitrogen load. Pearson correlation coefficient was used to evaluate the correlation between various influencing factors (e.g., proportions of different land uses, slopes, and runoff water sources) and the nitrogen load intensity. RDA (i.e., a statistical ordination technique based on linear modeling principles) was employed to assess the influence and contributions of different land use types to nitrogen load intensity within the watershed, and was performed using CANOCO 5.0.

3. Results and Discussion

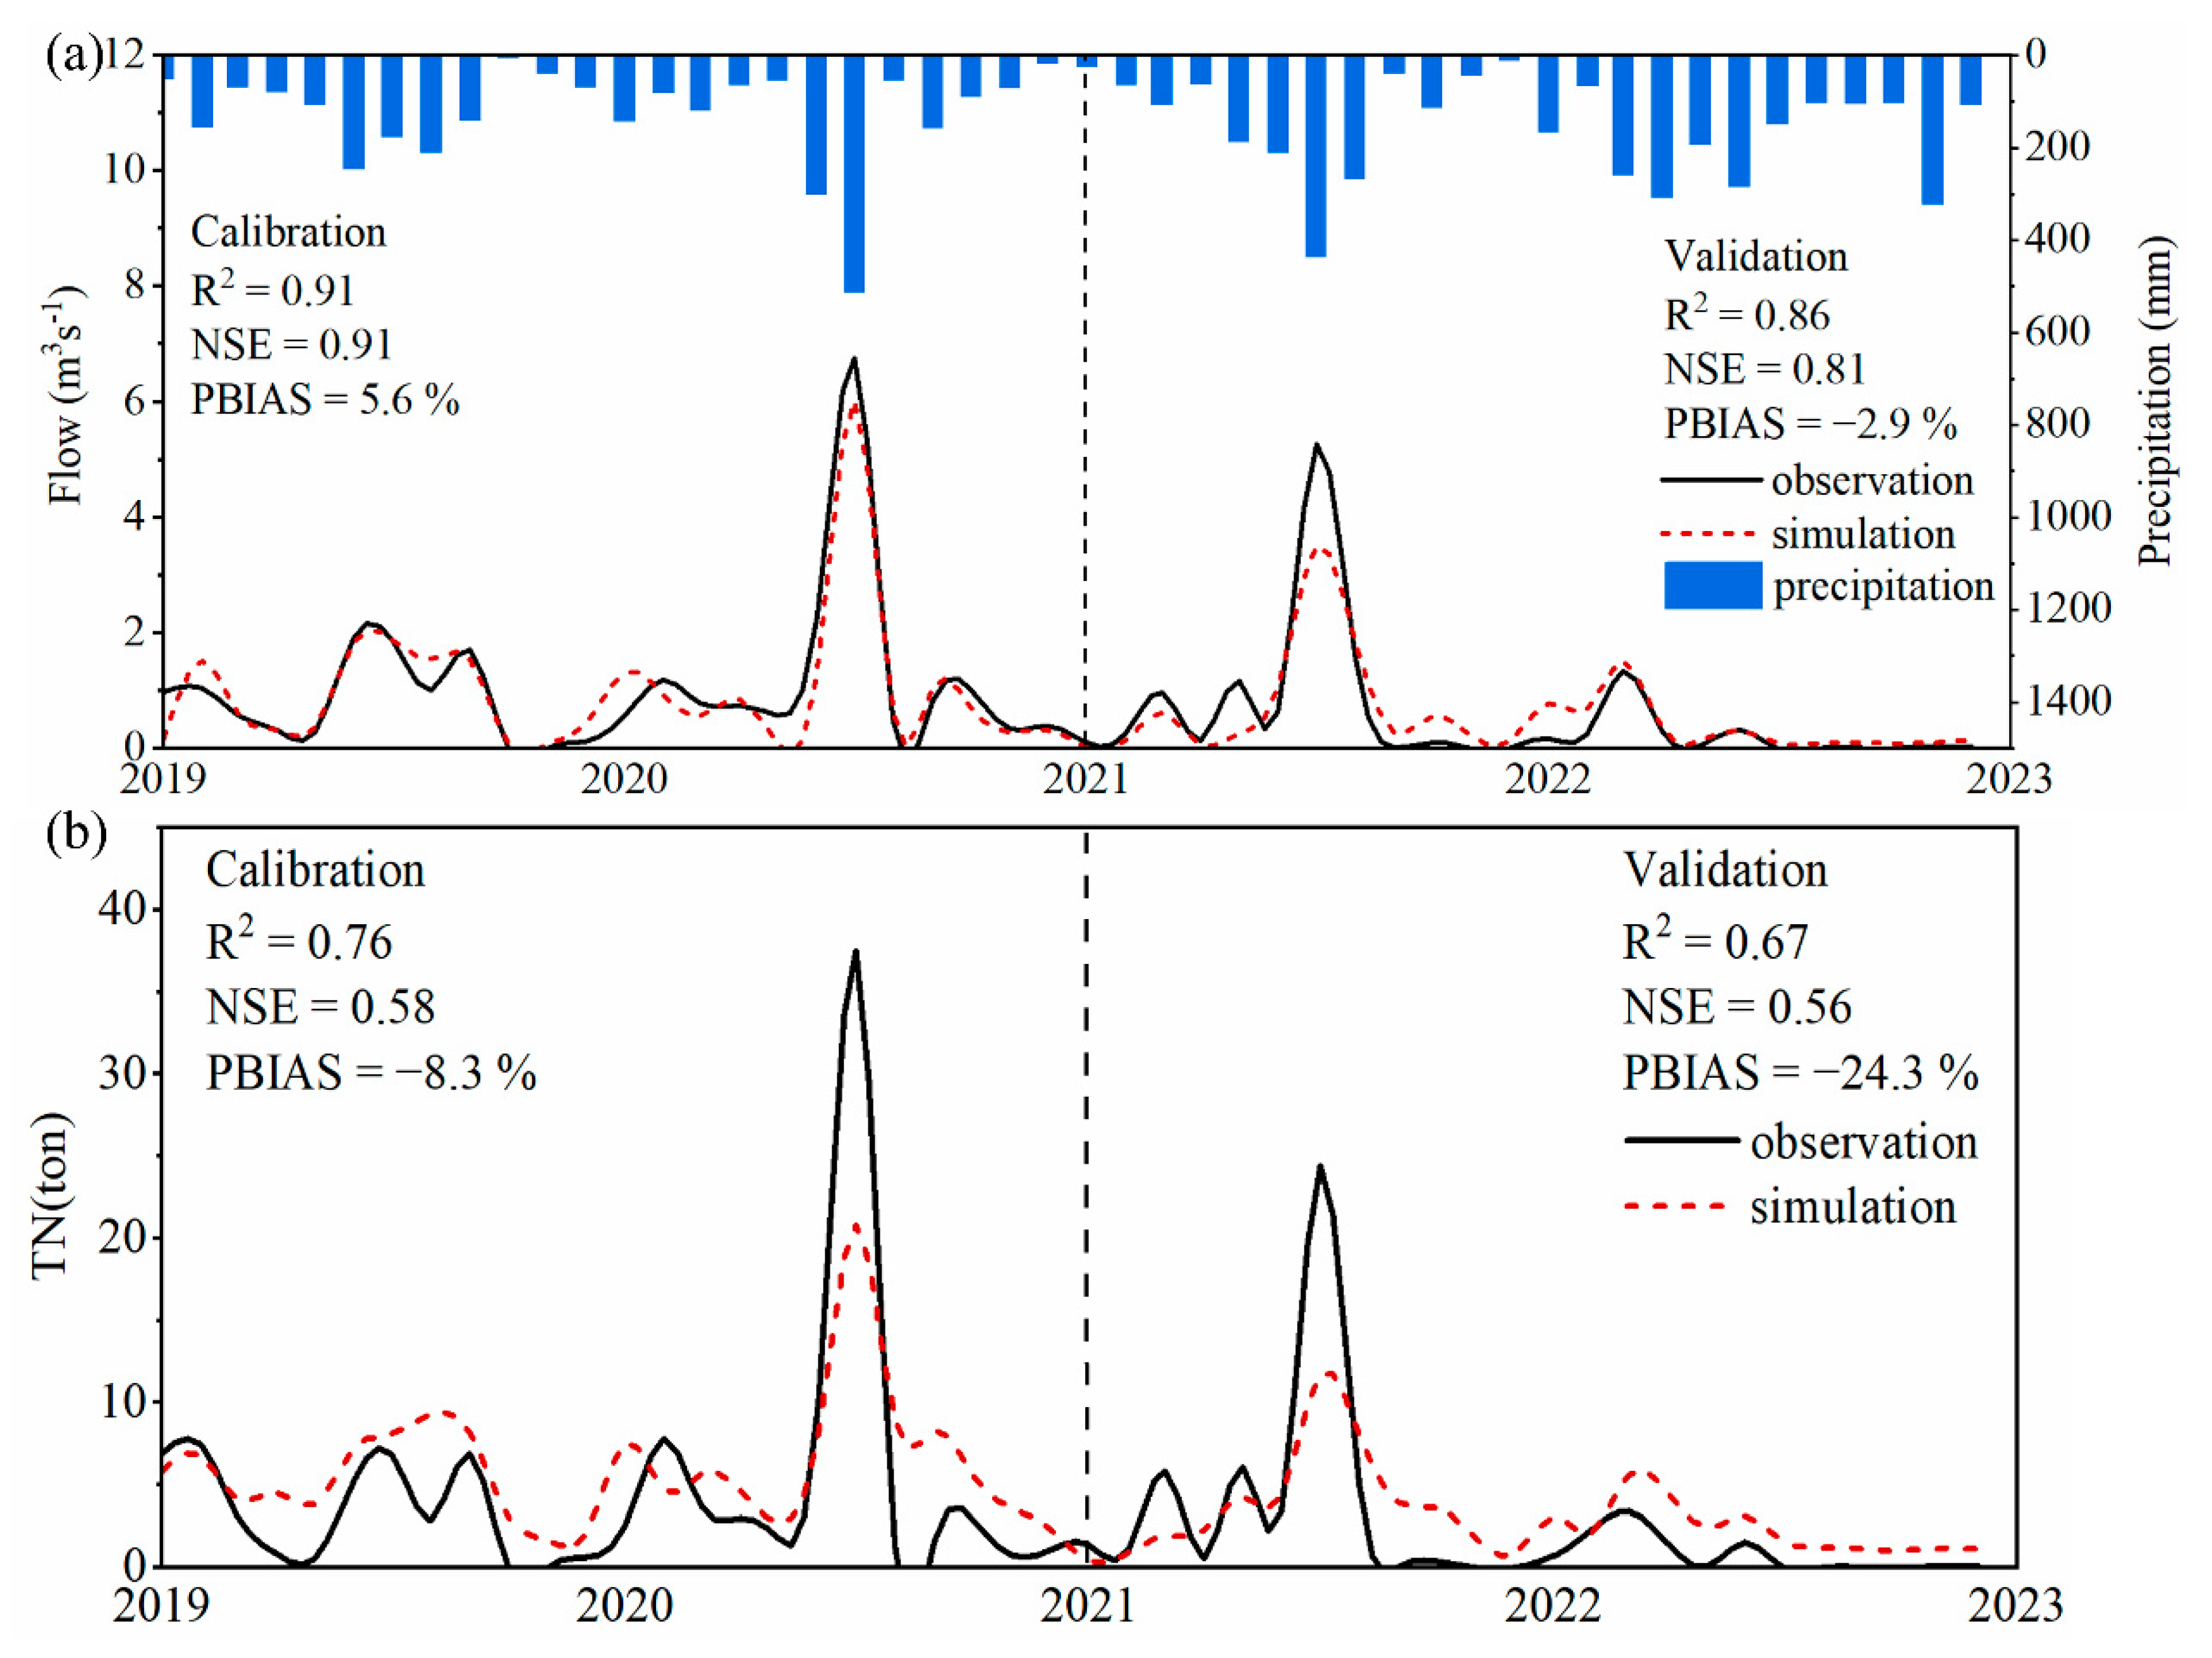
3.1. SWAT Calibration and Validation Results

The SWAT model was utilized to simulate monthly streamflow and TN output loads, incorporating daily flow data from watershed outlet monitoring stations and monthly TN concentration measurements collected between 2019 and 2022. The model demonstrated satisfactory performance during the calibration period from 2019–2021 (flow: R2 = 0.91, NSE = 0.91, PBIAS = 5.6%; TN: R2 = 0.76, NSE = 0.58, PBIAS = −8.3%) and the subsequent validation period from 2021–2022 (flow: R2 = 0.86, NSE = 0.81, PBIAS = −2.9%; TN: R2 = 0.67, NSE = 0.56, PBIAS = −24.3%) (Figure 2). Overall, the model effectively captured the majority of the peak flow, demonstrating a favorable agreement between the observed and simulated values when used to simulate monthly stream flow.
In general, the simulated TN load exhibited a pattern consistent with the observed values, with occasional underestimations observed from June–August, particularly during the validation period (Figure 2b). These underestimations may have been attributed to underestimation of the TN load transported by the extreme rainfall runoff event that occurred during this period [35]. Previous research also indicated that the SWAT model encounters challenges during extremely wet and dry periods, particularly when extreme events occur during the validation period [36]. Furthermore, during the validation phase, a suboptimal PBIAS value for TN was observed, indicating that the simulated values were relatively overestimated compared to the observed values. This disparity was primarily be attributed to the drought conditions experienced in 2022, which led to intermittent interruptions in streamflow within the watershed.

3.2. Spatio-Temporal Distribution Characteristics of Flow and TN

3.2.1. Temporal Variability and Patterns

The multi-year average observed precipitation showed a highly positive correlation with both flow and fluvial TN loads in the watershed (Figure 3a). Flow and TN loads exhibited pronounced seasonal variability, with peaks in summer and troughs in winter. Furthermore, based on the difference in precipitation, the wet season was delineated from June to August, while the dry season was identified from December to February. The annual average flow was 0.80 m3/s, with the peak occurring in July, reaching 3.47 m3/s. A modest peak in flow was observed in March because of increased spring precipitation. Overall, there was a high correlation between flow and precipitation in the watershed, with linear regression analysis revealing an R2 value of 0.54 for monthly records during the modeling period, and 0.79 for the multi-year average (Figure 3b).
The overall temporal trend and characteristics of the TN distribution were generally consistent with the flow patterns, with peaks observed from June to August. Significant relationships between the TN load and precipitation were evident at the monthly scale (R2 = 0.68) (Figure 3c). Precipitation during the wet season accounted for 45% of the annual total, with the corresponding TN load representing 57% of the annual total. Conversely, the TN load remained low during the dry season, amounting to less than 9% of the annual total.
Elevated precipitation resulted in an increase in the TN load, facilitated by sediment and soluble nitrogen transportation through rainfall-induced runoff. Nitrogen is conveyed either by soil particles or by leaching from the soil, and subsequently enters water bodies through surface runoff or lateral flow pathways [37,38]. Notably, with approximately 32.05% of the watershed area designated for agricultural use, agricultural practices (particularly fertilization) emerged as significant determinants of TN dynamics. Excessive nitrogen application beyond plant requirements may result in nitrogen runoff into water bodies. The confluence of fertilization activities during periods of intense precipitation further exacerbates the TN load, particularly the NO3 load [39,40]. Additionally, TN exhibited a modest peak in February, slightly preceding the flow peak. This temporal pattern may have been attributed to intensified spring rainfall, which increases the likelihood of soil erosion, particularly on agricultural lands and bare soil surfaces. Consequently, soil particles and associated nutrients were mobilized into rivers through runoff processes, contributing to the observed increase in the TN load.

3.2.2. Characteristics of Spatial Distribution

The study investigated the disparities in the spatial and temporal distributions of TN load intensity within the watershed, utilizing the mean simulation outcomes from the period from 2018 to 2022 (Figure 4). The TN load intensity across the entire watershed ranged from 11.34 to 37.93 kg ha−1 yr−1, with an average of 21.34 kg ha−1 yr−1. The CSAs of TN load intensity included sub-basins 5, 6, 8, 10, 12, and 13, with sub-basins 10 and 6 exhibiting particularly elevated levels, attaining 37.93 and 33.30 kg ha−1 yr−1, respectively. Moreover, sub-basins 5, 8, 12, and 13 demonstrated elevated TN load intensity levels, all surpassing the threshold of 20 kg ha−1 yr−1. From the perspective of land use type, the elevated TN load intensity in sub-basins 10 and 6 predominantly arose from the substantial agricultural land area. In sub-basin 10, the proportions of paddy fields and tea plantations accounted for 39.42% and 18.67% of the land use, respectively. In sub-basin 6, these proportions were 49.39% and 10.25%, respectively. Moreover, nitrogen loss is highly sensitive to the slope gradients of agricultural hillsides, with steeper slopes correlating with increased nitrogen loss [41]. Specifically, certain areas of agricultural land within the steep western regions of sub-basins 10 and 6 have been identified as potentially exacerbating the TN load intensity. Other sub-basins with elevated TN pollution intensities shared similar characteristics. For example. sub-basins 13 and 14 featured a widespread distribution of tea plantation and steep slopes, whereas sub-basins 3 and 5 had extensive paddy fields coverage. Overall, the CSAs were mainly located in the downstream regions, indicating a notable correlation with agricultural land.
The spatial distribution of the nitrogen load intensity also exhibited seasonal variations. Throughout the wet season, the average TN load intensity ranged from 31.70–59.58 ha−1 yr−1 across the 25 sub-basins (Figure 4b). Conversely, during the dry season, the average TN load intensity ranged from 4.26–15.94 ha−1 yr−1 across the same sub-basins (Figure 4c). Compared to the annual TN load intensity, notable increases were observed in sub-basins 2, 4, 19, and 25 during the wet season. This phenomenon was attributed to several factors. Sub-basins 2, 4, and 25 were characterized by steep terrain and heightened precipitation during the wet season exacerbates soil erosion, consequently increasing the TN load intensity [42]; sub-basin 19, on the other hand, featured a substantial proportion of paddy fields, accounting for approximately 51.81% of the total area. Conversely, during the dry season, the TN load intensity generally diminished; however, pollution remained pronounced in sub-basins 6, 10, 13, and 14. Notably, sub-basins 13 and 14 exhibited TN load intensity levels that surpassed the annual average. Characterized by the presence of tea plantations, which account for over 20% of the land area in these sub-basins, significant base fertilization practices were observed to occur during the dry season.

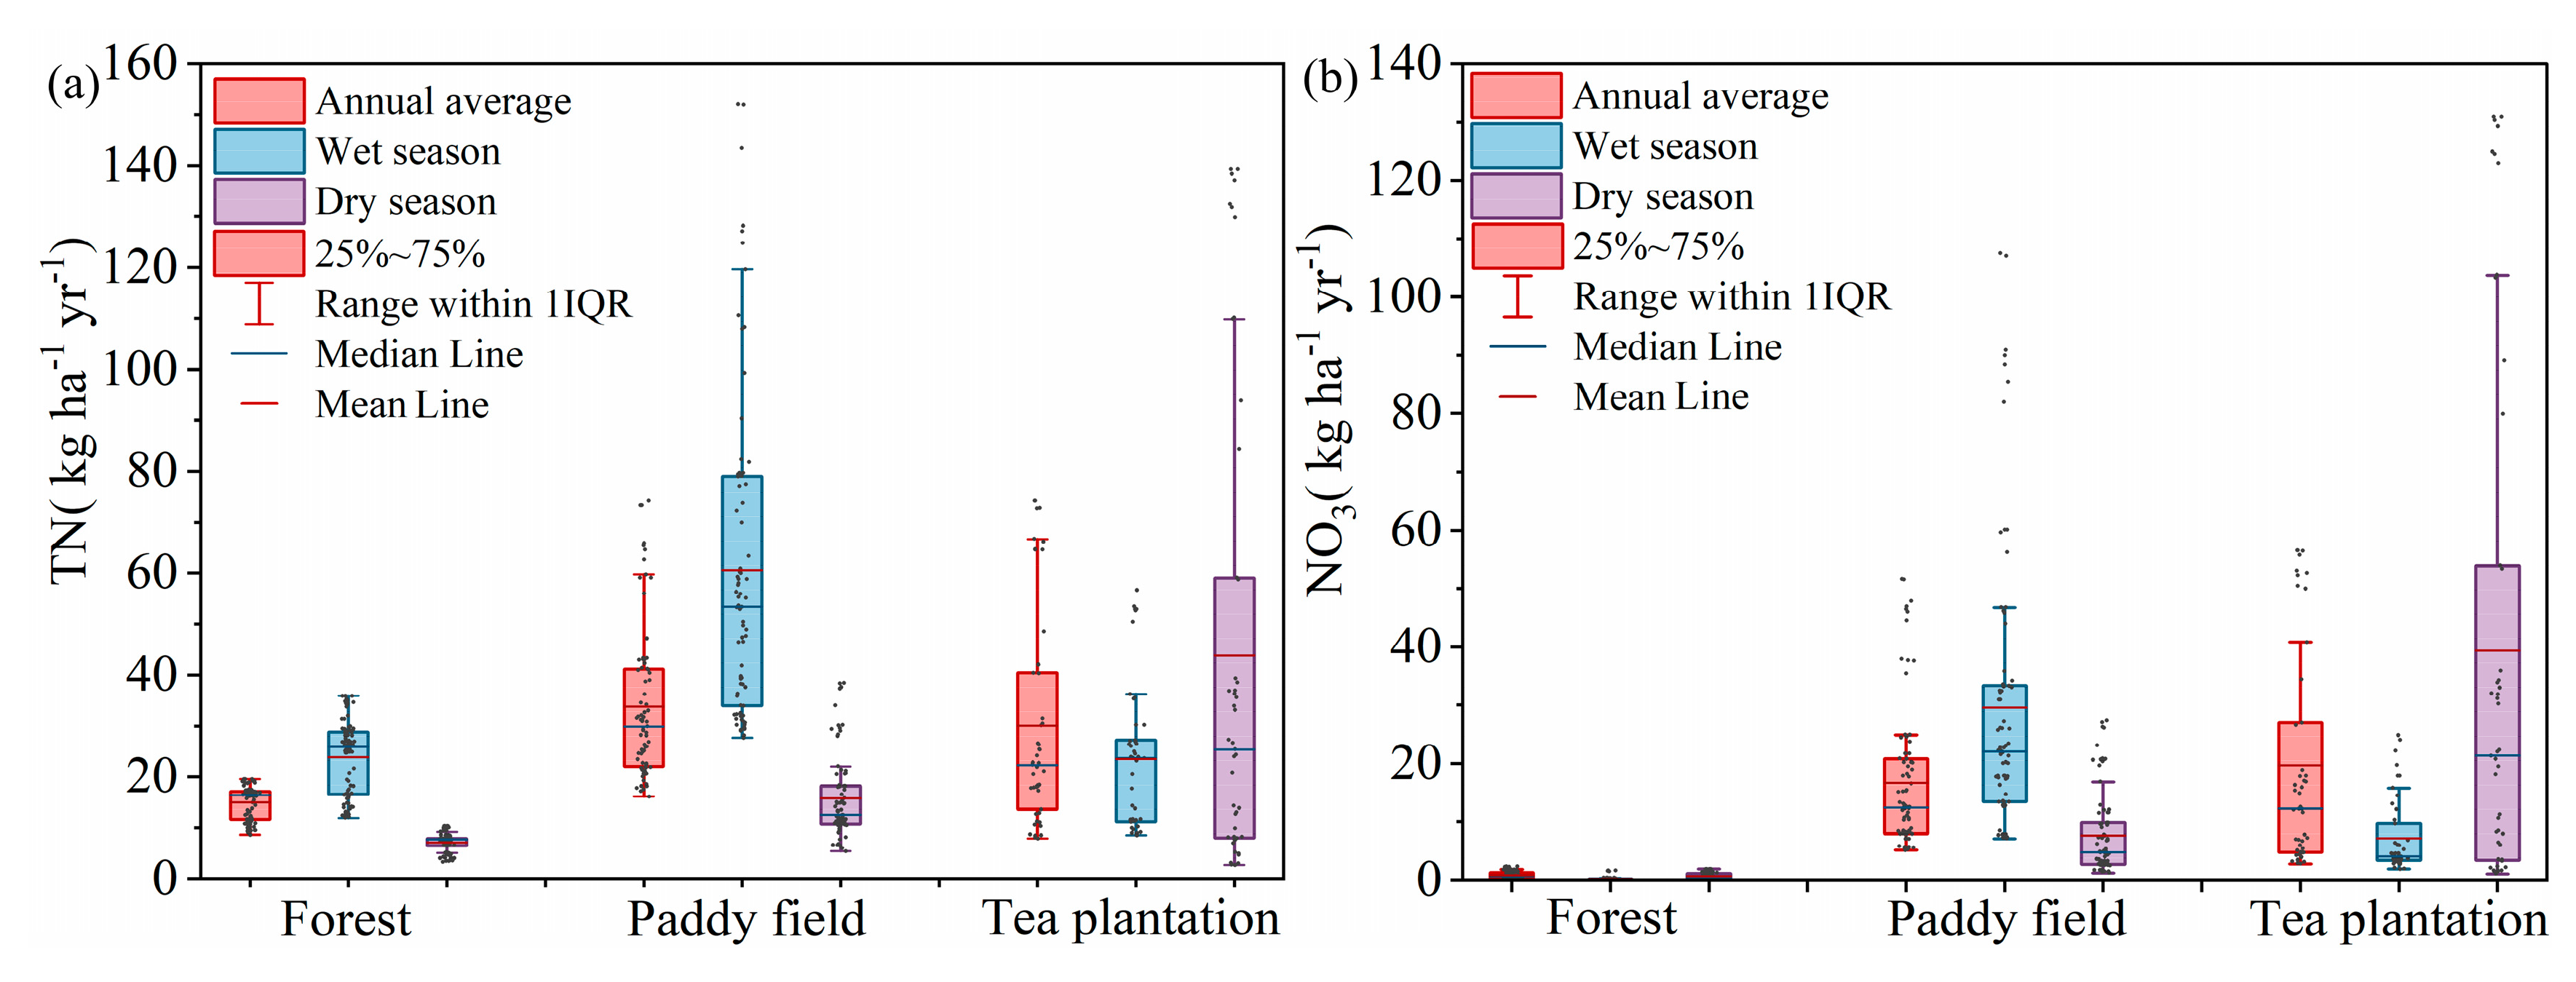
3.2.3. Variations in Nitrogen Load Intensity Across Different Land Uses

Land use has a pivotal influence on the TN load within watersheds. The dominant land use categories in this watershed were forest, paddy fields, and tea plantation, covering 60.47%, 25.10%, and 6.96% of the total area, respectively. Correspondingly, these land use types contributed to proportions of TN outputs of 47.51, 41.11, and 10.77%, respectively. To elucidate the impact of land use on nitrogen loading, we further examined the TN and nitrate load intensities of three representative land use types (Figure 5). However, owing to variations in topography, soil type, and other details, nitrogen loading may have varied among similar land use categories; therefore, weighted averages were used as primary metrics in the present study.
The nitrogen load intensity from forested land was the lowest among all land use types, with an annual average TN load intensity of 14.95 kg ha−1 and nitrate load intensity of 0.78 kg ha−1. This phenomenon was attributed to the dense vegetation cover, robust interception capacity, and intricate root systems in forest ecosystems, which effectively mitigate soil erosion and minimize nitrogen losses [43]. These findings highlight the considerable potential of forest to efficiently attenuate nutrient pollution. In contrast, both paddy fields and tea plantation exhibited an annual average TN load intensity surpassing 30 kg ha−1, highlighting their significance as primary contributors to nitrogen pollution. The average nitrate load intensities of paddy fields and tea plantation were 2.59 and 3.05-times higher than the basin average, respectively. The nitrogen load from paddy fields in our study was consistent with that of rice-producing areas in other Taihu Lake basins, further validating the reliability of the simulation results [11,44]. Moreover, tea plantation has the highest nitrate load intensity, primarily because its highest fertilizer usage among all land use types [28]. Compared to those of natural land use, nitrogen emissions from both agricultural land types were relatively high. This may have been due to external nitrogen inputs from human activities, such as fertilizer or manure applications and various land management practices. Additionally, agricultural land management practices that increase runoff and erosion rates can directly or indirectly affect water quality [45,46].
The seasonal dynamics of nitrogen load intensity distribution typically exhibited elevated levels during the wet season and reduced levels during the dry season, with the exception of tea plantation. The TN load intensity of paddy fields increased to 60 kg ha−1 during the wet season, concurrently with an increase in nitrate load intensity to approximately 30 kg ha−1, aligning with the fertilization period. During the dry season, the overall nitrogen load in the watershed declined; however, the nitrogen load intensity in tea plantation increased significantly, particularly the nitrate load intensity, reaching nearly 40 kg ha−1. The heightened nitrogen emissions from tea plantation stem not only from excessive fertilization practices, but also from the methods employed for fertilization. Previous research suggests that compost application may lead to more pronounced leaching than chemical fertilizer applications, whereas tea plantation predominantly utilizes compost during the dry season [47].

3.3. Driving Factors of Spatio-Temporal Variation of Nitrogen Load

Land use, runoff water sources, and climate are pivotal drivers of changes in watershed hydrology and nutrient cycling; therefore, it is necessary to separate and quantify their individual impacts on land and water resource management [48]. Given the relatively limited spatial scope of our study area, variations in meteorological conditions across the region were considered negligible. Therefore, we utilized the Pearson correlation coefficient and RDA methodologies to ascertain the correlations and impacts of various factors on the nitrogen load, both at the sub-basin scale (Table S2) and on the HRU (Table S3). The Pearson analysis conducted at the HRU scale demonstrated a notably elevated level of statistical significance in comparison with the analyses conducted at the sub-basin scale, with key influencing factors exhibiting p-values < 0.01. This indicated that the analysis of the factors influencing the TN load intensity at the HRU scale had higher credibility (Figure 6).
At the HRU scale, the annual average nitrogen load exhibited positive correlations with paddy fields and lateral flow, but a negative correlation with evaporation. TN and nitrate loads were sensitive to land use, showing positive correlations with paddy fields and tea plantation, and negative correlations with forest. The correlation coefficient between the TN load and paddy fields was 0.49, indicating that paddy fields were the predominant contributor to the nitrogen load. This finding is consistent with the spatial distribution of CSAs, wherein regions characterized by higher TN loads tended to have higher proportions of paddy fields and tea plantation. This pattern resonates with findings from other catchments globally, which demonstrate a positive correlation between nitrogen load and the percentage of agriculture land [49]. Furthermore, the negative correlation between the TN load and forested land suggested the potential of forest to effectively mitigate NPS nitrogen pollution outputs [43]. Various correlations were observed between nitrogen load intensity and different water sources. Within the watershed in the present study, the TN and nitrate loads predominantly arose from lateral flow, followed by surface runoff. Particularly notable was the organic nitrogen (ORGN), which primarily originated from groundwater, exhibiting a correlation coefficient of 0.51. During the wet season, there was a further increase in the correlation between nitrogen load and paddy fields, with the coefficient reaching 0.68. Moreover, there was a decrease in the proportion of the nitrogen load from the lateral flow coupled with an increase in surface runoff. This phenomenon was attributed to the substantial precipitation during the wet season, which increased both the flow velocity and erosion intensity of the surface runoff [50]. Consequently, nitrogen-based fertilizers, pesticide residues, and other soil constituents are transported to surface runoff. This finding was supported by the increased correlation between nitrogen load and sediment yield. During the dry season, a significant correlation of 0.58 was observed between tea plantations and nitrate load; however, there was a significant decline in the correlation between the nitrogen load, sediment yield, and evaporation. The observed decline in the correlation between transpiration and nitrate-nitrogen during winter can be primarily attributed to the reduced evaporation and runoff typical of this season. Given the inherently low magnitudes of evaporation and runoff, their spatial variability is correspondingly limited, which in turn weakens the correlation with nitrate-nitrogen. Additionally, the underlying physical relationship between transpiration and nitrate-nitrogen is highly complex and necessitates further investigation.
The analysis revealed consistency with the correlation derived from the Pearson correlation analysis. Overall, the analysis of the relationships between nitrogen loss and environmental factors based on the RDA axes revealed >85% of the total variation, with the exception of the dry season (59.5%). Among these factors, paddy fields, and lateral flow emerged as key predictors of water quality in the watershed. During the wet season, paddy fields and lateral flow accounted for 39.0 and 29.7%, respectively, of the variation, whereas during the dry season, tea plantations exhibited higher explanatory power (23.7%) than that of paddy fields.

3.4. Effectiveness of BMP in Reducing Nitrogen Load

The effectiveness of various BMPs in mitigating the nitrogen load varied significantly, with each demonstrating distinct advantages in influencing the TN, ORGN, and nitrate loads (Table 2). Overall, engineered BMPs exhibited markedly superior reduction effects compared to those of agricultural BMPs. For the agricultural measures (FR, CF, and RM), the TN load reduction rates were 6.44, 4.75, and 3.66%, respectively. The reduction in the TN load by FR primarily stemmed from its substantial reduction in the nitrate load (by 21.26%), whereas the other two BMPs primarily diminished the ORGN load. Both engineered BMPs demonstrated higher reduction effectiveness, manifesting an overarching tendency towards a more pronounced reduction in the ORGN load than in the nitrate load. This phenomenon may have been attributed to the capacity of engineering measures to mitigate soil erosion and loss, given that ORGN typically binds to soil particles, resulting in reduced ORGN entering the water body.
The reduction in nitrogen under FR primarily manifested as a decrease in nitrate-nitrogen levels. Specifically, FR achieved TN load reduction efficiencies of 10.52% in paddy fields and 19.24% in tea gardens, with corresponding nitrate load reductions of 21.15% and 29.43%, respectively. The higher effectiveness of nitrogen reduction in tea gardens may be attributed to the higher initial fertilizer application rates, which exceed the recommended levels for optimal yields. This suggests that current fertilization practices in tea gardens are likely excessive, contributing to higher nitrogen losses. Moreover, the effectiveness of nitrogen reduction under FR exhibited pronounced seasonal fluctuations, likely due to variations in fertilization timing and weather conditions. For instance, the nitrate load intensity decreased by 7.56 kg/ha in paddy fields during the wet season and by 11.60 kg/ha in tea gardens during the dry season. These findings highlight the importance of aligning fertilization practices with crop growth stages and environmental conditions to maximize nitrogen use efficiency and minimize losses. Our findings indicate that appropriate fertilizer management in agricultural watersheds is imperative, as excessive input not only compromises fertilizer efficiency, but also exacerbates pollution. Optimizing fertilizer application rates based on crop requirements and environmental conditions can be an effective strategy for mitigating nitrogen pollution while maintaining crop productivity [51,52].
The effectiveness of the remaining two agricultural BMPs (CF and RM) was relatively limited, showing a reduction in effectiveness of <5% in the TN load, which was predominantly attained through mitigation of the ORGN load. Considering the inclinations of farmers and the challenges associated with implementation, CF and RM have emerged as suitable choices for targeted applications within agriculturally dense regions. Furthermore, our study attempted to implement no-tillage (NT) practices, which had an adverse effect on TN reduction. This adverse outcome stemmed from the absence of residual disturbances inherent in NT methods [24]. These findings are consistent with observations made in analogous studies in other agricultural watersheds [53].
Both engineered BMPs utilized in this study demonstrated remarkable effectiveness in reducing nitrogen loads (Figure S1). Moreover, the ranking of reduction effects across different land use categories was as follows: paddy fields > forested land > tea plantation. paddy fields, strategically situated near streams or other water bodies for convenience of irrigation, undergo effective runoff transport capacity reduction through engineered BMPs. These measures facilitate sedimentation and substantially mitigate stream erosion, thereby efficiently managing nutrients [54,55]. Additionally, during the wet season, a fraction of the nitrate-nitrogen originating from paddy fields was transported into streams via surface runoff, wherein engineered BMPs exhibited notable interception and containment efficacy. Previous investigations have indicated the prominence of engineered measures as the optimal choice within a comprehensive assessment framework for evaluating the reduction in TN pollution loads and the associated net economic benefits [34]. Furthermore, GW are designed to decelerate flow velocity and retain sediment-laden runoff facilitate sediment settling and load reduction. However, their effectiveness primarily targets surface runoff sediments and nutrients, potentially overlooking underground pathways [31]. Nonetheless, given the low nitrogen load contribution of the watershed from underground runoff pathways, this impact remains negligible. In practical applications, the majority of engineered BMPs not only safeguard soil integrity and curtail nutrient loss but also attenuate nutrient transfer from alternate origins [56]. Consequently, engineered BMPs serve as dual-purpose strategies encompassing both source and process reduction, yielding favorable outcomes. Currently, within watersheds, certain engineered measures (e.g., cascade wetlands) have been constructed and achieved notable success, partially confirming the feasibility of engineering interventions within watersheds [12].

4. Conclusions

This study used the SWAT model to simulate the flow and TN loads within the Zhongtian River Basin. Temporal analysis revealed that flow and TN load were characterized by elevated levels from June to August and decreased levels from November to January, demonstrating a positive correlation with precipitation patterns. Spatially, the TN load intensity showed strong correlations with land use, topography, and other factors. The nitrogen load intensity varied among different land uses within the watershed, with nitrogen load intensities of 16.76 kg ha−1 yr−1 for forested land, 34.96 kg ha−1 yr−1 for paddy fields, and 33.04 kg ha−1 yr−1 for tea plantation. Pearson analysis revealed a significant correlation between TN load intensity and land use, as well as source pathways, with correlation coefficients of 0.49 for the paddy fields and 0.54 for lateral flow. Additionally, RDA indicated that land use accounted for >50% of the explanatory variance in the TN load intensity. Simulation results of BMPs indicate that fertilizer reduction stands out as the most effective agricultural BMP, resulting in a notable nitrate reduction rate of 21.16%, indirectly indicating the prevalent issue of excessive fertilization within the watershed. Engineered BMPs demonstrated superior effectiveness compared to that of agricultural BMPs, with notable reductions in both ORGN and nitrate. Therefore, we recommend optimizing fertilizer application rates based on crop requirements and environmental conditions, coupled with the implementation of engineered BMPs such as filter strips and grassed waterways, to effectively mitigate nitrogen pollution in agricultural watersheds.

Supplementary Materials

The following supporting information can be downloaded at: https://www.mdpi.com/article/10.3390/w17060821/s1, Figure S1: Effectiveness of nitrogen reduction across various land-use types using engineered BMPs; Table S1: SWAT parameters and corresponding ranges for calibration and validation; Table S2: Correlation between various factors and TN load intensity during different periods at the sub-basin scale; Table S3: The correlation between various factors and TN load intensity during different periods at The HRU scale.

Author Contributions

W.S.: conceptualization, investigation, methodology, writing—original draft. R.C.: investigation, writing—review and editing. X.Z.: writing—review and editing. X.L.: resources. H.Y.: resources. L.W.: supervision. All authors have read and agreed to the published version of the manuscript.

Funding

This work was supported by the Water Conservancy Science and Technology Project of Jiangsu Province (2021041).

Data Availability Statement

Data is contained within the article or Supplementary Material.

Conflicts of Interest

The authors declare no conflict of interest.

Abbreviations

FRFertilizer reduction
CFContour farming
RMResidue management
FSFilter strips
GWGrassed waterways

References

  1. Vörösmarty, C.J.; McIntyre, P.B.; Gessner, M.O.; Dudgeon, D.; Prusevich, A.; Green, P.; Glidden, S.; Bunn, S.E.; Sullivan, C.A.; Liermann, C.R.; et al. Global threats to human water security and river biodiversity. Nature 2010, 467, 555–561. [Google Scholar] [CrossRef] [PubMed]
  2. Xia, Y.; Zhang, M.; Tsang, D.C.W.; Geng, N.; Lu, D.; Zhu, L.; Igalavithana, A.D.; Dissanayake, P.D.; Rinklebe, J.; Yang, X.; et al. Recent advances in control technologies for non-point source pollution with nitrogen and phosphorous from agricultural runoff: Current practices and future prospects. Appl. Biol. Chem. 2020, 63, 8. [Google Scholar] [CrossRef]
  3. Grizzetti, B.; Vigiak, O.; Udias, A.; Aloe, A.; Zanni, M.; Bouraoui, F.; Pistocchi, A.; Dorati, C.; Friedland, R.; De Roo, A.; et al. How EU policies could reduce nutrient pollution in European inland and coastal waters. Glob. Environ. Change 2021, 69, 102281. [Google Scholar] [CrossRef] [PubMed]
  4. Volk, M.; Liersch, S.; Schmidt, G. Towards the implementation of the European Water Framework Directive?: Lessons learned from water quality simulations in an agricultural watershed. Land Use Policy 2009, 26, 580–588. [Google Scholar] [CrossRef]
  5. Rankinen, K.; Keinänen, H.; Cano Bernal, J.E. Influence of climate and land use changes on nutrient fluxes from Finnish rivers to the Baltic Sea. Agric. Ecosyst. Environ. 2016, 216, 100–115. [Google Scholar] [CrossRef]
  6. Ouyang, W.; Huang, H.; Hao, F.; Shan, Y.; Guo, B. Evaluating spatial interaction of soil property with non-point source pollution at watershed scale: The phosphorus indicator in Northeast China. Sci. Total Environ. 2012, 432, 412–421. [Google Scholar] [CrossRef]
  7. Shrestha, S.; Bhatta, B.; Shrestha, M.; Shrestha, P.K. Integrated assessment of the climate and landuse change impact on hydrology and water quality in the Songkhram River Basin, Thailand. Sci. Total Environ. 2018, 643, 1610–1622. [Google Scholar] [CrossRef]
  8. Kändler, M.; Blechinger, K.; Seidler, C.; Pavlů, V.; Šanda, M.; Dostál, T.; Krása, J.; Vitvar, T.; Štich, M. Impact of land use on water quality in the upper Nisa catchment in the Czech Republic and in Germany. Sci. Total Environ. 2017, 586, 1316–1325. [Google Scholar] [CrossRef]
  9. Arnold, J.G.; Moriasi, D.N.; Gassman, P.W.; Abbaspour, K.C.; White, M.J.; Srinivasan, R.; Santhi, C.; Harmel, R.D.; van Griensven, A.; Van Liew, M.W.; et al. SWAT: Model Use, Calibration, and Validation. Trans. ASABE 2012, 55, 1491–1508. [Google Scholar] [CrossRef]
  10. Zhang, W.; Li, H.; Hyndman, D.; Diao, Y.; Jianwei, G.; Pueppke, S. Water quality trends under rapid agricultural expansion and enhanced in-stream interception in a hilly watershed of Eastern China. Environ. Res. Lett. 2020, 15, 084030. [Google Scholar] [CrossRef]
  11. Qi, D.; Wu, Q.; Zhu, J. Nitrogen and phosphorus losses from paddy fields and the yield of rice with different water and nitrogen management practices. Sci. Rep. 2020, 10, 9734. [Google Scholar] [CrossRef] [PubMed]
  12. Zhang, W.; Li, H.; Pueppke, S.G. Direct measurements of dissolved N2 and N2O highlight the strong nitrogen (N) removal potential of riverine wetlands in a headwater stream. Sci. Total Environ. 2022, 848, 157538. [Google Scholar] [CrossRef] [PubMed]
  13. Zhang, W.; Li, H.; Kendall, A.; Hyndman, D.; Diao, Y.; Jianwei, G.; Pang, J. Nitrogen transport and retention in a headwater catchment with dense distributions of lowland ponds. Sci. Total Environ. 2019, 683, 37–48. [Google Scholar] [CrossRef]
  14. Pang, J.; Li, H.; Tang, X.; Geng, J. Carbon dynamics and environmental controls of a hilly tea plantation in Southeast China. Ecol. Evol. 2019, 9, 9723–9735. [Google Scholar] [CrossRef]
  15. Pasha, S.V.; Dadhwal, V.K.; Kumari, K.; Ali, N. Historical expansion of tea plantations over 150 years (1876–2023) in North Bengal, India. Environ. Monit. Assess. 2024, 196, 1071. [Google Scholar] [CrossRef]
  16. Munasinghe, M.; Deraniyagala, Y.; Dassanayake, N.; Karunarathna, H. Economic, social and environmental impacts and overall sustainability of the tea sector in Sri Lanka. Sustain. Prod. Consum. 2017, 12, 155–169. [Google Scholar] [CrossRef]
  17. Huang, X.; Lakshmanan, P.; Zhang, W.; Wang, X.; Liu, B.; Ni, K.; Ruan, J.; Shi, X.; Chen, X.; Zhang, F. Large loss of reactive nitrogen and the associated environmental damages from tea production in China. Agric. Ecosyst. Environ. 2025, 377, 109252. [Google Scholar] [CrossRef]
  18. Lu, C.P.; Ji, K.Y.; Zhang, Y.; Fleckenstein, J.H.; Zheng, C.M.; Salsky, K. Event-Driven Hyporheic Exchange during Single and Seasonal Rainfall in a Gaining Stream. Water Resour. Manag. 2020, 34, 4617–4631. [Google Scholar] [CrossRef]
  19. Liu, L.; Ouyang, W.; Wang, Y.; Lian, Z.; Pan, J.; Liu, H.; Chen, J.; Niu, S. Paddy water managements for diffuse nitrogen and phosphorus pollution control in China: A comprehensive review and emerging prospects. Agric. Water Manag. 2023, 277, 108102. [Google Scholar] [CrossRef]
  20. Moriasi, D.; Arnold, J.; Van Liew, M.; Bingner, R.; Harmel, R.D.; Veith, T. Model Evaluation Guidelines for Systematic Quantification of Accuracy in Watershed Simulations. Trans. ASABE 2007, 50, 885–900. [Google Scholar] [CrossRef]
  21. Krause, P.; Boyle, D.; Bäse, F. Comparison of Different Efficiency Criteria for Hydrologic Models. Adv. Geosci. 2005, 5, 89–97. [Google Scholar] [CrossRef]
  22. Niraula, R.; Kalin, L.; Wang, R.; Srivastava, P.; Srivastava, P. Determining Nutrient and Sediment Critical Source Areas with SWAT: Effect of Lumped Calibration. Trans. ASABE 2011, 55, 137–147. [Google Scholar] [CrossRef]
  23. Gupta, H.; Sorooshian, S.; Yapo, P. Status of Automatic Calibration for Hydrologic Models: Comparison With Multilevel Expert Calibration. J. Hydrol. Eng. 1999, 4, 135–143. [Google Scholar] [CrossRef]
  24. Giri, S.; Nejadhashemi, A.; Zhang, Z.; Woznicki, S. Integrating statistical and hydrological models to identify implementation sites for agricultural conservation practices. Environ. Model. Softw. 2015, 72, 327–340. [Google Scholar] [CrossRef]
  25. Arabi, M.; Frankenberger, J.R.; Engel, B.A.; Arnold, J.G. Representation of agricultural conservation practices with SWAT. Hydrol. Process. 2008, 22, 3042–3055. [Google Scholar] [CrossRef]
  26. Wang, J.; Wang, D.; Zhang, G.; Wang, Y.; Wang, C.; Teng, Y.; Christie, P. Nitrogen and phosphorus leaching losses from intensively managed paddy fields with straw retention. Agric. Water Manag. 2014, 141, 66–73. [Google Scholar] [CrossRef]
  27. Wei, X.; Bailey, R. Evaluating Nitrate and Phosphorus Remediation in Intensively Irrigated Stream-Aquifer Systems Using a Coupled Flow and Reactive Transport Model. J. Hydrol. 2021, 598, 126304. [Google Scholar] [CrossRef]
  28. Wang, K.; Onodera, S.-i.; Saito, M.; Shimizu, Y. Assessment of nitrogen budget in detailed spatial pattern using high precision modeling approach with constructed accurate agricultural behavior. Sci. Total Environ. 2024, 912, 169631. [Google Scholar] [CrossRef]
  29. Liu, R.; Peipei, Z.; Wang, X.; Chen, Y.; Shen, Z. Assessment of effects of best management practices on agricultural non-point source pollution in Xiangxi River watershed. Agric. Water Manag. 2013, 117, 9–18. [Google Scholar] [CrossRef]
  30. Tuppad, P.; Kannan, N.; Srinivasan, R.; Green, C.; Arnold, J. Simulation of Agricultural Management Alternatives for Watershed Protection. Water Resour. Manag. 2010, 24, 3115–3144. [Google Scholar] [CrossRef]
  31. Oduor, B.; Campo-Bescós, M.; Lana-Renault, N.; Kyllmar, K.; Mårtensson, K.; Casalí, J. Quantification of agricultural best management practices impacts on sediment and phosphorous export in a small catchment in southeastern Sweden. Agric. Water Manag. 2023, 290, 108595. [Google Scholar] [CrossRef]
  32. Evrard, O.; Persoons, E.; Vandaele, K.; van Wesemael, B. Effectiveness of erosion mitigation measures to prevent muddy floods: A case study in the Belgian loam belt. Agric. Ecosyst. Environ. 2007, 118, 149–158. [Google Scholar] [CrossRef]
  33. López-Ballesteros, A.; Senent-Aparicio, J.; Srinivasan, R.; Pérez-Sánchez, J. Assessing the Impact of Best Management Practices in a Highly Anthropogenic and Ungauged Watershed Using the SWAT Model: A Case Study in the El Beal Watershed (Southeast Spain). Agron. J. 2019, 9, 576. [Google Scholar] [CrossRef]
  34. Sun, S.; Tian, Y.; Li, L.; Zhuang, Y.; Zhou, X.; Zhang, H.; Zhan, W.; Zuo, W.; Luan, C.; Huang, K. Unraveling spatial patterns and source attribution of nutrient transport: Towards optimal best management practices in complex river basin. Sci. Total Environ. 2024, 906, 167686. [Google Scholar] [CrossRef]
  35. Zeiger, S.; Hubbart, J. A SWAT Model Validation of Nested-Scale Contemporaneous Stream Flow, Suspended Sediment and Nutrients from a Multiple-Land-Use Watershed of the Central USA. Sci. Total Environ. 2016, 572, 232–243. [Google Scholar] [CrossRef]
  36. Bryant, R.B.; Gburek, W.J.; Veith, T.L.; Hively, W.D. Perspectives on the potential for hydropedology to improve watershed modeling of phosphorus loss. Geoderma 2006, 131, 299–307. [Google Scholar] [CrossRef]
  37. Liu, M.; Chen, X.; Yao, H.; Chen, Y. A coupled modeling approach to evaluate nitrogen retention within the Shanmei Reservoir watershed, China. Estuar. Coast. Shelf Sci. 2015, 166, 189–198. [Google Scholar] [CrossRef]
  38. Jingyi, H.; Ouyang, W.; Yang, Z. Impacts of extreme climate on nitrogen loss in different forms and pollution risk with the copula model. J. Hydrol. 2023, 620, 129412. [Google Scholar]
  39. Zhang, Y.; Shi, P.; Li, F.; Wei, A.; Song, J.; Ma, J. Quantification of nitrate sources and fates in rivers in an irrigated agricultural area using environmental isotopes and a Bayesian isotope mixing model. Chemosphere 2018, 208, 493–501. [Google Scholar] [CrossRef]
  40. Shi, P.; Zhang, Y.; Song, J.; Li, P.; Wang, Y.; Zhang, X.; Li, Z.; Bi, Z.; Zhang, X.; Qin, Y.; et al. Response of nitrogen pollution in surface water to land use and social-economic factors in the Weihe River watershed, northwest China. Sustain. Cities Soc. 2019, 50, 101658. [Google Scholar] [CrossRef]
  41. Zhang, W.; Li, H.; Pueppke, S.G.; Diao, Y.; Nie, X.; Geng, J.; Chen, D.; Pang, J. Nutrient loss is sensitive to land cover changes and slope gradients of agricultural hillsides: Evidence from four contrasting pond systems in a hilly catchment. Agric. Water Manag. 2020, 237, 106165. [Google Scholar] [CrossRef]
  42. Li, T.; Ma, F.; Wang, J.; Qiu, P.; Zhang, N.; Guo, W.; Xu, J.; Dai, T. Study on the Mechanism of Rainfall-Runoff Induced Nitrogen and Phosphorus Loss in Hilly Slopes of Black Soil Area, China. Water 2023, 15, 3148. [Google Scholar] [CrossRef]
  43. Haidary, A.; Amiri, B.J.; Adamowski, J.; Fohrer, N.; Nakane, K. Assessing the Impacts of Four Land Use Types on the Water Quality of Wetlands in Japan. Water Resour. Manag. 2013, 27, 2217–2229. [Google Scholar] [CrossRef]
  44. Peng, S.-Z.; Yang, S.-H.; Xu, J.-Z.; Luo, Y.-F.; Hou, H.-J. Nitrogen and phosphorus leaching losses from paddy fields with different water and nitrogen managements. Paddy Water Environ. 2011, 9, 333–342. [Google Scholar] [CrossRef]
  45. Giri, S.; Qiu, Z. Understanding the relationship of land uses and water quality in Twenty First Century: A review. J. Environ. Manag. 2016, 173, 41–48. [Google Scholar] [CrossRef]
  46. Zhou, Y.; Xu, J.F.; Yin, W.; Ai, L.; Fang, N.F.; Tan, W.F.; Yan, F.L.; Shi, Z.H. Hydrological and environmental controls of the stream nitrate concentration and flux in a small agricultural watershed. J. Hydrol. 2017, 545, 355–366. [Google Scholar] [CrossRef]
  47. Choi, W.-J.; Han, G.-H.; Lee, S.-M.; Lee, G.-T.; Yoon, K.-S.; Choi, S.-M.; Ro, H.-M. Impact of land-use types on nitrate concentration and δ15N in unconfined groundwater in rural areas of Korea. Agric. Ecosyst. Environ. 2007, 120, 259–268. [Google Scholar] [CrossRef]
  48. Li, Z.; Liu, W.-z.; Zhang, X.-c.; Zheng, F.-l. Impacts of land use change and climate variability on hydrology in an agricultural catchment on the Loess Plateau of China. J. Hydrol. 2009, 377, 35–42. [Google Scholar] [CrossRef]
  49. Chen, B.; Chang, S.X.; Lam, S.K.; Erisman, J.W.; Gu, B. Land use mediates riverine nitrogen export under the dominant influence of human activities. Environ. Res. Lett. 2017, 12, 094018. [Google Scholar] [CrossRef]
  50. Chang, D.; Li, S.; Lai, Z. Effects of extreme precipitation intensity and duration on the runoff and nutrient yields. J. Hydrol. 2023, 626, 130281. [Google Scholar] [CrossRef]
  51. Wang, K.; Onodera, S.-i.; Saito, M.; Ishida, T. Assessment of long-term phosphorus budget changes influenced by anthropogenic factors in a coastal catchment of Osaka Bay. Sci. Total Environ. 2022, 843, 156833. [Google Scholar] [CrossRef] [PubMed]
  52. Liu, X.; Wang, H.-Y.; Zhou, J.; Hu, F.; Zhu, D.; Chen, Z.; Liu, Y. Effect of N Fertilization Pattern on Rice Yield, N Use Efficiency and Fertilizer–N Fate in the Yangtze River Basin, China. PLoS ONE 2016, 11, e0166002. [Google Scholar] [CrossRef] [PubMed]
  53. Woznicki, S.; Nejadhashemi, A.; Smith, C. Assessing Best Management Practice Implementation Strategies Under Climate Change Scenarios. Trans. ASABE 2011, 54, 171–190. [Google Scholar] [CrossRef]
  54. Akan, A.O.; Atabay, S. Grass filter strip residence time-trap efficiency relationship. Water Environ. J. 2017, 31, 277–283. [Google Scholar] [CrossRef]
  55. López-Ballesteros, A.; Trolle, D.; Srinivasan, R.; Senent-Aparicio, J. Assessing the effectiveness of potential best management practices for science-informed decision support at the watershed scale: The case of the Mar Menor coastal lagoon, Spain. Sci. Total Environ. 2023, 859, 160144. [Google Scholar] [CrossRef]
  56. Liu, Y.; Guo, T.; Wang, R.; Engel, B.A.; Flanagan, D.C.; Li, S.; Pijanowski, B.C.; Collingsworth, P.D.; Lee, J.G.; Wallace, C.W. A SWAT-based optimization tool for obtaining cost-effective strategies for agricultural conservation practice implementation at watershed scales. Sci. Total Environ. 2019, 691, 685–696. [Google Scholar] [CrossRef]
Figure 1. (a) Location, land use, and sampling points of the Zhongtian River Basin. Digital elevation model (DEM) of (b) sub-basins and (c) monitoring stations of the watershed. The numbers in (c) represent different sub-basins.
Water 17 00821 g001
Figure 2. Comparison of average monthly simulated and observed (a) runoff and (b) total nitrogen (TN) load at the hydrological station during the calibration and validation periods. NSE—Nash–Sutcliffe efficiency; PBIAS—percentage bias.
Water 17 00821 g002
Figure 3. (a) Comparison of multi-year average monthly observed precipitation, flow, and total nitrogen (TN) load in the watershed. Linear regression analysis between monthly observed precipitation and (b) flow and (c) TN load.
Water 17 00821 g003
Figure 4. Spatial distribution of total nitrogen (TN) load intensity at the sub-basin scale for the annual average (a), wet season (b), and dry season (c). Spatial distribution of TN load intensity and at hydrologic response unit (HRU) scales for the annual average (d), wet season (e), and dry season (f).
Water 17 00821 g004
Figure 5. (a) TN load intensity and (b) nitrate load intensity of different land use types.
Water 17 00821 g005
Figure 6. Correlation analysis between nitrogen load and multiple environmental factors at the HRU scale: (a) annual average, (b) wet season, and (c) dry season. Redundancy analysis (RDA) between nitrogen load and multiple environmental factors: (d) annual average, (e) wet season, and (f) dry season. Abbreviations are as follows: sediment yield (SYLD), water yield contribution by surface runoff (SURQ), water yield contribution by lateral flow (LATQ), and water yield contribution by groundwater (GW_Q).
Water 17 00821 g006
Table 1. Database of SWAT setup.
Data TypeSource
DEMNASA Aster G-DEM (https://www.earthdata.nasa.gov/news/new-aster-gdem, accessed on 15 March 2024)
SoilThe Soil Archives of Jiangsu Province and field survey
Land useCNLUCC and field survey (http://www.resdc.cn, accessed on 15 March 2024)
ClimateThe Jiangsu Provincial Meteorological Administration
FertilizationTianmuhu town, Changzhou City statistical yearbook, and field survey
Table 2. Potential best management practices (BMPs) for the watershed with detailed descriptions and assessments of the effectiveness of each BMP scenario in reducing pollution. R—reduction rate; FR—fertilizer reduction; CF—contour farming; RM—residue management; FS—filter strips; GW—grassed waterways.
BMP TypeCodeScenarioDescriptionRTNRNO3-NRORGN
Agricultural BMPsFRFertilizer reduction30% reduction in fertilizer application6.44%21.26%/
CFContour farmingPlowing along contour lines4.75%/6.94%
RMResidue ManagementControlling the amount and distribution of crop/plant residue on the soil surface3.66%/5.38%
Engineered
BMPs
FSFilter stripsSet up filter strips with a 10 m width at the farmland periphery10.21%5.53%12.23%
GWGrassed waterwaysSet up grassed waterways with a 200 m length and a 0.6 m depth21.80%9.60%27.07%
Disclaimer/Publisher’s Note: The statements, opinions and data contained in all publications are solely those of the individual author(s) and contributor(s) and not of MDPI and/or the editor(s). MDPI and/or the editor(s) disclaim responsibility for any injury to people or property resulting from any ideas, methods, instructions or products referred to in the content.

