Article

From Data Scarcity to Solutions: Hydrological and Water Management Modeling in a Highly Managed River Basin

by
Hagen Koch
1,*,
Gnibga Issoufou Yangouliba
2,3 and
Stefan Liersch
1
1
Potsdam Institute for Climate Impact Research (PIK), Leibniz Association, P.O. Box 60 12 03, D-14412 Potsdam, Germany
2
Sciences Transversales/Géomatique, Université Virtuelle du Burkina Faso, Ouagadougou BP 64, Burkina Faso
3
Competence Center, West African Science Service Centre on Climate Change and Adapted Land Use (WASCAL), Ouagadougou P.O. Box 9507, Burkina Faso
*
Author to whom correspondence should be addressed.
Water 2025, 17(6), 823; https://doi.org/10.3390/w17060823
Submission received: 20 December 2024 / Revised: 6 March 2025 / Accepted: 6 March 2025 / Published: 13 March 2025
(This article belongs to the Section Water Resources Management, Policy and Governance)

Abstract

:
In many river basins worldwide, decision-making depends on limited data and information. Yet, decisions, like the planning of a new multi-purpose dam, must be taken relying on available data. The incorporation of socio-economic developments, climate or land use changes into this process remains a separate concern. Undoubtedly, authorities worldwide possess undisclosed data, which complicates scientific efforts. This study aims to address the challenges of developing a hydrological and water management model for the data-scarce and extensively managed Volta River Basin in West Africa. To overcome the limitations posed by sparse easily accessible observational data, a time- and resource-demanding data integration approach was applied using a diverse array of data sources covering various time periods, including manually digitized analog records from hydrological yearbooks, graphics, and other multilingual sources. This approach has been shown to enhance the spatio-temporal availability of data, thereby allowing for the optimization of model parameters to simulate the increasing impact of human intervention on river discharge. The incorporation of comprehensive data has enhanced the robustness of the model, where complex hydrological processes and water management dynamics are captured with greater accuracy. This would not have been possible if only the easily accessible data had been used.

1. Introduction

Land use and climatic changes are affecting the hydrologic cycle. The combined effects of socio-economic development, population growth, and rising water and energy demands present significant challenges for water management planning. For the planning of adaptation measures to land use and climatic changes, considering future water availability and demand, reliable information and data are needed. The required data, e.g., long observational times series of river discharge, are available in many river basins of Europe, Asia, or North America. These data also can be used to calibrate and validate hydrological models [1,2,3]. In other regions, e.g., in African river basins, observational time series are often unavailable, short, or contain many gaps. Furthermore, the observed river discharges can be affected by anthropogenic activities, e.g., water use, water transfers, and reservoir operation.
If models are applied to generate the required information and data for water management planning, these models must integrate the most important natural and man-made components of the system. For enabling the evaluation of the entire system encompassing climate, rainfall-runoff processes, water use and management, and water storage in soils, these models have to be parametrized representing the temporal and spatial distribution of its components and flows. Due to the non-linearity of hydrological processes, e.g., [4,5,6], deviations in the climate input, especially rainfall, have an enormous impact in hydrological simulations. As every climate data set has its own characteristics, a hydrological model needs to be parametrized to each climate forcing data set separately.
In the African context, with hydropower generation supplying a high share of electricity, many large rivers are affected by reservoir operation. Due to reservoir operation, water withdrawals, and return flows, observed river discharge can deviate strongly from natural flow [7,8,9,10,11]. River discharges downstream typically decrease due to reservoir losses from evaporation and seepage. In semi-arid regions, river discharge can also be affected by large water volumes withdrawn for agricultural irrigation as well as elevated transmission losses in the downstream river sections of reservoirs during the dry season [12].
Therefore, observed flows in highly managed river basins cannot easily be used to calibrate and validate hydrological models. If sufficient data on reservoir operation and water use are available, observed flows can be naturalized [13]. Naturalized river flows are created by adjusting observed flows to known artificial influences, e.g., reservoir operation, water withdrawals, or return flows. This approach cannot be applied if the required river discharge and water management data are unavailable. In regions with limited data availability, whether for observed climate, river discharge, or water resources management, as found in many regions in Africa, innovative data integration approaches must be used.
A number of studies have been published in recent decades that analyze observed climate and river discharge data for West Africa, the Volta River Basin, or parts of it. Amongst these studies are those of [14,15,16] that investigated rainfall, temperature, and river discharge trends employing time series dating back to the 1930s. These studies found clearly positive temperature trends but found either opposing short-term or no significant long-term trends for rainfall and discharge. On the one hand, this discrepancy can be attributed to the natural variability of rainfall, governed by the West African monsoon system, with cyclic patterns of consecutive wet and dry years [17,18]. On the other hand, Mahé and Paturel (2009) [19] and Mahé et al. (2013) [20] argue that the high runoff after 1990 despite lower annual rainfall sums compared to the 1960s may have been caused by increased runoff coefficients due to land use change (agricultural areas with usually higher runoff compared to natural vegetation) and non-recovery of vegetation after the 1980s drought (including crusting of soils and reduced infiltration after vegetation die-off), while Nka et al. (2015) [21] and Abdou et al. (2018) [22] also mention an increase in heavy rainfall as potential cause. A greater contribution of extreme precipitation to the annual total precipitation sums in the Sahelian region has been observed since the year 2000 [23]. Salack et al. (2018) [24] found a decrease in extreme rainfall in the West African Sahel for the 1980s compared to the 1960s and an increase since the late 1980s with extreme rainfall after 2010 being even higher than in the 1960s.
To assess climate and land use change impacts on the water–energy–food nexus, hydropower potentials, river discharge, and groundwater recharge, a plethora of modelling studies employing SWAT [25,26,27,28,29], a distributed rainfall-runoff model [30], HBV [31], and WEAP [32] have been conducted. The studies were conducted at various scales covering entire West African river basins [25], the Volta River Basin [29], White Volta [26,27,28,32], Black Volta [30], and Bamboi [31]. Although some of the above-cited articles suggest the set-up and application of hydrological or water management models for entire sub-basins of the Volta River Basin, e.g., Nakambé (White Volta) or Mohoun (Black Volta), in many cases, however, only parts of the indicated sub-basin were included. Often the models were calibrated and validated for only one gauge (outlet) and at a monthly time step. Furthermore, there was a lack of information regarding the consideration of water management and reservoir operation upstream of the gauges used for calibration and validation.
Conway et al. (2009) [16] conclude that a robust identification and attribution of hydrological changes for Sub-Saharan Africa is severely limited by data availability. We would like to add that accessibility and data procurement constitute a substantial component of availability. Furthermore, many authors acknowledge the influence of anthropogenic activities, such as reservoir operation and water use, which remained unquantified in their studies [14,15,16,29], and the presence of significant gaps in the discharge time series, which impair the ability to detect long-term trends.
Limited data availability is particularly challenging for calibrating reliable models and for drawing conclusions about climate change and its consequences. The acquisition of data is a multifaceted undertaking and should not be underestimated, particularly with regard to the allocation of resources. Nevertheless, there are frequently data that are both accessible and obtainable by using innovative methods. In this paper, we demonstrate how the challenges of data scarcity and quality can be addressed to some extent. The methodology entails (i) data acquisition and (ii) a step-wise calibration and validation of an eco-hydrological and water management model utilizing discontinuous observational data within the extensively managed Volta River Basin in West Africa. The necessary data sets were obtained through the use of readily accessible open data sources, enhanced methods such as the digitization of hydrological yearbooks and figures, and the data filling and checking by means of cross-correlation with nearby gauges. In some instances, calculated discharge time series, for example, the inflow to Lake Volta, were employed to evaluate the quality of the simulated discharge. The objective of the work presented was to conduct simulations of various water management and climate change scenarios for the entire Volta River Basin (see Liersch et al., 2023 [12]).

2. Data and Methods

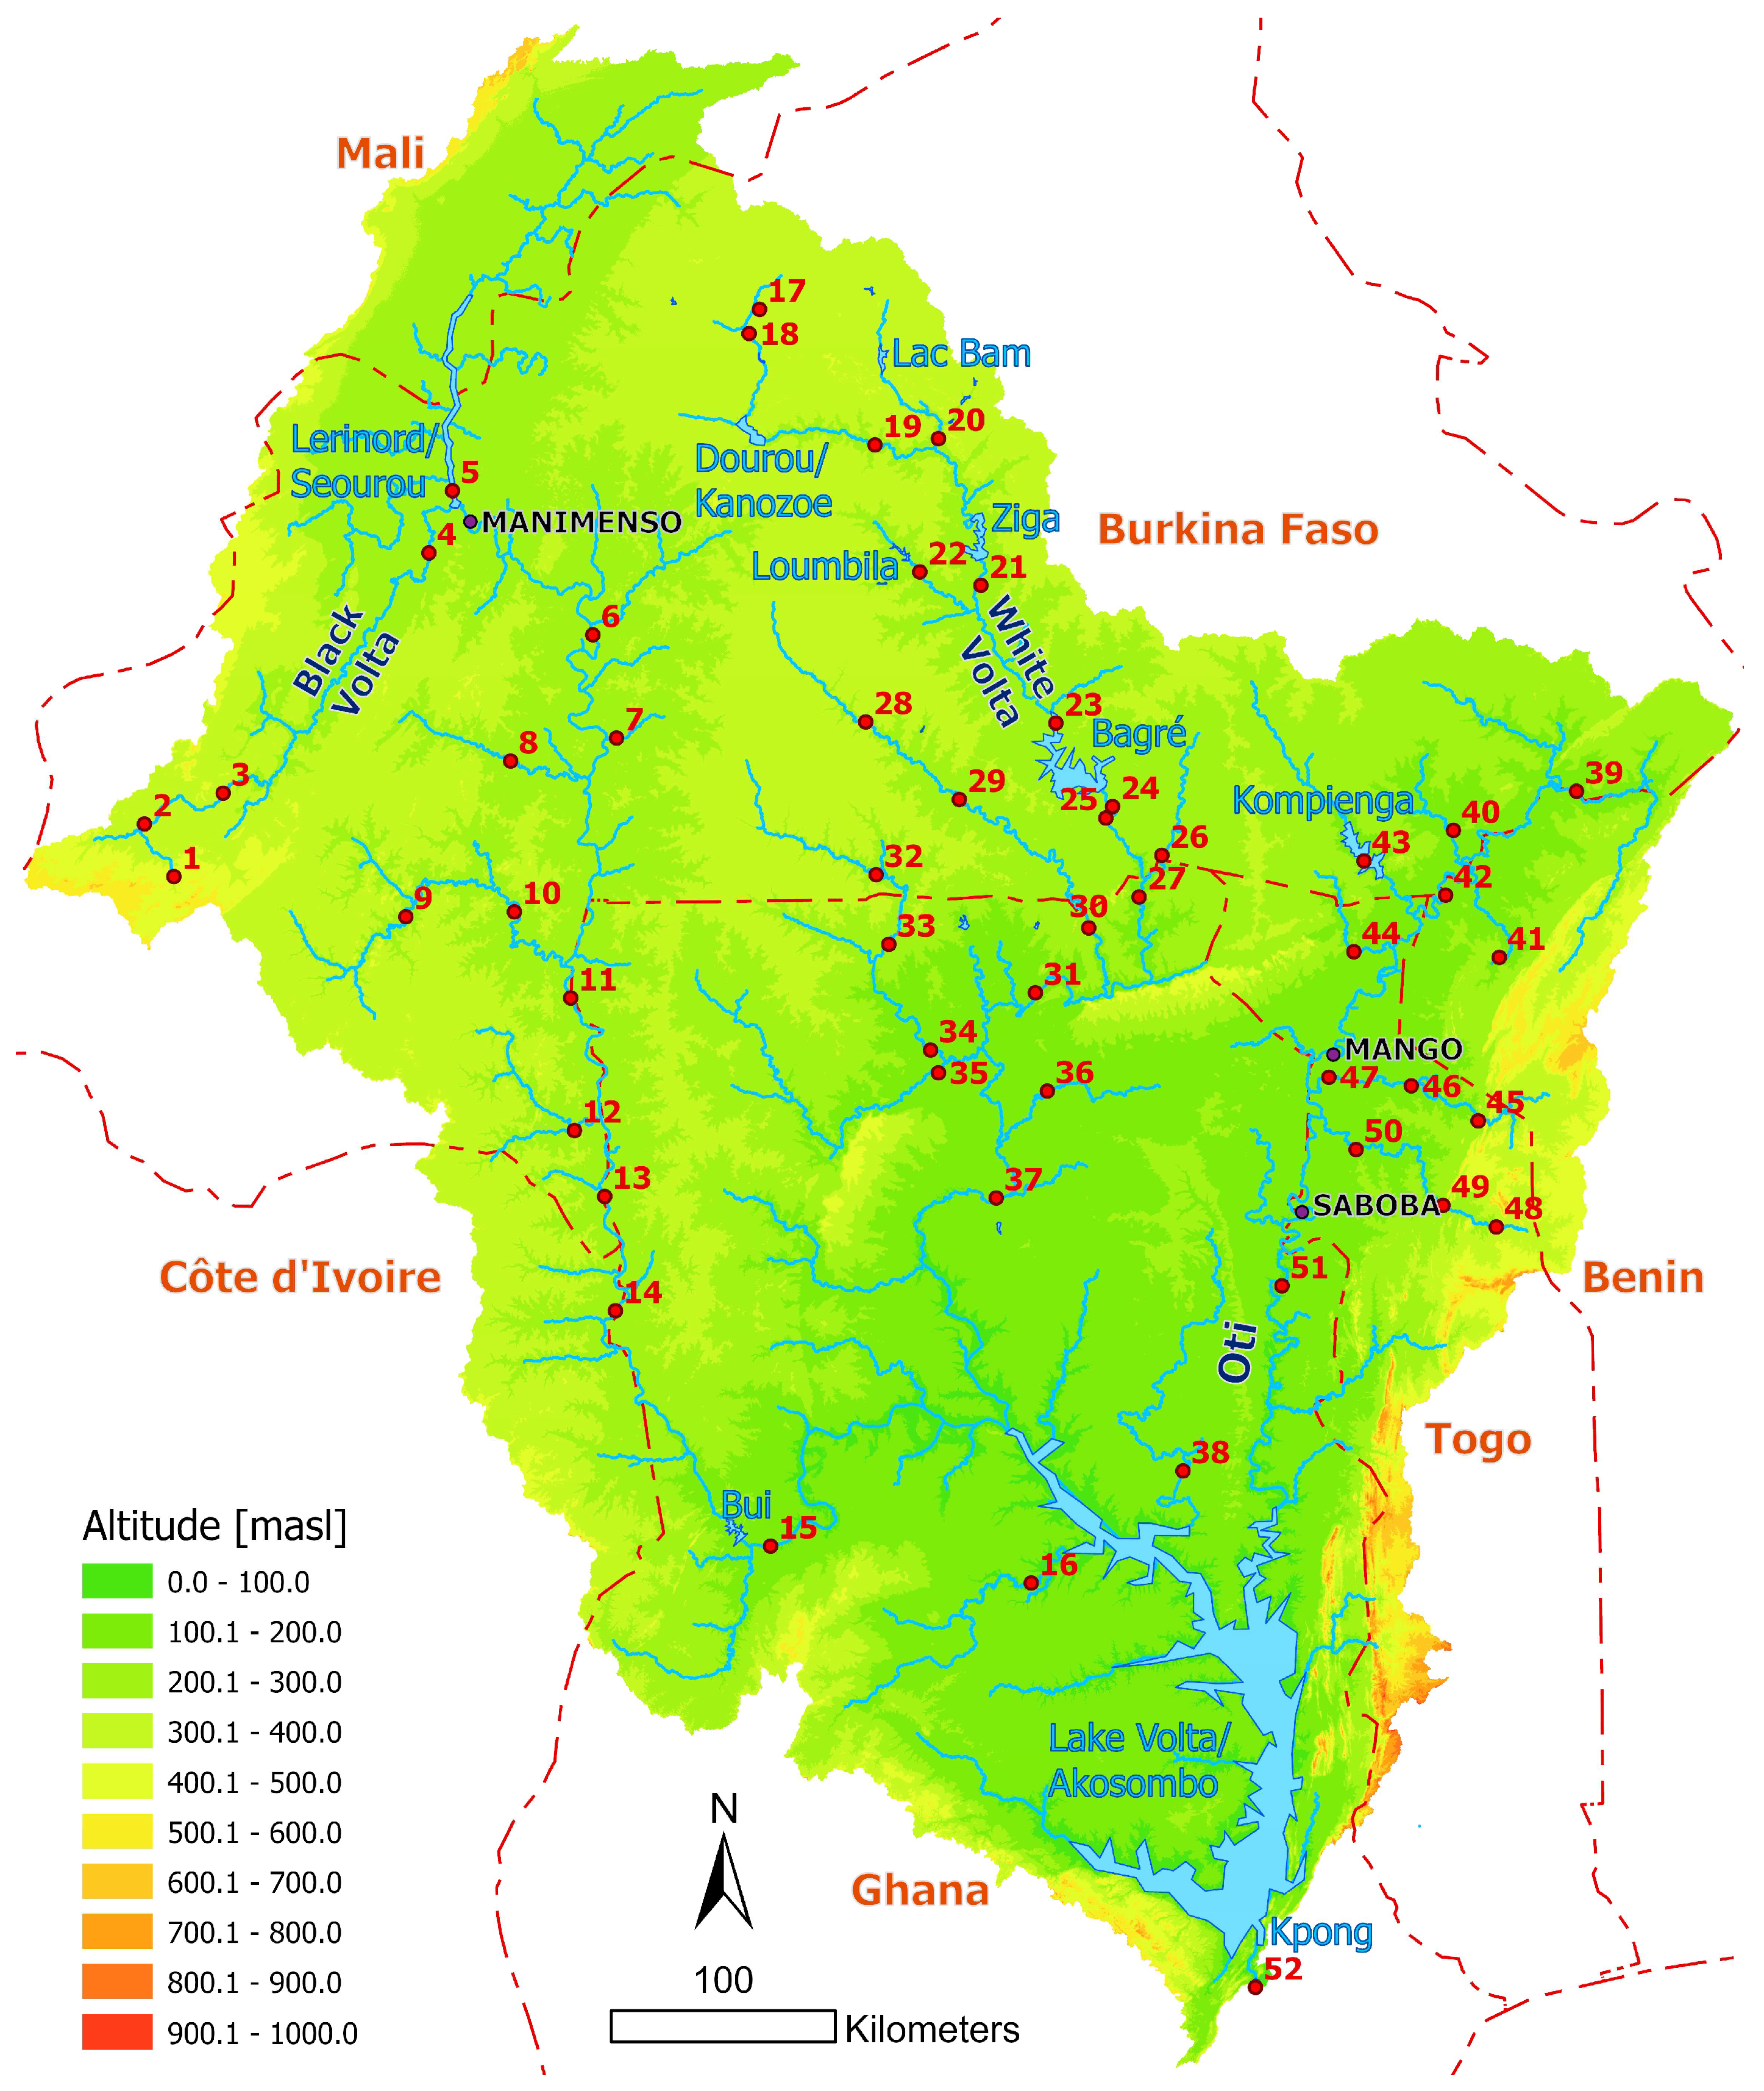
2.1. The Volta River Basin

The Volta River Basin (VRB) covers an area of about 403,000 km2 and is shared by six West African countries (Figure 1). About 85% of the basin area is in Burkina Faso and Ghana in roughly equal parts. The remaining 15% is located in Mali, Benin, Togo, and Côte d’Ivoire. The three main tributaries are the Black Volta River (Mouhoun) in the west, the White Volta River (Nakambé) in the northern-central region, and the Oti River (Pendjari) in the east. Most Volta tributaries origin is in Burkina Faso, except the Oti River originating in Benin and then passing through Togo, and all are flowing southward into Ghana where the Volta River flows into the Atlantic Ocean. In the very south of the basin is Lake Volta, formed by the Akosombo hydropower dam built in 1964, on the Volta River. With a surface area of 8500 km2 and a total storage capacity of 148 km3, it is one of the largest man-made lakes in the world.
Especially the northern and middle parts of the VRB are characterized by a semi-arid climate with high temporal and spatial variation in rainfall causing large variability in river discharge over short durations [33,34]. Rainfall events occur infrequently but at high magnitude and channels remain dry for long periods because base flow is low or non-existent as a result of low soil water storage capacity and a lack of connection to aquifers. In this type of system, river discharge depends almost exclusively on rainfall and is often related to intense ”high- energy” rainfall, leading to flash floods [35,36]. The lower, southern part of the VRB is characterized by much higher annual rainfall sums and some rivers are permanent.
Over the last decades, a number of large and innumerable small reservoirs were built in the VRB. While the smaller reservoirs serve for local drinking and irrigation water supply, most of the larger reservoirs are multi-purpose and besides supplying water also generate hydropower.

2.2. The Eco-Hydrological Model SWIM

The Soil and Water Integrated Management (SWIM) model is a continuous-time, spatially semi-distributed eco-hydrological model. It is process-based, combining physics-based processes and empirical approaches. It was developed from an early version of the SWAT model [37] and the MATSALU model [38], mainly for climate change and land-use change impact studies. SWIM simulates hydrological processes, vegetation growth, erosion, and nutrient dynamics at the river-basin scale. Hydrological response units (HRUs) are the core elements of the model. HRUs are considered as units with same properties regarding bio-physical processes. There is no lateral connection between hydrotopes. All processes at the hydrotope level are calculated at the daily time-step. Besides spatial data, SWIM requires temporal input data, e.g., daily weather data including precipitation, air temperature (minimum, maximum, mean), radiation, and humidity.
The river network and 578 sub-basins for the VRB were delineated using the location of gauges and the SRTM Digital Elevation Model [39]. Thereafter, HRUs were derived using sub-basins, information on land use/cover taken from GLC2000, and soil data. Data for the spatial soil distribution are from [40]. This soil map was combined with general soil characteristics according to FAO soil classes.
For the parameter optimization of the model, 70 subcatchments, i.e., conglomerates of sub-basins, were defined and for each subcatchment a parameter set was derived. The most sensitive parameters were ecal (correction factor for potential evaporation), roc parameters (routing coefficients to calculate the storage time constant), sccor (correction factor for saturated conductivity), bff (baseflow factor), delay (groundwater delay), and abf (groundwater recession).
The reservoir module of SWIM, described in [41], was applied. The reservoir module is a conceptual representation of storage-release processes based on three management options, to which the reservoirs are assigned according to their operation: (i) objective is the minimum discharge downstream considering minimum and maximum reservoir volumes for each month; (ii) daily release based on hydropower generation demand considering the minimum and maximum reservoir volumes for each month, other restrictions can be included, e.g., daily minimum or maximum discharges; (iii) daily release based on the water level of the reservoir. Furthermore, the water allocation module of SWIM, described in [12], was applied to simulate water allocation.

2.3. Meteorological Data

The meteorological data used to calibrate and validate SWIM consisted of the daily gridded data sets WFDE40 [42], available for 1957–2001, and WFDE5 [43], available for 1979–2019. Both data sets are on a horizontal resolution of 0.5°.
Furthermore, daily observed precipitation data for 19 stations in Burkina Faso for 1970–2013 from Agence Nationale de la Météorologie du Burkina Faso (ANAM-BF) were used to check the quality of the WFDE40 and WFDE5 data. Annual precipitation sums for 139 stations within and near to the VRB for 1949–1973 are available from [44]. However, this data set does not include any station in Mali, i.e., the very northern part of the VRB (see Figure 2a). These data were used to check the quality of the WFDE40 data before 1973.
The climate scenario simulations used by [12] were provided by the Inter-Sectoral Impact Model Intercomparison Project [45,46] Phase 3. The method for downscaling and regionalizing the climate scenario data is described in Lange (2019) [47] and was applied using WFDE5 as reference data. For a consistent approach in climate impact assessment, the data set used to bias-adjust climate models must also be used to parameterize the model, SWIM in this case. Hence, we employed WFDE5 for the final parameter optimization of the model.

2.4. Hydrological Data

According to Krysanova et al. (2018) [48], hydrological models to be applied in climate impact studies for larger river basins should be calibrated and validated not only at the outlet but also at internal gauges to integrate the different characteristics of the river basin.
One of the main problems during the parameter optimization was the unavailability of continuous observed river discharge time series for 1979–2016 with no or negligible anthropogenic impacts on the observations. The strongest impact clearly was the construction of the Akosombo hydropower dam (Lake Volta) close to the outlet of the Volta River in 1964, making the use of observed discharge at gauge Senchi after 1964 unusable in the parameter optimization. Over the years additional major dams were built in the VRB, so that the gauges situated upstream of Lake Volta also became unsuitable for parameterizing the model. With increasing population, drinking and irrigation water withdrawals also increased over time, adding to the impacts of the dams.
As continuous and reliable observed river discharges and information on reservoir operation and water use were not available for the VRB, the approach to remove the anthropogenic impacts from observed discharges to create naturalized discharge time series (see [13]) could not be applied in this study.
Easily available and often used observed river discharge time series are provided by the Global Runoff Data Centre (GRDC). In this study, daily time series from 22 GRDC gauges were used, most of these starting in the 1960s or 1970s and ending in 2008. For a few gauges, monthly time series are also available. These were only partially used in this study for different reasons.
  • In intermittent, highly dynamic rivers, as found in large parts of the VRB, the monthly time step masks the very dynamic runoff behavior;
  • There may be flaws in monthly time series. For instance, in September 1999 a monthly mean flow of 2830 m3/s is given for gauge Bamboi (GRDC No. 1531100, No. 15 in Figure 1), where the daily time series shows that data are only available for the first seven days of this month (giving exactly the same mean flow of 2830 m3/s for these seven days).
Complementary river discharge time series were provided by Direction Générale des Ressources en Eaux (DGRE) of Burkina Faso. The time periods covered were very heterogeneous, with some covering the period 1960–2018, others covering only a few years. Most time series from GRDC and DGRE contain gaps that span months or even years.
To cover time periods with low anthropogenic impacts on observed discharges, a number of daily time series were manually copied from hydrological yearbooks [49,50,51,52,53] and [44]. These documents were available in PDF format, but with very low resolution, sometimes even illegible, and therefore copy and paste was not possible. Among others, [44] give daily observed discharges for gauges Senchi Ferry, Senchi New Gauge, and Senchi Halcrow for 1931 to 1974 (for reasons of simplicity here named Senchi). It is necessary to mention that the daily observed discharge time series contain some unreliable values, e.g., peak flows with the same number over several days, e.g., gauge Sabari (No. 51 in Figure 1) for an entire week (9–16 September 1963: 3130 m3/s). An overview on the time periods covered by the different gauges is given in Figure S1 (Supplementary Material).
Here we want to point out that data from hydrological yearbooks [49,50,51,52,53] and [44] were found only when searching the web in French, e.g., “debit & Volta” instead of “discharge & Volta”, “annuaire hydrologique & République de Haute-Volta” instead of “hydrological yearbook & Burkina Faso”, taking into account also the old name of Burkina Faso.

2.5. Reservoir Data

The Water Resources Commission (WRC) of Ghana delivered observed reservoir volumes and discharge time series for the Akosombo hydropower dam. They also provided the rule curve, i.e., the relationship between water level and turbined flow, for the operation of the dam. However, it was observed that the actual operation more frequently deviates from the rule curve than adheres to it. The discharge of the Akosombo hydropower dam, which is usually between 600 and 1200 m3/s, depends on the actual water level but also on the electricity demand. In the rainy season, the inflow to the dam is several thousand cubic meters per second, significantly exceeding the outflow. Therefore, using the observed change in the daily volume and the discharge, the inflow can be approximated in the rainy season (see Supplementary Material S.5). This is important because observed inflow to the dam is not available and the gauges at the main rivers entering Lake Volta do not cover the entire upstream basin and are only available for certain time periods. Also, there are many smaller, ungauged rivers entering Lake Volta.
For reservoirs in Burkina Faso, DGRE and Société nationale d’électricité du Burkina (SONABEL), and for the Bui dam in Ghana the Bui Power Authority, provided observed volumes/water levels, inflow, and outflow, and information on the dam operation. The availability of these data, crucial for parametrizing the reservoir operation and assessing the quality of the hydrological simulations, was only possible through collaboration with local actors. Without these vital contacts, such data would not have been easily accessible for this study.
It is important to mention that in the simulations the reservoirs are operated according to their general operation rules, considering actual volumes, water demand, and seasonal restrictions. In the day-to-day operation, often deviations from the general operation rules are found. These are caused by short-term changes in electricity demand, maintenance works at the dam (turbines, generators), the power distribution grid, the water distribution system, etc.

2.6. Land Use/Cover

The parameter optimization of SWIM was performed for time periods between 1957 and 2016, depending on the availability of observed river discharges and climate data. For the setup of the SWIM model, land use/cover was taken from GLC2000 [54], representing approximately the middle of the time period of the WFDE5 data set (1979–2016). Land use/cover was held constant for the entire period. Because the land use/cover of 2000 was at the very end of the time period covered by WFDE40 data set (1957–2001), in the simulations with WFDE40 agricultural areas were replaced by natural vegetation (dry or wet savanna, depending on the region). According to Obahoundje et el. (2018) [55], land use in the VRB changed strongly over time from the year 1988 (savanna types: 79%; agricultural: 3.4%) to 2002 (savanna types: 58%; agricultural: 20%) and 2016 (savanna types: 23%; agricultural: 23%). It is assumed that agricultural land use before 1988 was even lower, justifying the replacement by savanna types for the time period covered by WFDE40.
Although the used land use/cover data contain information on the distribution of the different land use/cover types, due to the scale certain information is not contained. For instance, in regions with semi-arid climate and savanna types, the vegetation close to rivers is often evergreen forests. The respective riverine stretches were selected using www.google.com/maps (accessed on 18 December 2018) and a 100 to 200 m wide band around the respective river stretches was burned into the land use/cover data. The forested riverine stretches were simulated using the approach described in Hattermann et al. (2006) [56].

2.7. Parameter Optimization

The general approach was to use the WFDE40 data set (1957–2001) for a first parameter optimization of SWIM for selected gauges. This parameter optimization was subsequently adapted to the WFDE5 data set for the time period following 1979 for gauges with observed discharges available. For gauges with strong anthropogenic impacts after 1979 or no observed discharges available, the simulated discharges using WFDE40 for the period 1979–2001 were used for the final parameter optimization of SWIM (see Supplementary Material S.3).
The parameter optimization was carried out from upstream to downstream gauges. The calibration was performed manually using mainly daily observed discharge time series (see also examples in the Supplementary Material S.1 and S.2). The manual calibration process also facilitated a deeper comprehension of the hydro-meteorological characteristics and processes of the sub-regions, which would not have been achieved through the exclusive reliance on automatic calibration algorithms.
To estimate the quality of the parameter optimization, besides annual mean discharges, daily and monthly goodness of fit using the Nash–Sutcliffe efficiency (NSE) [57], the percent bias (PBIAS), and graphical analysis were applied.
Problems in the estimation of the parameters stem on the one hand from many gaps or low reliability of observed discharge time series (see examples in the Supplementary Material S.1). Also, giving the numbers (mean discharge, NSE, PBIAS) to estimate the quality of the parameter optimization turned out to be somewhat challenging, because as shown in the Supplementary Material S.1, obvious errors in the climate input reduce the quality of the hydrological simulations. For instance, taking the years 1957–1961 as calibration and 1962–1967 as validation period at gauge Bamboi (No. 15 in Figure 1), the NSE for the calibration period is 0.52 and for the validation it is 0.82. As two years (1958 and 1960) contain obvious errors in the climate input (see Supplementary Material S.1), calculating the NSE for the years 1957, 1959, and 1961 gives an NSE for the calibration period of 0.81. However, by starting to exclude specific time periods due to errors in the climate input or observed discharges, one may exclude data until the model gives an almost perfect fit. It should be noted that no observations or simulation results have been excluded from the analysis. However, it is essential to conduct a comprehensive examination and evaluation of the climate and discharge data used to facilitate the selection of specific time periods or years for model parameterization, and to select time periods or years where the low performance of the simulations should not be overestimated.

2.8. Data Manipulation/Gap Filling

In some instances, it is useful to estimate discharge data from an upstream gauge. For gauge Sabari, for example, observed discharge was available only after July 1959. Therefore, for the time before then, observations from the upstream gauge Saboba (location see Figure 1) were used. Because the catchment area at Saboba is 53,000 km2 while it is 58,670 km2 at Sabari (11% larger), from time periods where observations for both gauges were available a factor of 1.2 was derived to scale the observations from Saboba to Sabari. The scaling factor used is higher than the increase in catchment area because Sabari is south of Saboba, i.e., the area between the two gauges generally receives higher precipitation volumes compared to the area upstream of Saboba.
After the parameter optimization of hydrological processes to each of the WFDE40 and the WFDE5 data sets, water management and reservoir operation were included in the simulations.

3. Results

3.1. Evaluation of Meteorological Data Sets

The observed annual precipitation sums from [44] and WFDE40 data were interpolated applying Inverse Distance Weighting (IDW) and compared initially. The observed data were derived from meteorological stations, whereas the WFDE40 data are gridded data at a 0.5° × 0.5° horizontal resolution. For the period 1957–1973, during which there is an overlap in the data sets, there is a good fit between the annual precipitation sums and their spatial distribution (Figure 2). However, in certain years, the WFDE40 data show significant deviations from the observed data (see Supplementary Material S.1). Additionally, the absence of data for Mali and large areas in northern Ghana is evident (Figure 2a).

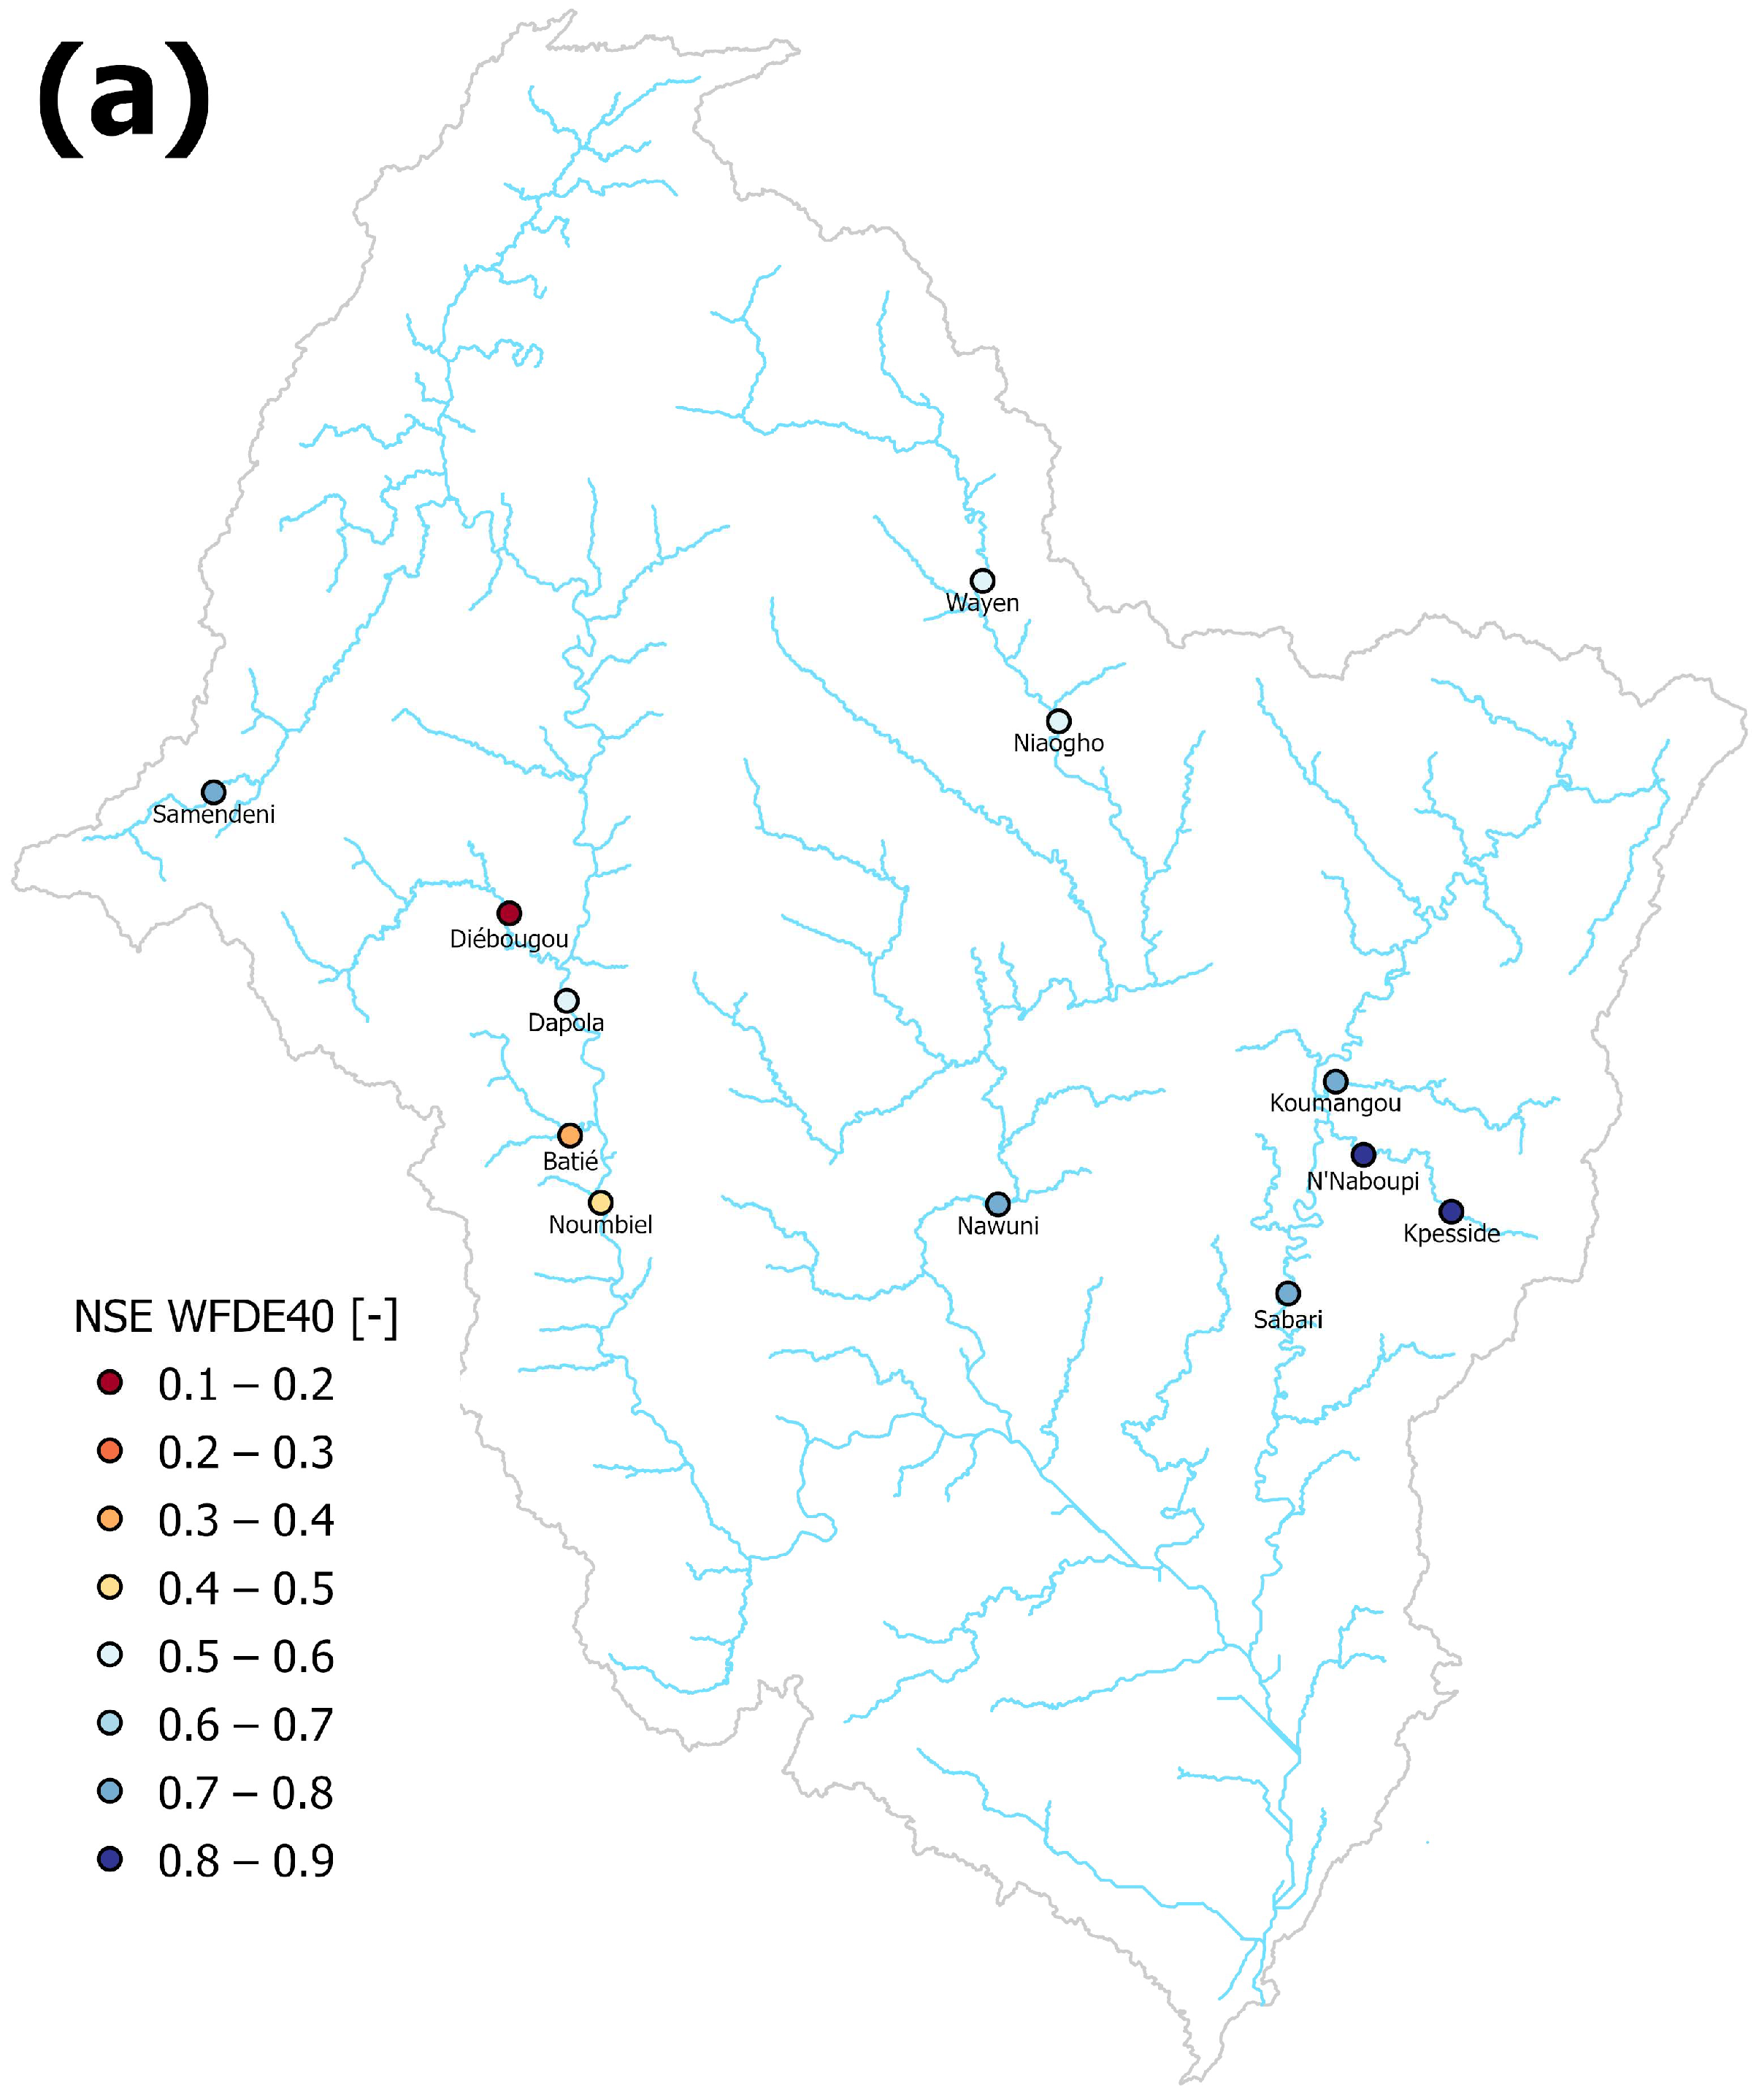
3.2. River Discharge
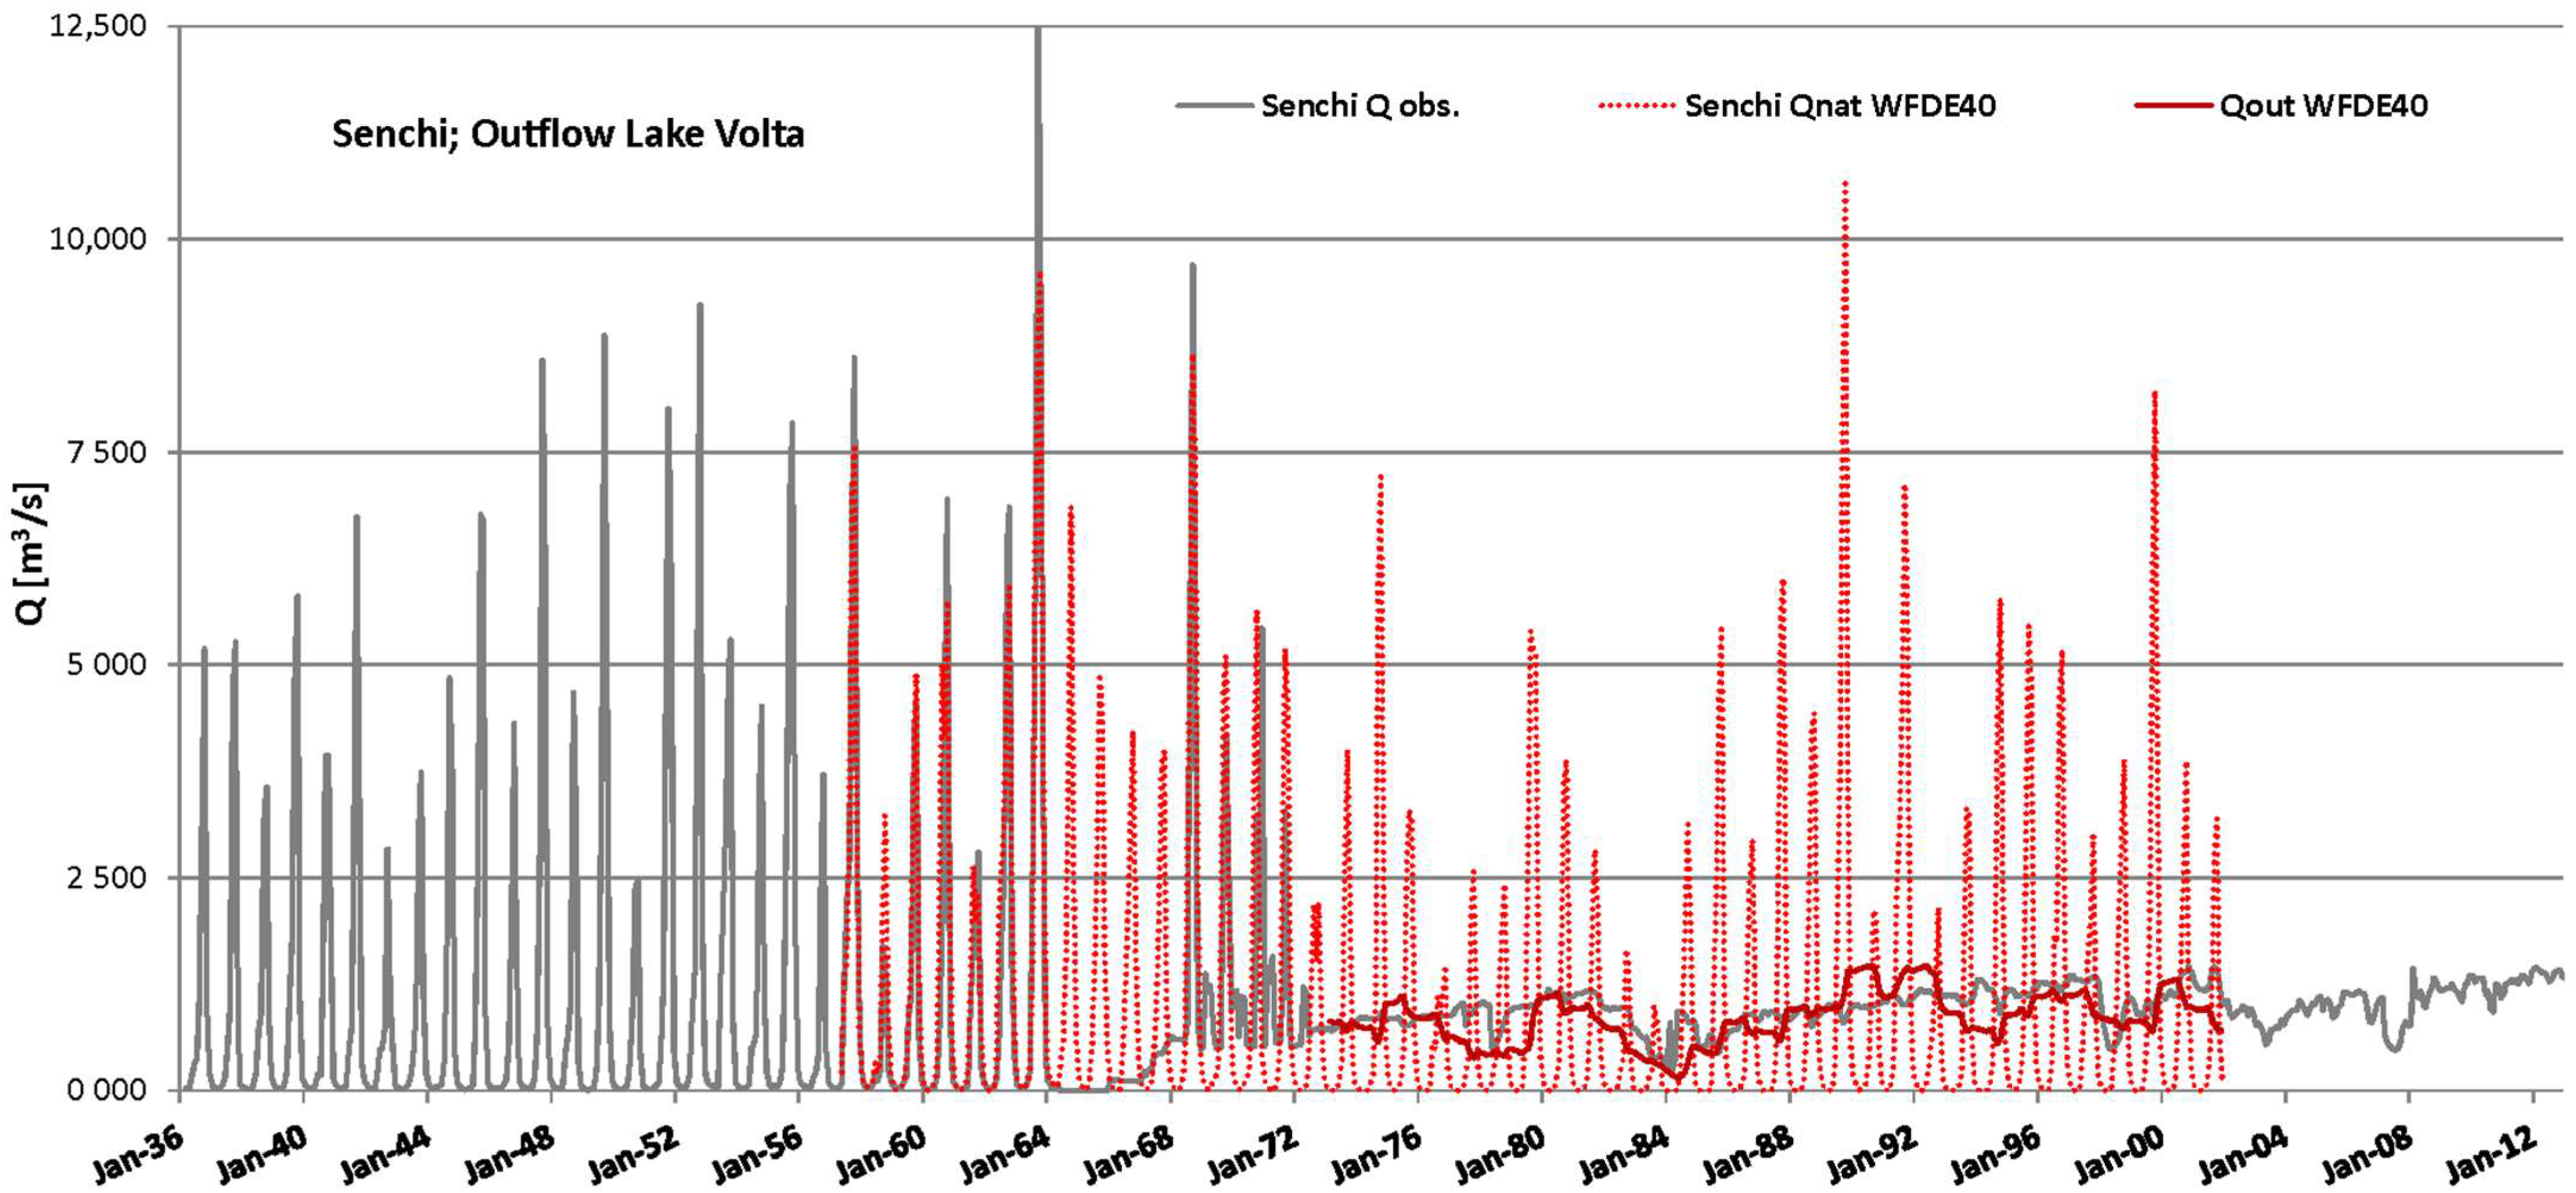
First, the simulated discharges using WFDE40 are discussed for the three main tributaries, represented by the gauges Bamboi (No. 15 in Figure 1, abbreviated as “Bam” in the figures), Nawuni (No. 37, ”Naw”), and Sabari (No. 51, ”Sab”). The summed discharge of the three gauges is presented in Figure 3. While peak flow in the simulations for 1957 is somewhat early and overestimated, the peak flow at Senchi (Figure 4) is almost at the correct time and magnitude. For 1958, discharges are clearly overestimated in the simulations (sum of the three gauges and Senchi), for 1959 there is a small overestimation in peak flow (sum of the three gauges), while at Senchi the discharge is slightly underestimated. For 1960, the peak flow is well simulated (sum of the three gauges), while at Senchi peak flow is clearly underestimated. In the early rainy season of 1960, a high peak flow almost not visible in the observations is simulated. This feature is described and discussed in depth in the Supplementary Material S.1. This peak flow, simulated for the Black Volta Basin, causes a very low NSE for gauge Bamboi, also affecting the performance of gauge Senchi in this year (Figure 5). For 1961, discharges are underestimated (sum of the three gauges and Senchi). For 1962, the peak flows are also underestimated (sum of the three gauges and Senchi), while again in the early rainy season a high peak flow is simulated. This overestimated peak flow is simulated for the Black Volta Basin and the Oti Basin. There is also a clear overestimation in simulated discharge downstream of the three gauges and other tributaries entering the main Volta river. For 1963, peak flow (sum of the three gauges) is well simulated, while at Senchi it is clearly underestimated.
Overall, the annual cycles and peak flows are well simulated, also indicated by an NSE in most years equal or greater than 0.8 (Figure 5), with exceptions for some years with obvious overestimation of some heavy precipitation events, e.g., 1960. In Figure 3 and Figure 4, it also can be seen that discharge, especially peak flows, at Senchi are only correctly simulated when these are overestimated at the three upstream gauges (e.g., 1957 and 1959) and the contrary can be observed in the years 1960 and 1963.
The performance of simulations in terms of NSE using WFDE40 and WFDE5 forcing data for the overlapping time period (1979–2001) for gauges with observed time series with few gaps is shown in Figure 6, calculated for monthly mean discharges. These simulations are for the natural discharge, i.e., water management and reservoir operation are not included. The NSE values for these gauges for single years are presented in the Supplementary Material S.4. Overall, the simulations using WFDE5 show higher NSE values, especially for the Black Volta Basin, in contrast to the lower NSE values for Bamboi compared with the other gauges described above for 1957–1967 (Figure 5).
Results for the gauges Samendeni, Diébougou, and Batié in the Black Volta Basin are shown and discussed in more detail in the Supplementary Material S.1 and S.2, where also results for other gauges, either with longer gaps or other time periods, are presented.

3.3. Reservoirs

Results for the simulated of natural discharge (i.e., without the effects of reservoirs and water utilization), the observed and the simulated discharges from the Akosombo dam are presented in Figure 7 for WFDE40 and in Figure 8 for WFDE5. The two figures illustrate the complete time series of the observed discharge, thus facilitating an assessment of the fluctuations in discharge over time. Despite some discrepancies between the observed and simulated data, the substantial impact of the Akosombo hydropower dam on discharge is well captured.
Figure 9 shows observed and simulated volumes of reservoir Lake Volta. One characteristic of the operation of the Akosombo hydropower dam is its over-the-year storage function. That means even in wet years, compared to the inflow, discharge is low, to keep a high volume available for potential dry years. Therefore, any difference between actual and simulated inflow has a strong, long-term effect in simulated reservoir volumes. The same is true for differences in precipitation over the lake. Due to its lake area, an error in precipitation of 10 mm/d means a difference in input of approximately 1000 m3/s. As mentioned, the actual operation deviates often from the rule curve; therefore, the rule curve was adapted in the model to better fit the observed outflow and volume.
For some of the other reservoirs time series of observed volumes (see Figure 10 for reservoir Ziga) and hydropower generation (see Figure 11 for reservoir Bagré) were available. The results show that the operation of the reservoirs, i.e., the annual cycle with high and low volumes, is simulated well. Results for reservoir Kompienga are shown and discussed in the Supplementary Material S.6.

4. Discussion

This paper describes an approach for the parameter optimization for hydrological and water management processes within the Volta River Basin, a region characterized by extensive management activities and limited data availability. The work spanned a period exceeding two years, including intensive data collection and checking. The acquisition of data to establish a model with minimal requirements does not pose a significant challenge, particularly in the context of freely available and accessible global data, including digital elevation models, land use/land cover, and soil data. However, the procurement of meteorological and, more specifically, hydrological, water, and crop management data is usually a more cumbersome task. Despite the utilization of meteorological gridded products, such as WFDE5, a comparison with meteorological observation data is essential to ensure the integrity of the data.
In this connection, it was found that the WFDE5 data set is well suited to describe the climate of the Volta basin, while the WFDE40 data set, at least in some regions, tends to overestimate heavy rainfall events. The ability of WFDE5 to supply missing observed data in the region was also demonstrated by [58,59]. Even though the WFDE40 data set showed stronger deviations from the observed climate, the data set yielded significant insights concerning the period preceding 1979. This was due to the fact that, during that time, observed discharges for gauges were available that later on were either unavailable or strongly influenced by water management practices.
Following the completion of data collection and preparation, the parameter optimization of the SWIM model was meticulously performed in a step-by-step manner. The model simulates discharge at the gauges Sabari, Bamboi, Nawuni, and Senchi with satisfactory results. However, the underestimation of peak flows at Senchi, despite accurate simulations at the three upstream gauges, can be attributed to uncertainties in land use data. The conversion of savannah to agricultural land has changed the runoff generation. Although many farms did not exist during the 1960s, areas surrounding water bodies such as Lake Volta have historically attracted farming activities. These agricultural lands, though small in size, can significantly impact runoff generation. For example, the presence of agricultural lands around the lake could result in increased peak flows, as a transition from natural vegetation to pasture, and vice versa, in a simple artificial catchment leads to a 25% change in discharge [60].
The impact of dam construction is clearly visible in the observed and simulated discharges (Figure 7 and Figure 8). The WFDE5 data set outperforms the WFDE40 data set in simulating reservoir processes. Nevertheless, there are discrepancies in the daily volume simulations for Lake Volta between 1970–1978 and 1994–2012. These deviations can be attributed to the significant influence of precipitation volumes over the lake. Furthermore, deviations in the actual daily reservoir operation from the general rule curve as applied in the model lead to differences between observed and simulated volumes and discharges.

5. Conclusions

This study focused on the parameter optimization process for a highly managed river basin with low data availability. Reanalysis climate data, land use and soil maps at regional scale, and water management data were collected and used to reproduce the hydrological and water management processes in the Volta River Basin.
At each stage of the parameter optimization, an in-depth checking and assessment of the used climate and discharge data was conducted and is extremely important to gain confidence in the model quality. The in-depth checking of data enables the selection of periods or years to focus on during the model parameter optimization and to select periods or years where a low quality of simulations, due to low quality of climate input or obvious errors in discharge observations, should not be overrated.
In contexts characterized by a data scarcity, it is not uncommon for the modeler to reach the conclusion that the available data are insufficient, even after conducting preliminary research. In these circumstances, more innovative approaches to data acquisition or generation need to be applied. Some of these approaches (digitizing hydrological yearbooks, digitizing time series data from published figures, applying regression functions for data filling, cross-correlation for data checking, searching for information in different languages) were described in this manuscript. Nevertheless, the establishment of contacts with decision-makers and stakeholders appears to be of utmost importance. Attracting their interest has been shown to increase the likelihood of obtaining the requested data in a timely manner. In our case, it was the West African Science Service Centre on Climate Change and Adapted Land Use (WASCAL) with their vast stakeholder network who established the required local contexts.

Supplementary Materials

The following supporting information can be downloaded at: https://www.mdpi.com/article/10.3390/w17060823/s1, Supplementary materials containing Figures S1–S29.

Author Contributions

Conceptualization, H.K. and S.L.; data collecting and checking, H.K. and G.I.Y. (hydrology, water management), S.L. (soil and land use data), S.L., H.K. and G.I.Y. (climate data); set-up of SWIM, S.L.; parameterization of SWIM, H.K.; writing—original draft preparation, H.K.; writing—review and editing, S.L. and G.I.Y.; project administration, S.L.; funding acquisition, S.L. and H.K. All authors have read and agreed to the published version of the manuscript.

Funding

This research was funded in the frame of the CIREG project (https://cireg.pik-potsdam.de/homepage-en/ (accessed on 19 December 2024)) by ERA-NET Co-fund action initiated by JPI Climate, funded by BMBF (DE), FORMAS (SE), BELSPO (BE), and IFD (DK) with co-funding by the European Union’s Horizon 2020 Framework Program (Grant 690462).

Data Availability Statement

The data presented in this study are available on request from the corresponding author due to restrictions in making third party data available.

Acknowledgments

We thank the Water Resources Commission Ghana, Direction Générale des Ressources en Eaux of Burkina Faso, Agence Nationale de la Météorologie du Burkina Faso, Société nationale d’électricité du Burkina, and the Bui Power Authority for supplying data and information.

Conflicts of Interest

The authors declare no conflicts of interest.

References

  1. Hattermann, F.F.; Huang, S.; Koch, H. Climate change impacts on hydrology and water resources. Met. Z. 2015, 24, 201–211. [Google Scholar] [CrossRef]
  2. Lobanova, A.; Liersch, S.; Nunes, J.P.; Didovets, I.; Stagl, J.; Huang, S.; Koch, H.; López, M.R.R.; Maule, C.F.; Hattermann, F.F.; et al. Hydrological impacts of moderate and high-end climate change scenarios across European River basins. J. Hydrol. Reg. Stud. 2018, 18, 15–30. [Google Scholar] [CrossRef]
  3. Qin, W.; Xu, H.; Liu, M.; Liu, L.; Xiao, C.; Mallakpour, I.; Rahnamay Naeini, M.; Hsu, K.; Sorooshian, S. Projected impacts of climate change on major dams in the Upper Yangtze River Basin. Clim. Change 2022, 170, 8. [Google Scholar] [CrossRef]
  4. Nijssen, B.; Lettenmaier, D.P. Effect of precipitation sampling error on simulated hydrological fluxes and states: Anticipating the Global Precipitation Measurement satellites. J. Geophys. Res. 2004, 109, 1–15. [Google Scholar] [CrossRef]
  5. Blöschl, G.; Zehe, E. On hydrological predictability. Hydrol. Process. 2005, 19, 3923–3929. [Google Scholar] [CrossRef]
  6. Strauch, M.; Bernhofer, C.; Koide, S.; Volk, M.; Lorz, C.; Makeschin, F. Using Precipitation Data Ensemble for Uncertainty Analysis in SWAT Streamflow Simulation. J. Hydrol. 2012, 414–415, 413–424. [Google Scholar] [CrossRef]
  7. Thoms, M.C.; Sheldon, F. Water resource development and hydrological change in a large dryland river: The Barwon-Darling River, Australia. J. Hydrol. 2000, 228, 10–21. [Google Scholar] [CrossRef]
  8. De Wit, M.J.M.; van den Hurk, B.; Warmerdam, P.M.M.; Torfs, P.J.J.F.; Roulin, E.; van Deursen, W.P.A. Impact of climate change on low-flows in the river Meuse. Clim. Change 2007, 82, 351–372. [Google Scholar] [CrossRef]
  9. Lopez-Moreno, J.I.; Vicente-Serrano, S.M.; Begueria, S.; Garcia-Ruiz, J.M.; Portela, M.M.; Almeida, A.B. Dam effects on droughts magnitude and duration in a transboundary basin: The Lower River Tagus, Spain and Portugal. Water Resour. Res. 2009, 45, W02405. [Google Scholar] [CrossRef]
  10. Omer, A.; Wang, W.; Basheer, A.K.; Yong, B. Integrated assessment of the impacts of climate variability and anthropogenic activities on river runoff: A case study in the Hutuo River Basin, China. Hydrol. Res. 2017, 48, 416–430. [Google Scholar] [CrossRef]
  11. Xu, X.; Yang, H.; Yang, D.; Ma, H. Assessing the impacts of climate variability and human activities on annual runoff in the Luan River basin, China. Hydrol. Res. 2013, 44, 940–952. [Google Scholar] [CrossRef]
  12. Liersch, S.; Koch, H.; Abungba, J.A.; Salack, S.; Hattermann, F.F. Attributing synergies and trade-offs in water resources planning and management in the Volta River basin under climate change. Environ. Res. Lett. 2023, 18, 014032. [Google Scholar] [CrossRef]
  13. Koch, H.; Liersch, S.; de Azevedo, J.R.G.; Silva, A.L.C.; Hattermann, F.F. Assessment of observed and simulated low flow indices for a highly managed River basin. Hydrol. Res. 2018, 49, 1831–1846. [Google Scholar] [CrossRef]
  14. Oguntunde, P.G.; Friesen, J.; van de Giesen, N.; Savenije, H.H. Hydroclimatology of the Volta River Basin in West Africa: Trends and variability from 1901 to 2002. Phys. Chem. Earth Parts A/B/C 2006, 31, 1180–1188. [Google Scholar] [CrossRef]
  15. Neumann, R.; Jung, G.; Laux, P.; Kunstmann, H. Climate trends of temperature, precipitation and river discharge in the Volta Basin of West Africa. Int. J. River Basin Manag. 2007, 5, 17–30. [Google Scholar] [CrossRef]
  16. Conway, D.; Persechino, A.; Ardoin-Bardin, S.; Hamandawana, H.; Dieulin, C.; Mahe, G. Rainfall and Water Resources Variability in Sub-Saharan Africa during the Twentieth Century. J. Hydrometeorol. 2009, 10, 41–59. [Google Scholar] [CrossRef]
  17. Liersch, S.; Fournet, S.; Koch, H.; Djibo, A.G.; Reinhardt, J.; Kortlandt, J.; Weert, F.V.; Seidou, O.; Klop, E.; Baker, C.; et al. Water resources planning in the Upper Niger River basin: Are there gaps between water demand and supply? J. Hydrol. Reg. Stud. 2019, 21, 176–194. [Google Scholar] [CrossRef]
  18. Hulme, M. Climatic perspectives on Sahelian desiccation: 1973–1998. Glob. Environ. Change 2001, 11, 19–29. [Google Scholar] [CrossRef]
  19. Mahé, G.; Paturel, J.E. 1896–2006 Sahelian annual rainfall variability and runoff increase of Sahelian Rivers. Comptes Rendus Geosci. 2009, 341, 538–546. [Google Scholar] [CrossRef]
  20. Mahé, G.; Lienou, G.; Descroix, L.; Bamba, F.; Paturel, J.E.; Laraque, A.; Meddi, M.; Habaieb, H.; Adeaga, O.; Dieulin, C.; et al. The rivers of Africa: Witness of climate change and human impact on the environment. Hydrol. Process. 2013, 27, 2105–2114. [Google Scholar] [CrossRef]
  21. Nka, B.N.; Oudin, L.; Karambiri, H.; Paturel, J.E.; Ribstein, P. Trends in floods in West Africa: Analysis based on 11 catchments in the region. Hydrol. Earth Syst. Sci. 2015, 19, 4707–4719. [Google Scholar] [CrossRef]
  22. Descroix, L.; Guichard, F.; Grippa, M.; Lambert, L.A.; Panthou, G.; Mahé, G.; Gal, L.; Dardel, C.; Quantin, G.; Kergoat, L.; et al. Evolution of Surface Hydrology in the Sahelo-Sudanian Strip: An Updated Review. Water 2018, 10, 748. [Google Scholar] [CrossRef]
  23. Panthou, G.; Vischel, T.; Lebel, T. Recent trends in the regime of extreme rainfall in the Central Sahel. Int. J. Climatol. 2014, 34, 3998–4006. [Google Scholar] [CrossRef]
  24. Salack, S.; Saley, I.A.; Lawson, N.Z.; Zabré, I.; Daku, E.K. Scales for rating heavy rainfall events in the West African Sahel. Weather Clim. Extrem. 2018, 21, 36–42. [Google Scholar] [CrossRef]
  25. Schuol, J.; Abbaspour, K. Calibration and uncertainty issues of a hydrological model swat, applied to west africa. Adv. Geosci. 2006, 9, 137–143. [Google Scholar] [CrossRef]
  26. Obuobie, E. Estimation of Groundwater Recharge in the Context of Future Climate Change in the White Volta River Basin, West Africa. Ph.D. Thesis, Rheinische Friedrich-Wilhelms-Universität Bonn. Ecology and Development Series, Bonn, Germany, 2008. [Google Scholar]
  27. Awotwi, A.; Kumi, M.; Jansson, P.; Yeboah, F.; Nti, I. Predicting hydrological response to climate change in the white volta catchment, west Africa. J. Earth Sci. Clim. Change 2015, 6, 1–7. [Google Scholar] [CrossRef]
  28. Awotwi, A.; Yeboah, F.; Kumi, M. Assessing the impact of land cover changes on water balance components of white volta basin in west Africa. Water Environ. J. 2015, 29, 259–267. [Google Scholar] [CrossRef]
  29. Abubakari, S.; Dong, X.; Su, B.; Liu, J.; Li, Y.; Peng, T.; Ma, H.; Wang, K.; Xu, S. Modelling the spatial variation of hydrology in volta river basin of west Africa under climate change. Nat. Environ. Pollut. Technol. 2017, 16, 1095–1105. [Google Scholar]
  30. Sawai, N.; Kobayashi, K.; Takara, K.; Ishikawa, H.; Yokomatsu, M.; Samaddar, S.; Kranjac-Berisavljevic, G. Impact of Climate Change on River Flows in the Black Volta River. J. Disaster Res. 2014, 9, 432–442. [Google Scholar] [CrossRef]
  31. Mutsindikwa, T.C.; Yira, Y.; Bossa, A.Y.; Hounkpè, J.; Salack, S.; Saley, I.A.; Rabani, A. Modeling climate change impact on!the!hydropower potential of the Bamboi catchment. Model. Earth Syst. Environ. 2021, 7, 2709–2717. [Google Scholar] [CrossRef]
  32. Ouedraogo, Y.; Yamegueu, D.; Tazen, F.; Leye, B.; Bologo-Traore, M.; Konda, M. Addressing the Water-Energy-Food Nexus in the context of climate change: The case of Bagré dam in Burkina Faso. Sci. Afr. 2024, 24, e02251. [Google Scholar] [CrossRef]
  33. Kwawuvi, D.; Mama, D.; Agodzo, S.K.; Hartmann, A.; Larbi, I.; Bessah, E.; Limantol, A.M.; Dotse, S.Q.; Yangouliba, G.I. Spatiotemporal variability and change in rainfall in the Oti River Basin, West Africa. J. Water Clim. Change 2022, 13, 1151–1169. [Google Scholar] [CrossRef]
  34. Karambiri, H.; García Galiano, S.G.; Giraldo, J.D.; Yacouba, H.; Ibrahim, B.; Barbier, B.; Polcher, J. Assessing the impact of climate variability and climate change on runoff in West Africa: The case of Senegal and Nakambe River basins. Atmos. Sci. Lett. 2011, 12, 109–115. [Google Scholar] [CrossRef]
  35. Bracken, L.J.; Cox, N.J.; Shannon, J. The relationship between rainfall inputs and flood generation in south-east Spain. Hydrol. Process. 2008, 22, 683–696. [Google Scholar] [CrossRef]
  36. Camarasa, A.M.; Tilford, K.A. Rainfall-runoff modelling of ephemeral streams in the Valencia region eastern Spain. Hydrol. Process 2002, 16, 3329–3344. [Google Scholar] [CrossRef]
  37. Arnold, J.G.; Allen, P.M.; Bernhardt, G. A comprehensive surface groundwater flow model. J. Hydrol. 1993, 142, 47–69. [Google Scholar] [CrossRef]
  38. Krysanova, V.; Meiner, A.; Roosaare, J.; Vasilyev, A. Simulation modelling of the coastal waters pollution from agricultural watershed. Ecol. Model. 1989, 49, 7–29. [Google Scholar] [CrossRef]
  39. NASA. SRTM 90m Digital Elevation Data. National Aeronautics and Space Administration 2011. Available online: https://srtm.csi.cgiar.org/ (accessed on 11 December 2018).
  40. FAO. Digital Soil Map of the World 2011. Available online: https://www.fao.org/soils-portal/data-hub/soil-maps-and-databases/faounesco-soil-map-of-the-world/en/ (accessed on 11 December 2018).
  41. Koch, H.; Liersch, S.; Hattermann, F.F. Integrating water resources management in eco-hydrological modelling. Water Sci. Technol. 2013, 67, 1525–1533. [Google Scholar] [CrossRef]
  42. Weedon, P.G.; Gomes, S.; Viterbo, P.; Shuttleworth, J.W.; Blyth, E.; Österle, H.; Adam, C.J.; Bellouin, N.; Boucher, O.; Best, M. Creation of the WATCH Forcing Data and its use to assess global and regional reference crop evaporation over land during the twentieth century. J. Hydrometeorol. 2011, 12, 823–848. [Google Scholar] [CrossRef]
  43. Cucchi, M.; Weedon, G.P.; Amici, A.; Bellouin, N.; Lange, S.; Schmied, H.M.; Hersbach, H.; Buontempo, C. WFDE5: Bias adjusted ERA5 reanalysis data for impact studies. Earth Syst. Sci. Data. 2020, 12, 2097–2120. [Google Scholar] [CrossRef]
  44. Moniod, F.; Pouyaud, B.; Sechet, P. Le Bassin du Fleuve Volta; Monographies Hydrologiques ORSTOM No5 1977; Office de la recherche scientifique Outre-Mer: Paris, France, 1977; 1714p. [Google Scholar]
  45. Huber, V.; Schellnhuber, H.J.; Arnell, N.W.; Frieler, K.; Friend, A.D.; Gerten, D.; Haddeland, I.; Kabat, P.; Lotze-Campen, H.; Lucht, W.; et al. Climate impact research: Beyond patchwork. Earth Syst. Dyn. 2014, 5, 399–408. [Google Scholar] [CrossRef]
  46. Warszawski, L.; Frieler, K.; Huber, V.; Piontek, F.; Serdeczny, O.; Schewe, J. The inter-sectoral impact model intercomparison project ISI-MIP): Project framework. Proc. Natl. Acad. Sci. USA 2014, 111, 3228–3232. [Google Scholar] [CrossRef]
  47. Lange, S. Trend-preserving bias adjustment and statistical downscaling with ISIMIP3BASD v1.0). Geosci. Model. Dev. 2019, 12, 3055–3070. [Google Scholar] [CrossRef]
  48. Krysanova, V.; Donnelly, C.; Gelfan, A.; Gerten, D.; Arheimer, B.; Hattermann, F.; Kundzewicz, Z.W. How the performance of hydrological models relates to credibility of projections under climate change. Hydrol. Sci. J. 2018, 63, 696–720. [Google Scholar] [CrossRef]
  49. République de Haute-Volta—Annuaire Hydrologique de Haute-Volta: Année 1967; Direction de L’hydraulique et de L’équipement Rural: Ouagadougou, Burkina Faso, 1968.
  50. République de Haute-Volta—Annuaire Hydrologique de Haute-Volta: Année 1970; Direction de L’hydraulique et de L’équipement Rural: Ouagadougou, Burkina Faso, 1971.
  51. République de Haute-Volta—Annuaire Hydrologique de Haute-Volta: Année 1973; Direction de L’hydraulique et de L’équipement Rural: Ouagadougou, Burkina Faso, 1974.
  52. République de Haute-Volta—Annuaire Hydrologique de Haute-Volta: Année 1974–Année 1975; Direction de L’hydraulique et de L’équipement Rural: Ouagadougou, Burkina Faso, 1976.
  53. République de Haute-Volta—Annuaire Hydrologique de Haute-Volta: Année 1976; Direction de L’hydraulique et de L’équipement Rural: Ouagadougou, Burkina Faso, 1977.
  54. Bartholomé, E.; Belward, A.S. GLC2000: A new approach to global land cover mapping from Earth observation data. Int. J. Remote Sens. 2005, 26, 1959–1977. [Google Scholar] [CrossRef]
  55. Obahoundje, S.; Diedhiou, A.; Ofosu, E.A.; Anquetin, S.; François, B.; Adounkpe, J.; Amoussou, E.; Kouame, Y.M.; Kouassi, K.L.; Nguessan Bi, V.H.; et al. Assessment of Spatio-Temporal Changes of Land Use and Land Cover over South-Western African Basins and Their Relations with Variations of Discharges. Hydrology 2018, 5, 56. [Google Scholar] [CrossRef]
  56. Hattermann, F.; Krysanova, V.; Habeck, A.; Bronstert, A. Integrating wetlands and riparian zones in river basin modelling. Ecol. Model. 2006, 199, 379–392. [Google Scholar] [CrossRef]
  57. Nash, J.E.; Sutcliffe, J.V. River flow forecasting through conceptual models part I—A discussion of principles. J. Hydrol. 1970, 10, 282–290. [Google Scholar] [CrossRef]
  58. Yangouliba, G.I.; Koch, H.; Liersch, S.; Sintondji, L.O.; Sidibé, M.; Larbi, I.; Limantol, A.M.; Yira, Y.; Dipama, J.M.; Kwawuvi, D. Impacts of hydro-climatic trends and upstream water management on hydropower generation at the Bagré dam. J. Water Clim. Change 2022, 13, 2399–2413. [Google Scholar] [CrossRef]
  59. Adeyeri, O.E.; Zhou, W.; Wang, X.; Zhang, R.; Laux, P.; Ishola, K.A.; Usman, M. The trend and spatial spread of multisectoral climate extremes in CMIP6 models. Sci. Rep. 2023, 12, 21000. [Google Scholar] [CrossRef]
  60. Eckhardt, K.; Breuer, L.; Frede, H.G. Parameter uncertainty and the significance of simulated land use change effects. J. Hydrol. 2003, 273, 164–176. [Google Scholar] [CrossRef]
Figure 1. Volta River Basin with locations of gauges (numbers indicate gauges with daily data; locations of gauges Manimenso, Mango, and Saboba where monthly data were used) and reservoirs.
Water 17 00823 g001
Figure 2. Long-term (1957–1973) annual precipitation sums interpolated from (a) observed (climate stations) and (b) WFDE40 (0.5° × 0.5° grid).
Water 17 00823 g002
Figure 3. Daily observed and simulated (WFDE40) discharge at gauges Bamboi (No. 15), Nawuni (No. 37), and Sabari (No. 51).
Water 17 00823 g003
Figure 4. Daily observed and simulated (WFDE40) discharge at gauge Senchi (No. 52).
Water 17 00823 g004
Figure 5. Nash–Sutcliffe efficiency for simulated (WFDE40) mean monthly discharges for 1957–1967 (Senchi for 1957–1964).
Water 17 00823 g005
Figure 6. Mean Nash–Sutcliffe efficiency for simulated mean monthly discharges for 1979–2001 for selected gauges, (a) input WFDE40 and (b) input WFDE5.
Water 17 00823 g006aWater 17 00823 g006b
Figure 7. Mean monthly observed discharge (Q obs) at gauge Senchi (No. 52) for 1936–2012 (from 1964 onward affected by Akosombo hydropower dam), simulated natural discharge (Qnat) at gauge Senchi for 1957–2001, and simulated outflow (Qout) for 1973–2001, input WFDE40.
Water 17 00823 g007
Figure 8. Mean monthly observed discharge (Q obs) at gauge Senchi (No. 52) for 1936–2012 (from 1964 onward affected by Akosombo hydropower dam), simulated natural discharge (Qnat) at gauge Senchi for 1980–2012, and simulated outflow (Qout) for 1980–2012, input WFDE5.
Water 17 00823 g008
Figure 9. Observed and simulated volumes of reservoir Lake Volta.
Water 17 00823 g009
Figure 10. Observed and simulated volumes for reservoir Ziga (WFDE5).
Water 17 00823 g010
Figure 11. Observed and simulated volumes and hydropower production (HPP) for reservoir Bagré (WFDE5).
Water 17 00823 g011
Disclaimer/Publisher’s Note: The statements, opinions and data contained in all publications are solely those of the individual author(s) and contributor(s) and not of MDPI and/or the editor(s). MDPI and/or the editor(s) disclaim responsibility for any injury to people or property resulting from any ideas, methods, instructions or products referred to in the content.

