Abstract
A water quality index has not been developed for Amazonian blackwater rivers. In this paper, we used data collected in recent years to address this gap. An index was constructed using, in total, 342,930 analyses involving 161 water quality parameters. All analyses were part of ten large-scale campaigns, which took place between 2021 and 2023. The modifications proposed by the adoption of the new WQI enabled changes in the water quality results of the Amazon region, in comparison with an index used in other parts of Brazil. The proposal is a long-awaited tool that can significantly assist in the next stage in the preservation of this vast national wealth, which is the Amazon basin.
1. Introduction
Water quality is closely linked to various factors for our existence, such as human health, food production, economic development and the reduction of poverty, among others. Thus, the environmental monitoring of water resources is one of the main factors for the adequate management and planning of their use in a conscious way, since a number of human activities, such as agriculture, industry, urbanization and construction in general, have a direct impact on water quality [1,2,3,4].
One of the tools that can help managers and researchers in this area of knowledge is the water quality index (WQI). This index is a primary measure that evaluates the quality of water in water bodies such as rivers, lakes and streams and is used to provide a general assessment of the water condition based on various physical, chemical and biological parameters [5]. The WQI is important for monitoring the health of aquatic ecosystems and determining the suitability of water for diverse uses such as public supply, recreation and the preservation of aquatic life [6,7]. As such, the application of the WQI is fundamental for environmental monitoring, water resources management and the formulation of environmental protection policies. It helps identify areas that may need conservation and control pollution and/or environmental remediation measures [8,9].
Many WQIs have been developed in different countries and regions, and there are various formulas and methods for calculating the index, depending on local characteristics and monitoring goals. Different countries may have their own water quality assessment systems, and these systems can be adapted to the specific conditions of each region [10,11,12].
The WQI was developed with the aim of simplifying the interpretation of multiple water quality data into a single composite indicator. It varies on a numerical scale, whereby higher values indicate better water quality, while lower values may indicate environmental problems. A WQI can include a variety of parameters, such as 1. physical parameters, including water temperature, turbidity and electrical conductivity; 2. chemical parameters, including dissolved oxygen concentration, pH, nutrient levels (nitrogen and phosphorus), heavy metals and pesticides, among others; and 3. biological parameters, including the presence of organisms that indicate water quality [13,14,15].
The blackwater rivers in the Amazon basin are characterized by the dark color of their waters, which is attributed to the presence of decaying organic matter, especially humic and fulvic acids. This organic matter is released by the decomposition of plants and surrounding vegetation in tropical forests and dramatically modifies characteristics such as pH and dissolved oxygen, among others [16]. This dark water contrasts with clear- or whitewater rivers, which carry suspended mineral sediments.
The main blackwater river in the Amazon basin is the Negro River. It is one of the largest tributaries of the Amazon River and is known for its dark water that is rich in organic acids. The Negro River originates in Colombia, but the greater part of it is in Brazil, in the northwestern region of the state of Amazonas, and it runs through an extensive area before meeting the Solimões River to form the Amazon River [17].
The importance of the Negro River and other blackwater rivers in the Amazon basin lies in their contribution to the biological diversity of the region, as well as in the fundamental role they play in the hydrological cycle and the balance of Amazonian ecosystems [18]. In addition, the study of these environments helps to better understand the ecological processes associated with blackwater and its interaction with Amazonian biodiversity.
WQIs are based on a combination of physical, chemical and biological parameters, which are measured and analyzed to obtain a representative score of water quality in a given location [19]. WQIs are used in Brazil by federal environmental agencies such as the Brazilian Institute of the Environment and Renewable Natural Resources (IBAMA) and state environmental agencies such as the Environmental Company of the State of São Paulo (CETESB) [20]. The tool is used to compare the quality of water in different regions of Brazil and to identify the need for cleaning water in certain rivers or national basins.
With regard to the Amazon basin, considering the size and complexity of the region, there are specific initiatives and studies that seek to assess the quality of water in the Amazon [10,11,12]. However, as of January 2022, for the state of Amazonas, there is no single index of water quality that is standardized and referenced by the environmental control bodies of the state of Amazonas (the State Secretariat of the Environment, SEMA, and the Amazonas Environmental Protection Institute, IPAAM) that reflects the different types of waters found in the Amazon basin.
The complexity of the Amazon region, with its diversity of ecosystems and specific characteristics, requires approaches that are adapted to the different sub-basins and ecosystems present. Each state or region in the Amazon must adopt specific methods and indices that are aligned with local characteristics and monitoring objectives. Research and environmental monitoring in the Amazon are essential in order to understand the environmental dynamics of the region and support the conservation and sustainable management of natural resources. The proposal of this article is the presentation of a water quality index (WQI) that reflects the real characteristics of rivers with black waters, based on the regular monitoring of the Negro River basin.
2. Materials and Methods
Many water quality indices (WQIs) were created after Horton’s proposal [21]; however, as expected, no WQI has been adopted globally, since it depends greatly on the type of water one is monitoring. Nonetheless, there are four steps that are commonly used to create a water quality index. These are:
- 1.
- The selection of parameters:
The water quality index of a body of water must reflect the original characteristics of the chosen parameters, that is, the evaluations of the parameters must be carried out in a location in the basin where there is no evident human action. With this, the values of the parameters that will be chosen will serve as a reference for the construction of the WQI. This is often not possible; however, the focus of this work is the blackwater rivers of the Amazon region, with the Rio Negro basin being the largest example of this type of basin and one that has anthropogenically preserved regions.
In addition, the chosen parameters must be specific to the water body studied. For example, 7 is usually the ideal value for the hydrogen potential (pH) of water; however, rivers with black water have a naturally acidic pH, with an average pH of 5.4. With this, pH becomes an eligible parameter for the formation of the water quality index for black water rivers.
Regarding the choice of parameters that will make up the water quality index for black water rivers proposed in this work, data generated in 10 large campaigns, between 2021 and 2023, were used, through which 161 physical, chemical and microbiological parameters of water quality were evaluated, including the analysis of 70 metals in solution and suspension at 71 georeferenced sample collection points in the Rio Negro basin.
- 2.
- Obtaining quality values for the chosen parameters:
To obtain the quality values for the selected parameters, a total of 342,930 analyses related to parameters describing the quality of raw water in the Rio Negro basin were carried out. The construction of graphs that relate the values found in the analyses of each chosen parameter with a standardized quality scale (zero to one hundred), and which are part of the IQA for blackwater rivers, was carried out through the statistical evaluation of the data obtained for each parameter, with the average value, as well as its limits, that is, the lowest and highest values found, being the basis for the construction of these graphs.
- 3.
- Determining the weights of each parameter:
Determining the weights of each parameter in the construction of a water quality index is a critical step, as these weights reflect the relative importance of each parameter in the evaluation of water quality. Here are some common approaches used to determine these weights:
Expert-based: This method involves consulting experts in the field of water quality, such as environmental scientists, hydrological engineers and aquatic biologists, among others [22,23,24]. The experts assign weights to the parameters based on their experience and knowledge of the importance of each one in water quality. This approach is subjective, but can be valuable due to the experience of the experts.
Statistical methods: Some statistical methods, such as principal component analysis or regression analysis, can be used to determine parameter weights. These methods seek to identify patterns in water quality data and determine which parameters have the greatest influence on the observed variation [25]. Weights are then assigned based on the coefficients obtained from the statistical analysis.
Importance ranking methods: There are specific techniques, such as hierarchical process analysis (HPA) or relative value analysis (RVA), that can be applied to determine parameter weights [26]. These methods involve direct comparison between parameters against predefined importance criteria, thus allowing for a more systematic weight assignment.
Review of scientific literature: A review of scientific literature related to water quality can provide insights into the relative importance of different parameters. Previous studies can indicate which parameters have the greatest impact on human health, aquatic ecosystems and other relevant aspects [27].
Combination of approaches: In many cases, a combination of several approaches can be most effective in determining parameter weights. For example, weights can be initially determined by experts and then refined based on statistical analysis [28].
The methodology used in this study was a hybrid approach taking into account peer opinion regarding the importance of the nine chosen parameters, as well as information contained in several references related to specific studies of various water quality parameters existing for blackwater rivers, in addition, of course, to the vast amount of information generated by the environmental monitoring projects of the Chemistry Applied to Technology research group.
- 4.
- Determining how to aggregate the parameters to obtain the final IQA value:
The method of aggregating the chosen parameters with their respective weights concludes the work by obtaining a single value that should reflect the quality of the water at that specific moment in which the samples were collected for analysis. In this sense, the option used to gather all the quality values obtained was a weighted average of the values, since with this option we can have values equal to zero at the limits of each parameter. This indicates that the quality of the water for that particular parameter is very poor; on the other hand, for example, choosing a product to aggregate the parameters would require low values, but not zero, to obtain the IQA value.
3. Results and Discussion
The parameters were selected by taking into account their scientific relevance, as observed in other studies related to the development of the index in other regions of the world [22,23,24,25,26,27,28]. The indications made by researchers who indicated a sequence in order of relevance for each of the parameters evaluated were also considered. Finally, the choice of parameters sought to address the most striking characteristics of the Rio Negro, that is, parameters that are statistically significant in the monitoring analyses carried out in the region. In addition, they are parameters that unequivocally identify human actions when they occur. Thus, the parameters chosen to compose the IQA of blackwater rivers were the following:
pH: This is an extremely characteristic parameter in blackwater rivers because, in this type of river, the pH in regions without human action always presents values below what is expected, i.e., it has acidic characteristics due to organic acids (humic and fulvic) generated by the decomposition of vegetation.
Electrical conductivity: This is another characteristic parameter of blackwaters. These normally have very low electrical conductivity since they are rivers that are poor in dissolved ions.
Thermotolerant coliforms: This is an indispensable parameter for evaluating the human presence in a given region. This type of microorganism is found in the feces of warm-blooded animals, and these types of bacteria are able to use lactose as a nutrient, producing gas at a temperature of 44–45.5 °C, and Escherichia coli alone corresponds to 90% of this group.
Dissolved oxygen: This is a very important parameter for the maintenance of life in water bodies; however, in blackwater rivers, this parameter characteristically presents low values due to the decomposition of organic matter. In short, it is an indispensable parameter for evaluating blackwater rivers.
Ammoniacal nitrogen: This parameter is closely linked to human presence in a region. Ammonia nitrogen is a byproduct of the decomposition of organic matter and can be present in high concentrations in waters polluted by domestic sewage or industrial or agricultural effluents.
Total phosphorus: The presence of high levels of phosphorus in water bodies can indicate the degradation of water quality, and it leads to the eutrophication of the water body since it is one of the main nutrients responsible for the excessive growth of algae and aquatic plants, as well as nitrogen. Phosphorus can enter water bodies from a variety of sources, including agricultural runoff, domestic sewage and industrial effluents.
Biochemical oxygen demand (5 days): BOD is a measure of the amount of dissolved oxygen needed to break down organic matter present in water via microbial activity. Elevated BOD levels indicate an increased load of organic pollutants in water, which can negatively affect water quality. If the biochemical oxygen demand is high, reduced levels of available oxygen in the water can occur, which can lead to the asphyxiation of aquatic organisms and the subsequent death of aquatic life.
Turbidity: Turbidity is a measure of the amount of solid particles suspended in water. High levels of turbidity may indicate the presence of sediment, clay, organic matter, or other suspended materials in the water. Therefore, turbidity is an important indicator of overall water quality. The presence of high levels of turbidity in water can affect aquatic life in many ways. Reduced water transparency due to turbidity can decrease the ability of aquatic plants to perform photosynthesis, affecting oxygen production in water. The presence of suspended particles in water can increase the risk of microbiological contamination, as microorganisms can bind to the particles and resist disinfection treatment. Blackwater rivers are generally characterized as having high levels of dissolved organic material, such as tannins and humic acids, which give the water its dark color. In addition, these rivers often carry fine, suspended organic sediments, contributing to high turbidity values.
Dissolved solids: Dissolved solids represent the minerals and chemical compounds that are completely dissolved in water. The concentration of these solids can indicate the overall quality of the water and provide information on the chemical composition of the water body under study. The presence of dissolved solids in high concentrations can affect aquatic life. For example, high levels of dissolved salts can make brackish or salt water unsuitable for certain species of fish and other freshwater aquatic organisms. For each of these parameters, average, maximum and minimum values were obtained, as shown in Table 1 below.

Table 1.
Average, maximum and minimum values for all nine parameters chosen to be part of the WQI for blackwaters.
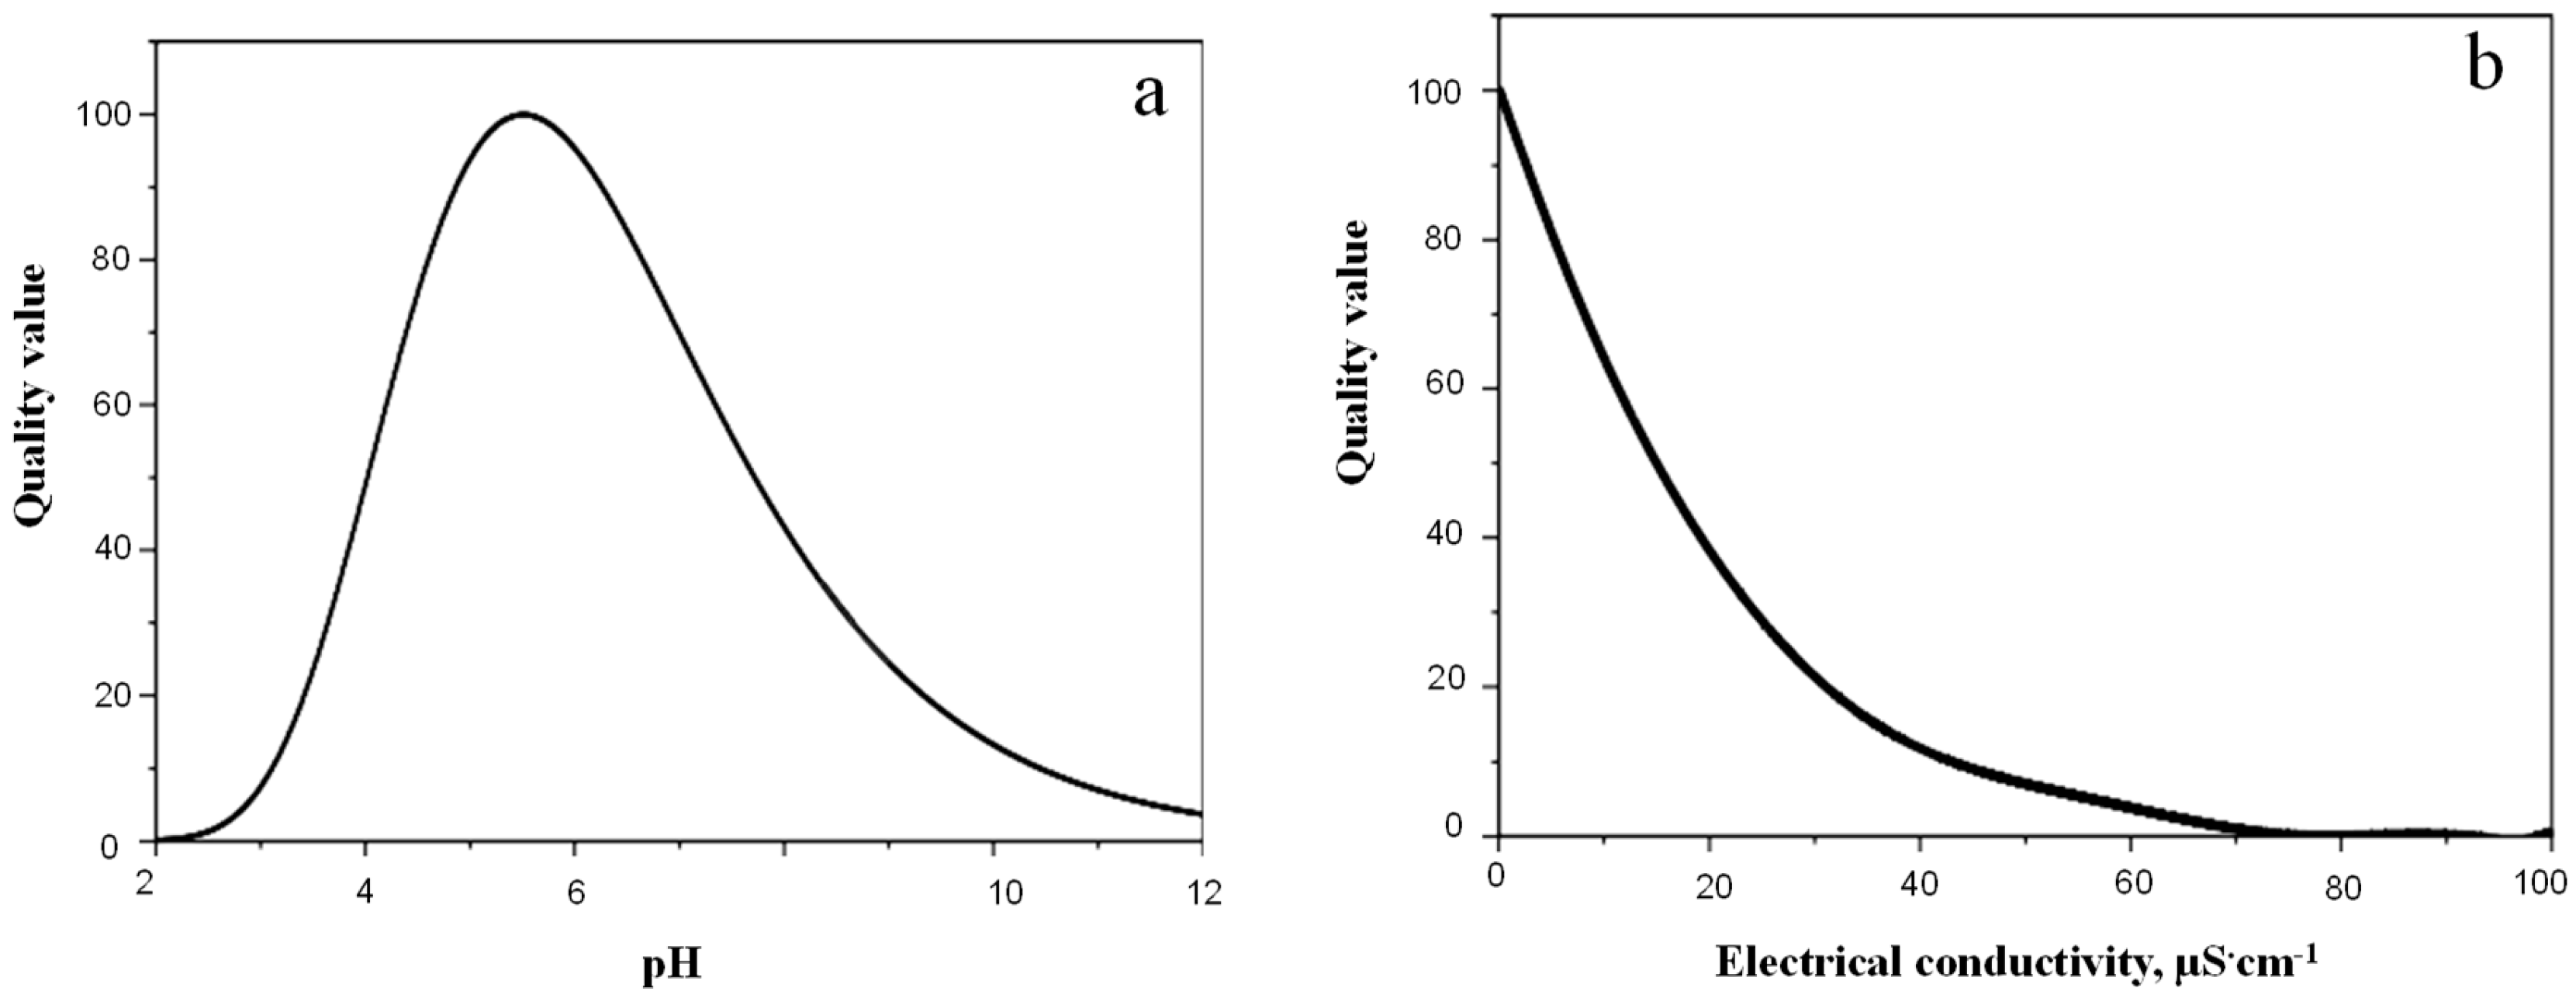
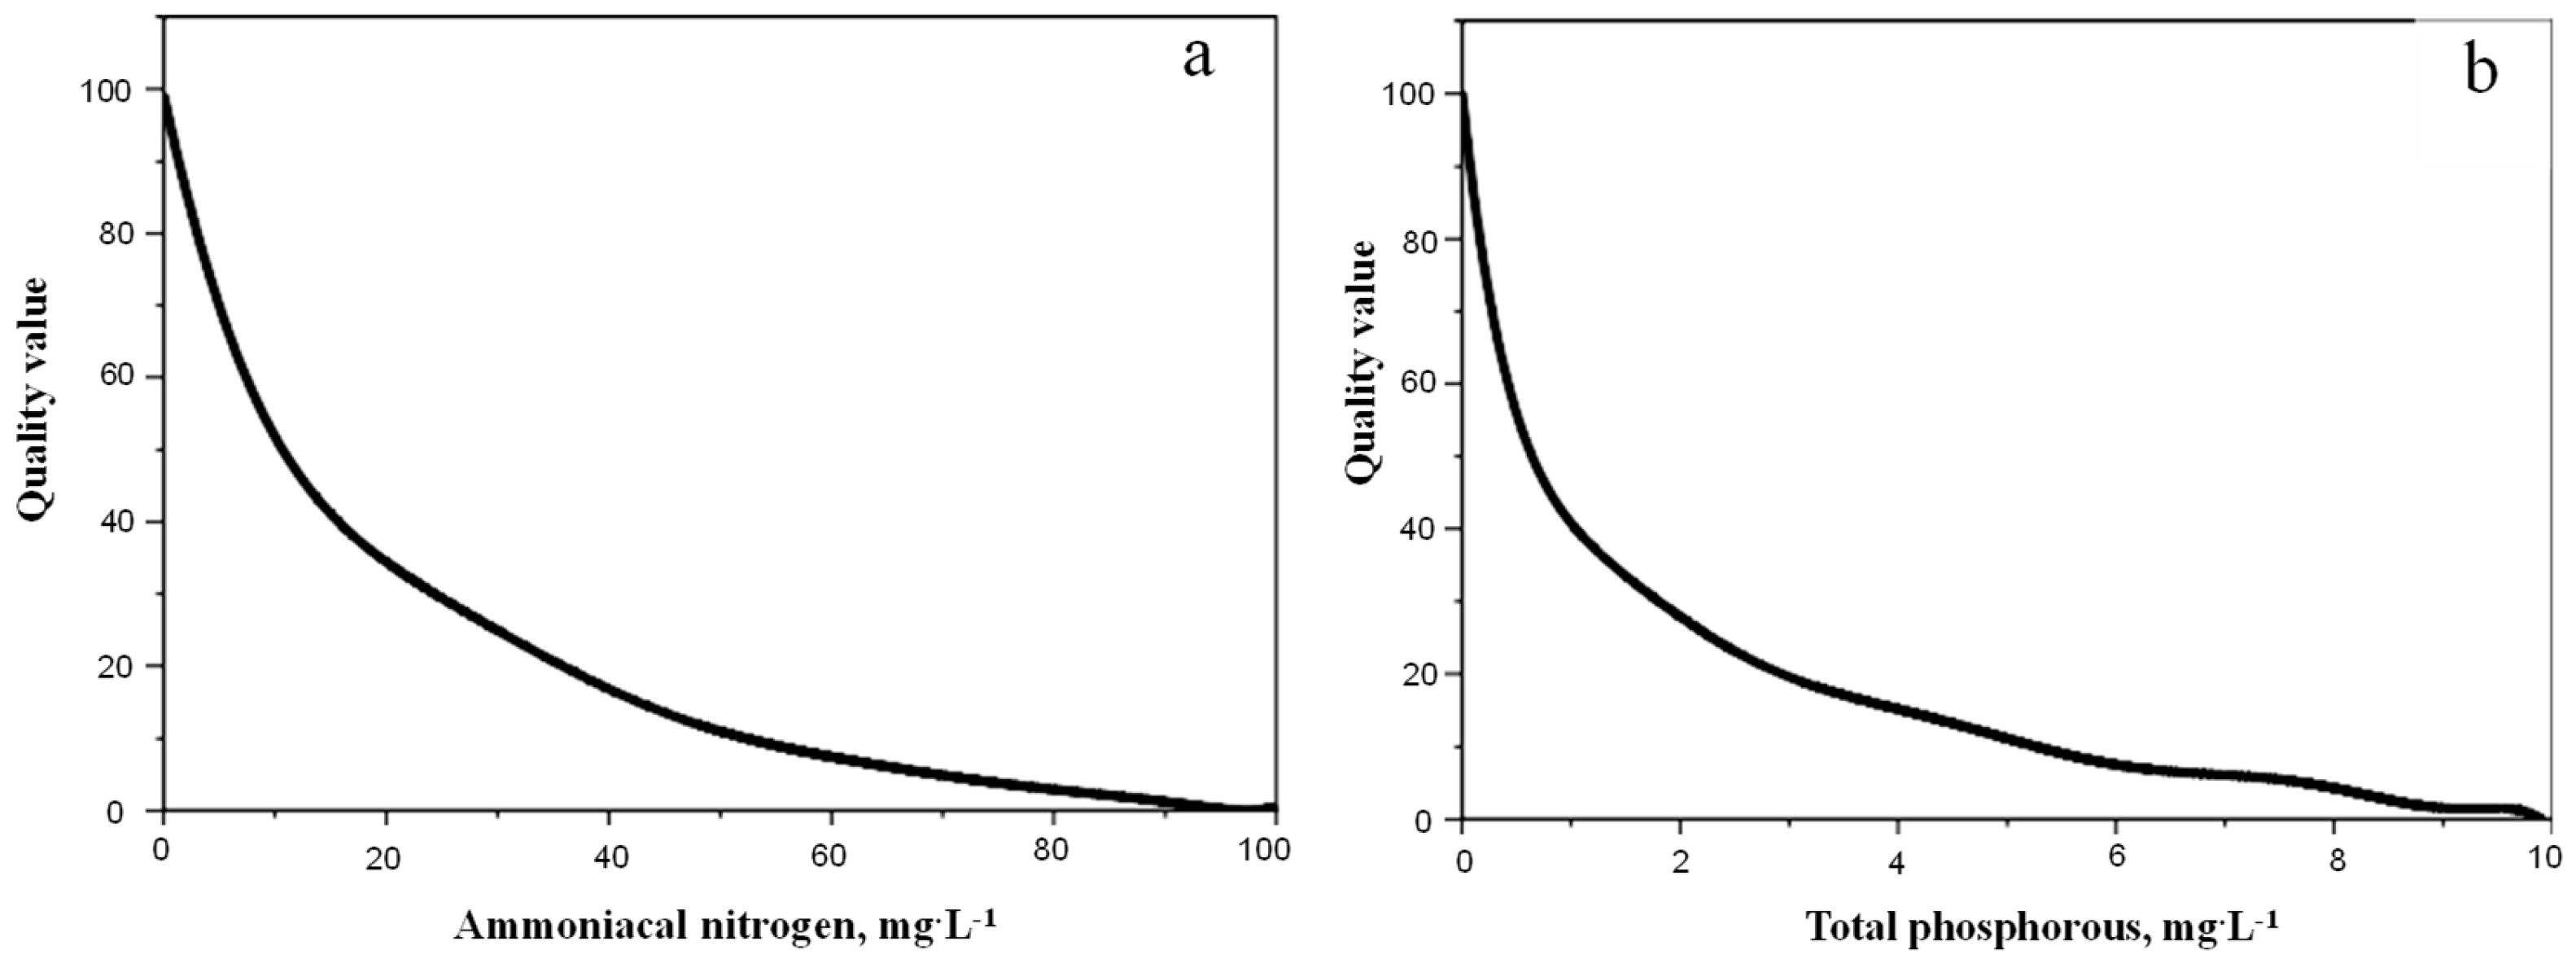
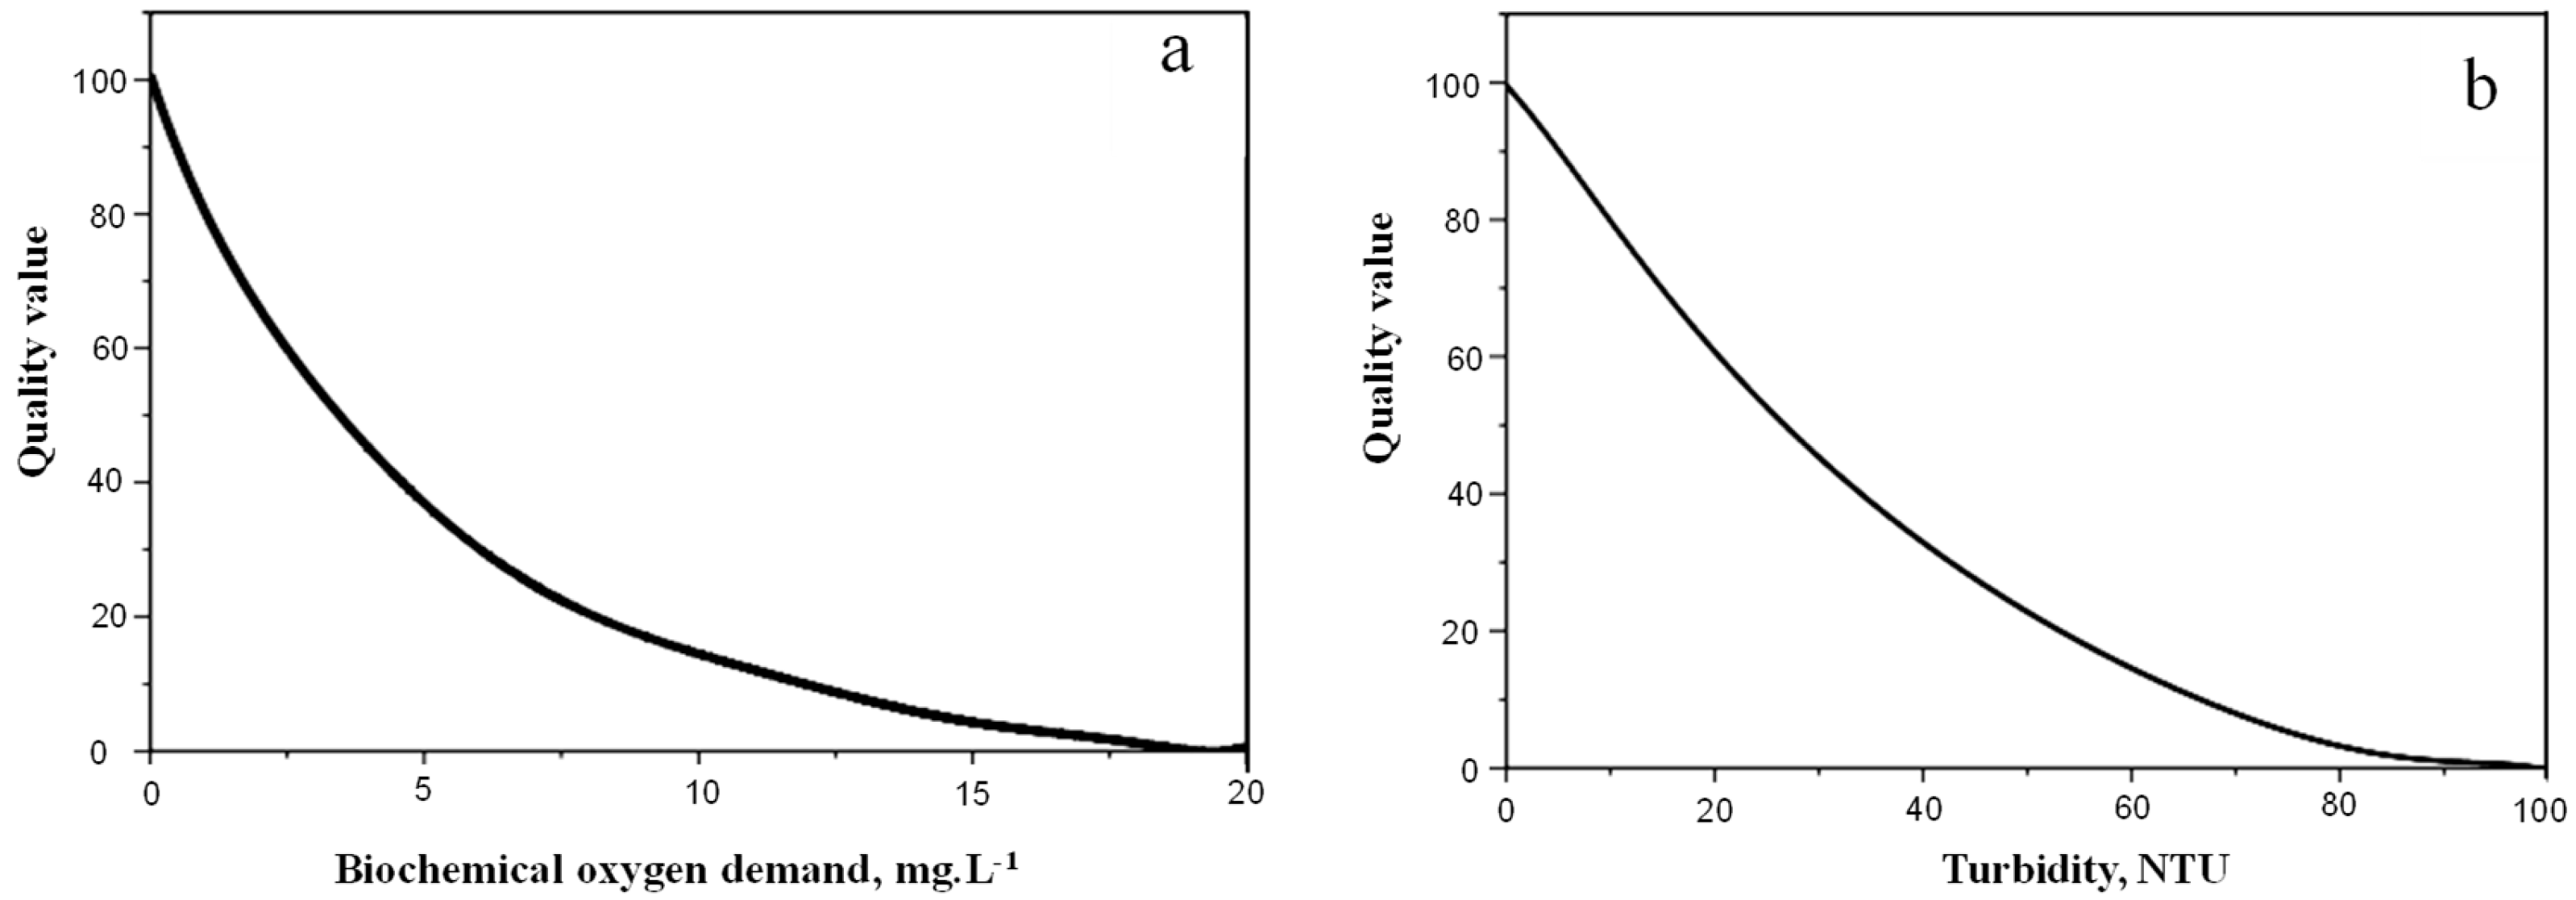
From the data obtained in the 10 water monitoring campaigns, for each parameter chosen, it was possible to create variation graphs for each parameter, correlating the values of the analyses with a quality value, which ranges from 0 to 100, as shown below.
For each of these graphs, we can express them from an appropriate mathematical function, which describes exactly each of the nine curves presented below, in Figure 1, Figure 2, Figure 3, Figure 4 and Figure 5. With this, from the mathematical modeling for each behavior of each water quality parameter chosen, the following functions were obtained, with “y” being the quality value and “x” being the value found in the analyses for each parameter analyzed.
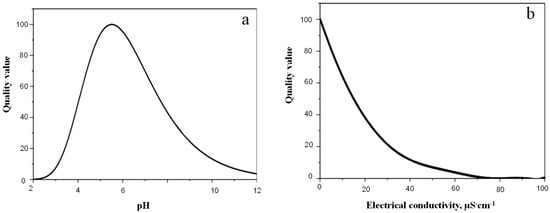
Figure 1.
(a) Variation in potential of hydrogen (pH) with respect to quality value. (b) Variation in electrical conductivity with respect to quality value.
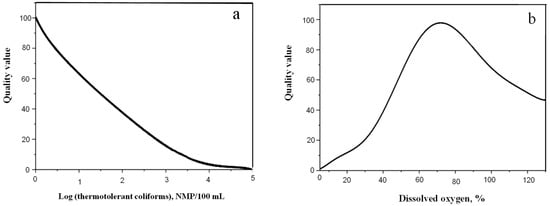
Figure 2.
(a) Variation in thermotolerant coliforms with respect to quality value. (b) Variation in dissolved oxygen with respect to quality value.

Figure 3.
(a) Variation in ammoniacal nitrogen with respect to quality value. (b) Variation in total phosphorus with respect to quality value.
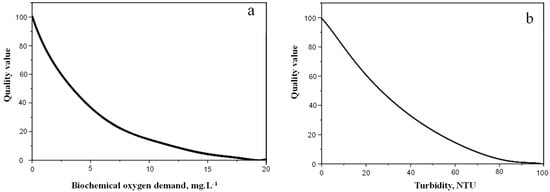
Figure 4.
(a) Variation in biochemical oxygen demand with respect to quality value. (b) Variation in turbidity with respect to quality value.
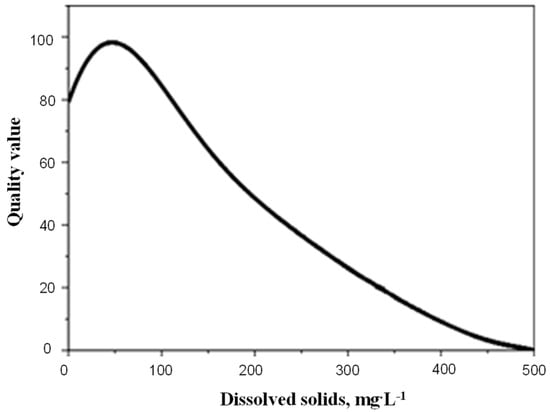
Figure 5.
Variation in dissolved solids with respect to quality value.
- 1.
- pH:
y = −2.35097 × 10⁻¹⁶ + 99.94591 × 10 (w)
where w = −10(−z)−z+1, z = (x − 5.51082)/1.51245
- 2.
- Electrical conductivity:
y = 100 − 3.98753x + 7.08 × 10−4x2 + 0.00619x3 − 3.62 × 10−4x4 + 1.16 × 10−5 x5 − 2.17 × 10−7x6 + 2.35 × 10−9x7 − 1.35 × 10−11x8 + 3.18 × 10−14x9
- 3.
- Thermotolerant coliforms:
y = 100 − 64.59328x + 68.07611x2 − 78.8927x3 +58.93817x4 − 27.7x5 + 8.12x6 − 1.43x7 + 1.39 × 10−1x8 − 5.71 × 10−3x9
- 4.
- Dissolved oxygen:
y = 3.01177 − 1.66751x + 0.36414x2 − 0.002553x3 + 9.09 × 10−4x4 − 1.72 × 10−5x5 + 1.83 × 10−7x6 − 1.09 × 10−9x7 + 3.37 × 10−12x8 − 4.19 × 10−15x9
- 5.
- Ammoniacal nitrogen:
y = 100 − 7.15074x + 0.2671x2 + 5.02 × 10−5x3 − 3.89 × 10−4x4 + 1.48 × 10− 5x5 − 2.70 × 10−7x6 + 2.70 × 10−9x7 − 1.42 × 10−11x8 + 3.11 × 10−14x9
- 6.
- Total phosphorus:
y = 100 − 145.6286x + 155.76905x2 − 101x3 + 39.2x4 − 9.46x5 + 1.42x6 − 1.28 × 10−1x7 + 6.38 × 10−3x8 − 1.35 × 10−4x9
- 7.
- Biochemical oxygen demand (5 days):
y = 100 − 24.8781x + 5.31814x2 − 1.02x3 + 1.12 × 10−1x4 − 3.72 × 10−3x5 − 4.16 × 10−4x6 + 4.77 × 10−5x7 − 1.84 × 10−6x8 + 2.56 × 10−8x9
- 8.
- Turbidity:
y = 100 − 1.64638x − 0.06945x2 + 4.90 × 10−3x3 − 1.56 × 10−4x4 + 2.93 × 10− 6x5 − 3.33 × 10−8x6 + 2.15 × 10−10x7 − 6.59 × 10−13x8 + 5.27 × 10−16x9
- 9.
- Dissolved solids:
y = 79.24707 + 0.83862x − 0.00848x2 − 5.53 × 10−5x3 + 1.12 × 10−6x4 − 6.88
× 10−9x5 + 2.23 × 10−11x6 − 4.12 × 10−14x7 + 4.08 × 10−17x8 − 1.69 × 10−20x9
All the equations described above have a correlation coefficient with the analyzed results and quality values equal to 1, indicating that the mathematical modeling used was ideal for describing the curves presented in the graphs.
With respect to the weights of each of the chosen quality parameters, simple questionnaires were sent to chemists, biologists and limnologists who study the region (or other regions) so that they could give an order of priority to the weights based on their own knowledge. The questionnaires had the following request: For a water quality index with characteristics of Amazonian blackwaters, number the following parameters in ascending order of importance: pH, electrical conductivity, thermotolerant coliforms, dissolved oxygen, ammonia nitrogen, total phosphorus, biochemical oxygen demand (BOD5), turbidity and total solids.
Based on the results of this survey, associated with the review of the available literature on works involving blackwater rivers in the Amazon region and the numerous results obtained by research projects in the area of the environmental monitoring of the research group Chemistry Applied to Technology, the following weights are suggested for each parameter chosen in this work:
- pH—15%
- Electrical conductivity—15%
- Thermotolerant coliforms—15%
- Dissolved oxygen—15%
- Ammoniacal nitrogen—10%
- Total phosphorus—10%
- Biochemical oxygen demand (BOD5)—10%
- Turbidity—5%
- Total solids—5%
With the equations that describe the relationships between the analyzed values and quality values, as well as the aforementioned weights for each parameter, we can assemble the general equation to obtain the water quality index for the blackwaters of the Amazon region, which is expressed below:
where
WQI (blackwaters) = ((−2.35097 × 10⁻¹⁶ + 99.94591 × 10(w)) × 0.15) + ((100 − 3.98753b + 7.08 × 10⁻⁴b2 + 0.00619b3 − 3.62 × 10⁻⁴b4 + 1.16 × 10⁻⁵b5 − 2.17 × 10⁻⁷b6 + 2.35 × 10⁻⁹b7 − 1.35 × 10⁻¹¹b8 + 3.18 × 10⁻¹⁴b9) × 0.15) + ((100 − 64.59328c + 68.07611c2 − 78.8927c3 +58.93817c4 − 27.7c5 + 8.12c6 − 1.43c7 + 1.39 × 10⁻¹c8 − 5.71 × 10⁻³c9) × 0.15) + ((3.01177 − 1.66751d + 0.36414d2 − 0.002553d3 + 9.09 × 10⁻⁴d4 − 1.72 × 10⁻⁵d5 + 1.83 × 10⁻⁷d6 − 1.09 × 10⁻⁹d7 + 3.37 × 10⁻¹²d8 − 4.19 × 10⁻¹⁵d9) × 0.15) + ((100 − 7.15074f + 0.2671f2 + 5.02 × 10⁻⁵f3 − 3.89 × 10⁻⁴f4 + 1.48 × 10⁻⁵f5 − 2.70 × 10⁻⁷f6 + 2.70 × 10⁻⁹f7 − 1.42 × 10⁻¹¹f8 + 3.11 × 10⁻¹⁴f9) × 0.10) + ((100 − 145.6286g + 155.76905g2 − 101g3 + 39.2g4 − 9.46g5 + 1.42g6 − 1.28 × 10⁻¹g7 + 6.38 × 10⁻³g8 − 1.35 × 10⁻⁴g9) × 0.10) + ((100 − 24.8781h + 5.31814h2 − 1.02h3 + 1.12 × 10⁻¹h4 − 3.72 × 10⁻³h5 − 4.16 × 10⁻⁴h6 + 4.77 × 10⁻⁵h7 − 1.84 × 10⁻⁶h8 + 2.56 x10⁻⁸h9) × 0.10) + ((100 − 1.64638i − 0.06945i2 + 4.90 × 10⁻³i3 − 1.56 × 10⁻⁴i4 + 2.93 × 10⁻⁶i5 − 3.33 × 10⁻⁸i6 + 2.15 × 10⁻¹⁰i7 − 6.59 × 10⁻¹³i8 + 5.27 × 10⁻¹⁶i9) × 0.05) + ((79.24707 + 0.83862j − 0.00848j2 − 5.53 × 10⁻⁵j3 + 1.12 × 10⁻⁶j4 − 6.88 × 10⁻⁹j5 + 2.23 × 10⁻¹¹j6 − 4.12 × 10⁻¹⁴j7+ 4.08 × 10⁻¹⁷j8 − 1.69 × 10⁻²⁰j9) × 0.05)
- w = −10 (−z) − z+1
- z = (a − 5.51082)/1.51245
- a = pH values
- b = Electrical conductivity values
- c = Thermotolerant coliform values
- d = Dissolved oxygen values
- f = Ammonia nitrogen values
- g = Total phosphorus values
- h = Biochemical oxygen demand (BOD5) values
- i = Turbidity values
- j = Dissolved solids values
Finally, the final step for the application of the proposed water quality index is the definition of the quality ranges in which the analyzed raw waters are found. As is known, several Brazilian states have their specific WQIs, as exemplified in Table 2 below:
Table 2.
Water quality index values for different Brazilian states.
As can be seen in the values in Table 2 above, the states of Amapá, Minas Gerais, Paraná and Rio Grande do Sul are more rigorous with respect to the lower ranges in water quality than the states of Bahia, Goiás, Espírito Santo, Mato Grosso do Sul and São Paulo. Since the water quality of the basins that make up the Amazon basin, in general, are still unspoiled, the proposal had the option of being more rigorous in the bands with the worst quality observed, aiming at a greater control of this Brazilian environmental asset. With this in mind, the water quality ranges suggested for this work are presented below in Table 3.
Table 3.
Water quality ranges proposed by the GP-QAT for blackwater rivers in the Amazon region.
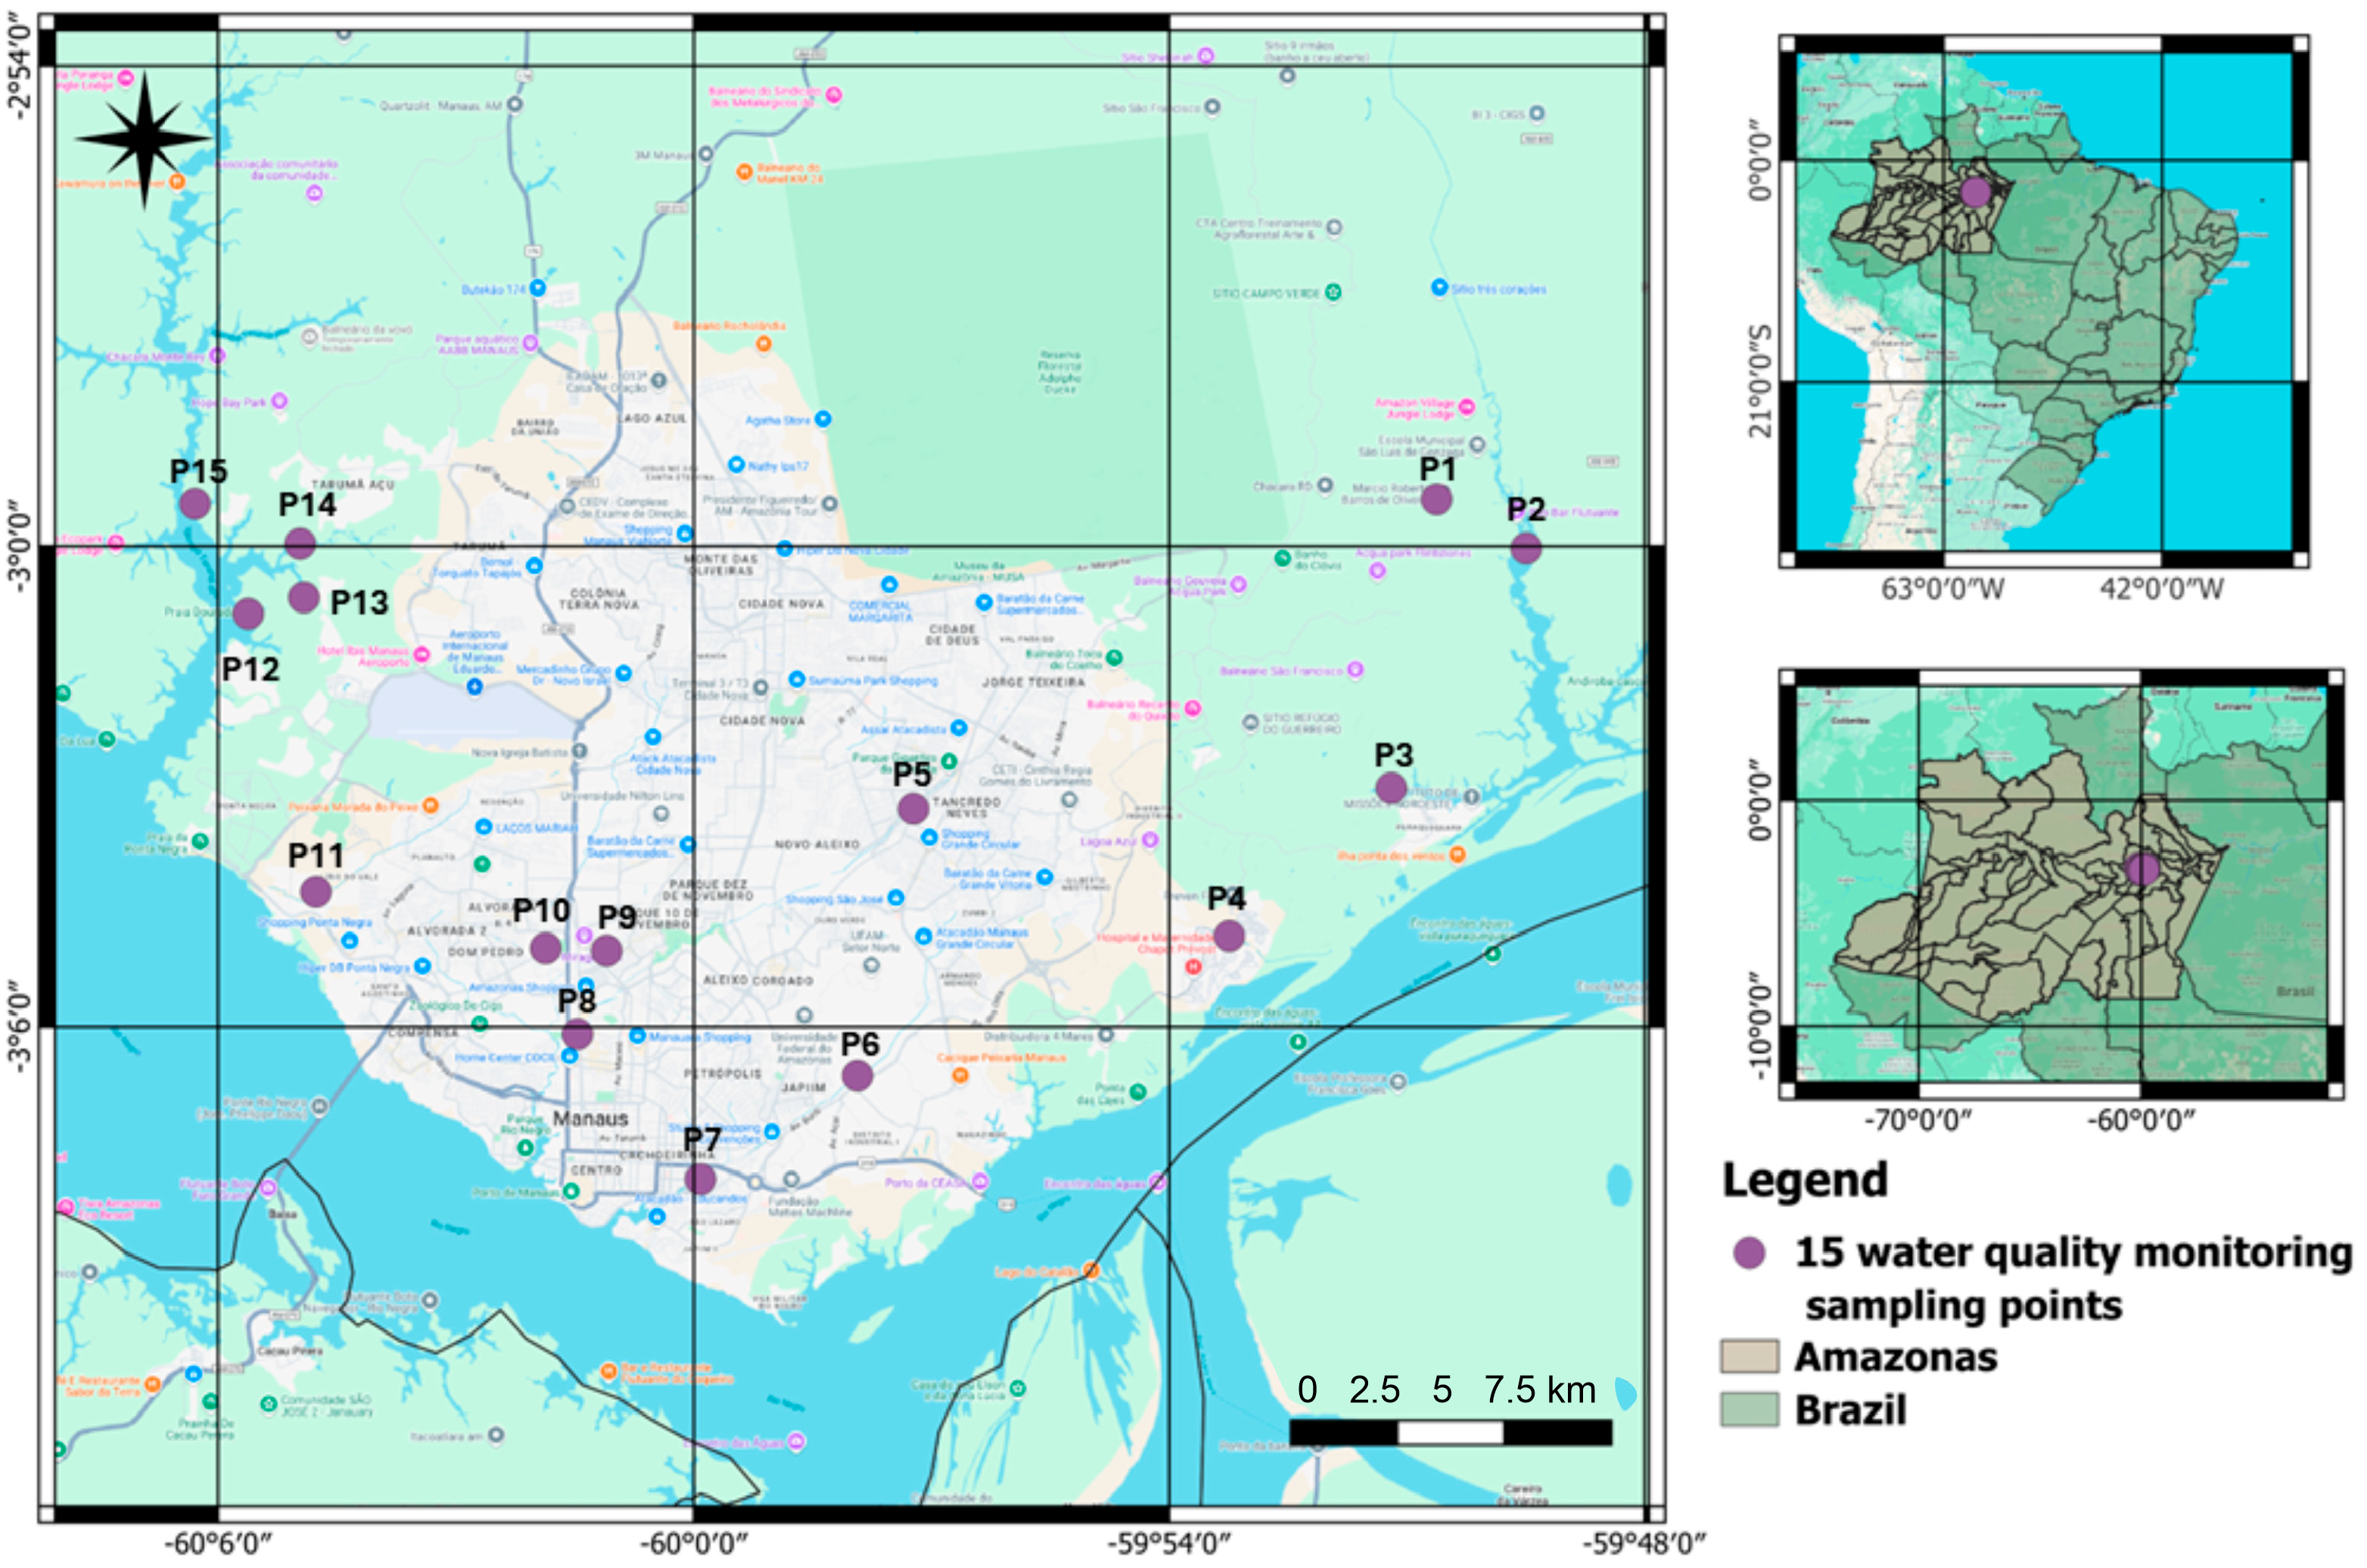
As the research group Chemistry Applied to Technology is responsible for the implementation of the State Water Resources Plan of the state of Amazonas (PERH/AM) for water quality monitoring, we used the 15 water quality monitoring sampling points suggested by the PERH to exemplify the use of this blackwater WQI, in comparison with the WQI used in the state of São Paulo. The 15 points that were used are presented in Figure 6 below.
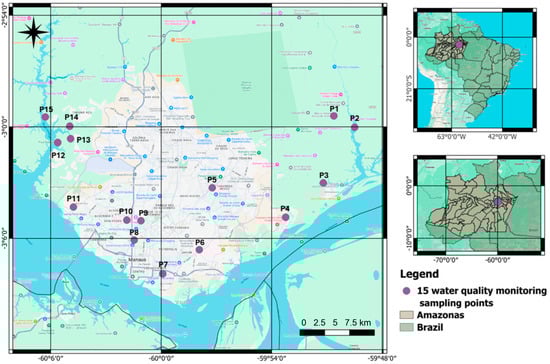
Figure 6.
Sample collection points related to the State Water Resources Plan, PERH/AM, in the city of Manaus, Amazonas.
Table 4 shows the results obtained for the water quality index of the present study and the results from the calculation of the product of the nine parameters (pH, temperature (ΔT), thermotolerant coliforms, total nitrogen, total phosphorus, total solids, dissolved oxygen, biochemical oxygen demand and turbidity) obtained using the WQI used in the state of São Paulo.
Table 4.
Comparison of the results for the water quality index obtained for this proposal and the one used in the state of São Paulo.
A change in water quality values is clearly noted for the two proposals shown above, with a relevant increase in values using our proposal. This is due to the fact that the parameters used in the proposal of this work are adjusted to the characteristic values found in the various water monitoring campaigns carried out by our research group. In addition, the proposal of the present study was built from remote places still practically untouched by human action, which gives this work, beyond its originality, a reference for use in basins where human presence is marked, such as the city of Manaus, for example. From the results obtained, we can apply this water quality index in heavily degraded basins such as those of São Raimundo and Educandos in the city of Manaus (Amazonas).
This work has the possibility to become a fundamental tool for environmental managers and researchers for use in proposals for the management of already-compromised water bodies, such as those mentioned above, but it can also be transformed into an instrument to predict possible environmental impacts, in order to protect basins not yet affected or those with low impacts from anthropological actions.
4. Conclusions
The objective of this study was to present a new proposal for calculating the water quality index (WQI) for blackwater in the Amazon region. This proposal represents a robust initiative based on several studies and a significant amount of data generated from several scientific expeditions in the Rio Negro basin. This is a proposal from a research group that has been working in the area of environmental monitoring for over 10 years and is now a reference in this type of study in the Brazilian Amazon.
The data evaluation indicated that the most representative parameters for the characterization of blackwater in terms of its quality were pH, electrical conductivity, thermotolerant coliforms, dissolved oxygen, ammoniacal nitrogen, total phosphorus, biochemical oxygen demand, turbidity and total dissolved solids. These data, together with the literature review and consultation with experts in the area, made it possible to define the weights of each parameter for the construction of the new WQI.
As expected, the comparative tests carried out between the formula currently used and our proposal showed significant differences in the WQI results, considering the peculiar characteristics of the parameters of the region’s blackwater.
As such, this is a proposal by the research group Chemistry Applied to Technology for a water quality index for the blackwater rivers of the Amazon region; it is a proposal that, via its presentation, will be subject to evaluation by the scientific community, with the purpose of its homologation, with or without adjustments. It is not an absolute proposal but the first step towards the realization of the desire of a large number of our peers for an important tool for the beginning of the next stage in the preservation of this vast national wealth, which is environmental management from the knowledge of the basins.
“You don’t preserve what you don’t know…”
Author Contributions
S.D.J.: Project administration, formal analysis, investigation, writing—original draft; P.M.A.: Project administration, formal analysis, validation, writing; R.L.e.O.: resources, writing—review and editing; S.K.S.d.L.: project administration, resources, writing—review; A.S.C.N.: formal analysis, investigation, methodology, C.E.B.: Supervision, Resources, writing—review and editing; A.N.A.: Methodology, formal analysis and validation, Supervision; E.F.d.B.: resources, writing—review and editing. All authors have read and agreed to the published version of the manuscript.
Funding
Fundação de Amparo à Pesquisa do Estado do Amazonas (FAPEAM). Instituto de Proteção Ambiental do Amazonas (IPAAM). Fundo Estadual do Meio Ambiente (FEMA).
Data Availability Statement
The supporting information for the black river data can be downloaded at https://www.gp-qat.com/projetos-de-pesquisa/proqas%2Fam---programa-de-monitoramento-de-%C3%A1gua%2C-ar-e-solos-do-estado-do-amazonas (accessed on 28 July 2022).
Acknowledgments
This work could not have been carried out without the support of the Instituto de Proteção Ambiental do Amazonas (IPAAM), Fundação de Amparo à Pesquisa do Estado do Amazonas (FAPEAM), Fundo Estadual do Meio Ambiente (FEMA) (SEMA), Universidade do Estado do Amazonas (UEA) and all the technicians and the scientific initiation, master’s and doctoral students of the research group Chemistry Applied to Technology, who are involved in environmental monitoring projects.
Conflicts of Interest
The authors declare no conflicts of interest.
References
- GEO Cidades. Projeto Geo-Cidades: Relatório Ambiental Urbano Integrado; Programa das Nações Unidas para o Meio Ambiente—EscritÛrio Regional para a AmÈrica Latina e o Caribe: Rio de Janeiro, Brazil, 2002; Volume Consórcio Parceria, pp. 1–188. [Google Scholar]
- Queiroz, A.R. PROSAMIM: Desafios de Implantação de Infraestrutura de Saneamento e Ocupação Do Solo Urbano Na Cidade de Manaus, Amazonas. In Programa De Pós-Graduação Em Ciências Do Ambiente E Sustentabilidade N Amazônia; Universidade Federal do Amazonas: Manaus, Brazil, 2009. [Google Scholar]
- Oliveira, E.G.; Alves, J.A. Considerações Preliminares Sobre as Intervenções de Infraestrutura Em Bacias Hidrográficas Urbanas: Estudo de Caso Do PROSAMIN Em Manaus—AM. In Proceedings of the II Seminário Ibero-Americano de Geografia Física, Coimbra, Portugal, 26–30 May 2010; Universidade de Coimbra: Coimbra, Portugal, 2010; pp. 1–11. [Google Scholar]
- Cassiano, K.R.M. Análise Geográfica de Áreas de Risco Na Bacia Hidrográfica Do Igarapé Do Mindú—Manaus (AM). Master’s Thesis, Universidade Federal de Santa Catarina, Manaus, Brazil, 2013. [Google Scholar]
- Uddin, M.G.; Nash, S.; Olbert, A.I. A Review of Water Quality Index Models and Their Use for Assessing Surface Water Quality. Ecol. Indic. 2021, 122, 107218. [Google Scholar] [CrossRef]
- Brown, R.M.; McClelland, N.I.; Deininger, R.A.; Tozer, R.G. A Water Quality Index: Do We Dare? Water Sew. Work. 1970, 117, 339–343. [Google Scholar]
- Jha, M.K.; Shekhar, A.; Jenifer, M.A. Assessing Groundwater Quality for Drinking Water Supply Using Hybrid Fuzzy-GIS-Based Water Quality Index. Water Res. 2020, 179, 115867. [Google Scholar] [CrossRef]
- Dinius, S.H. Design of an Index of Water Quality 1. JAWRA J. Am. Water Resour. Assoc. 1987, 23, 833–843. [Google Scholar] [CrossRef]
- Campos, Z.E.S. De Parâmetros Físicos-Químicos Em Igarapés De Água Clara E Preta Ao Longo Da Rodovia BR-174 Entre Manaus E Presidente Fiqueiredo—AM; Universidade Federal do Amazonas—UFAM: Manaus, Brazil, 1994. [Google Scholar]
- Melo, A.L.; Cunha, H.B.; Baraúna, E.F. Avaliação Dos Coliformes Nas Águas Do Rio Negro Na Orla de Manaus—AM. In Proceedings of the XV. Jornada De Iniciação Científica, Manaus, Brazil, 6–7 May 2006; INPA/CNPQ/FAPEAM: Manaus, Brazil, 2006; p. 373. [Google Scholar]
- Filizola, N.; Seyler, F.; Mourão, M.H.; Arruda, W.; Spinola, N.; Guyot, J.L. Study of the Variability in Suspended Sediment Discharge at Manacapuru, Amazon River, Brazil. Lat. Am. J. Sedimentol. Basin Anal. 2009, 16, 93–99. [Google Scholar]
- Moretto, D.L.; Panta, R.E.; da Costa, A.B.; Lobo, E.A. Calibration of Water Quality Index (WQI) Based on Resolution No 357/2005 of the Environment National Council (CONAMA). Acta Limnol. Bras. 2012, 24, 29–42. [Google Scholar] [CrossRef]
- Dobbie, M.J.; Dail, D. Robustness and Sensitivity of Weighting and Aggregation in Constructing Composite Indices. Ecol. Indic. 2013, 29, 270–277. [Google Scholar] [CrossRef]
- Lobato, T.C.; Hauser-Davis, R.A.; Oliveira, T.F.; Silveira, A.M.; Silva, H.A.N.; Tavares, M.R.M.; Saraiva, A.C.F. Construction of a Novel Water Quality Index and Quality Indicator for Reservoir Water Quality Evaluation: A Case Study in the Amazon Region. J. Hydrol. 2015, 522, 674–683. [Google Scholar] [CrossRef]
- Akhtar, N.; Syakir, M.I.; Rai, S.P.; Saini, R.; Pant, N.; Anees, M.T.; Qadir, A.; Khan, U. Multivariate Investigation of Heavy Metals in the Groundwater for Irrigation and Drinking in Garautha Tehsil, Jhansi District. India. Anal. Lett. 2020, 53, 774–794. [Google Scholar] [CrossRef]
- Gmach, M.R.; Cherubin, M.R.; Kaiser, K.; Cerri, C.E.P. Processes That Influence Dissolved Organic Matter in the Soil: A Review. Sci. Agric. 2020, 77, e20180164. [Google Scholar] [CrossRef]
- Franzinelli, E.; Igreja, H. Modern Sedimentation in the Lower Negro River, Amazonas State, Brazil. Geomorphology 2002, 44, 259–271. [Google Scholar] [CrossRef]
- Fassoni-Andrade, A.C.; Fleischmann, A.S.; Papa, F.; de Paiva, R.C.D.; Wongchuig, S.; Melack, J.M.; Moreira, A.A.; Paris, A.; Ruhoff, A.; Barbosa, C.; et al. Amazon Hydrology From Space: Scientific Advances and Future Challenges. Rev. Geophys. 2021, 59, e2020RG000728. [Google Scholar] [CrossRef]
- Chidiac, S.; El Najjar, P.; Ouaini, N.; El Rayess, Y.; El Azzi, D. A Comprehensive Review of Water Quality Indices (WQIs): History, Models, Attempts and Perspectives. Rev. Environ. Sci. Biotechnol. 2023, 22, 349–395. [Google Scholar] [CrossRef]
- CETESB. Qualidades Da Águas Superficiais No Estado de São Paulo. Available online: https://cetesb.sp.gov.br/aguasinteriores/wp-content/uploads/sites/12/2013/11/Cetesb_QualidadeAguasSuperficiais2015_ParteII_29-09.pdf (accessed on 25 April 2023).
- Horton, R.K. An Index Number System for Rating Water Quality. J. Water Pollut. Control. Fed. 1965, 37, 300–306. [Google Scholar]
- Cude, C.G. Oregon water quality index a tool for evaluating water quality management effectiveness 1. JAWRA J. Am. Water Resour. Assoc. 2001, 37, 125–137. [Google Scholar] [CrossRef]
- Syeed, M.M.M.; Hossain, M.S.; Karim, M.R.; Uddin, M.F.; Hasan, M.; Khan, R.H. Surface Water Quality Profiling Using the Water Quality Index, Pollution Index and Statistical Methods: A Critical Review. Environ. Sustain. Indic. 2023, 18, 100247. [Google Scholar] [CrossRef]
- Sutadian, A.D.; Muttil, N.; Yilmaz, A.G.; Perera, B.J.C. Development of a Water Quality Index for Rivers in West Java Province, Indonesia. Ecol. Indic. 2018, 85, 966–982. [Google Scholar] [CrossRef]
- Benvenuti, T.; Kieling-Rubio, M.; Klauck, C.; Rodrigues, M. Evaluation of Water Quality at the Source of Streams of the Sinos River Basin, Southern Brazil. Braz. J. Biol. 2015, 75, 98–104. [Google Scholar] [CrossRef]
- Rocha, F.C.; Andrade, E.M.; Lopes, F.B. Water quality index calculated from biological, physical and chemical attributes. Environ. Monit. Assess. 2015, 187, 4163. [Google Scholar] [CrossRef]
- Cisneros Ontiveros, H.G.; Medellín Castillo, N.A.; Cárdenas Tristán, A.; Cárdenas, M.C.; Arturo Ilizaliturri Hernández, C.; Putri, R.F. Determination of the Water Quality Index (NFS WQI) of Water Bodies in the Huasteca Potosina, Mexico. E3S Web Conf. 2021, 325, 08002. [Google Scholar] [CrossRef]
- Abeshu, G.W.; Li, H. Horton Index: Conceptual Framework for Exploring Multi-Scale Links Between Catchment Water Balance and Vegetation Dynamics. Water Resour. Res. 2021, 57, e2020WR029343. [Google Scholar] [CrossRef]


Disclaimer/Publisher’s Note: The statements, opinions and data contained in all publications are solely those of the individual author(s) and contributor(s) and not of MDPI and/or the editor(s). MDPI and/or the editor(s) disclaim responsibility for any injury to people or property resulting from any ideas, methods, instructions or products referred to in the content. |
© 2025 by the authors. Licensee MDPI, Basel, Switzerland. This article is an open access article distributed under the terms and conditions of the Creative Commons Attribution (CC BY) license (https://creativecommons.org/licenses/by/4.0/).