Abstract
Water scarcity presents one of the greatest challenges of our time. Especially in naturally water-scarce regions, the need for additional water resources is rising, requiring innovative and site-adapted technologies. The decision for a specific technology is mostly associated with high investment costs and a long life cycle time, which requires a conscientious and transparent decision-making process. In this review, such a framework is developed for selected non-conventional water technologies and strategically evaluated with the goal to support a sustainable technology application based on specific boundary conditions. This is achieved by a matrix-based assessment and the development of key indicators respecting the availability, applicability, environmental impact, scalability, and economic viability of the selected technologies. Based on a wide literature review, the developed methodology involves a systematic comparison of technologies for desalination, water reuse, groundwater utilization, agricultural reuse, and unconventional approaches like cloud seeding, dew water, and fog water harvesting. The developed indicators cover most parameters of the respective categories based on the individual designs. Subsequently, the different technologies are analyzed by a matrix-based evaluation, highlighting various strengths and weaknesses and providing insights into technology application based on regional conditions. The discussion interprets the findings, deriving implications for dry environments, acknowledging limitations, and suggesting pathways for future research. The matrix-based evaluation is illustrated by an example from the Jordan Valley for a brackish water desalination plant. Through this analytical framework, this study contributes to the discourse on sustainable water solutions and a transparent decision-making process, as well as offers valuable insights for policymakers, researchers, and industries during a decision-making progress.
1. Introduction
Water scarcity in arid regions is a critical global issue, threatening sustainable development and posing severe challenges to water resource management. With growing populations, economic activities, and the impacts of climate change, conventional water sources such as groundwater and surface water are becoming increasingly inadequate. These limitations underscore the urgency to explore alternative, innovative approaches to augment and manage water resources effectively [1,2].
Over the years, researchers have proposed various methods to address water scarcity. Desalination technologies, for instance, have emerged as a promising solution, leveraging advances in membrane filtration and thermal processes to produce fresh water from saline sources [3,4]. Similarly, water reuse and recycling systems have demonstrated their potential to reduce dependency on conventional water supplies by treating wastewater to safe standards for various applications [5]. Other approaches, such as rainwater harvesting and fog collection, provide localized solutions but are often constrained by climatic and geographical conditions.
Despite these advancements, the adoption and scalability of non-conventional water technologies [6] face several challenges. Factors such as high energy requirements, environmental concerns, economic constraints, and technological complexity hinder widespread implementation. Although numerous review studies have assessed individual water treatment technologies like for desalination [4,7,8], only a limited number have conducted systematic comparisons of these solutions using a comprehensive set of criteria, including environmental impact, scalability, and economic feasibility, as discussed in [9,10].
The present study intends to develop an integrated matrix-based evaluation framework that considers multiple dimensions to guide effective technology selection processes. The approach is being done by adopting a matrix-based approach to evaluate non-conventional water (NCW) technologies using predefined indicators. By systematically assessing availability, applicability, environmental impact, scalability, and economic feasibility [11], this work provides a holistic framework to compare and prioritize technologies for arid environments.
The importance of NCW technologies in this context cannot be overstated [12,13]. As traditional water sources are gradually being exhausted, these technologies show alternative means to secure a reliable water supply [14]. In this study, only some technologies have been selected for further analysis, representing potential solutions for sustainable water management, which are desalination (D), thermal- or membrane-based [15,16,17], water reuse (WR) [2,18,19], and unconventional approaches such as cloud seeding (CS) [20,21], dew water harvesting (DW) [22,23], and fog water collection (FW) [24]. Understanding their strengths and weaknesses is decisive for the selection of the appropriate technology under the constraints of a certain location. This study evaluates the applicability and feasibility of these technologies, considering location-specific factors such as energy costs and the chemical composition of seawater, with a particular focus on the arid conditions of the Middle East and North Africa (MENA) region. The findings aim to support policymakers, researchers, and practitioners in identifying sustainable solutions tailored to the unique challenges of arid regions. This approach not only complements the existing literature but also provides a strategic perspective that bridges the gap between technology assessment and practical implementation in water-scarce settings. The insights gained contribute to the broader discourse on water resource management and support informed decision making in identifying optimal solutions.
The study is divided into five sections. The introduction outlines the challenges of water scarcity in arid regions and highlights the need for a matrix-based assessment of non-conventional water technologies. The methodology section describes the literature review, the selection of technologies, the development of evaluation indicators, and the matrix-based framework. The results and analysis section applies this framework to evaluate key technologies based on the selected indicators and interprets the results. The discussion explores the implications for water management, provides a brief cost analysis of NCW technologies and an example scenario, and addresses limitations and future research. Finally, the conclusion summarizes the contributions of the study and emphasizes its relevance for sustainable water management in arid regions.
2. Methodology
The methodology section outlines the structured approach used to ensure the reliability and objectivity of the analysis. The study uses a matrix-based evaluation framework that integrates key indicators such as applicability, environmental impact, scalability, and economic viability. Figure 1 illustrates the structured framework applied in this study. The literature review involved screening and selecting studies on non-conventional water technologies and country-specific water management issues. Key insights from this phase informed the development of a set of indicators essential for the technology selection process. These indicators were further refined and validated through an expert workshop involving relevant stakeholders. The outcomes contributed to a matrix-based evaluation, enabling a systematic assessment of the technologies. The process also incorporated subsequent validation steps and stakeholder feedback, culminating in a final assessment to ensure robustness and relevance.

Figure 1.
General approach of this study.
2.1. Literature Review
The literature review presents an overview of the research on the topics of non-conventional water technologies and water management practices in arid regions. The sources reviewed are articles from diverse scientific journals and provide insights into the latest technology advancements, key challenges, and successful case studies in specific countries and environments, with a focus on the MENA region. These sources give the context for the methodological approach of this study, which allows for the definition of specific indicators and the subsequent analysis with a matrix-based approach.
Most of the sources cited in this study have a country-specific point of view, often combined with a particular technology applied in this region. More general papers provide an overview of the technologies for non-conventional water technologies, especially [1,6,13,19,25,26,27,28]. The different technologies are discussed in detail, including the site-specific conditions and socio-economic factors of the MENA region. Other articles [29,30,31] set the focus on the remaining contaminants of concern and trace metals during the non-conventional water application, addressing agricultural as well as municipal aspects of water reuse. Several articles specify the water reuse approaches and safety issues for the irrigation of certain crops [32,33,34,35,36]. In the following subsections, the literature treating a specific country will be shortly reviewed. The technologies applied are predominantly desalination (mostly reverse osmosis, RO), graywater treatment, water reuse, agricultural drainage water, and rainwater harvesting. Water reuse must be distinguished from water recycling, as the latter involves the application of additional technology, while the former involves the direct reuse of water.
2.1.1. MENA and the Mediterranean Region
These articles and studies primarily focus on the Middle East and North Africa (MENA) region [1,2,5,11,37,38], with specific attention also given to the Gulf Cooperation Council (GCC) countries [11]. Several studies emphasize the Mediterranean region [39,40], while others concentrate specifically on Italy [14,26]. The desalination of seawater [15,41] is the most widespread technology, but is associated with high operational costs (OPEX) due to the electricity demand. The combination of renewable energy with desalination is an attractive topic addressed in many studies, i.e., [38,42,43,44,45,46]. Given the high solar radiation in this area, photovoltaic systems would be an especially efficient solution [10,47], and possible ways of enhancing their efficiency are already under development [48]. Environmental impacts originating from various desalination technologies are assessed in this study [49], and sustainability aspects are assessed in [17]. Some reviewed publications discuss innovative process combinations to improve desalination processes [41,50]: forward osmosis (FO) and ultra-filtration (UF) [51], centrifugal RO [52], and nano-filtration reverse osmosis (NF-RO) [53,54]. The latest developments use a closed-cycle RO (CCRO) allowing for better scale control and higher recovery rates [55,56], which is also used for brackish water desalination [57].
2.1.2. Jordan
Jordan faces more severe water scarcity than other countries in the MENA region [58], primarily due to its limited conventional surface water resources and restricted access to seawater [59,60]—available only in the city of Aqaba. The existing surface waters, mainly consisting of rainwater stored in high dams located in the mountainous northern region, are frequently compromised by uncontrolled local wastewater discharges and general over-exploitation [9,61].
In response to severe water scarcity, several studies show that Jordan increasingly relies on non-conventional water resources, including wastewater reuse, groundwater extraction, and membrane-based desalination technologies like RO and membrane distillation. Wastewater reuse offers a sustainable solution by treating and recycling effluents for agricultural and industrial applications [9,61], though concerns remain regarding the potential accumulation of contaminants and risks to soil [60]. Groundwater extraction, while a critical source of water, poses environmental risks due to over-extraction, leading to declining water tables, land subsidence, and degradation of water quality through salinization [58]. Membrane-based desalination, particularly reverse osmosis, provides a reliable means to produce freshwater from saline sources but is associated with high energy consumption [59,62] and the generation of concentrated brine, which requires careful disposal to mitigate adverse impacts on marine ecosystems. Integrating solar-powered desalination systems can significantly reduce the high energy consumption of desalination processes [10,63], enhancing sustainability by utilizing renewable energy sources.
2.1.3. Egypt
As Egypt has been experiencing water scarcity for many decades, there has been extensive research conducted in field of non-conventional water technologies, including both agricultural and municipal water use. A general overview is given by Bakr et al. [64], who mention the Nile river as the primary water resource for the human supply of water. As the river does not fully covers the irrigation needs, non-conventional resources are added, namely, agricultural drainage, groundwater, and treated wastewater. Other resources/technologies are more specifically detailed in the following papers: graywater in [65,66], water reuse in [67,68,69], or rainwater harvesting in [70,71]. Several papers have a distinct local relation, e.g., [67,69,72,73]. One of the most widely used technologies, desalination, is described in general in [4,74], in the context of irrigation in [4], and in Rayan et al., where they present the installed desalination units in the Sinai peninsula specifically, as well as potential future sites in Egypt [72].
2.1.4. Tunisia and Morocco
Tunisia started early with water reuse approaches [34] in the agricultural sector, and a general outline of the national perspective of water in Tunisia can be found here [75]. Several other publications discuss the technological solution in desalination plants [7,76,77], partly supplied with geothermal energy [78], or desalination using solar photovoltaic (PV) energy [43,45,79]. Morocco has a desalination strategy that is comprehensively explained in this study [80].
2.2. Selection of Non-Conventional Water Technologies
The initial phase of the study involves a selection process to identify non-conventional water technologies [26], with a particular emphasis on site-specific conditions, namely, the arid climate. Table 1 presents the selected technologies with their abbreviations based on [13]. For reasons of clarity, the technologies are not described here in detail, but there are many references given for more information.

Table 1.
Selected non-conventional water technologies and descriptions.
Recognizing the diversity within each technological category, the Technology Readiness Level (TRL) is presented as a general indicator of development and market maturity. This concept was first introduced in 1995 by the NASA space technology [91] and is shown in Figure 2, where the TRL concept is transferred to water related technologies, ranging from 1 (concept stage) to 9 (fully market-ready). However, it is important to note that technologies within the same category may vary significantly in their TRL. For instance, while conventional reverse osmosis desalination systems are typically at TRL 9 due to widespread deployment, emerging desalination methods such as forward osmosis or capacitive deionization may range between TRL 5 and 7, depending on their level of validation. Breakthrough concepts, like solar desalination integrated with advanced materials, might remain at early research stages (TRL 2–3).

Figure 2.
Technology Readiness Levels (TRLs) modified from [91].
This selection is not required to include every possible technology, as it would go beyond the aim of this study, which intends to give a comprehensible and clearly arranged overview. It also neglects the origin of the wastewater, i.e., municipal, industrial, or agricultural. The most common technologies, namely, desalination [16] and water reuse [18], as well as more unconventional approaches like cloud seeding [21], dew water [23] harvesting, and fog water [24] collection, have been chosen based on their potential significance in the Mediterranean region. Each of these non-conventional water technologies presents distinctive advantages and challenges, and their suitability depends on the specific conditions and requirements of the target region.
2.3. Development of Indicators
An indicator is a parameter designed to assess progress, effectiveness, and performance within a given context. For monitoring and evaluation, the indicators need to be specific, measurable, achievable, relevant and time-bound (SMART) [92]. Following these SMART criteria, indicators should be selected in order to establish a clear frame for monitoring and evaluation [93].
Figure 3 shows the SMART concept and gives some examples that can be applied for the respective technology indicator in water treatment technologies. In order to make them more meaningful in the context of non-conventional water technologies, it is important to understand that the chosen indicators should fulfill the SMART criteria.
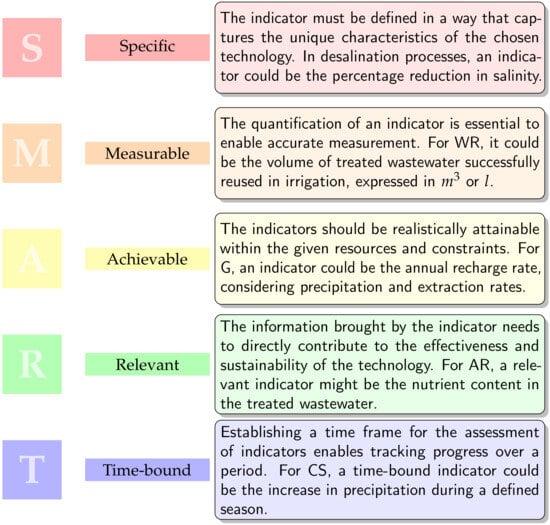
Figure 3.
SMART indicators for technologies.
After the definition of the technologies, the development of applicable indicators in the framework of non-conventional water resources is made. These indicators are reviewed by experts and stakeholders, which are jointly discussed during a workshop of the AGREEMed project with all participants. In a second step, the indicators are grouped in five specific categories. The categories listed in Table 2 provide a structured framework for the analysis of diverse set of indicators in order to derive a comprehensive evaluation of the non-conventional water technology’s performance and impact in arid regions. The categories are subject to a set of indicators, which are explained in the following sections in more detail.
Table 2.
Categories and explanations of indicators.
2.4. Matrix-Based Evaluation Framework
The criteria chosen for each category should be customized to account for site-specific conditions, including factors such as the local availability of raw water sources, region-specific economic considerations, and environmental impact assessments. Assigning weights to these criteria, based on stakeholder input and expert insights, helps in prioritizing their significance. A numerical or qualitative scoring system facilitates the systematic assessment of each technology based on the identified criteria. Subsequently, relevant data are collected as part of a comprehensive site assessment in order to complete the matrix, considering aspects such as climate, water quality, and socio-economic conditions. The scoring matrix is then utilized to calculate total scores for each technology, incorporating both the assigned weights and the actual scores. This approach facilitates the ranking and prioritization of technologies, with the highest total score indicating suitability for the specific site conditions. The entire process should be thoroughly documented and reported to ensure transparency and to provide a dynamic tool for informed decision making in water resource management. Regular updates and reviews further enhance the framework’s adaptability to changing conditions and evolving technologies.
Stakeholders and experts collaboratively determine the significance of each indicator in contributing to the success of the technology in a given context. The applicability framework involves assigning relative weights to indicators, reflecting their relevance and influence on the effectiveness. Factors such as the adaptability to local water quality requirements, the consideration of the climate, its alignment with economic considerations, and its acceptance within the community are considered during this weighting process. The goal is to create a balanced and relevant system where indicators decisive for the success of the technology receive higher weights. This tailored approach ensures that the matrix-based evaluation adequately addresses the unique requirements and challenges of each non-conventional water technology.
3. Results and Analysis
A matrix-based evaluation of non-conventional water technologies is presented in the following section, focusing on the aforementioned site-specific conditions. This section introduces the developed indicators, their weights, and the scoring matrix. The results are analyzed to reveal insights into each technology’s performance, emphasizing their suitability for the unique challenges posed by the site. Beyond presenting scores, the analysis explores the interactions between indicators, leading to a solid foundation for the ensuing discussion and conclusions.
3.1. Development of Indicators for the Selected Technologies
This subsection details the systematic selection and formulation of the indicators, aligning them with the defined categories. Each indicator is carefully customized to capture the nuanced aspects of the chosen technologies. This concise paragraph highlights the rationale behind indicator selection, setting the stage for the subsequent matrix-based evaluation.
3.1.1. Availability
The “Availability” category evaluates the reliability of the non-conventional water technology when it comes to harnessing existing water sources in arid regions. It considers factors such as water availability for desalination, groundwater accessibility, meteorological conditions, and atmospheric moisture for dew and fog water harvesting. This category is relevant for ensuring a consistent and dependable water supply, which is fundamental for the success of these technologies in water-scarce environments. The following Table 3 summarizes the indicators and their units. They should not necessarily be considered separately, as correlations are to be expected. For example, the indicators 1.1 and 1.3 can predict at least qualitatively the degree of pollution of the raw water, which is then displayed in detail in the indicators 1.4 to 1.6.
Table 3.
Indicators in the “Availability” category.
3.1.2. Applicability
In the “Applicability” category, the focus shifts to evaluating the suitability and adaptability of non-conventional water technologies to diverse environmental and operational contexts. This category assesses how well these technologies can be practically implemented in arid regions, considering factors such as compatibility with local conditions and ease of integration into existing infrastructures like the plant footprint. In addition, the social acceptance, water accessibility, and inequalities of the usage outlines the importance of estimating the applicability of these solutions. Table 4 shows the developed indicators. A particular challenge would be to obtain an unambiguous result regarding 2.3, as sociological factors are harder to quantify. In order to obtain an impression of the general opinion, options like surveys or polls could be considered. On the other hand, information concerning the indicators 2.1 and 2.2 is easier to find. Again, correlations between the different indicators become apparent: while considering 2.2, and 2.3, the origin and previous usage of raw water (1.1 and 1.3) also have to be acknowledged. For example, reusing wastewater as drinking water may not be socially accepted and would require significant treatment efforts to meet the water quality requirements.
Table 4.
Indicators in the “Applicability” category.
3.1.3. Environmental Impact
In the “Environmental impact” category, the evaluation is centered around key indicators aiming for the recognition of the ecological ramifications of non-conventional water technologies in arid regions. This examination considers critical factors such as electrical and thermal energy consumption (3.1), the usage and generation of chemicals and byproducts (3.2) and their toxicity (3.4), life cycle assessment (3.3), freshwater consumption for mixing (3.5), the presence of hazardous water compounds in runoff water (3.6), and the efficiency of the removal of the contaminants (3.7); an overview of these indicators is given in Table 5. It is important to mention that the time frame for such an evaluation is short-term-based and cannot predict future developments, e.g., depleting groundwater resources by over-exploitation. By focusing on these indicators, the evaluation aims to offer a detailed understanding of the environmental implications of the technology, enabling a thorough consideration of their sustainability and ecological compatibility within the designated areas.
Table 5.
Indicators in the “Environmental Impact” category.
3.1.4. Scalability
In the “Scalability” category, the assessment revolves around two key indicators that determine the adaptability and extensibility of non-conventional water technologies in arid environments. The first indicator, “Capacity restrictions, processing limits,” focuses on understanding the constraints and limitations regarding the maximum water treatment capacity and processing capabilities of the technology. The second indicator, “Plant modularity”, evaluates the degree to which the technology can be designed modularly and scaled, allowing for flexible adjustments to varying capacities. Both indicators address effectively a range of water treatment needs across different scales within arid regions. The following Table 6 explains the indicators in detail.
Table 6.
Indicators in the “Scalability” category.
3.1.5. Economy
In the “Economy” category, the evaluation centers on the financial aspects that govern the implementation and sustainability of non-conventional water technologies. This category encompasses critical indicators that directly influence economic considerations, which are presented in Table 7. The capital expenditure (CAPEX) examines the initial investment required for technology establishment, while the operational expenditure (OPEX) assesses ongoing operational costs, e.g., energy demand. The water product costs (5.3) scrutinize the expenses associated with the produced water, and life cycle costs (5.4) enable a comprehensive view of the overall financial impact throughout the technology’s life cycle. Logistics (5.5) consider the efficiency of resource utilization, and the return on investment (5.6) evaluates the economic profitability of the technology. Given the pivotal role of financial considerations, this category plays a crucial role in determining the feasibility and long-term success of implementing these technologies in arid environments. Due to the importance of these indicators, there is a more detailed cost analysis given in Section 4.2.
Table 7.
Indicators in the “Economy” category.
3.2. Analysis by Matrix-Based Evaluation
In this section, the focus shifts to the examination of the chosen non-conventional water technologies (see Table 1) by applying the previously described indicators to the respective technologies. This analytical approach considers the applicability of each technology to specific indicators, allowing a systematic comparison of their performance and suitability. By employing a matrix-based framework, this evaluation aims to elucidate the interactions between the selected technologies and the diverse array of indicators across the five chosen categories. The goals of this assessment are mainly the identification of the strengths and weaknesses of each technology in order to simplify of the decision-making process for their deployment in arid regions.
The weighting and scoring process involved a diverse group of 12 experts from various sectors and regions to ensure a comprehensive and balanced evaluation. The expert panel included the following:
- Academic experts (seven participants): Professors and researchers specializing in water management, environmental engineering, and sustainable technologies from leading universities in Jordan (e.g., German Jordanian University), Morocco (e.g., Mohammed VI Polytechnic University), and Tunisia (e.g., University of Carthage).
- Local Stakeholders (three participants): Representatives from local water utilities, non-governmental organizations, and private sector companies engaged in water technology projects in Morocco.
- Governmental Institutions (two participants): Officials from national water authorities and ministries responsible for water resource management in Jordan, Morocco, and Tunisia.
In Table 8, the suitability of the indicators from the category “Availability” for the different technologies is shown. Only one indicator, namely, No. 1.2 (usable volume produced), is suitable for every technology. Although it is the largest category, there is a recognizable trend in the division of the indicators; the different water properties (1.4–1.6) are relevant to the technologies using already existing water resources (D, WR, G, and AR) with given water quality aspects. The weight presented in the last column represents the frequency with which a specific indicator is applicable to the respective technology and can have a maximum of 7 per indicator.
Table 8.
Matrix analysis for the “Availability” category.
The others rely on the meteorological conditions with limited predictability, which are important for the methods condensing the water from the air and utilizing the different weather conditions. Also, the different water quality characteristics for CS, DW, and FW are not determinable due to the variability in the composition of precipitation. These different characteristics could further lead to problems in meeting the water quality requirements (2.2). AR and G also depend on a longer timescale on the local rainfall and precipitation, determining the available water for those applications.
The Table 9 shows the indicators of the “Applicability” category, similar to the table above. The suitability of each of them varies much less than in the “Availability” category, as each of them is applicable to almost any technology. The reason for this is that only CS does not require any plant space, as the chemicals are applied by airplanes or ground-based equipment to induce rainfall. It is very important to know what the water is being produced for, as the water quality requirements (2.2) are different for each use. In addition, water quality guidelines may vary from country to country. The guidelines for drinking water are the most stringent and are described in detail by the World Health Organization [94]. Water intended for agricultural use should also be closely monitored, especially for E. coli, to avoid contamination of crops and groundwater. Therefore, the guidelines should be reviewed beforehand to assess which technology could meet these criteria.
Table 9.
Matrix analysis for the “Applicability” category.
In Table 10, the analysis for the environmental impact aspects is presented. Being the second-largest category, the weights of the indicators vary quite significantly, with No. 3.3 (LCA) being the only one applicable for every technology. Every indicator is suitable only for two processes (WR and AR), while only two indicators are applicable to the more innovative/less widespread technologies (CS, DW, and FW).
Table 10.
Matrix analysis for the “Environmental Impact” category.
Subsequently, in Table 11, the matrix for the scalability indicators is pictured, which is the smallest of the categories. The processing limits are applicable to every technology, while the plant modularity is only applicable to D, DW, and FW. The two latter ones require large land areas, due to relatively low water production volume per area of condensing surface. It is notable that the applicable areas can be in remote locations, which are difficult to access.
Table 11.
Matrix analysis for the “Scalability” category.
In Table 12, the category “Economy” is presented. This is the only category where all indicators are applicable on every single technology, despite the relatively large number of the indicators.
Table 12.
Matrix analysis for the “Economy” category.
The assessment of the respective technologies should be done explicitly for the special boundary requirements of a distinct location by a qualified engineer. The best solution may vary, and there are always several possible options to consider, while the indicators from the “Economy” category are mostly the basis for an investment decision.
3.3. Interpretation of the Analysis
3.3.1. Desalination
This technology is widely used for the production of drinking water and for agricultural purposes [5]. The significant OPEXs are associated with the high electricity demand, representing up to 80 % of the costs. The economic viability heavily relies on the local electricity price, impacting the overall cost-effectiveness of desalination projects [57]. Useful indicators to estimate the impact of these issues are the following: Energy consumption (3.1), Life cycle costs (5.4), and OPEX (5.2). Additionally, environmental aspects have to be taken into consideration, e.g., brine discharge and water intake construction. It is recommendable to set up an LCA for this purpose (3.3). The brine has significant environmental impacts, which are mostly regulated by a legal framework, respective exceptions, and technical limitations. Especially if the brine is disposed improperly in the sea, it can cause serious damage to the aquatic ecosystem. The reasons are not only the high salinity but also the possible accumulation of hazardous chemicals such as antiscaling agents, chemicals from cleaning processes (CIP), and heavy metals [49,54]. Nevertheless, a complete brine treatment would multiply the water price from desalination and is mostly not applied. All indicators of the category “Economy” and some of the category “Environmental impacts” (3.1), (3.2), and (3.4) describe the associated costs and limitations of the technology.
3.3.2. Water Reuse
While technically and economically feasible, water reuse and recycling encounter economic challenges related to upgrading processes, particularly when intended for human consumption [19]. Therefore, it is important to consider the economy-related indicators. Also, there is sometimes the need for freshwater used for mixing (3.5), which can be minimized by appropriate plant operation. Depending on the intended purpose of the reused water, there might be stricter regulations regarding the water quality (2.2). Cultural and social aspects (2.3) can further affect the economic viability of widespread deployment, necessitating careful consideration of associated costs. The concentration of certain compounds of concern (e.g., pharmaceutics, pesticides, etc.) as well as biological parameters like the chemical oxygen demand (COD) and the biochemical oxygen demand (BOD5) should be considered (3.2, 3.6), as the origin of the raw water and the containing substances can be unknown (1.1, 1.3) [67]. However, the energy requirements are significantly lower compared to other technologies (3.1) [95].
3.3.3. Groundwater
Groundwater utilization is subject to availability and economic constraints, with post-treatment costs being a factor (5.2), especially for brackish water. A treatment is often necessary due to the salinity and the possibility of contamination with, e.g., agricultural substances like pesticides or fertilizers (3.2, 3.7), as well as depending on the location of the groundwater extraction (1.1) [29,96]. Due to the salt removal, this technology also produces brine which leads to the same problems as the desalination. An LCA (3.3) should be set up to determine if the environmental concerns regarding the brine disposal/treatment outweigh the benefits of this technology, namely, the low/non-existent energy consumption and chemicals applied during this process. The economic feasibility of the direct usage for irrigation (5.4, 5.6) depends on factors such as deep aquifer accessibility, its management to prevent over-exploitation, and the potential risk of increasing salinization [75]. Additionally, depleting groundwater levels have to be taken into account, especially in arid regions; therefore, uncontrolled groundwater extraction may contribute to this problem [58].
3.3.4. Cloud Seeding
Cloud seeding, although dependent on local weather conditions (1.7, 1.8), faces serious economic and environmental challenges due to the costs associated with the applied chemicals (5.2, 5.3, 5.4), additional costs for the spreading using small airplanes, and unforeseeable environmental impacts. Secondly, increases in rainfall can reach from not measurable to up to 30 %, but this is hard to predict and measure exactly. Due to the toxicity of the chemicals (3.4), e.g., silver iodide (AgI), it may necessitate additional measures contributing to economic considerations [21]. Due to the known hazardous potential of AgI on agricultural lands, it may lead to safety concerns within the society (2.3). Furthermore, the prevailing local meteorological conditions need to be strictly taken into account, as special cloud formations and humidity levels are the basis for this technology. The wind direction can lead to rainfall in areas, where it is not intended to rain [20]. Despite the advantage of this technology concerning its footprint and flexibility regarding the location (4.1), it cannot be considered nowadays as sustainable water technology due to unpredictable environmental impacts and high associated costs.
3.3.5. Dew and Fog Water
Dew and fog water technologies are entirely dependent on meteorological conditions respecting indicators (1.7, 1.8) [23,24]. Economic and logistical challenges are caused by the need for large installation areas, which are often remote, and challenging-to-access (2.1) areas like mountains and elevations. The economic feasibility is further impacted by the costs associated with maintaining the plant and transporting water from the remote locations (5.3, 5.4). Concerning the energy demand (3.1), this technology needs only very low resources, mostly depending entirely on the post-treatment and transportation logistics.
4. Discussion
In this section, the main findings are presented, which have been derived from the matrix-based evaluation of non-conventional water technologies and their corresponding indicators. In order to enable a better understanding for the interpretation, there is a small example given of the matrix-based evaluation for a specific site in Jordan. The strengths and weaknesses of each technology concerning the diverse set of indicators are critically discussed while highlighting their performance in the discussed categories.
4.1. Implications for Water Management in Arid Environments
The evaluation of the non-conventional water technologies by matrix-based analysis shows that several key indicators emerged as pivotal factors, carrying the highest impact in the technology selection process. The usable volume produced, assigned a weight of 7, highlights the practicality and effectiveness of each technology, emphasizing the need for a substantial water output to meet diverse demands. The stringent water quality requirements depending on the application underscore the significance of ensuring that the usage of treated water is safe and sustainable, without creating further environmental problems such as soil contamination. Social acceptance reflects the intricate interplay between technological solutions and societal perceptions, highlighting the importance of aligning innovations with community values. All indicators are summarized in Table 13 and have been assigned in the prior analysis a weight of 7, thus being applicable to all technologies selected in this study.
Table 13.
Key indicators for decision-making progress.
Furthermore, the life cycle assessment describes a comprehensive extent of the environmental impact, encompassing factors from raw material extraction to end-of-life considerations (cradle-to-grave). It is also useful to avoid problem shifting when considering one technology against another, given the fact that the LCA highlights potential issues which would otherwise remain unrecognized. Capacity restrictions and processing limits focus on the scalability of the technology, addressing the critical aspect of accommodating varying water demand scenarios efficiently.
The economic considerations, represented by CAPEX, OPEX, water product costs, life cycle costs, logistics, and profitability, emphasize the great importance of financial performance and long-term sustainability. These indicators encapsulate the entire economic landscape of implementing and maintaining each technology, highlighting the need for cost-effectiveness, efficient logistics, and positive financial outcomes.
4.2. Cost Analysis of NCW Technologies
Due to the outcomes of the previous section, the following analysis is dedicated to the water product costs (5.3) of non-conventional water technologies in particular. As the profitability of the chosen technology is an important factor for an efficient long-term solution. Some of the main influencing factors and the correlating indicators prior defined are analyzed and compared in the following sections.
4.2.1. Desalination
The price of desalinated water is two to three times higher than that of traditional surface water, ranging from 0.45 to 2.51 USD/m3. The strong fluctuations are caused by the dependence of the technology on several factors, namely, the following:
- 1.
- The technology of the desalination process (e.g., membrane, distillation, etc.);
- 2.
- The salinity and compositions of the feed water (1.1, 1.3, 1.5);
- 3.
- The CAPEX and OPEX (5.1 and 5.2);
- 4.
- The production capacity (1.2).
Furthermore, desalination is, in terms of energy consumption, independent of climatic conditions, so indicators 1.7 and 1.8 are not applicable. However, this should not be misunderstood, as there is a dependence of ambient and feed water temperature on the product water flow of an RO system that is not addressed here. For each influencing factor (see 1–4 above), at least one indicator can be used to quantify its impact on the costs. Concerning factor 2, the saltwater composition, particularly in terms of the salinity levels and the presence of specific ions, directly influences the energy demand and operational complexity of desalination processes. Higher salinity and concentrations of scaling-inducing compounds, such as calcium or magnesium, increase the need for pre-treatment and raise energy consumption, thereby elevating overall desalination costs. Due to the high energy demand of desalination units, the OPEXs are the largest contributors to the price of desalinated water and share up to 60 % of the costs (3.1). Concerning CAPEXs, they strongly depend on the quality and salinity of the feed water. Usually, the CAPEX of RO for seawater desalination ranges from 600–800 USD/m3 and is much higher than the CAPEX of RO for brackish water, which ranges from 240–400 USD/m3 [97,98].
4.2.2. Water Reuse
The cost of wastewater treatment and reuse in a decentralized system (DESAR) consists of three factors: construction (CAPEX, 5.1) and operation and maintenance (OPEX, 5.2). The OPEX consists of the energy demand (3.1), the chemicals used (3.2, 3.4), and the labor salary. These costs are proportional to the capacity of the treatment system (1.2, 4.1). Due to different energy prices, the OPEXs can vary strongly; they range from 0.07 to 0.23 USD/m3 [99]. According to Chen et al. [100], the total annual cost of a DESAR system can be calculated using the following equation:
The first term presents the CAPEX, is the proportional coefficient related to the specific treatment process, Q is the daily flow rate, and is the exponential coefficient related to the cost-scale effect. The second term relates to the OPEX, where stands for the unit costs of the operation. The last term respresents the maintenance costs, where represents the coefficient of annual maintenance [100,101].
4.2.3. Groundwater
The cost of groundwater extraction is highly dependent on local electricity prices, as the energy demand (3.1) for pumping is the main cost driver. The costs can vary depending on the pumping schedule (simultaneously or alternately) and are approximately 0.2 USD/h of pumping [102]. The total costs are directly proportional to energy prices. Other factors that influence the energy demand are the depth of the available water level. If it is low in a location with little rainfall (1.7, 1.8), more energy is needed to pump the groundwater [103].
4.2.4. Agricultural Reuse
This technology is similar to water reuse, but it is specifically designed for agricultural irrigation. It is important to be aware of the tolerance of crops to specific contaminants (1.4–1.6). The lower the tolerance, the more fresh water is needed for mixing (3.5), which increases the costs. The total costs of agricultural reuse is described by the following equation:
stands for the number of specific treatment process steps. The first term represents the mixing ratio with fresh water, and the second term defines the costs per single treatment process j [104].
4.2.5. Cloud Seeding Water
Calculating the cost of cloud seeding water is more difficult due to the imprecise estimation of the rainfall produced, which is highly dependent on meteorological conditions (1.7, 1.8). To estimate the cost of cloud seeding, it could be estimated by dividing the operational expenses by the additional water volume generated using historical data and models. Multi-year averages and sensitivity analyses help reduce uncertainties, while real-time data from pilot projects can refine estimates. Therefore, it is preferable to express the cost in USD/m2 of seeded area rather than in USD/m3 of produced water. In Texas (US), the price per acre is indicated at USD 0.03, which is low due to the fact that aircrafts were already provided. The larger the area seeded, the higher the cost (2.1). The CAPEX depends on whether an aircraft is needed or whether the seeding is done from the ground (5.5). If the latter is chosen, the costs decrease significantly. However, the OPEXs depend mainly on the type and amount of chemicals used (3.2) [105].
4.2.6. Dew and Fog Water
These technologies are similar, and both are very low cost compared to the previously mentioned technologies. Due to the fact that their maintenance is low, there are some benefits concerning the OPEXs. If a passive process is chosen, the CAPEXs are also low, consisting mostly of mesh nets for dew or fog water collection. One square meter of mesh net costs around USD 0.25 [106]. A disadvantage is the demand of the active area of nets needed, as the price of land must also be taken into account for (2.1). If an active process is chosen, the CAPEX and OPEX are increased, as heat exchangers and electricity (3.1) are required. When choosing the type of process, it is important to note that not only the CAPEX and OPEX are important but also the water produced. A passive dew water collector can produce max. 0.8 L/d/m2. Furthermore, the location also needs to be carefully meteorologically analyzed, as too humid areas tend to lower the yield of dew and fog collection [22]. The amount of produced water can be difficult to predict, as the produced water quantity also depends on the daily temperature spread, making the cost calculation challenging.
According to Domen et al. [107], an estimation can be made for fog water:
In this equation, represents the rate of water collected in L/h, w is the humidity of the air, A is the area of the net, is the efficiency of the collection, and V is the wind speed [107].
4.3. Example Scenario
In order to give a more precise idea of how to work with the indicators, the following subsection presents a scenario of a possible decision-making process for a plant location in Jordan. For better clarity, only a few indicators were selected in this example and were weighted equally. This is a simplification which does not necessarily reflect the real situation, as certain local conditions can influence the significance of one certain indicator or limit the technology selection. This could be the absence of electricity supply, which prevents the application of a desalination unit or is due to difficult terrain that is complicated to access. Here, the goal is to compare the implementation of different technologies within the frame of a given set of parameters for a specific location.
4.3.1. Parameters
The example location and the respective parameters were chosen because an operational plant for the water supply of a date farm had been implemented at this location 12 years ago. The plant is a reverse osmosis desalination plant for brackish water desalination of deep well water that is entirely powered by solar PV panels. It has a design capacity of 2 m³/h and is operated in an island configuration with solar electricity only. This allows a runtime up to 12 h of operation per day during the summer months. The following Table 14 shows some of the exemplary boundary conditions. The meteorological data have been obtained by a local weather station using averaged data from the year 2019, because there are no other data available.
Table 14.
Selected parameters of example site in Jordan.
4.3.2. Selection of Indicators
The technology selection was based on five selected indicators from Table 13, which are the following shown in Table 15. In order to keep the example short, only some of the applicable indicators were considered.
Table 15.
Summary of key indicators.
4.3.3. Comparison of Technological Options
In order to assess the performance and the applicability of the selected technologies, the respective indicators were assigned certain points by a specific scheme. This ensures the comparability of the technologies and simplifies the decision-making progress for a specific water treatment technology. The scheme is based on a scoring system following the most important points:
- 2: The technology is fully suitable to meet the requirements of the indicator;
- 1: The technology is still appropriate under certain conditions;
- 0: The indicator is not applicable or missing information;
- −1: The technology is applicable but is not suitable in the given location;
- −2: The technology is not applicable.
Table 16 compares the seven technologies that were assessed according to the proposed scoring system, with a certain value for every indicator. Given the fact that five indicators are selected and can amount to 2 points each, a total of 10 points is the highest value achievable. In order to understand the scoring system of the matrix based comparison, the following explanations are helpful:
Table 16.
Comparison of the different technologies.
Concerning the usable volume produced, D can be easily scaled up depending on the feedwater and availability of the electricity, while CS, DW, and FW are not suitable for the selected locations. These technologies are not reliable in the selected environment and cannot meet the water demand for the irrigation. CS especially is too unreliable for irrigation, as the average humidity and temperature do not support the formation of clouds.
The water quality of the ground water does not meet the irrigation water requirements of date palms in terms of salinity. The reduction in the water salinity is the main goal of the technology, which makes WR and G not applicable. All other technologies are able to reduce the salinity to a level, which allows for irrigation after water treatment. So, D is the best suitable technological option.
Focusing on energy consumption, WR does not require any energy and is therefore the best option here. CS depends on suitable meteorological conditions with a certain humidity to initiate rainfall, but it has no direct energy consumption and several unknown environmental impacts caused by the applied chemicals. The electricity demand of D is generally high, but due to the strong solar irradiation, it can be also realized by a solar PV field. In this example, this has been applied, resulting in very low OPEXs.
Concerning capacity restrictions, DW and FW have strong requirements for the local meteorological conditions, treatment capacity and plant footprint associated with the available space, as they use large webs to condense the fog directly. All other technologies have a smaller plant footprint per m3 water produced and are easier to scale. In contrast to CS, they can be applied everywhere and have no required land use for a plant.
Lastly, the product costs have a significant impact on the financial performance of a respective technology. Here, the WR is the most beneficial technology, as it can entail the lowest capital and operational expenditures. Under the assumed boundary conditions, CS can be hardly predicted, as the applied chemicals and the facility for an effective distribution require significant efforts (e.g., fuel for an airplane). Desalination with reverse osmosis technology is highly commercialized, and due to further membrane development, the plants are standardized and have comparably low installation costs. During operation, the electricity price per kWh have the greatest impact on the product price. Solar PV panels can reduce this costs significantly but require a higher CAPEX compared to grid-connected plants.
4.3.4. Results of Matrix-Based Evaluation
As shown in Table 16, desalination achieved the highest points (7) for this specific example. This also meets with the real situation of the selected location in the Jordan valley, as a local brackish water desalination plant has been running there for many years. As the date palm trees have a certain tolerance concerning the irrigation with brackish water, the permeate is mixed with the feedwater to a tolerable salinity for the palm trees in order to increase the availability of the irrigation water. Secondly, the water reuse also scores with the second best option, which is due to the low electricity consumption and the attractive product costs. This would be tolerable if the groundwater quality would meet the irrigation requirements in terms of salinity.
4.4. Limitations and Future Research Directions
Despite challenges in the robustness of the matrix-based evaluation, it is essential to acknowledge certain limitations which introduce complexities into the technology selection process. The gap between theoretical assessments and real-world implementation poses a significant challenge, as practical considerations often deviate from idealized scenarios. Local conditions, including climate variations, geological diversity, and ecosystem intricacies, play a pivotal role, impacting the applicability and effectiveness of non-conventional water technologies in different regions.
Furthermore, the technological availability and readiness present a notable limitation (see also the TRL in Section 2, Figure 2). Not all regions may have equal access to advanced technologies, creating disparities in the feasibility and implementation of certain solutions. Additionally, the legal environment, covering, e.g., regulatory frameworks like discharge limits and policy support, can either facilitate or impede the deployment of non-conventional water technologies.
Social acceptance remains a multifaceted challenge, as community perceptions, cultural norms, and awareness influence the success of technology adoption due to the fact that a technology viewed with concern by the consumers could be rejected. Bridging the gap between innovative solutions and societal expectations requires a nuanced understanding of local contexts and effective communication strategies.
While considering the future of non-conventional water technologies, it appears that the refinement of the matrix-based assessment concept is an important starting point for research. Further development and optimization of the indicators, in consideration of emerging scientific insights and technological advancements, can enhance the accuracy and relevance of the evaluation framework for an effective decision-making progress. Robust methodologies for indicator weighting, especially taking into account regional variations and evolving environmental standards, can contribute to a more precise technology selection process.
For future research, it is necessary to carry out an examination of site-specific conditions involving diligent site assessments accounting for geological, climatic, and socio-economic factors. The nuanced intricacies of each location significantly impact the performance and viability of non-conventional water technologies. Identifying potential biases and understanding the contextual relevance of indicators within different environments is critical to achieve reliable and applicable results.
Moreover, additional research should integrate predictive modeling and artificial intelligence (AI) to forecast the long-term performance and adaptability of selected technologies under changing environmental conditions. By harnessing the power of advanced analytics, researchers can develop predictive tools that offer insights into the dynamic behavior of non-conventional water technologies over time.
Finding solutions for these specific future challenges can pave the way for a more resilient, adaptable, and sustainable approach to address water scarcity through non-conventional water technologies. In Table 17, an overview of limitations and possible solutions is shown.
Table 17.
Limitations and solutions of the matrix-based assessment.
5. Conclusions
This paper presents a comprehensive exploration of selected non-conventional water technologies, utilizing a matrix-based evaluation framework to assess their applicability using selected indicators. Some key technologies were analyzed, namely, desalination, water reuse, groundwater utilization, cloud seeding, and dew and fog water harvesting. The indicators, categorized into availability, applicability, environmental impact, scalability, and economic viability, were thoroughly examined, each receiving specific weights based on their significance and applicability to the different technologies.
Desalination has emerged as a viable option for drinking water production, but concerns are raised due to the environmental impacts, e.g., high energy consumption, the unsolved issue of appropriate brine management, options for brine treatment, and high OPEXs, particularly in regions with high electricity prices. Water reuse technologies demonstrate sufficient maturity, especially for agricultural purposes, but face challenges regarding the social acceptance of reusing water for human consumption purposes, especially in the MENA region. Groundwater usage depends on local availability and necessitates careful aquifer management to avoid over-exploitation and over-salinization risks. Cloud seeding, as well as dew and fog water technologies, show a strong dependence on region-specific site conditions like topography and meteorology, and several challenges related to the effectiveness, (partly unknown) environmental impacts, accessibility, and transportation still remain.
The matrix-based evaluation emphasizes the importance of technical indicators such as usable volume produced, water quality requirements, social acceptance, and life cycle assessment that each carrying varying weights. The economic indicators, including the CAPEX, OPEX, and profitability, have emerged as critical factors in the selection of the technology. As a result, a cost analysis of NCW water technologies was discussed to understand the influences on the profitability and local conditions.
However, the analysis presents some constrains which should not be neglected. The gap between theoretical evaluations and real-world implementation highlights the need for future research to address diverse local conditions, geological complexities, aquifer management, technological constraints, legal considerations, and social acceptance factors. The outlook for future research points toward the refinement of the evaluation framework, incorporating predictive modeling and site-specific assessments.
Overall, this paper provides an understanding of non-conventional water technologies, presenting a structured evaluation including the different capabilities of the technologies and environmental, social, and economic considerations. Various site-specific aspects have been taken into account as well. As the challenges of water scarcity are addressed, this analysis lays the groundwork for informed decision making in the selection of sustainable water solutions applicable to diverse contexts.
Funding
This research has been conducted in the framework of the EU project “Innovative Aquifers Governance for Resilient Water Management and Sustainable Ecosystems in Stressed Mediterranean Agricultural Areas” (AGREEMed). More information can be found here https://agreemed.eu/. This project is part of the PRIMA program, which is supported by the European Union. We acknowledge the support by the “Open-Access Publication Funds” of TU Berlin.
Conflicts of Interest
The authors declare no conflicts of interest, and the founders had no role in the design of the study or its results; in the collection, analyses, or interpretation of data; in the writing of the manuscript; or in the decision to publish the results.
Abbreviations
The following abbreviations are used in this manuscript:
| AR | Agricultural reuse |
| BOD | Biological oxygen demand |
| CAPEX | Capital expenditure |
| CCRO | Closed loop reverse osmosis |
| COD | Chemical oxygen demand |
| CS | Cloud seeding |
| D | Desalination |
| DW | Dew water |
| FO | Forward osmosis |
| FW | Fog water |
| G | Groundwater |
| GCC | Gulf Cooperation Countries |
| GHI | Global horizontal irradiation |
| LCA | Life cycle assessment |
| LD50 | Lethal dose 50 |
| MENA | Middle East and North Africa |
| NF | Nano-filtration |
| OPEX | Operational expenditure |
| PV | Solar photovoltaics |
| RO | Reverse osmosis |
| TDS | Total dissolved solid |
| TD50 | Toxic dose 50 |
| TRL | Technology Readiness Level |
| TSS | Total suspended solid |
| UF | Ultra-filtration |
| WR | Water reuse |
References
- Djuma, H.; Bruggeman, A.; Eliades, M.; Lange, M. Non-conventional water resources research in semi-arid countries of the Middle East. Desalin. Water Treat. 2016, 57, 2290–2303. [Google Scholar] [CrossRef]
- Hussain, M.I.; Muscolo, A.; Farooq, M.; Ahmad, W. Sustainable use and management of non-conventional water resources for rehabilitation of marginal lands in arid and semiarid environments. Agric. Water Manag. 2019, 221, 462–476. [Google Scholar] [CrossRef]
- Cipollina, A.; Micale, G.; Rizzuti, L. Seawater Desalination; Springer: Berlin/Heidelberg, Germany, 2009; ISBN 978-3-642-01149-8. [Google Scholar]
- El-Kady, M.; El-Shibini, F. Desalination in Egypt and the future application in supplementary irrigation. Desalination 2001, 136, 63–72. [Google Scholar] [CrossRef]
- Awaad, H.A.; Mansour, E.; Akrami, M.; Fath, H.E.S.; Javadi, A.A.; Negm, A. Availability and Feasibility of Water Desalination as a Non-Conventional Resource for Agricultural Irrigation in the MENA Region: A Review. Sustainability 2020, 12, 7592. [Google Scholar] [CrossRef]
- UN-Water. Analytical Brief on Unconventional Water Resources; United Nations: New York, NY, USA, 2020. [Google Scholar]
- BenJemaa, F.; Houcine, I.; Chahbani, M.H. Desalination in Tunisia: Past experience and future prospects. Desalination 1998, 116, 123–133. [Google Scholar] [CrossRef]
- Martínez-Alvarez, V.; Martin-Gorriz, B.; Soto-García, M. Seawater desalination for crop irrigation—A review of current experiences and revealed key issues. Desalination 2016, 381, 58–70. [Google Scholar] [CrossRef]
- Alfarra, A.; Kemp-Benedict, E.; Hötzl, H.; Sader, N.; Sonneveld, B. A Framework for Wastewater Reuse in Jordan: Utilizing a Modified Wastewater Reuse Index. Water Resour. Manag. 2011, 25, 1153–1167. [Google Scholar] [CrossRef]
- Siefan, A.; Rachid, E.; Elashwah, N.; AlMarzooqi, F.; Banat, F.; van der Merwe, R. Desalination via solar membrane distillation and conventional membrane distillation: Life cycle assessment case study in Jordan. Desalination 2022, 522, 115383. [Google Scholar] [CrossRef]
- Murad, A.A. An Overview of Conventional and Non-Conventional Water Resources in Arid Region: Assessment and Constrains of the United Arab Emirates (UAE). J. Water Resour. Prot. 2010, 02, 181–190. [Google Scholar] [CrossRef]
- Pereira, L.S.; Cordery, I.; Iacovides, I. Using Non-conventionalWater Resources. In Coping with Water Scarcity; Springer: Dordrecht, The Netherlands, 2009; pp. 175–220. [Google Scholar] [CrossRef]
- Beithou, N. Non-Conventional Water Resources: Review and Developments. Int. J. Res. Sci. 2020, 3, 1–8. [Google Scholar]
- Rossi, G.; Benedini, M. Water Resources of Italy; Springer International Publishing: Berlin/Heidelberg, Germany, 2020. [Google Scholar] [CrossRef]
- Darre, N.C.; Toor, G.S. Desalination of Water: A Review. Curr. Pollut. Rep. 2018, 4, 104–111. [Google Scholar] [CrossRef]
- Li, Y.; Thomas, E.R.; Molina, M.H.; Mann, S.; Walker, W.S.; Lind, M.L.; Perreault, F. Desalination by membrane pervaporation: A review. Desalination 2023, 547, 116223. [Google Scholar] [CrossRef]
- Nair, A.V.; Gude, V.G. Desalination and sustainability. In Water and Climate Change; Elsevier: Amsterdam, The Netherlands, 2022; pp. 197–213. [Google Scholar] [CrossRef]
- Mannina, G.; Gulhan, H.; Ni, B.J. Water reuse from wastewater treatment: The transition towards circular economy in the water sector. Bioresour. Technol. 2022, 363, 127951. [Google Scholar] [CrossRef] [PubMed]
- Chen, C.Y.; Wang, S.W.; Kim, H.; Pan, S.Y.; Fan, C.; Lin, Y.J. Non-conventional water reuse in agriculture: A circular water economy. Water Res. 2021, 199, 117193. [Google Scholar] [CrossRef]
- Bruintjes, R. A Review of Cloud Seeding Experiments to Enhance Precipitation and Some New Prospects. Bull. Am. Meteorol. Soc. 1999, 80, 805–820. [Google Scholar] [CrossRef]
- Malik, S.; Bano, H.; Rather, R.A.; Ahmad, S. Cloud Seeding Its Prospects and Concerns in the Modern World—A Review. Int. J. Pure Appl. Biosci. 2018, 6, 791–796. [Google Scholar] [CrossRef]
- Khalil, B.; Adamowski, J.; Shabbir, A.; Jang, C.; Rojas, M.; Reilly, K.; Ozga-Zielinski, B. A review: Dew water collection from radiative passive collectors to recent developments of active collectors. Sustain. Water Resour. Manag. 2015, 2, 71–86. [Google Scholar] [CrossRef]
- Tomaszkiewicz, M.; Najm, M.A.; Beysens, D.; Alameddine, I.; El-Fadel, M. Dew as a sustainable non-conventional water resource: A critical review. Environ. Rev. 2015, 23, 425–442. [Google Scholar] [CrossRef]
- Farnum, R. Fog harvesting. In Unconventional Water Resources; Springer: Berlin/Heidelberg, Germany, 2022; pp. 51–71. [Google Scholar]
- Karimidastenaei, Z.; Avellán, T.; Sadegh, M.; Kløve, B.; Haghighi, A.T. Unconventional water resources: Global opportunities and challenges. Sci. Total Environ. 2022, 827, 154429. [Google Scholar] [CrossRef]
- Rossi, G.; Cirelli, G.L. Assessment of Non-Conventional Water Resources; World Water Resources; Springer International Publishing: Cham, Switzerland, 2020; pp. 125–141. [Google Scholar] [CrossRef]
- Salgot, M.; Tapias, J. Non-conventional water resources in coastal areas: A review on the use of reclaimed water. Geol. Acta 2004, 2, 121–133. [Google Scholar]
- Li, J.; Song, S.; Ayantobo, O.O.; Wang, H.; Jiaping, L.; Zhang, B. Coordinated allocation of conventional and unconventional water resources considering uncertainty and different stakeholders. J. Hydrol. 2022, 605, 127293. [Google Scholar] [CrossRef]
- Fries, E.; Mahjoub, O.; Mahjoub, B.; Berrehouc, A.; Lions, J.; Bahadir, M. Occurrence of contaminants of emerging concern (CEC) in conventional and non-conventional water resources in Tunisia. Fresenius Environ. Bull. 2018, 25, 3317–3339. [Google Scholar]
- Ezzat, S.M.; Elkorashey, R.M. Wastewater as a Non-conventional Resource: Impact of Trace Metals and Bacteria on Soil, Plants, and Human Health. Hum. Ecol. Risk Assess. Int. J. 2020, 26, 2245–2265. [Google Scholar] [CrossRef]
- Khan, Z.I.; Hussain, M.I.; Zafar, A.; Ahmad, K.; Ashraf, M.A.; Ahmed, M.; ALrashidi, A.A.; Al Haithloul, H.A.S.; Alghanem, S.M.; Khan, M.I.; et al. Ecological risk assessment and bioaccumulation of trace element, copper, in wheat varieties irrigated with non-conventional water resources in a semi-arid tropics. Agric. Water Manag. 2022, 269, 107711. [Google Scholar] [CrossRef]
- Khan, M.M.; Al-Haddabi, M.H.; Akram, M.T.; Khan, M.A.; Farooque, A.A.; Siddiqi, S.A. Assessment of Non-Conventional Irrigation Water in Greenhouse Cucumber (Cucumis sativus) Production. Sustainability 2022, 14, 257. [Google Scholar] [CrossRef]
- Mendoza, I.C.; Luna, E.O.; Pozo, M.D.; Vásquez, M.V.; Montoya, D.C.; Moran, G.C.; Romero, L.G.; Yépez, X.; Salazar, R.; Romero-Peña, M.; et al. Conventional and non-conventional disinfection methods to prevent microbial contamination in minimally processed fruits and vegetables. LWT 2022, 165, 113714. [Google Scholar] [CrossRef]
- Daghari, O.K.O. Réutilisation des eaux usées épurées dans le secteur agricole en Tunisie: Situation actuelle et perspectives. Medit 1992, 3, 55–58. [Google Scholar]
- Yazdandoost, F.; Noruzi, M.M.; Yazdani, S.A. Sustainability assessment approaches based on water-energy Nexus: Fictions and nonfictions about non-conventional water resources. Sci. Total Environ. 2021, 758, 143703. [Google Scholar] [CrossRef]
- Salcedo, F.P.; Cutillas, P.P.; Aziz, F.; Escabias, M.L.; Boesveld, H.; Bartholomeus, H.; Tallou, A. Soil Salinity Prediction Using Remotely Piloted Aircraft Systems under Semi-Arid Environments Irrigated with Salty Non-Conventional Water Resources. Agronomy 2022, 12, 2022. [Google Scholar] [CrossRef]
- Mualla, W. Water Demand Management is a Must in MENA Countries … But Is It Enough? WSTA 12th Gulf Water 2017, 39–45. [Google Scholar]
- Sayed, E.T.; Olabi, A.; Elsaid, K.; Radi, M.A.; Alqadi, R.; Abdelkareem, M.A. Recent progress in renewable energy based-desalination in the Middle East and North Africa MENA region. J. Adv. Res. 2022, 48, 125–156. [Google Scholar] [CrossRef] [PubMed]
- Antonakopoulou, M.; Toli, K.; Constantianos, V.; Scoullos, M. The Non-Conventional Water Resources (NCWR) Programme in North Mediterranean. Eur. Water 2017, 60, 387–394. [Google Scholar]
- Saurí, D.; Garcia, X. Non-conventional resources for the coming drought: The development of rainwater harvesting systems in a Mediterranean suburban area. Water Int. 2020, 45, 125–141. [Google Scholar] [CrossRef]
- Shahrim, N.A.; Abounahia, N.M.; El-Sayed, A.M.A.; Saleem, H.; Zaidi, S.J. An overview on the progress in produced water desalination by membrane-based technology. J. Water Process Eng. 2023, 51, 103479. [Google Scholar] [CrossRef]
- Yousef, M.S.; Hassan, H. Solar desalination with energy storage. In Energy Storage for Multigeneration; Elsevier: Amsterdam, The Netherlands, 2023; pp. 221–249. [Google Scholar] [CrossRef]
- Bhagwati, A.; Shah, M.; Prajapati, M. Emerging Technologies to Sustainability: A comprehensive Study on Solar Desalination for Sustainable Development. Sustain. Manuf. Serv. Econ. 2023, 2, 100007. [Google Scholar] [CrossRef]
- Qiblawey, H.M.; Banat, F. Solar thermal desalination technologies. Desalination 2008, 220, 633–644. [Google Scholar] [CrossRef]
- Bourouni, K.; Chaibi, M. Solar Energy For Application To Desalination In Tunisia: Description of A Demonstration Project. In Renewable Energy in the Middle East; Springer: Dordrecht, The Netherlands, 2009; pp. 125–149. [Google Scholar] [CrossRef]
- Kalogirou, S. Survey of solar desalination systems and system selection. Energy 1997, 22, 69–81. [Google Scholar] [CrossRef]
- Lienhard, J.; Antar, M.A.; Bilton, A.; Blanco, J.; Zaragoza, G. Solar Desalination. Annu. Rev. Heat Transf. 2012, 15, 277–347. [Google Scholar] [CrossRef]
- Kapoor, V.; Rufuss, D.D.W.; Arulvel, S.; Akinaga, T.; Davies, P. Nanoparticles-enhanced energy storage materials in solar thermal desalination. In Energy Storage for Multigeneration; Elsevier: Amsterdam, The Netherlands, 2023; pp. 197–220. [Google Scholar] [CrossRef]
- Nasrollahi, M.; Motevali, A.; Banakar, A.; Montazeri, M. Comparison of environmental impact on various desalination technologies. Desalination 2023, 547, 116253. [Google Scholar] [CrossRef]
- Abba, S.; Benaafi, M.; Aljundi, I.H. Intelligent process optimisation based on cutting-edge emotional learning for performance evaluation of NF/RO of seawater desalination plant. Desalination 2023, 550, 116376. [Google Scholar] [CrossRef]
- Pazouki, P.; Sidhu, J.; Ipe, D.; Pype, M.; Wohlsen, T.; Helfer, F.; Bertone, E.; Stewart, R. Seawater dilution desalination with hybrid FO-RO and UF-RO: Characterisation and assessment of pathogen removal efficacy. Desalination 2022, 525, 115509. [Google Scholar] [CrossRef]
- Krantz, W.B.; Chong, T.H. Centrifugal reverse osmosis (CRO)—A novel energy-efficient membrane process for desalination near local thermodynamic equilibrium. J. Membr. Sci. 2021, 637, 119630. [Google Scholar] [CrossRef]
- Elazhar, F.; Elazhar, M.; Filali, N.E.; Belhamidi, S.; Elmidaoui, A.; Taky, M. Potential of hybrid NF-RO system to enhance chloride removal and reduce membrane fouling during surface water desalination. Sep. Purif. Technol. 2021, 261, 118299. [Google Scholar] [CrossRef]
- Hacıfazlıoğlu, M.; Tomasini, H.; Bertin, L.; Pek, T.; Kabay, N. Concentrate reduction in NF and RO desalination systems by membrane-in-series configurations-evaluation of product water for reuse in irrigation. Desalination 2019, 466, 89–96. [Google Scholar] [CrossRef]
- Gu, H.; Plumlee, M.H.; Boyd, M.; Hwang, M.; Lozier, J.C. Operational optimization of closed-circuit reverse osmosis (CCRO) pilot to recover concentrate at an advanced water purification facility for potable reuse. Desalination 2021, 518, 115300. [Google Scholar] [CrossRef]
- Futterlieb, M.; Panglisch, S. CCRO als innovative Betriebsweise der Umkehrosmose. Wasserwirtsch. Wassertech. 2020, 2020, 27–29. [Google Scholar]
- Nayar, K.G.; V, J.H.L. Brackish water desalination for greenhouse agriculture: Comparing the costs of RO, CCRO, EDR, and monovalent-selective EDR. Desalination 2020, 475, 114188. [Google Scholar] [CrossRef]
- Tahboub, A. Impact of Global Warming on Groundwater Water Resources of Jordan. Biosci. Biotechnol. Res. Asia 2015, 12, 2201–2207. [Google Scholar] [CrossRef]
- Østergaard, P.A.; Lund, H.; Mathiesen, B.V. Energy system impacts of desalination in Jordan. Int. J. Sustain. Energy Plan. Manag. 2014, 1, 29–40. [Google Scholar]
- Abu-Sharar, T.M.; Hussein, I.A.; Al-Jayyousi, O.R. The use of treated sewage for irrigation in Jordan: Opportunities and constraints. Water Environ. J. 2003, 17, 232–238. [Google Scholar] [CrossRef]
- Ammary, B.Y. Wastewater reuse in Jordan: Present status and future plans. Desalination 2007, 211, 164–176. [Google Scholar] [CrossRef]
- Banat, F.; Jwaied, N.; Rommel, M.; Koschikowski, J.; Wieghaus, M. Performance evaluation of the “large SMADES” autonomous desalination solar-driven membrane distillation plant in Aqaba, Jordan. Desalination 2007, 217, 17–28. [Google Scholar] [CrossRef]
- Olwig, R.; Hirsch, T.; Sattler, C.; Glade, H.; Schmeken, L.; Will, S.; Ghermandi, A.; Messalem, R. Techno-economic analysis of combined concentrating solar power and desalination plant configurations in Israel and Jordan. Desalin. Water Treat. 2012, 41, 9–25. [Google Scholar] [CrossRef]
- Bakr, N.; Bahnassy, M.H. Egyptian Natural Resources; World Soils Book Series; Springer International Publishing: Cham, Switzerland, 2019; pp. 33–49. [Google Scholar] [CrossRef]
- Batisha, A.F. Greywater in Egypt: The sustainable future of non-conventional water resources. Environ. Sci. Pollut. Res. 2020, 27, 35428–35438. [Google Scholar] [CrossRef]
- Hamdy, A.; El Gamal, F.; Lamaddalena, N.; Bogliotti, C.; Gelloubi, H.E. Reuse of low quality water in Egypt. In Non-Conventional Water Use: WASAMED Project; CIHEAM Montpellier: Montpellier, France, 2005. [Google Scholar]
- El-Bahrawy, E.G.H. Assessment of water reuse as a non-conventional water resource in Egypt case study: Gharbia drain, Nile delta. In Proceedings of the 13th International Water Technology Conference, Hurghada, Egypt, 12–15 March 2009. [Google Scholar]
- Barnes, J. Mixing waters: The reuse of agricultural drainage water in Egypt. Geoforum 2014, 57, 181–191. [Google Scholar] [CrossRef]
- Khairy, S.; Shaban, M.; Negm, A.; Eldeen, O.; Ramadan, E.M. Drainage water reuse strategies: Case of El-Bats drain, Fayoum Governorate, Egypt. Ain Shams Eng. J. 2022, 13, 101681. [Google Scholar] [CrossRef]
- Gado, T.A.; El-Agha, D.E. Feasibility of rainwater harvesting for sustainable water management in urban areas of Egypt. Environ. Sci. Pollut. Res. 2020, 27, 32304–32317. [Google Scholar] [CrossRef]
- Omran, E.S.E. Cloud-Based Non-Conventional Land and Water Resources for Sustainable Development in Sinai Peninsula, Egypt; The Handbook of Environmental Chemistry; Springer International Publishing: Cham, Switzerland, 2019; pp. 339–374. [Google Scholar] [CrossRef]
- Rayan, M.A.; Djebedjian, B.; Khaled, I. Water supply and demand and a desalination option for Sinai, Egypt. Desalination 2001, 136, 73–81. [Google Scholar] [CrossRef]
- Abdelzaher, M.A.; Awad, M.M. Sustainable Development Goals for the Circular Economy and the Water-Food Nexus: Full Implementation of New Drip Irrigation Technologies in Upper Egypt. Sustainability 2022, 14, 13883. [Google Scholar] [CrossRef]
- El-Sadek, A. Water desalination: An imperative measure for water security in Egypt. Desalination 2010, 250, 876–884. [Google Scholar] [CrossRef]
- Horchani, A. Water in Tunisia: A national perspective. In Agricultural Water Management: Proceedings of a Workshop in Tunisia; National Academies Press: Washington, DC, USA, 2007. [Google Scholar]
- Jaouen, W.A.Q. Déminéralisation Des Eaux Saumatres Du Sud Tunisienpar éLectrodialyse Ou Par Osmose Inverse. J. Société Chim. Tunis. 2007, 9, 133–142. [Google Scholar]
- Fethi, K.; Habib, C. Performances de la Station de Dessalement de Gabès (22,500 m3/j) apres cinq ans de fonctionnement. Desalination 2001, 136, 263–272. [Google Scholar] [CrossRef]
- Chekir, N.; Hassen, D. Tunisian Geothermal Potential for Desalination. In Advances in Science, Technology and Innovation; Springer International Publishing: Berlin/Heidelberg, Germany, 2022; pp. 237–240. [Google Scholar] [CrossRef]
- Roboam, T.B. Analyse des performances d’un processus de dessalement par« osmose inverse » alimenté par un système hybride (PV-Eolien) sans stockage électrochimique. In Proceedings of the 1st Maghreb Conference on Desalination and Water Treatment (CMTDE), Hammamet, Tunisia, 7–10 December 2007. [Google Scholar]
- Ennouhi, M.; Aggadi, S.E.; Ennouari, A.; Hasnaoui, L.; Elhourch, A. Desalination process and perspectives in Morocco. Desalin. Water Treat. 2022, 257, 110–116. [Google Scholar] [CrossRef]
- Charitar, D.; Madhlopa, A. Integration of waste heat in thermal desalination technologies: A review. J. Energy S. Afr. 2022, 33, 68–84. [Google Scholar] [CrossRef]
- Navarro, T. Water reuse and desalination in Spain—Challenges and opportunities. J. Water Reuse Desalin. 2018, 8, 153–168. [Google Scholar] [CrossRef]
- Bosela, R.; Eissa, M.; Stash, O.S.; Ali, M.E.; Shawky, H.A.; Soliman, E.A. Potential aquifer mapping for cost-effective groundwater reverse osmosis desalination in arid regions using integration of hydrochemistry, environmental isotopes and GIS techniques. Groundw. Sustain. Dev. 2022, 19, 100853. [Google Scholar] [CrossRef]
- Custodio, E.; Albiac, J.; Cermeron, M.; Hernandez, M.; Llamas, M.R.; Sahuquillo, A. Groundwater mining: Benefits, problems and consequences in Spain. Sustain. Water Resour. Manag. 2017, 3, 213–226. [Google Scholar] [CrossRef]
- Gale, I.; Neumann, I.; Calow, R.; Moench, M. The Effectiveness of Artificial Recharge of Groundwater: A Review; British Geological Survey: Nottingham, UK, 2002. [Google Scholar]
- Amali, A.A.; Mersha, A.N.; Nofal, E.R.; Murray, K.; Norouzi, S.; Saboory, S.; Salo, H.; Chevuru, S.R.; Sarai Tabrizi, M.; Reddy, P.K.; et al. Non-conventional sources of agricultural water management: Insights from young professionals in the irrigation and drainage sector*. Irrig. Drain. 2021, 70, 524–540. [Google Scholar] [CrossRef]
- Riaz, F.; Riaz, M.; Arif, M.S.; Yasmeen, T.; Ashraf, M.A.; Adil, M.; Ali, S.; Mahmood, R.; Rizwan, M.; Hussain, Q.; et al. Alternative and Non-conventional Soil and Crop Management Strategies for Increasing Water Use Efficiency; Springer International Publishing: Cham, Switzerland, 2020; pp. 323–338. [Google Scholar] [CrossRef]
- Tomaszkiewicz, M.; Abou Najm, M.; Zurayk, R.; El-Fadel, M. Dew as an adaptation measure to meet water demand in agriculture and reforestation. Agric. For. Meteorol. 2017, 232, 411–421. [Google Scholar] [CrossRef]
- Smedley. How to Drink from the Enormous Lakes in the Air. 2018. Available online: https://marvelsandcatastrophes.com/2018/09/08/bbc-how-to-drink-from-enormous-lakes-in-the-air/ (accessed on 11 March 2025).
- Toutonghi, P. Could Harvesting Fog Help Solve the World’s Water Crisis? 2016. Available online: https://www.newyorker.com/tech/annals-of-technology/could-harvesting-fog-help-solve-the-worlds-water-crisis (accessed on 11 March 2025).
- Mankins, J.C. Technology Readiness Levels; Advanced Concepts Office, Office of Space Access and Technology NASA: Washington, DC, USA, 1995. [Google Scholar]
- Bjerke, M.B.; Renger, R. Being smart about writing SMART objectives. Eval. Program Plan. 2017, 61, 125–127. [Google Scholar] [CrossRef]
- Shahin, A.; Mahbod, M.A. Prioritization of key performance indicators: An integration of analytical hierarchy process and goal setting. Int. J. Product. Perform. Manag. 2007, 56, 226–240. [Google Scholar] [CrossRef]
- WHO. Guidelines for Drinking-Water Quality: Fourth Edition Incorporating the First and Second Addenda; WHO: Geneva, Switzerland, 2022. [Google Scholar]
- Smith, K.; Liu, S.; Hu, H.Y.; Dong, X.; Wen, X. Water and energy recovery: The future of wastewater in China. Sci. Total Environ. 2018, 637–638, 1466–1470. [Google Scholar] [CrossRef] [PubMed]
- Bahadir, H.M.M.B. Les Hydrocarbures Aromatiques Polycycliques Dans Les Eaux Conventionnelles Et Non Conventionnelles Destinees A L’Irrigation En Tunisie. Larhyss J. 2016, 29, 227–247. [Google Scholar]
- Ziolkowska, J.R. Is Desalination Affordable?—Regional Cost and Price Analysis. Water Resour. Manag. 2014, 29, 1385–1397. [Google Scholar] [CrossRef]
- Miller, J. Review of Water Resources and Desalination Technologies; Sandia National Laboratories: Livermore, CA, USA, 2003. [Google Scholar] [CrossRef]
- National Research Council. Water Reuse: Potential for Expanding the Nation’s Water Supply Through Reuse of Municipal Wastewater; The National Academies Press: Washington, DC, USA, 2012. [Google Scholar] [CrossRef]
- Chen, R.; Wang, X.C. Cost–benefit evaluation of a decentralized water system for wastewater reuse and environmental protection. Water Sci. Technol. 2009, 59, 1515–1522. [Google Scholar] [CrossRef]
- Molinos-Senante, M.; Hernández-Sancho, F.; Sala-Garrido, R. Cost–benefit analysis of water-reuse projects for environmental purposes: A case study for Spanish wastewater treatment plants. J. Environ. Manag. 2011, 92, 3091–3097. [Google Scholar] [CrossRef]
- Nagkoulis, N. Reducing Groundwater Pumping Cost Using Alternate Pulsed Pumping. Groundwater 2020, 59, 410–416. [Google Scholar] [CrossRef]
- Strand, J. The Full Economic Costof Groundwater Extraction; The World Bank Development Research Group, Environment and Energy Team: Washington, DC, USA, 2010. [Google Scholar]
- Tran, Q.K.; Schwabe, K.A.; Jassby, D. Wastewater Reuse for Agriculture: Development of a Regional Water Reuse Decision-Support Model (RWRM) for Cost-Effective Irrigation Sources. Environ. Sci. Technol. 2016, 50, 9390–9399. [Google Scholar] [CrossRef]
- Hegar, G. Texas Water Tour: Cloud Seeding. 2022. Available online: https://comptroller.texas.gov/economy/economic-data/water/2022/seeding.php (accessed on 11 March 2025).
- Akvopedia. Fog Collection and Storage. 2016. Available online: https://www.akvopedia.org/wiki/Water_Portal_/_Rainwater_Harvesting_/_Fog_and_dew_collection_/_Fog_collection_and_storage (accessed on 11 March 2025).
- Domen, J.K.; Stringfellow, W.T.; Camarillo, M.K.; Gulati, S. Fog water as an alternative and sustainable water resource. Clean Technol. Environ. Policy 2013, 16, 235–249. [Google Scholar] [CrossRef]
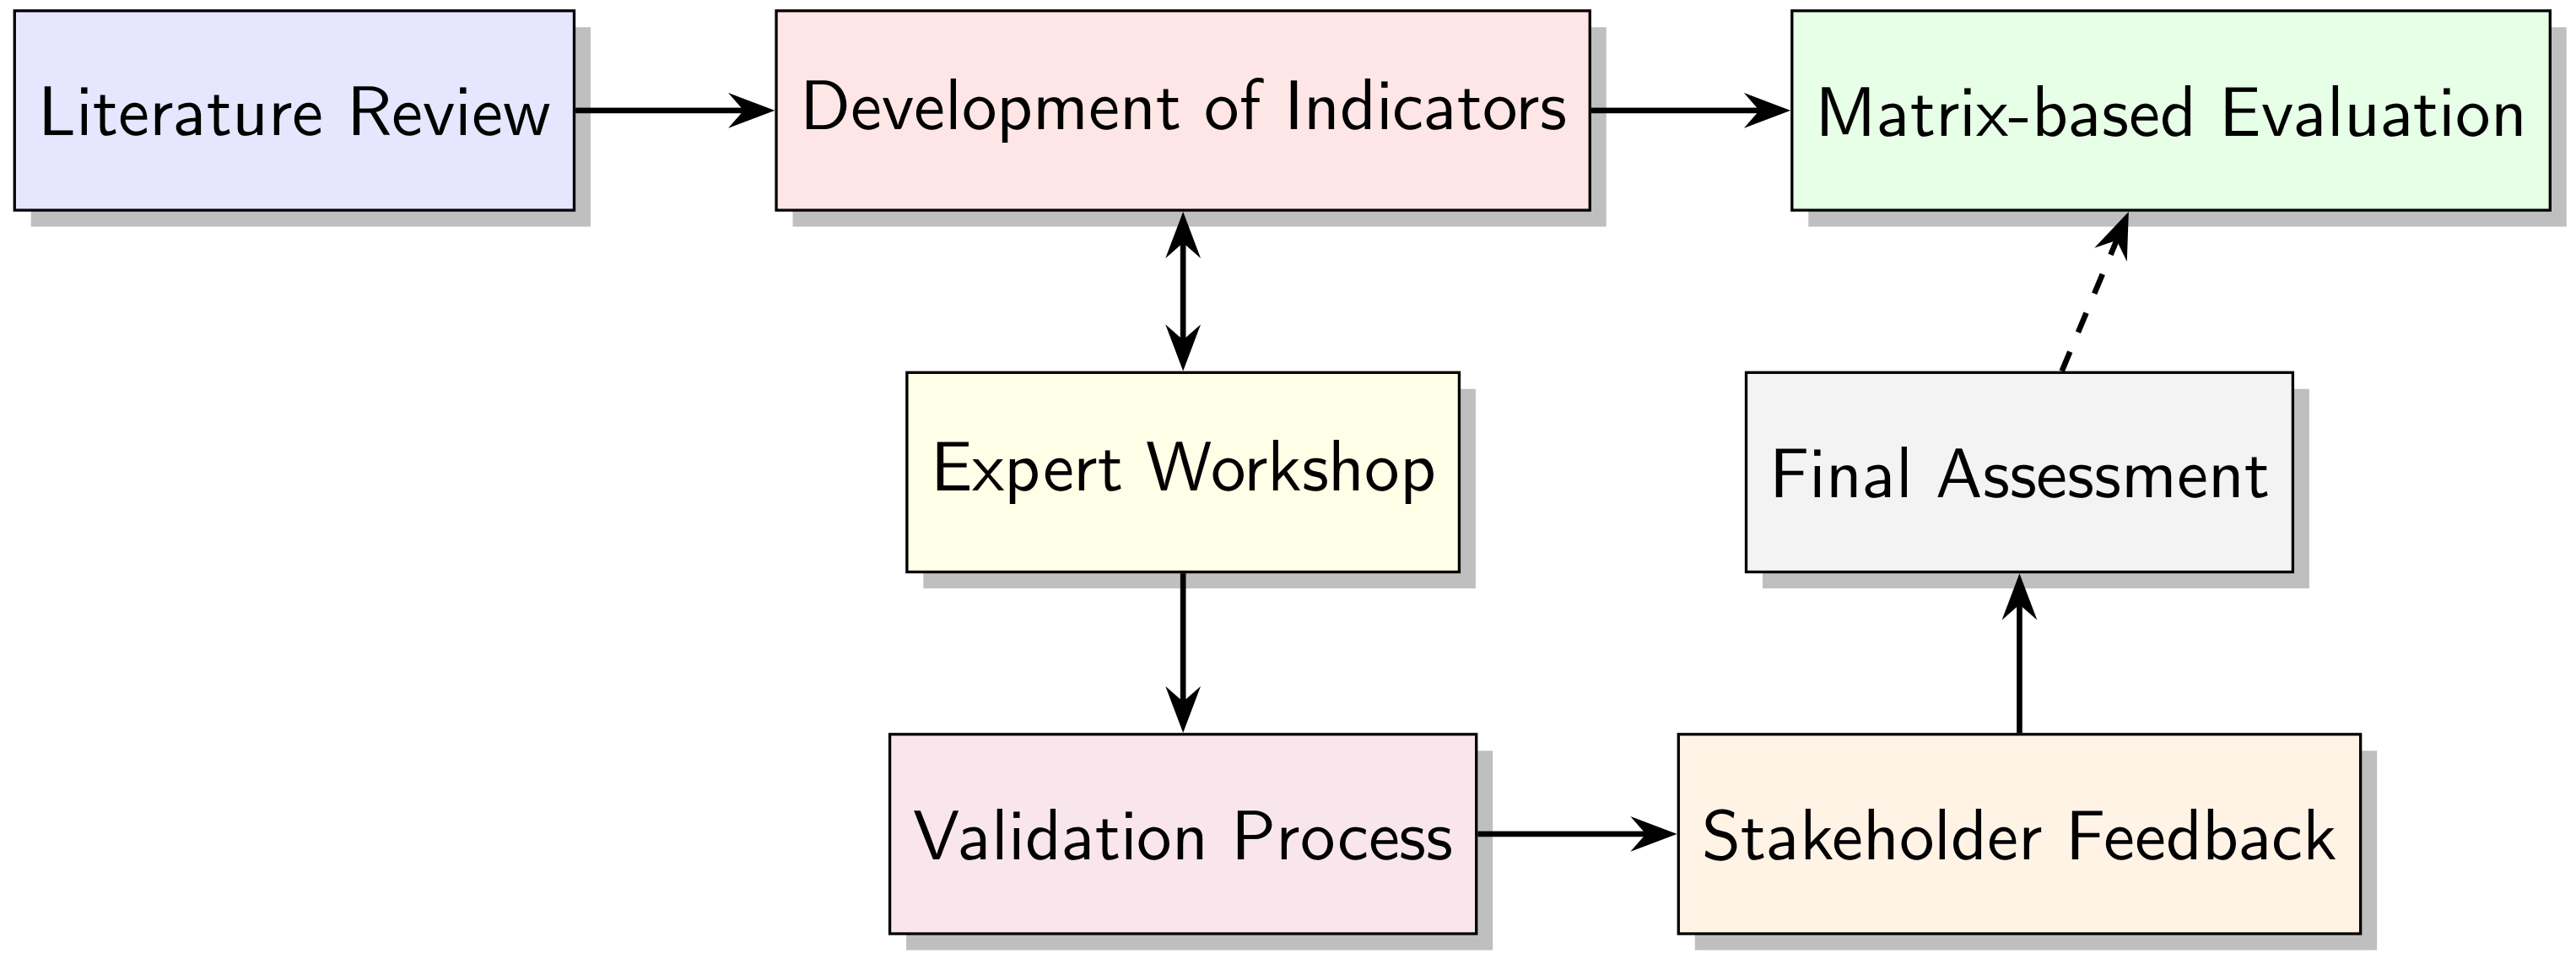
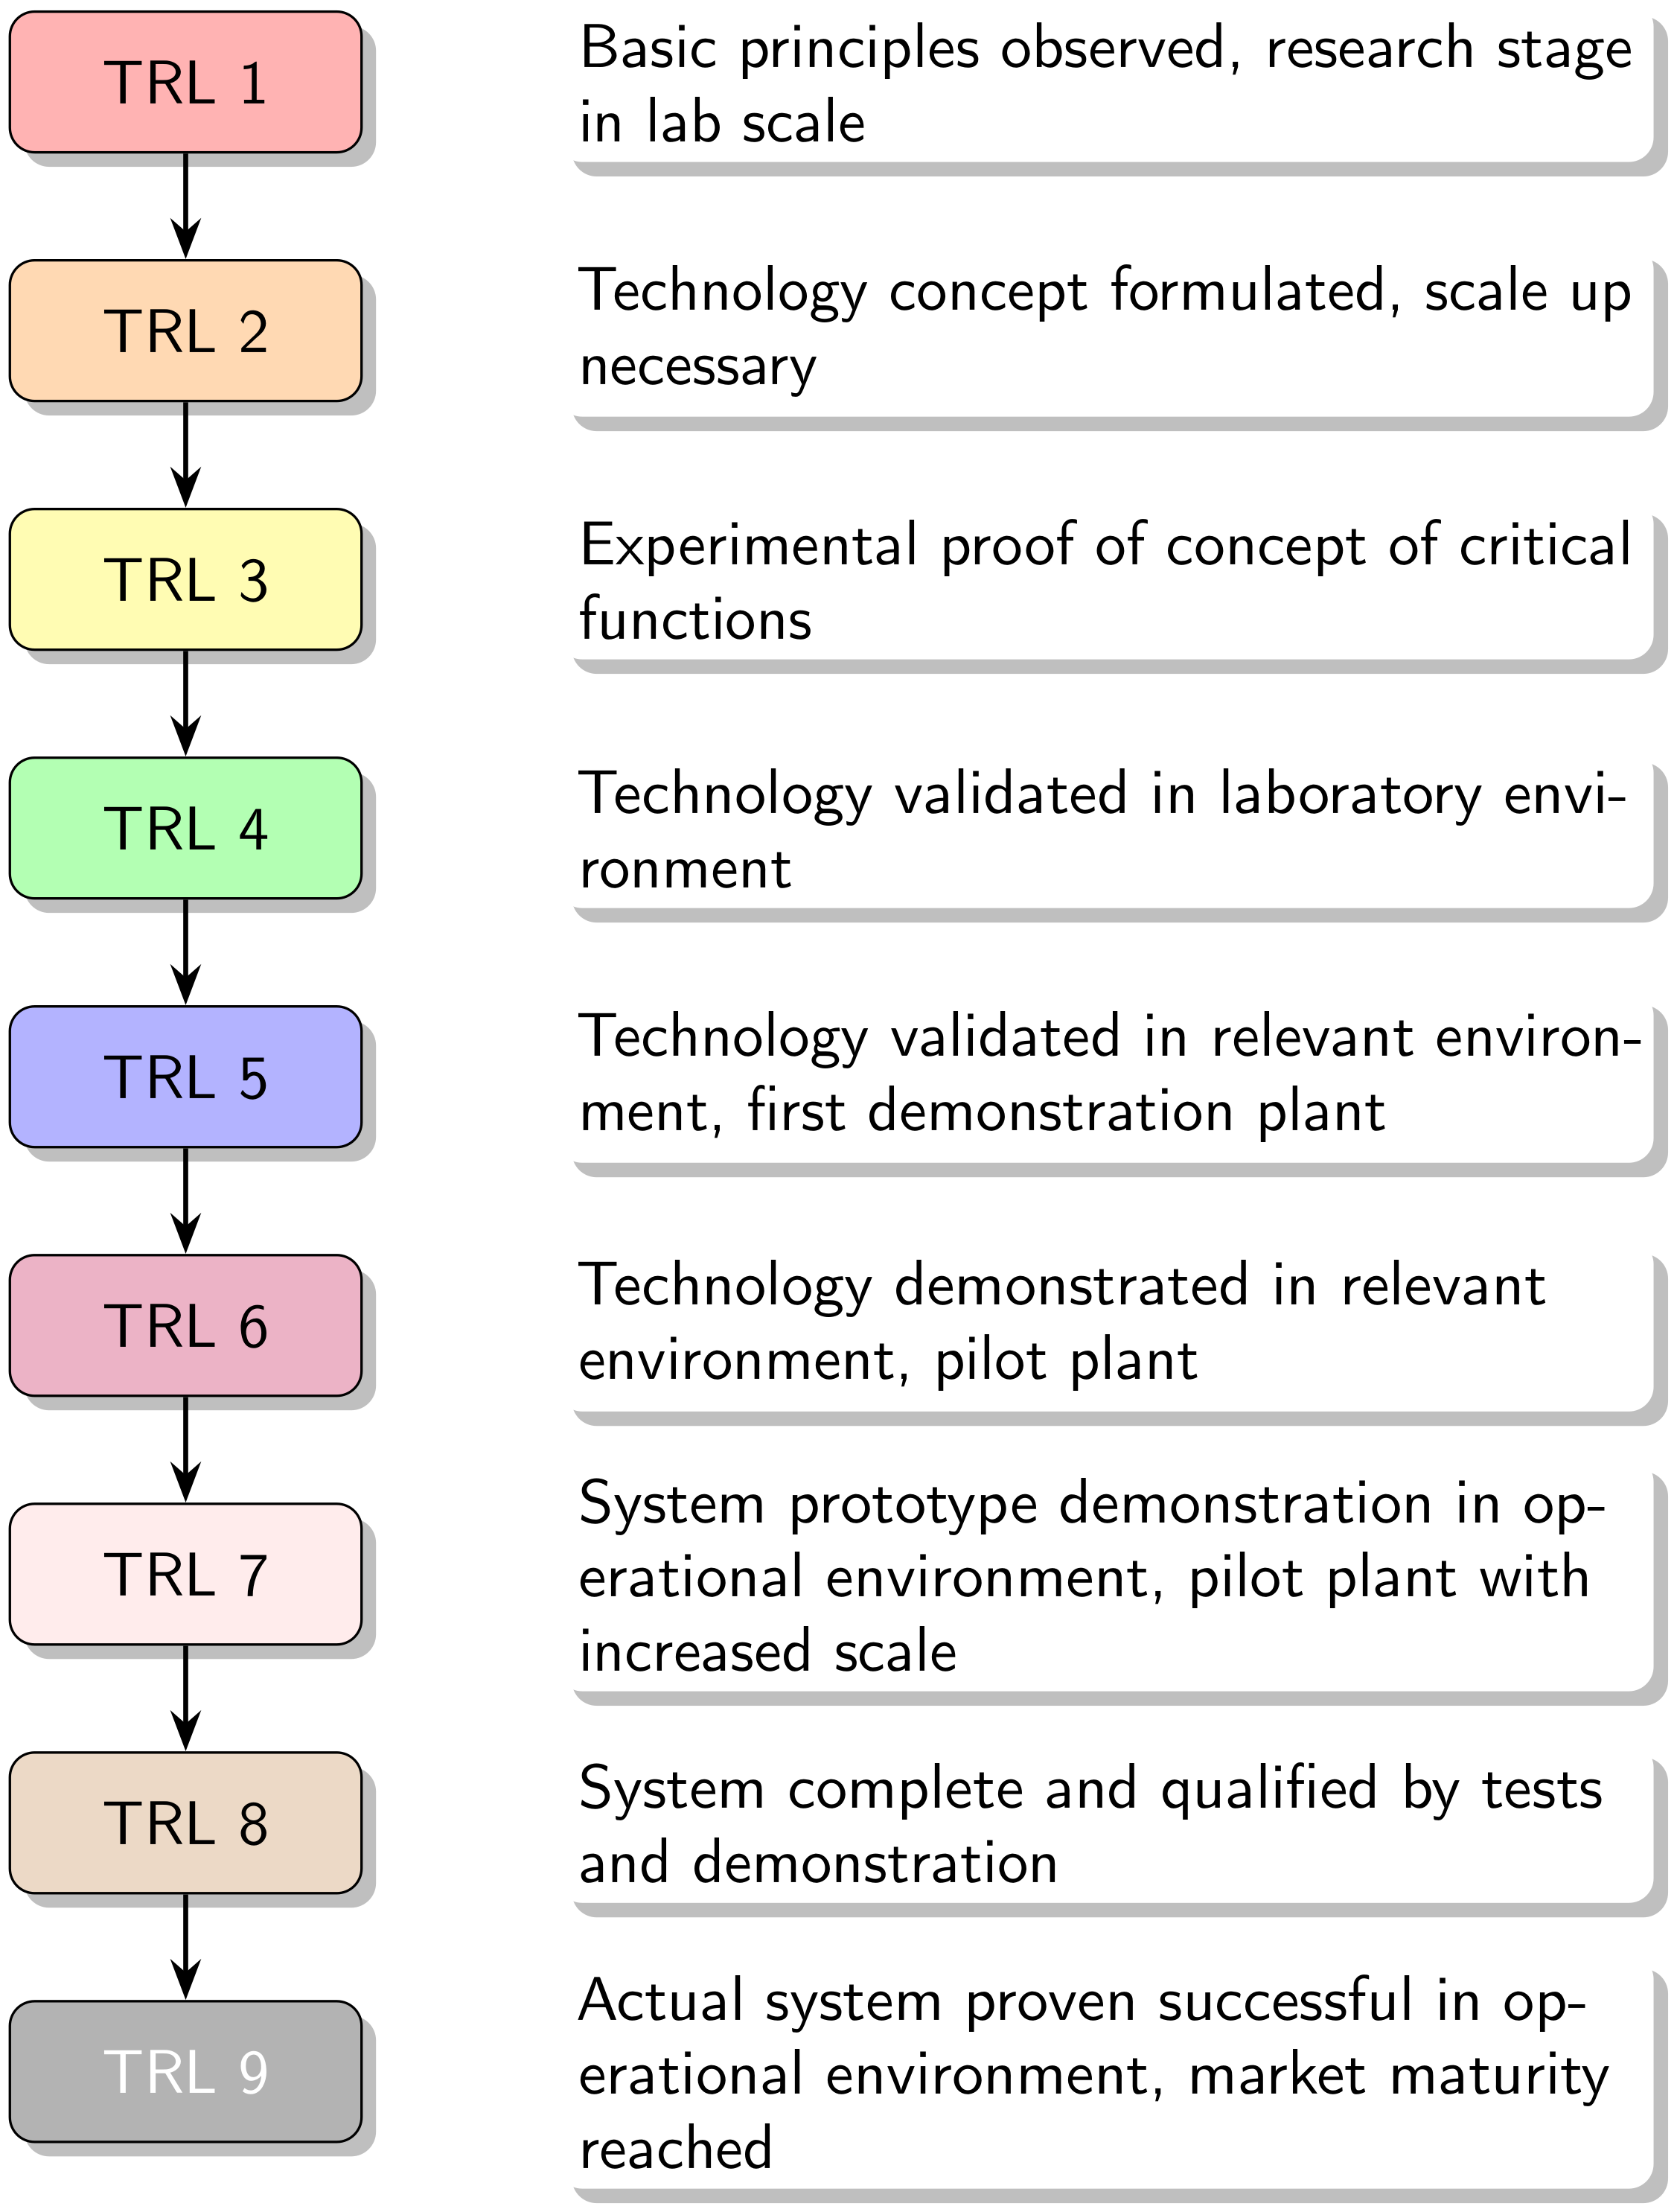
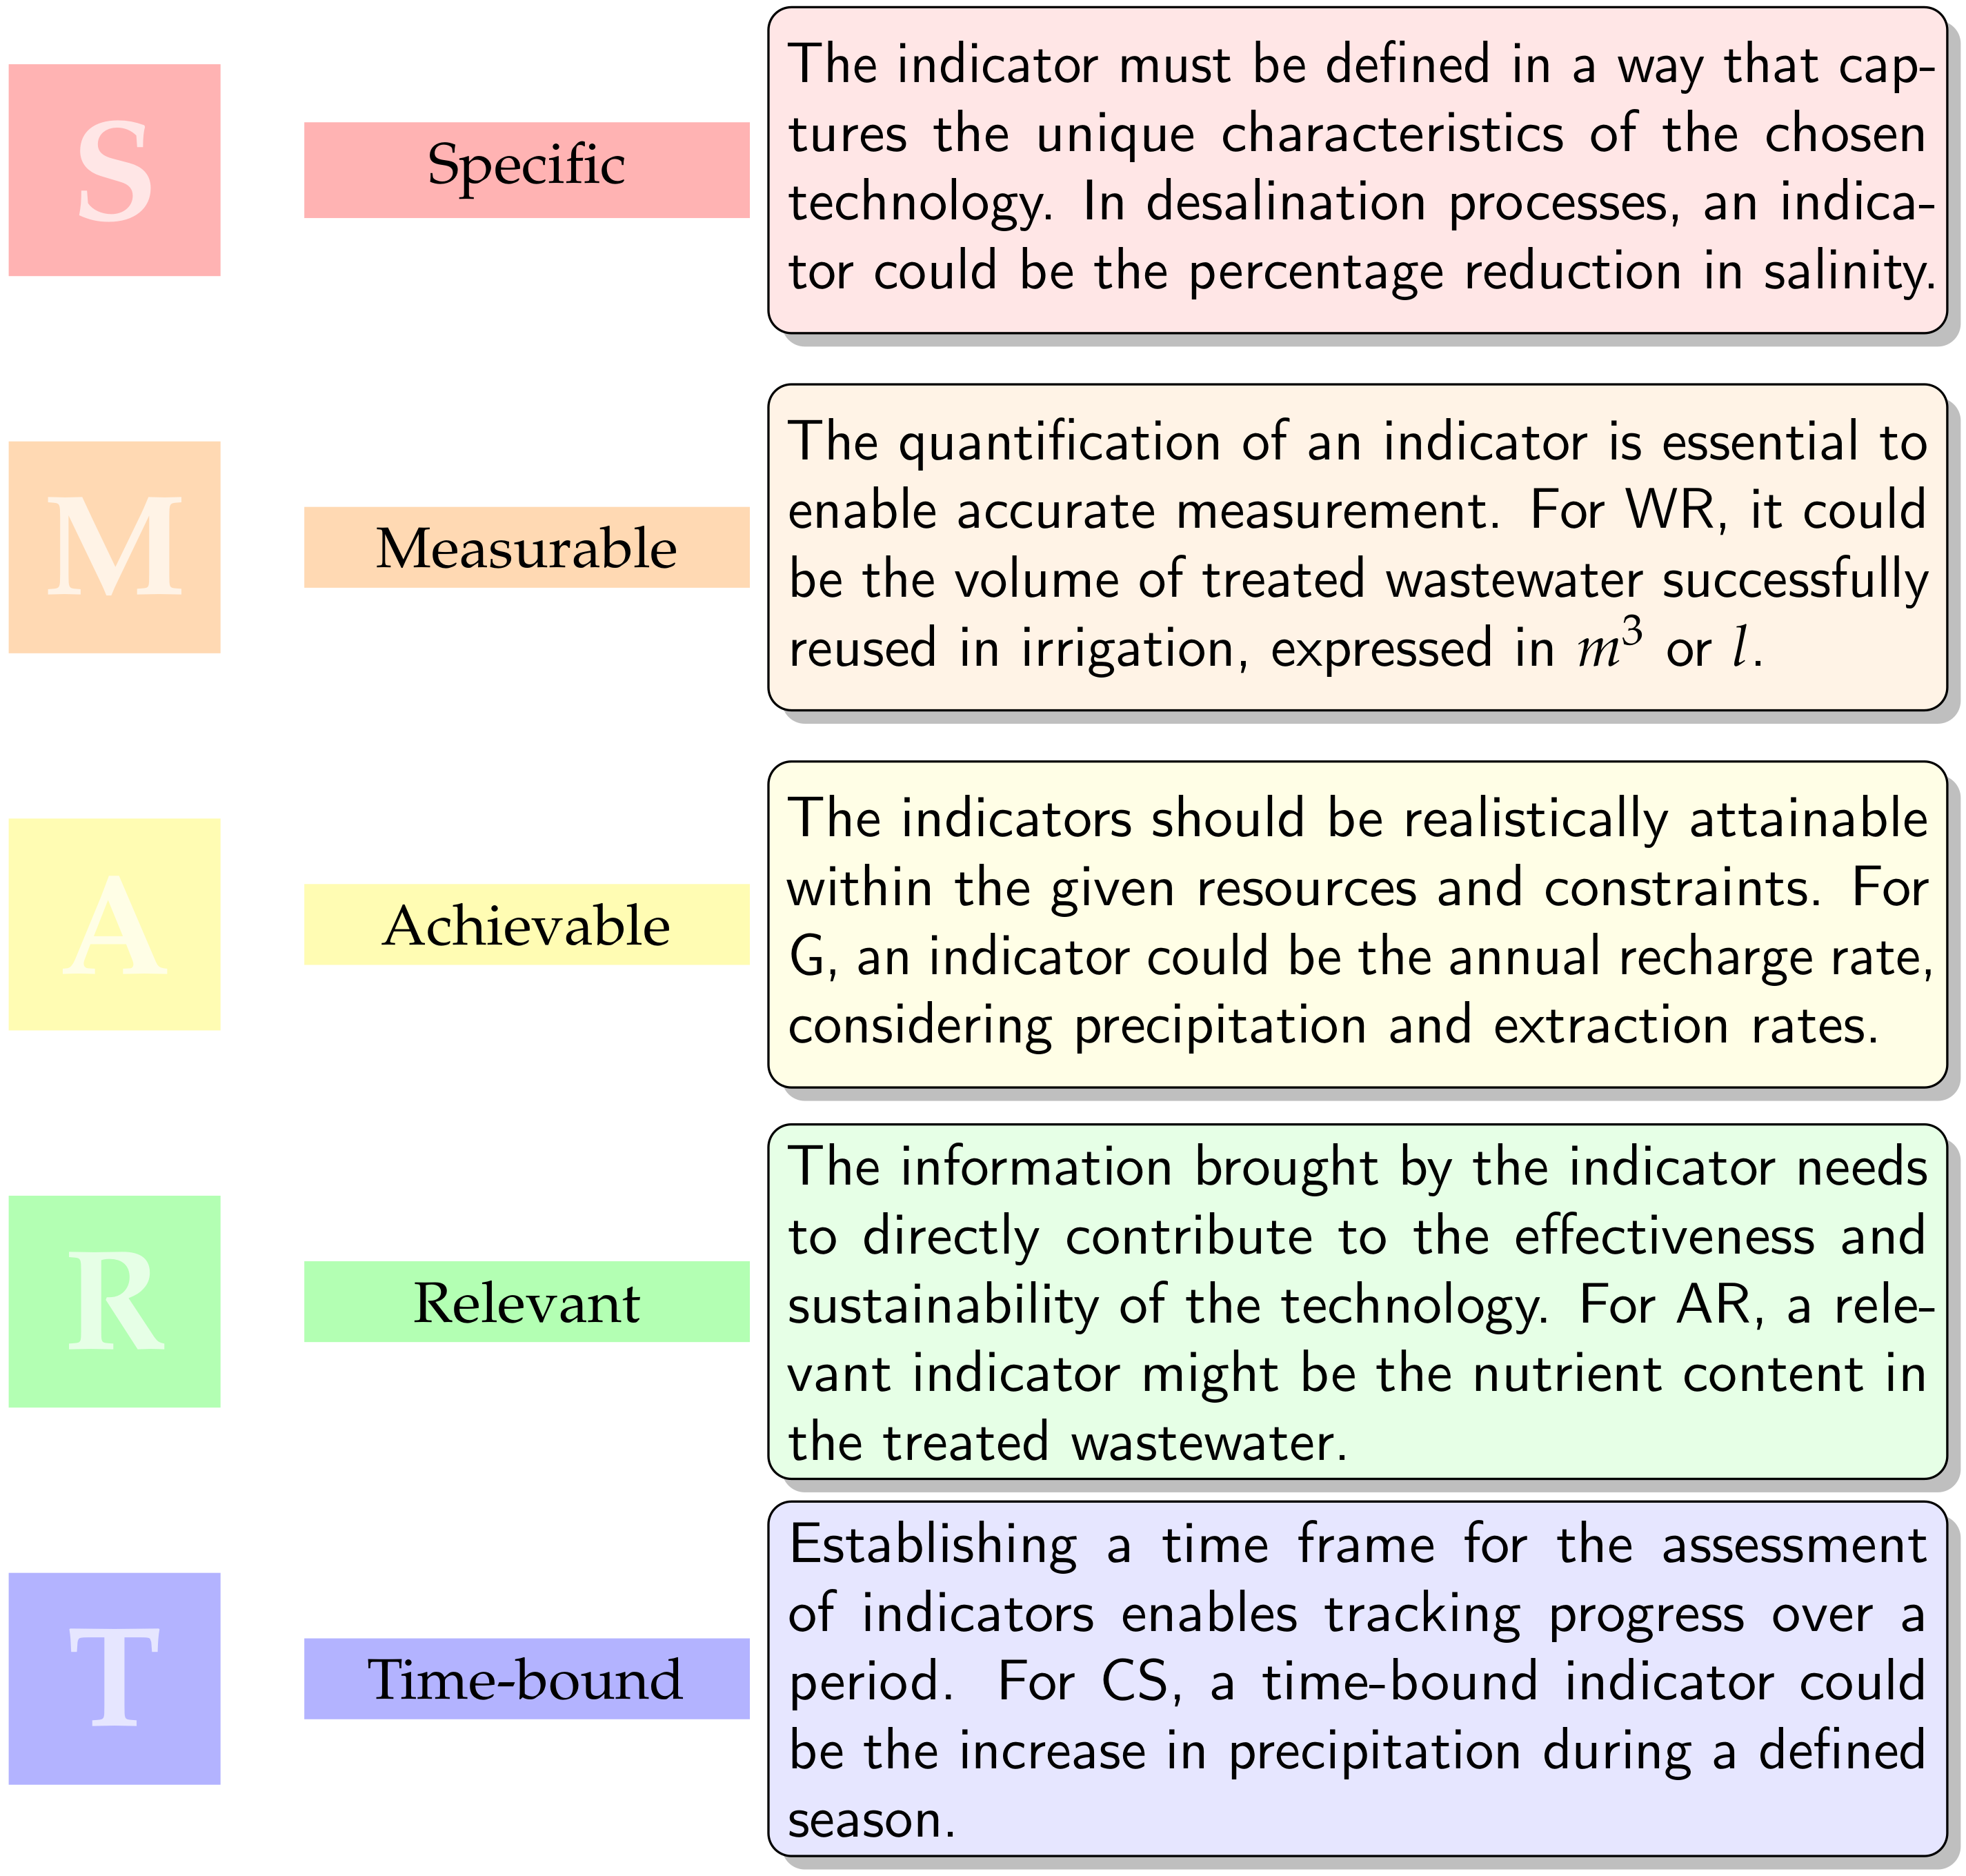
Disclaimer/Publisher’s Note: The statements, opinions and data contained in all publications are solely those of the individual author(s) and contributor(s) and not of MDPI and/or the editor(s). MDPI and/or the editor(s) disclaim responsibility for any injury to people or property resulting from any ideas, methods, instructions or products referred to in the content. |
© 2025 by the authors. Licensee MDPI, Basel, Switzerland. This article is an open access article distributed under the terms and conditions of the Creative Commons Attribution (CC BY) license (https://creativecommons.org/licenses/by/4.0/).