Article

Performance and Mechanism of a Novel Composite Ecological Ditch System for Nitrogen and Phosphorus Interception in Agricultural Drainage

1
College of Natural Resources and Environment, South China Agricultural University, Guangzhou 510642, China
2
Agricultural Environment and Plant Protection General Station of Guangzhou, Guangzhou 510405, China
3
Key Laboratory of Arable Land Conservation (South China), Ministry of Agriculture and Rural Affairs (MOA), College of Natural Resources and Environment, South China Agricultural University, Guangzhou 510642, China
4
Guangdong Province Key Laboratory for Land Use and Consolidation, College of Natural Resources and Environment, South China Agricultural University, Guangzhou 510642, China
*
Author to whom correspondence should be addressed.
Water 2025, 17(6), 882; https://doi.org/10.3390/w17060882
Submission received: 24 January 2025 / Revised: 6 March 2025 / Accepted: 15 March 2025 / Published: 19 March 2025

Abstract

:
The massive loss of nitrogen (N) and phosphorus (P) from farmland ditches contributes to non-point source pollution, posing a significant global environmental challenge. Effectively removing these nutrients remains difficult in intensive agricultural systems. To address this, a novel composite ecological ditch system (CEDS) was developed by modifying traditional drainage ditches to integrate a grit chamber, zeolite, and ecological floating beds. Dynamic monitoring of N and P levels in water, plants, and zeolite was conducted to evaluate the system’s nutrient interception performance and mechanisms. The results showed the following: (1) Water quality improved markedly after passing through the CEDS, with nutrient concentrations decreasing progressively along the flow path. The system intercepted 41.0% of N and 31.9% of P, with inorganic N and particulate P as the primary forms of nutrient loss. (2) Zeolite removes N primarily through ion exchange, and P likely through chemical reactions, with maximum capacities of 3.47 g/kg for N and 1.83 g/kg for P. (3) Ecological floating beds with hydroponic cultivation enhanced nutrient uptake by the roots of Canna indica and Iris pseudacorus, with N uptake surpassing P. (4) Nutrient interception efficiency was positively correlated with temperature, ditch inlet concentrations, and rice runoff concentrations, but negatively with precipitation. This study demonstrates the CEDS’s potential for improving farmland water quality and suggests further enhancements in design and management to increase its economic and aesthetic value.

1. Introduction

In recent years, agricultural non-point source pollution (AGNPS) caused by excessive nitrogen (N) and phosphorus (P) emissions has become a pressing global environmental issue [1]. The loss of N and P from farmland is considered the primary source of AGNPS, particularly in cases of low fertilizer efficiency and poor management of drainage ditches [2]. Studies show that 80% of global water bodies and 50% of land areas are affected by AGNPS, with approximately 75% of these areas experiencing N and P pollution [3]. In China, agricultural emissions of total nitrogen (TN) (141.49 Mt) and total phosphorus (TP) (21.20 Mt) account for 46.52% and 67.22%, respectively, of the total water pollution emissions [4]. AGNPS not only leads to the eutrophication of regional water bodies but also causes resource waste and ecosystem imbalance [5]. Therefore, controlling N and P loss from farmland drainage has become a critical task for regional water environmental management and sustainable agricultural development.
Process interception technologies, such as wetlands [6], vegetative buffer zones [7], and ecological ditches (eco-ditches) [8], were considered effective non-point source pollution control measures by intercepting, blocking, or removing pollutants from entering rivers. However, wetlands and buffer zones are limited in practical applications due to land resource constraints. In contrast, the eco-ditch, as a green, low-cost ecological engineering that does not occupy additional land, has substantial advantages in reducing the transport of pollutants to water [9]. For example, Kumwimba et al. conducted a 13-year-long experiment that showed the eco-ditch could achieve annual average removal rates of 72.0% and 59.7% for N and P in primary domestic wastewater [10]. Under natural rainfall conditions in farmland runoff from the North China Plain, the eco-ditch achieved interception rates of 69.2% and 62.2% for N and P, respectively [11]. However, due to internal and external factors, there is considerable variation in the interception efficiency of ecological ditch systems (EDS) [12].
The nutrient interception performance of eco-ditches is influenced by a combination of internal design factors and external environmental factors [13,14]. Among the internal factors, the structural design of the eco-ditch and the configuration of its constituent materials are critical in governing the nutrient transport and transformation processes within the system [15]. For example, the winding “bow-shaped” ditch structure can slow down the flow velocity, extending the hydraulic residence time (HRT) of nutrients and enhancing their removal efficiency [16]. Compared to unvegetated ditches, vegetated ditches exhibit significantly higher microbial abundance and diversity [17]. Specific plants, such as Canna indica, Myriophyllum spicatum, Iris pseudacorus and Juniperus chinensis, have been demonstrated to possess strong water purification effects [18,19]. Placing suitable substrate materials in EDS, such as zeolite and biochar [20,21], can enhance nutrient retention through adsorption effects. Among them, zeolite exhibits advantages such as low cost, high availability [22], and potential renewability [23], making it widely used in water treatment. Additionally, composite ecological ditch systems (CEDS), which integrate multiple design elements, often exhibit superior nutrient interception performance compared to conventional single-component ditch systems [24]. External factors include meteorological conditions [25], topography [13], and agricultural management practices [26], which can influence the inlet nutrient flux and plant absorption within the ditch, subsequently affecting microbial metabolic activities and leading to regional variations in interception performance [27]. The combined effect of these external environmental and internal process design ultimately determines the overall interception performance of the EDS. Effective and sustained nutrient interception requires managers to adjust and maintain the EDS based on environmental changes. For instance, during plant growth phases, nutrient absorption and accumulation dominate removal pathways, whereas in autumn and winter, the decomposition of plant humus may lead to nutrient release [28]. Similarly, the pollutant removal efficiency of substrate materials is constrained by their adsorption “saturation point” under natural conditions. Higher nutrient concentrations in farmland runoff can increase removal rates [29], while fluctuations in nutrient levels are also influenced by fertilization and rainfall events. Considering these complex influencing factors, it is necessary to clarify the internal removal mechanisms of eco-ditches and the impact of external environments on their interception performance.
Based on the current research status, in this study, conducted in the agriculturally developed Pearl River Delta region of China, we designed a composite ecological ditch system that consisted of a grit chamber with zeolite and ecological floating beds, by modifying the existing farmland drainage. The study aims to explore (1) the nutrient interception effect of the CEDS on N and P, (2) the removal mechanisms of N and P from the water by zeolite and plants, and (3) the impact of external environmental factors on nutrient interception in the eco-ditch. The newly designed CEDS tailored to local conditions and balances both environmental and economic benefits, providing a model for the effective application and management of current farmland drainage and offering theoretical and technical assistance for controlling AGNPS in intensive agricultural regions.

2. Materials and Methods

2.1. Study Area

The Pearl River Delta region in Guangdong Province, China, is an area of high crop rotation, benefiting from suitable planting environments and dense irrigation ditches [30]. The study area is located at the Ningxi Experimental Farm of South China Agricultural University in Guangzhou (23°24′ N, 113°64′ E), with rice as the main crop grown (Figure 1a). The region belongs to the South Asian subtropical marine monsoon climate, with an average annual temperature of 23.2 °C and yearly precipitation of 1891.9 mm. The soil is red with a texture of sandy loam. The soil pH of the rice paddies around the ditches is 5.83, with a bulk density of 1.26 g/cm3, organic matter of 15.49 g/kg, alkaline N of 60.79 g/kg, available P of 19.47 g/kg, and available potassium (K) of 73.02 g/kg (see Table S1 for testing methods). Fertilization is performed according to local farming practices, with the total amount of chemical fertilizers applied per season: nitrogen fertilizer 148 kg/hm2, phosphorus fertilizer 67 kg/hm2, and potassium fertilizer 114 kg/hm2. Nitrogen fertilizer is applied in three stages: base fertilizer (30%), topdressing (40%), and secondary topdressing (30%). Phosphorus and potassium fertilizers are applied once as base fertilizers. The irrigation method is flood irrigation. Since the rice growing season coincides with the rainy season (April to September, accounting for about 80% of the annual precipitation), the applied fertilizers are largely lost through surface runoff.

2.2. Experimental Design

To accommodate local drainage habits, the eco-ditch has an overall width of 4.2 m, with a bottom cross-section width of 1 m, and 1.4 m at the top and side slopes, with a total length of 40 m. The bottom of the eco-ditch is compacted with bare soil, covered with a 150 mm thick stone powder layer, a 50 mm thick medium sand layer, and refilled with 100 mm of planting soil. The eco-ditch is enclosed by concrete on both sides, 20 cm wide and 70 cm high. The slope of the embankment is 36.87°, and Zoysia japonica (Lanyin No. 3 grass) is planted on the embankment and top of the eco-ditch for soil stabilization and erosion control (Figure 1c). A total of five water sampling sites (W1–W5) are set up along the eco-ditch, evenly distributed from the inlet to the outlet (Figure 1b).
The front section of the eco-ditch is a grit chamber with zeolite (Figure 1b), which is 150 cm long, 100 cm wide, and 50 cm high. The upper part of the grit chamber is level with the bottom of the ditch slope (design details of the grit chamber are shown in Figure S1), and it contains zeolite with an average diameter of 10 cm and an average weight of about 450 g. In the middle section, 20 groups of ecological floating beds are arranged, each measuring 2 m in length and 0.33 m in width, distributed sequentially along both sides of the ditch (Figure 1b). Consistently grown Iris pseudacorus and Canna indica are inter-planted on the ecological floating beds, with 8 equidistant plant sampling sites (P1–P8) set up in the plant ditch. At the end of the eco-ditch, a return well is set up, consisting of a water storage well, water level adjustment plate, and a return pump (Figure 1b). The water storage well is 1 m long and wide, and the adjustment plate can regulate the water storage capacity. The configured return pump has a lift height of 26 m and a flow rate of 90 m3/h, capable of returning the water from the eco-ditch to irrigate the farmland.

2.3. Sampling and Analysis

During the study period (May–September), water samples were collected from the eco-ditch approximately once a week, with a total of 18 times. A total of 500 mL water was collected at each sampling site and stored in high-density polyethylene bottles pre-washed with 5% hydrochloric acid and deionized water. The samples were immediately returned to the laboratory for analysis. The water samples were divided into two parts in the laboratory. One part was filtered through a 0.45 μm filter membrane and then automatically pumped into the AA3 Auto Analyzer (Bran + Luebbe, GmbH, Norderstedt, Germany) using flow injection analysis to measure nitrate-N (NO3-N) and ammonia-N (NH3-N) concentrations. The total dissolved P (TDP) concentration in the filtrate was determined using the molybdenum-antimony colorimetric method with potassium persulfate digestion. For the unfiltered water samples, TN and TP concentrations were determined using the alkaline potassium persulfate digestion ultraviolet–visible spectrophotometric method and the molybdenum–antimony colorimetric method after potassium persulfate digestion, respectively. The concentration of particulate P (PP) was calculated by subtracting TDP from TP. To further explore the impact of fertilization management and meteorological factors on the nutrient interception effectiveness of the CEDS, we also recorded the temperature, precipitation, and rice fertilization management during the study period (Figure S2), and collected paddy runoff to test TN and TP concentrations.
To determine the saturated adsorption capacity of the adsorbent material in the ditch and its replacement cycle, zeolite samples were collected from the eco-ditch at days 0, 10, 20, 30, 40, 50, 60, 80, 100, and 120. A 4 mol/L NaCl solution was used as the desorption agent. After shaking the samples at 200 rpm for 24 h at 25 °C, the concentration of the solution was measured to estimate the N and P content adsorbed by the zeolite. Additionally, to further observe the changes in the surface material and morphology of the zeolite, samples from the adsorption process were analyzed using a scanning electron microscope (SEM, Quattro S, Thermo-Scientific, Waltham, MA, USA), Fourier Transform Infrared Spectrometer (FTIR, TENSOR 27, Bruker, Karlsruhe, Germany), and X-ray Diffraction (XRD, Aeris, Panalytical, Almelo, The Netherlands). Electrophoretic Light Scattering was used to calculate the Zeta potential (ζ) of the zeolite at different pH situations.
The plants in the ditch were planted in May and harvested in October of the same year. Samples of Canna indica and Iris pseudacorus were collected from P1 to P8 before planting and after harvest. The plant samples were air-dried, oven-dried, and ground, followed by digestion with concentrated sulfuric acid and hydrogen peroxide for pretreatment. TN content was determined by the Kjeldahl method, and TP content was determined by the vanadium-molybdenum yellow colorimetric method. N and P contents in the roots and stems/leaves were measured separately.

2.4. Data Treatment and Statistical Analysis

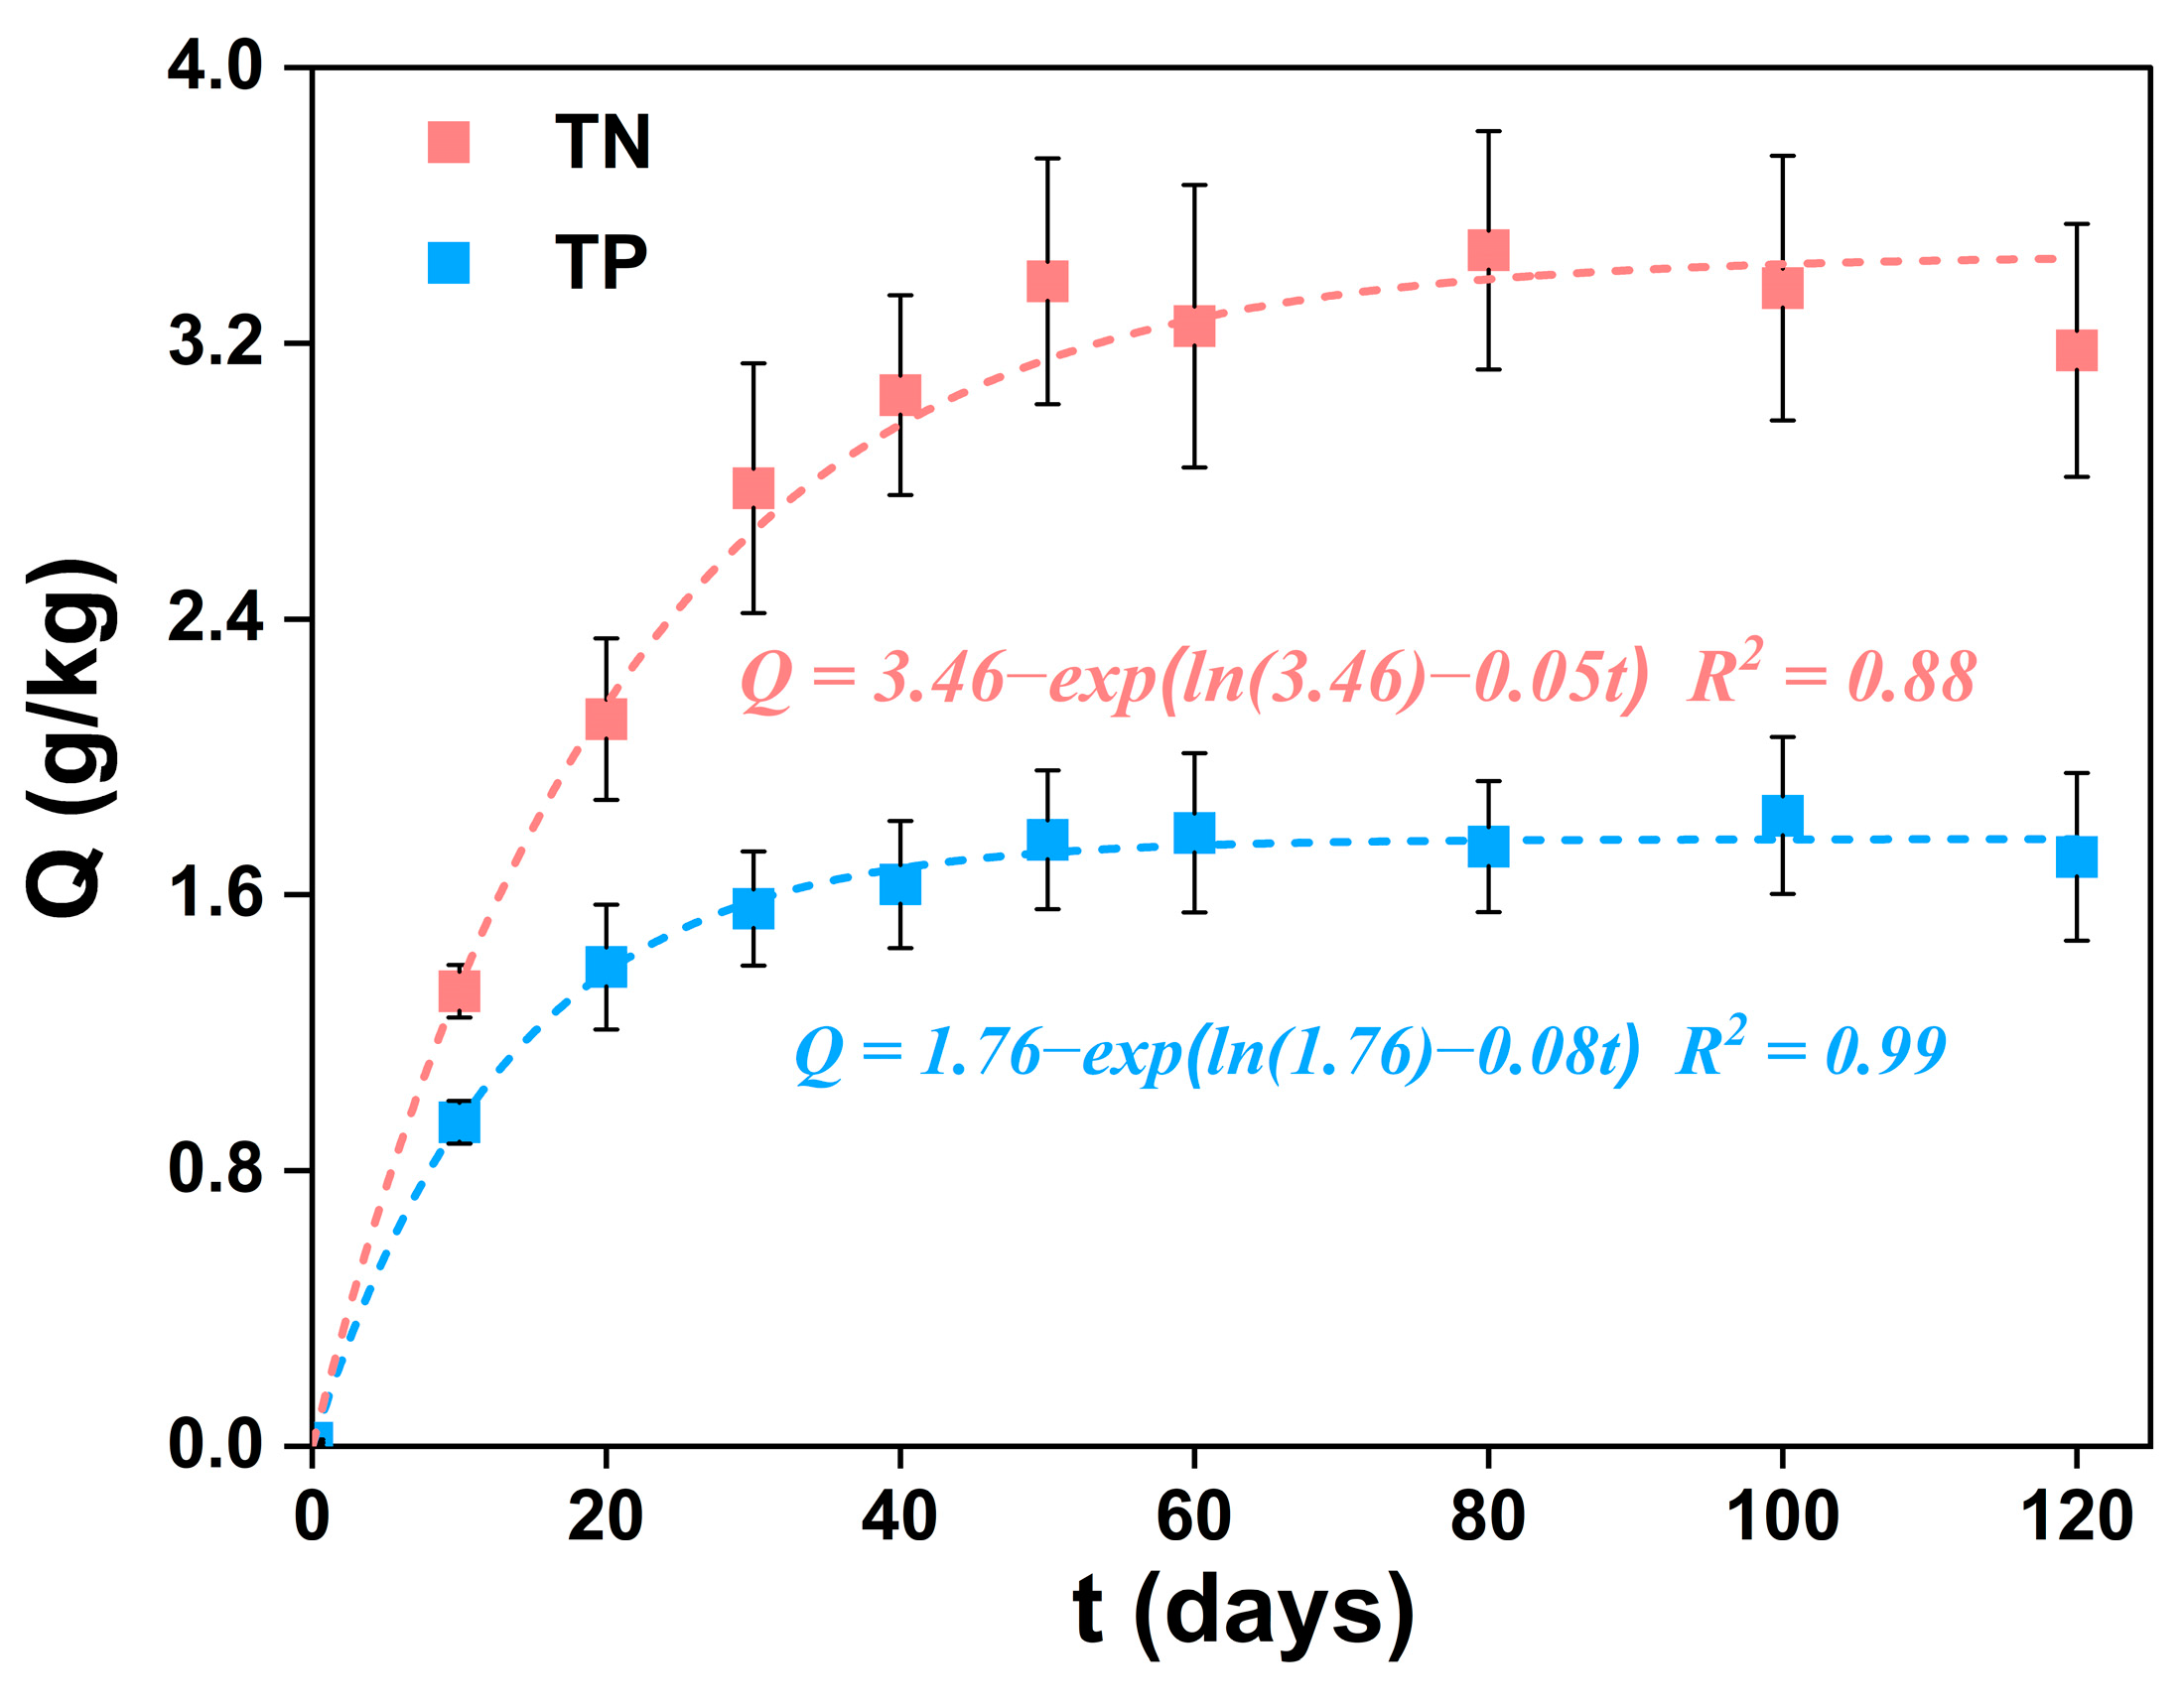
  • The formula for calculating the adsorption capacity (Qt) of zeolite for N and P is as follows:
    Q   t =   ( w t w 0 )   ×   1000 V m
    where Qt is the adsorption capacity of zeolite on day t (g/kg); w 0 and w t are the concentrations of N and P in the solution before and after desorption on day t (mg/L); V is the volume of the solution (L); m is the mass of zeolite (kg).
  • The formula for calculating the nutrient interception rate (I) in the eco-ditch is as follows:
    I   %   = C inlet C outlet C inlet × 100
    where I is the nutrient interception rate (%); Cinlet and Coutlet are the concentrations of nutrients in the inlet and outlet water (mg/L).
Excel 2019 (Microsoft, Redmond, DC, USA) and Origin 2021 (Origin Lab, Northampton, MA, USA) were used for data processing and chart preparation. Statistical data analysis was performed using SPSS 25.0 software (IBM, New York, NY, USA). Comparison analysis was performed using the Least Significant Difference (LSD) method at a significance level of p = 0.05 to determine significant differences in nutrient concentrations between sampling sites. Spearman rank correlation analysis was used to explore the relationship between environmental factors and nutrient interception rates.

3. Results

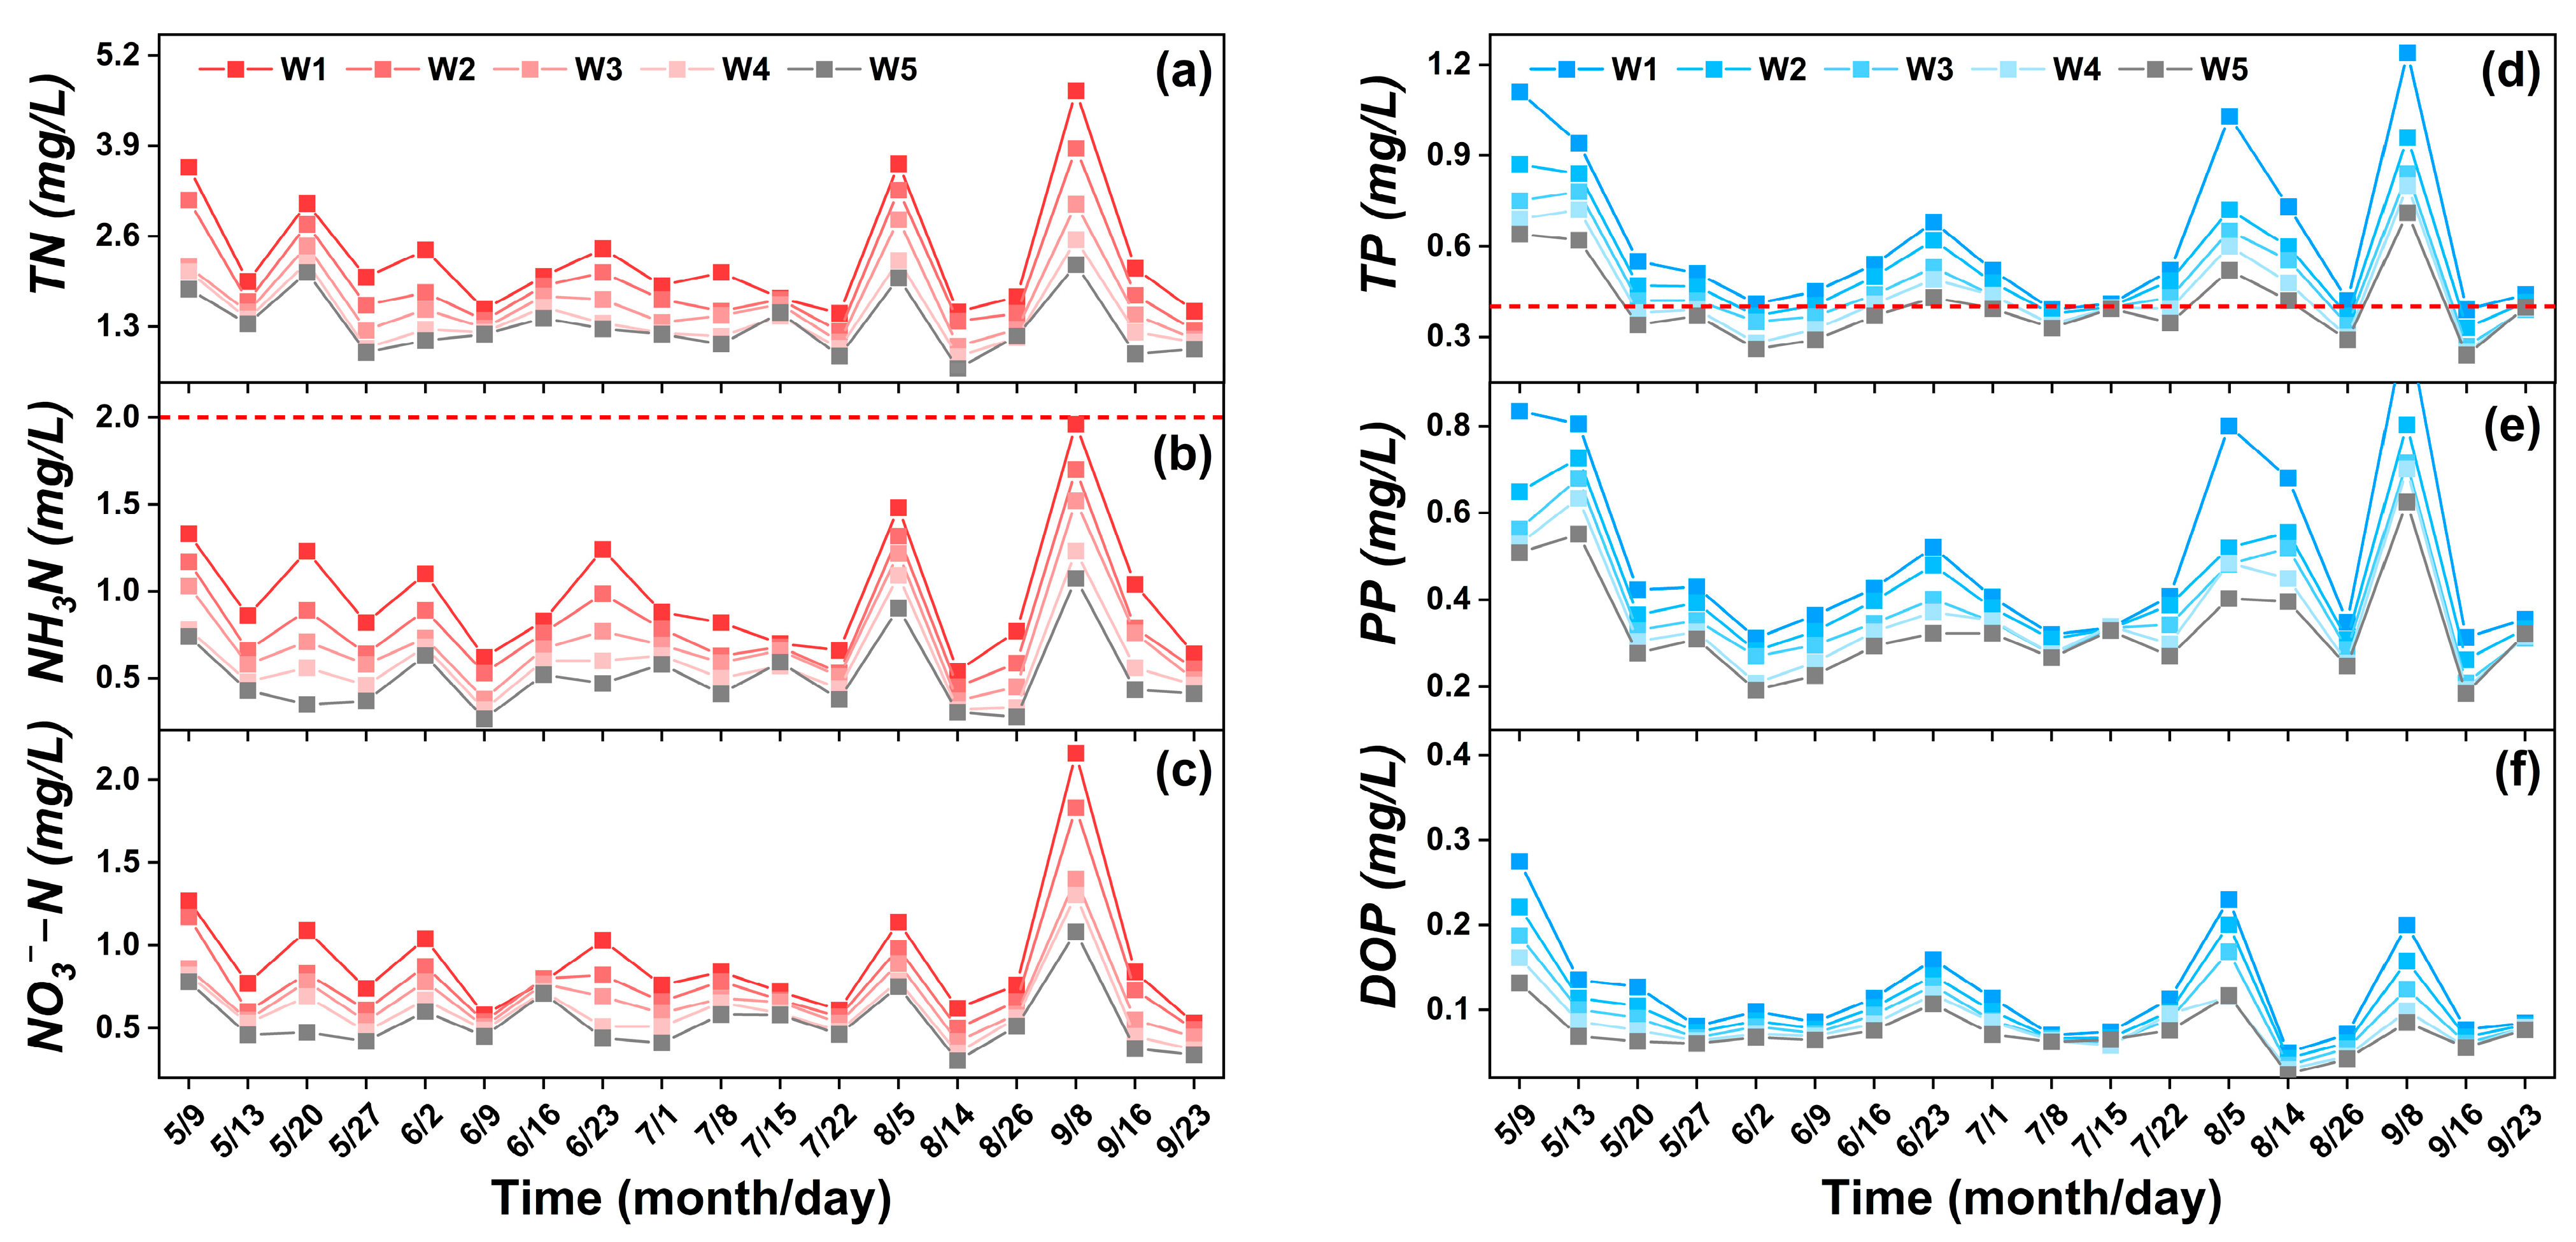
3.1. Concentrations Variation of Nitrogen, Phosphorus, and Their Fractions

During the study period, the concentration variation in N at different sampling sites of the eco-ditch is shown in Figure 2a–c and Table 1. At the inlet (W1), the average (range) concentrations of TN, NH3-N, and NO3-N were 2.30 mg/L (1.49–4.69 mg/L), 0.97 mg/L (0.54–1.96 mg/L), and 0.90 mg/L (0.53–2.16 mg/L), respectively, with NH3-N was the major fraction of N (42.5%). The TN, NH3-N, and NO3-N concentrations showed a decreasing trend along the flow direction. At the outlet (W5), the average (range) concentrations of TN, NH3-N, and NO3-N were 1.32 mg/L (0.70–2.19 mg/L), 0.51 mg/L (0.27–1.07 mg/L), and 0.54 mg/L (0.30–1.08 mg/L), respectively, with NO3-N has been the major fraction of N (41.9%). Compared to the inlet, the concentrations of N and its fractions at the outlet were significantly lower.
The concentration variation in P at different sampling sites of the eco-ditch is shown in Figure 2d–f and Table 1. At the inlet (W1), the average (range) concentrations of TP, PP, and DOP were 0.63 mg/L (0.39–1.24 mg/L), 0.51 mg/L (0.31–1.04 mg/L), and 0.12 mg/L (0.05–0.28 mg/L), respectively. P concentrations show an overall decreasing trend along the eco-ditch flow direction. At the outlet (W5), the average (range) concentrations of TP, PP, and DOP were 0.41 mg/L (0.24–0.71 mg/L), 0.34 mg/L (0.18–0.62 mg/L), and 0.07 mg/L (0.02–0.13 mg/L), respectively. PP consistently constitutes the dominant fraction of P in the water (74.0–94.3%). The concentrations of P and its fractions at the outlet were significantly lower than at the inlet. Only 6% of TP at the inlet was below level V (0.4 mg/L) of the Environmental Quality Standards for Surface Water (GB3838-2002, China) [31], while this proportion increased to 67% at the outlet.

3.2. Interception Rates of Nitrogen and Phosphorus in the CEDS

The CEDS has good interception effects for N and P (Table 1). The average interception rates (range) for TN, NH3-N, and NO3-N were 41.0% (12.3–57.5%), 47.1% (15.4–71.6%), and 38.3% (9.0–57.3%), respectively; The average interception rates (range) for TP, PP, and DOP were 31.9% (3.9–49.5%), 31.2% (2.0–49.6%), and 34.9% (9.5–57.5%), respectively. The EDS had a stronger interception effect on N than on P. The interception rates for N and P both showed a gradually increasing trend along the length of the eco-ditch, with higher interception rates in the first half compared to the latter half. The nutrient interception rates fluctuated during the study period.

3.3. Zeolite Adsorption Performance for Nitrogen and Phosphorus

During the 120-day continuous sampling process, zeolite in the front grit chamber exhibited a “rapid adsorption, slow equilibrium” characteristic for N and P, with the adsorption curves fitting the pseudo-first-order kinetic model (Figure 3). The zeolite adsorption of N was higher than P, with the maximum adsorption amounts of 3.47 g/kg for N on day 80 and 1.83 g/kg for P on day 100. However, on day 50, the adsorption of N and P by zeolite was only 0.07 g/kg and 0.09 g/kg less than their maximum adsorption capacities, thus it can be inferred that zeolite was approaching saturation at that time [32]. After day 50, the adsorption amount of zeolite still fluctuated, likely due to partial regeneration as it approached saturation, influenced by physical and microbial activities within the eco-ditch [33].

3.4. Nitrogen and Phosphorus Absorption Capacity of Plants

The changes in N and P content in different parts of the plants in the ecological floating bed at different sampling sites are shown in Figure 4. Compared to before transplantation, the N and P content in the roots and stems/leaves of Iris pseudacorus and Canna indica in the eco-ditch significantly increased after harvesting. The N content ratios of the stems/leaves to roots for Iris pseudacorus and Canna indica were 1.68 and 1.74, respectively, while the P content ratios were 0.82 and 0.88, respectively. During the experiment, the average N and P absorption per plant for Iris pseudacorus were 10.76 g/kg and 0.64 g/kg, respectively, and for Canna indica, they were 10.15 g/kg and 0.69 g/kg, respectively. The N absorption of plants was significantly higher than P, which can be attributed to the higher concentration of N compared to P in agricultural runoff and the lower content of dissolved P available for plant absorption (Figure 2f). Additionally, plant roots actively absorb P, which requires energy consumption. Based on calculations, the average dry weight increase per plant for Iris pseudacorus and Canna indica in the eco-ditch during the study period was 238.55 g/plant and 349.18 g/plant, respectively. Canna indica demonstrated a stronger absorption capacity for N and P than Iris pseudacorus, which is consistent with the study by Barya et al. [34].

4. Discussion

4.1. Mechanism of Nitrogen and Phosphorus Removal by Zeolite

Zeolite features abundant functional groups, high porosity, and a large specific surface area, providing strong adsorption capacity [35]. To investigate its adsorption behavior, zeolite samples were collected at three stages, day 0 (before adsorption), day 10 (rapid adsorption phase), and day 50 (adsorption saturation phase), for material characterization, aiming to elucidate the N and P removal mechanisms under natural agricultural drainage conditions. SEM revealed that non-adsorbed zeolite exhibited a smooth, crystalline surface with sharp-edged, plate-like facets and abundant pores of various sizes (Figure 5a). After 10 days, the surface became irregular, forming fractal-like fragments with fewer pores and attached particulate matter (Figure 5b). By day 50, particulate matter nearly covered the surface, most pores were blocked, and fungal hyphae were observed (Figure 5c). These findings suggest that as adsorption progresses, zeolite’s porosity and adsorption capacity decline, ultimately leading to saturation. XRD analysis (Figure 5d) identified quartz (SiO2) as the primary mineral phase of zeolite. The absence of significant compositional changes before and after adsorption indicates that the mineral structure remained stable throughout the process. FTIR spectroscopy (Figure 5e) showed that after adsorption, the O-H vibration peak at 3420–3444 cm−1 weakened significantly, suggesting hydroxyl (-OH) group involvement in P adsorption [36]. Additionally, the Si-O and Si-O-Si vibrational peaks within 1200–400 cm−1 weakened, and the peak at 974 cm−1 redshifted to 968 cm−1, suggesting that P adsorption likely altered the Si-O or Si-OH structure [37]. The ζ (Figure 5f) confirmed that zeolite remained negatively charged in the pH range of 2 to 8, with stronger negative potential at higher pH levels. This enhanced its affinity for cationic pollutants (e.g., NH4+) while reducing electrostatic attraction to anions (e.g., PO43−) [38]. After adsorption, the isoelectric point shifted upward, likely due to NH4+ replacing Na+ and Ca2+ in zeolite, altering the surface charge [39]. Based on these structural and surface charge modifications, we cautiously propose that under natural drainage conditions, zeolite primarily removes N via ion exchange (Zeolite-Na+ + NH4+ → Zeolite-NH4+ + Na+). P removal is mainly driven by chemical reactions (Zeolite-OH + PO43− → Zeolite-PO4 + OH). Given its strong cation selectivity, zeolite typically exhibits higher N removal efficiency [40], this would explain why N adsorption exceeded P adsorption in this study (Figure 3). Additionally, the microenvironment on the zeolite surface may further influence adsorption performance, as microbial communities colonizing its surface significantly increased over time. Future studies should quantify changes in zeolite porosity, analyze microbial communities, and conduct adsorption experiments under different pH conditions to comprehensively assess its N and P removal potential.

4.2. Mechanism of Nutrient Removal by Plants

This study employed the mixed planting method of Iris pseudacorus and Canna indica in the ecological floating bed, and those configurations often form a diverse ecosystem, thus effectively enhancing the EDS’s ability to purify N and P in runoff [41]. Similar hydroponic planting methods are beneficial for increasing the number of lateral and capillary roots, thereby increasing the root-to-shoot ratio and root surface area, which in turn facilitates nutrient absorption by the roots [42]. At the same time, the developed root system provides more attachment points and nutrients for microorganisms, promoting the interception and transformation of N and P [43]. Zhang et al. found that intercropping aquatic plants significantly increased the microbial diversity in the rhizosphere and promoted the growth of functional denitrifying bacteria [44]. Li et al. showed that effective microbial addition could increase the N and P removal rate in constructed wetlands, which is consistent with our study’s findings [45]. Rhizosphere microorganisms primarily remove nutrients from runoff through nitrification and denitrification, promoting the decomposition of macromolecular organic matter and biological absorption, with nitrification and denitrification being the main processes for interception N [46,47]. Specifically, during the aerobic phase, organic N is decomposed by microorganisms into NH4+, which is then oxidized into NO3 by autotrophic nitrifying bacteria, while in the anaerobic phase, denitrifying bacteria convert NO3 into N2 through denitrification [48]. It is noteworthy that plant absorption of N and P decreases with the flow direction of the eco-ditch (Figure 4), and the plant growth level at the end of the ditch is weaker than at the front. This is due to the decline in nutrient concentrations within the eco-ditch during flow, leading to a corresponding decrease in plant absorption. Additionally, this result suggests that there is still room for improvement in the nutrient absorption capacity of plants in the eco-ditch. Future research could explore more plant combinations and microbial addition strategies to optimize purification efficiency.

4.3. CEDS’s Nutrient Interception Performance Evaluation and Influencing Factors Analysis

Compared to other studies [17,25,49,50,51,52,53] (Table S2), the nutrient interception performance of CEDS for N in this study was similar to that reported, but the interception performance for P was relatively low, which could be attributed to the limitation of the ditch length. There are significant differences in interception rates between different eco-ditches, possibly due to multiple complex factors in the field. We further analyzed the correlation between precipitation, temperature, inlet concentration of the eco-ditch, and rice runoff concentration (representing fertilization management) with the nutrient interception rates of the CEDS. The results showed that the interception rates of TN and TP were negatively correlated with precipitation and positively correlated with temperature, inlet concentration, and rice runoff concentration (Figure S3). Although these correlations did not reach statistical significance in this study, they reveal the potential impact of these environmental and management factors on the nutrient interception performance of the EDS. The peak interception rates of TN and TP in CEDS were observed after applying the tillering fertilizer and base fertilizer for late rice. During these stages, precipitation was relatively low, and the nutrient concentrations in the agricultural drainage ditches were elevated, leading to extended HRT in the eco-ditch, which enhanced the absorption and removal of high concentrations of nutrients. Xiao et al. found that the concentrations of TN, NO3, TP, and DP in agricultural watershed ponds were strongly positively correlated with the intensity of fertilizer application in surrounding fields, and NH4+ concentration was strongly positively correlated with the intensity of base fertilizer [54], which is consistent with our findings. G. Hunter reported that when HRT was 6 days, the removal rates of NH4+-N and PO43−-P increased by 27% and 26%, respectively, compared to when HRT was 2 days [55]. Furthermore, significant differences were observed in the nutrient interception rates across different sections of the eco-ditch. In the entire CEDS, high concentration agricultural drainage initially flows into the W1-W2 section, where a grit chamber and zeolite are set, resulting in a higher nutrient interception rate compared to other sections. As the length of the ditch increases, nutrient concentrations gradually decrease, and the CEDS demonstrates sustained purification. The migration and transformation of nutrients in the eco-ditch follow a consistent pattern, and the functional roles of the different sections alter the specific ratio of N and P in the water [56]. The nutrient removal capacity of the CEDS for N and P is not simply the sum of the individual sections; rather, it results from the complex synergistic interactions among sections. In this study, the grit chamber with zeolite at the front, and the plant absorption at the rear, form a multi-layered purification system. Through the synergistic actions of physical, chemical, and biological processes, the advantages of each unit are fully utilized, complementing each other in removing N and P from the water, thus achieving optimized results. During the study period, the CEDS showed positive effects on the removal of N, P, and their fractions, highlighting the potential of this system as a sustainable and effective method for treating nutrient-rich agricultural runoff.

4.4. Prospects and Considerations for the Application of Ecological Ditches

This study effectively reduced nutrient loss from farmland by transforming local drainage ditches into CEDS consisting of a grit chamber with zeolite and plants. According to cost calculations (Table S3), the total cost of this drainage ditch transformation was 8190 CNY, mainly including material and labor costs. The materials used in the EDS are reusable; for example, zeolite can be reused after elution, and aquatic plants can regenerate after cutting. Therefore, only normal maintenance is required each year, such as plant harvesting, material replacement, and dredging, with an annual maintenance cost of 800 CNY. Compared to other eco-ditches [11,49], our CEDS’s transformation and operation costs are not expensive, making it economically feasible. In regions with limited land availability and high material costs, transforming existing drainage ditches presents a more feasible and environmentally sustainable strategy. Furthermore, the harvested plants can be further processed into fodder or organic fertilizer, generating additional income [57]. As such, this CEDS offers both ecological and economic benefits, making it applicable to other intensive agricultural ecosystems.
In the future, when transforming local drainage ditches into eco-ditches to reduce nutrient loss from farmland, some key issues need to be addressed. First, the design of the ditch and the selection of materials should be tailored to local conditions. In this study, inorganic N and PP were the main fractions of N and P, respectively. Strengthening the removal of these main fractions can enhance the nutrient interception effect of the eco-ditch. Additionally, the interception performance of the eco-ditch is influenced by various factors, including climate conditions, fertilization management, and nutrient load at the inlet. Understanding and utilizing these relationships will enable practitioners and researchers to design EDS more effectively, leading to more efficient nutrient removal and water quality improvement. Second, secondary pollution issues should be prevented. Under low nutrient loads or when materials reach saturation, zeolite may become a source of nutrients, releasing N and P, thus increasing the nutrient load in the ditch [58]. Similarly, if aquatic plants are not harvested in time, the above-ground parts will decompose in the autumn and winter, causing secondary pollution in the water [59]. Third, targeted management measures should be adopted, such as dredging the ditch, harvesting plants, and renewing adsorption materials, to maintain the sustainable nutrient removal capacity of the eco-ditch and reduce the risk of nutrient loss. Finally, under the influence of interannual variations or extreme weather conditions, further research is needed to collect multi-year samples to study the effectiveness of ecological ditches in reducing nutrient loss from agricultural fields. In addition to ecological and economic benefits, the rich and diverse natural landscape elements in the eco-ditch also have development potential [60]. In areas with suitable conditions, eco-ditches could be incorporated into agricultural ecotourism projects to further enhance economic returns. This direction is worthy of future research and practical exploration (Figure 6).

5. Conclusions

This study transformed traditional agricultural drainage ditches into a CEDS, incorporating a grit chamber with zeolite and ecological floating beds, and conducted performance monitoring in an intensive agricultural area. The results showed that the CEDS achieved nutrient interception rates of 41.0% for N and 31.9% for P, significantly improving water quality. Zeolite removed N and P through ion exchange and chemical reactions, respectively, with the most significant removal occurring during the rapid adsorption phase between 0 and 50 days. The ecological floating bed plants facilitated nutrient absorption, with Canna indica demonstrating a superior ability to absorb N and P compared to Iris pseudacorus. Moreover, external environmental factors influenced nutrient removal efficiency, with the N and P interception rates negatively correlated with precipitation but positively correlated with temperature, inlet concentration, and rice runoff concentration. Overall, our findings confirm that CEDS provides significant ecological benefits for improving agricultural water quality and has the potential for further design optimization to enhance economic and landscape value.

Supplementary Materials

The following supporting information can be downloaded at https://www.mdpi.com/article/10.3390/w17060882/s1, Figure S1. Grit chamber design diagram (a) and actual image (b). Figure S2. Daily average temperature, precipitation variation, and fertilization management of double-cropping rice during the study period. Meteorological data were obtained from the self-built weather station at the research site. Figure S3. Correlation analysis between TN (a–d) and TP (e–h) interception rates and influence factors. Table S1. Analytical methods for soil properties. Table S2. Summary of studies that investigated the nutrient intercept from agricultural drainage by EDS. Table S3. Application materials, labor, and normal operation and maintenance costs required for the eco-ditch system (Year 1).

Author Contributions

Conceptualization, X.W., C.C., T.C. and Z.Z.; methodology, X.W., X.L., Y.L. and Z.Z.; formal analysis and investigation, X.W., Z.Y. and C.C.; data curation and visualization, C.C., Z.H., T.C. and K.R.; writing—original draft, X.W. and Z.Y.; writing—review and editing, Y.L. and Z.Z.; funding acquisition and resources, X.Z. and X.L.; supervision, Y.L. and Z.Z. All authors have read and agreed to the published version of the manuscript.

Funding

This research was funded by the Guangzhou Agricultural Environment and Plant Protection Station (Grant No. ZBZ-(NH)2024(001)), and the Science and Technology Projects in Guangzhou (Grant Nos. 2023B03J1360 and 2023A04J0960).

Data Availability Statement

The raw data supporting the conclusions of this article will be made available by the authors on request.

Acknowledgments

Thank you to the members of the research group for your help.

Conflicts of Interest

The authors declare no conflicts of interest.

References

  1. Wang, H.; Liu, C.; Wang, X.F. The spatial spillover effect and impact paths of agricultural industry agglomeration on agricultural non-point source pollution: A case study in Yangtze River Delta, China. J. Clean. Prod. 2023, 401, 136600. [Google Scholar] [CrossRef]
  2. Zou, L.; Liu, Y.; Wang, Y.; Hu, X. Assessment and analysis of agricultural non-point source pollution loads in China: 1978–2017. J. Clean. Prod. 2020, 263, 110400. [Google Scholar] [CrossRef] [PubMed]
  3. Wang, M.; Jiang, T.; Mao, Y.; Wang, F.; Yu, J.; Zhu, C. Current Situation of Agricultural Non-Point Source Pollution and Its Control. Water Air Soil Pollut. 2023, 234, 471. [Google Scholar] [CrossRef]
  4. Ministry of Ecology and Environment in China. National Bureau of Statistics in China. Ministry of Agriculture and Rural Affairs in China. The Second National Pollution Source Census Bulletin. 2020. Available online: http://www.mee.gov.cn/xxgk2018/xxgk/xxgk01/202006/t20200610_783547.html (accessed on 15 January 2025).
  5. Wu, X.; Quan, W.; Chen, Q.; Gong, W.; Wang, A. Efficient Adsorption of Nitrogen and Phosphorus in Wastewater by Biochar. Molecules 2024, 29, 1005. [Google Scholar] [CrossRef]
  6. Jia, H.; Sun, Z.; Li, G. A four-stage constructed wetland system for treating polluted water from an urban river. Ecol. Eng. 2014, 71, 48–55. [Google Scholar] [CrossRef]
  7. Prosser, R.S.; Hoekstra, P.F.; Gene, S.; Truman, C.; White, M.; Hanson, M.L. A review of the effectiveness of vegetated buffers to mitigate pesticide and nutrient transport into surface waters from agricultural areas. J. Environ. Manag. 2020, 261, 110210. [Google Scholar] [CrossRef]
  8. Wang, J.; Chen, G.; Fu, Z.; Song, X.; Yang, L.; Liu, F. Application performance and nutrient stoichiometric variation of ecological ditch systems in treating non-point source pollutants from paddy fields. Agric. Ecosyst. Environ. 2020, 299, 106989. [Google Scholar] [CrossRef]
  9. Xue, L.; Duan, J.; Hou, P.; He, S.; Yu, Y.; Feng, Y.; Liu, F.; Yang, L. Full time-space governance strategy and technology for cropland non-point pollution control in China. Front. Agric. Sci. Eng. 2023, 10, 593–606. [Google Scholar] [CrossRef]
  10. Kumwimba, M.N.; Zhu, B.; Muyembe, D.K. Estimation of the removal efficiency of heavy metals and nutrients from ecological drainage ditches treating town sewage during dry and wet seasons. Environ. Monit. Assess. 2017, 189, 434. [Google Scholar] [CrossRef]
  11. Li, X.-N.; Zhang, W.-W.; Wu, J.-Y.; Li, H.-J.; Zhao, T.-K.; Zhao, C.-Q.; Shi, R.-S.; Li, Z.-S.; Wang, C.; Li, C. Loss of nitrogen and phosphorus from farmland runoff and the interception effect of an ecological drainage ditch in the North China Plain—A field study in a modern agricultural park. Ecol. Eng. 2021, 169, 106310. [Google Scholar] [CrossRef]
  12. Muñoz, J.-A.; Guzmán, G.; Soriano, M.-A.; Gómez, J.A. Appraising trapping efficiency of vegetative barriers in agricultural landscapes: Strategy based on a probabilistic approach based on a review of available information. Int. Soil Water Conserv. Res. 2024, 12, 615–634. [Google Scholar] [CrossRef]
  13. Shen, Y.-T.; Hou, S.-N.; Hu, S.-L.; Miao, Y.-Q.; Cui, H.; Zhu, H. Water purification capacity of ecological ditch: A systematic review and meta-analysis of influencing factors. Ecol. Eng. 2024, 204, 107280. [Google Scholar] [CrossRef]
  14. Bai, J.; Qin, Y.; Zhao, J.; Song, Y. Investigation of agricultural nutrient removal by ecological ditches using meta-analysis. Agric. Ecosyst. Environ. 2025, 380, 109401. [Google Scholar] [CrossRef]
  15. Nsenga Kumwimba, M.; Meng, F.; Iseyemi, O.; Moore, M.T.; Zhu, B.; Tao, W.; Liang, T.J.; Ilunga, L. Removal of non-point source pollutants from domestic sewage and agricultural runoff by vegetated drainage ditches (VDDs): Design, mechanism, management strategies, and future directions. Sci. Total Environ. 2018, 639, 742–759. [Google Scholar] [CrossRef]
  16. Baldovi, A.A.; de Barros Aguiar, A.R.; Benassi, R.F.; Vymazal, J.; de Jesus, T.A. Phosphorus removal in a pilot scale free water surface constructed wetland: Hydraulic retention time, seasonality and standing stock evaluation. Chemosphere 2021, 266, 128939. [Google Scholar] [CrossRef]
  17. Cui, N.; Zhang, X.; Cai, M.; Zhou, L.; Chen, G.; Zou, G. Roles of vegetation in nutrient removal and structuring microbial communities in different types of agricultural drainage ditches for treating farmland runoff. Ecol. Eng. 2020, 155, 105941. [Google Scholar] [CrossRef]
  18. Wang, S.; Zhao, X.; Li, J.; Dai, Y.; Cheng, X.; Jiang, L.; Luo, C.; Zhang, G. A novel mechanism of enhanced PCBs degradation associated with nitrogen in the rhizosphere of the wetland plant Myriophyllum aquaticum. J. Hazard. Mater. 2024, 461, 132466. [Google Scholar] [CrossRef]
  19. Zak, D.; Kronvang, B.; Carstensen, M.V.; Hoffmann, C.C.; Kjeldgaard, A.; Larsen, S.E.; Audet, J.; Egemose, S.; Jorgensen, C.A.; Feuerbach, P.; et al. Nitrogen and Phosphorus Removal from Agricultural Runoff in Integrated Buffer Zones. Environ. Sci. Technol. 2018, 52, 6508–6517. [Google Scholar] [CrossRef]
  20. Bai, G.; Pang, S.; Bi, D.; Wang, S.; Cai, M.; Kong, L.; Shen, Z.; Zhang, Y. Added Biochars Promoted Nitrogen and Phosphorus Removal from Ecological Ditches at Low Temperature. Water 2024, 16, 1191. [Google Scholar] [CrossRef]
  21. Pan, X.; Gu, Z.; Chen, W.; Li, Q. Preparation of biochar and biochar composites and their application in a Fenton-like process for wastewater decontamination: A review. Sci. Total Environ. 2021, 754, 142104. [Google Scholar] [CrossRef]
  22. Cai, M.; Zhang, X.; Abdelhafez, A.A.; Zhou, L.; Chen, G.; Zou, G.; Cui, N. Feasibility of improving nitrogen removal by integrating the rice straw and zeolite with drainage ditches for farmland runoff control. Environ. Technol. Innov. 2021, 21, 101359. [Google Scholar] [CrossRef]
  23. Ma, R.; Ma, J.; Chen, Y.; Zhuo, Y.; Cheng, L.; Jiang, L.; Mao, Y.; Shen, Q.; Liu, C.; Ji, F. Efficient removal of nitrogen from tidal flow constructed wetlands based on the in-situ zeolite regeneration: Measures and mechanisms. Chem. Eng. J. 2023, 458, 141298. [Google Scholar] [CrossRef]
  24. Jin, J.; Tian, X.; Liu, G.; Huang, J.; Zhu, H.; Qiu, S.; Fu, X.; Wu, Y.; Bing, H. Novel ecological ditch system for nutrient removal from farmland drainage in plain area: Performance and mechanism. J. Environ. Manag. 2022, 318, 115638. [Google Scholar] [CrossRef]
  25. Chen, L.; Liu, F.; Wang, Y.; Li, X.; Zhang, S.; Li, Y.; Wu, J. Nitrogen removal in an ecological ditch receiving agricultural drainage in subtropical central China. Ecol. Eng. 2015, 82, 487–492. [Google Scholar] [CrossRef]
  26. Zhang, T.; Xu, Q.; Liu, X.; Lei, Q.; Luo, J.; An, M.; Du, X.; Qiu, W.; Zhang, X.; Wang, F.; et al. Sources, fate and influencing factors of nitrate in farmland drainage ditches of the irrigation area. J. Environ. Manag. 2024, 367, 122113. [Google Scholar] [CrossRef]
  27. Shen, W.; Li, S.; Mi, M.; Zhuang, Y.; Zhang, L. What makes ditches and ponds more efficient in nitrogen control? Agric. Ecosyst. Environ. 2021, 314, 107409. [Google Scholar] [CrossRef]
  28. Qian, L.; Duan, H.; Yan, J.; Tsang, Y.F.; Qiao, J.; Fu, X.; Wang, L. Can multiple harvests of plants improve nitrogen removal from the point-bar soil of lake? J. Environ. Manag. 2019, 249, 109371. [Google Scholar] [CrossRef]
  29. You, Z.; Zhang, L.; Pan, S.-Y.; Chiang, P.-C.; Pei, S.; Zhang, S. Performance evaluation of modified bioretention systems with alkaline solid wastes for enhanced nutrient removal from stormwater runoff. Water Res. 2019, 161, 61–73. [Google Scholar] [CrossRef]
  30. Cai, G.; Su, X.; Li, Y.; Wang, X. Comparisons between diversified multicropping systems in terms of crop productivity, economic benefits and carbon footprint in the Pearl River Delta region of South China. Farming Syst. 2023, 1, 100051. [Google Scholar] [CrossRef]
  31. GB 3838-2002; Environmental Quality Standards for Surface Water. National Standard of the People’s Republic of China: Beijing, China, 2002.
  32. Eberle, S.; Börnick, H.; Stolte, S. Granular Natural Zeolites: Cost-Effective Adsorbents for the Removal of Ammonium from Drinking Water. Water 2022, 14, 939. [Google Scholar] [CrossRef]
  33. Chen, Y.; Zhang, C.; Chen, Z.; Deng, Z.; Wang, Q.; Zou, Q.; Li, J.; Zhang, Y.; Wang, X. Achieving nitrite shunt using in-situ free ammonia enriched by natural zeolite: Pilot-scale mainstream anammox with flexible nitritation strategy. Water Res. 2024, 265, 122314. [Google Scholar] [CrossRef] [PubMed]
  34. Barya, M.P.; Gupta, D.; Thakur, T.K.; Shukla, R.; Singh, G.; Mishra, V.K. Phytoremediation performance of Acorus calamus and Canna indica for the treatment of primary treated domestic sewage through vertical subsurface flow constructed wetlands: A field-scale study. Water Pract. Technol. 2020, 15, 528–539. [Google Scholar] [CrossRef]
  35. Sun, J.; Ji, L.; Liu, J.; Yang, H.; Dong, T.; Liu, T. Zeolite-like algal biochar nanoparticles for enhanced antibiotics removal: Sorption mechanisms and theoretical calculations. Colloids Surf. B Biointerfaces 2025, 248, 114475. [Google Scholar] [CrossRef] [PubMed]
  36. Li, Y.; Wang, Y.; Song, J.; Zheng, K.; Zhang, H.; Li, J. A recyclable self-supporting flexible ZIF-8@aminated PAN-PVP material for highly selective phosphate removal from wastewater. Colloids Surf. A Physicochem. Eng. Asp. 2025, 707, 135958. [Google Scholar] [CrossRef]
  37. Barczyk, K.; Mozgawa, W.; Król, M. Studies of anions sorption on natural zeolites. Spectrochim. Acta Part A Mol. Biomol. Spectrosc. 2014, 133, 876–882. [Google Scholar] [CrossRef]
  38. Wei, M.; Tang, X.; Wang, Y.; Bai, X.; Wang, X.; Wang, X.; Wang, P.; Fang, X.; Li, J.; Yang, J. Significant improvement in CH4/N2 selectivity achieved through ammonium exchange in mordenite. Sep. Purif. Technol. 2024, 340, 126799. [Google Scholar] [CrossRef]
  39. Oyinade, A.; Kovo, A.S.; Hill, P. Synthesis, characterization and ion exchange isotherm of zeolite Y using Box–Behnken design. Adv. Powder Technol. 2016, 27, 750–755. [Google Scholar] [CrossRef]
  40. Luo, H.; He, B.; Zhang, W.; Jing, Z. Removal of Nitrogen and Phosphorus in Synthetic Stormwater Runoff by a Porous Asphalt Pavement System with Modified Zeolite Powder Porous Microsphere as a Filter Column. Appl. Sci. 2021, 11, 10810. [Google Scholar] [CrossRef]
  41. Challand, M.; Vismara, P.; de Tourdonnet, S. Combining constraint programming and a participatory approach to design agroecological cropping systems. Agric. Syst. 2025, 222, 104154. [Google Scholar] [CrossRef]
  42. Yang, T.; Samarakoon, U.; Altland, J. Growth, phytochemical concentration, nutrient uptake, and water consumption of butterhead lettuce in response to hydroponic system design and growing season. Sci. Hortic. 2024, 332, 113201. [Google Scholar] [CrossRef]
  43. Adomako, M.O.; Wu, J.; Lu, Y.; Adu, D.; Seshie, V.I.; Yu, F.-H. Potential synergy of microplastics and nitrogen enrichment on plant holobionts in wetland ecosystems. Sci. Total Environ. 2024, 915, 170160. [Google Scholar] [CrossRef] [PubMed]
  44. Zhang, Y.; Han, Y.; Xie, E.; Wang, X.; Yang, Y.; Jia, F. Phytoremediation performance of mixed planting patterns and the associated rhizosphere microbial community in pilot-scale constructed wetlands. Chemosphere 2024, 361, 142482. [Google Scholar] [CrossRef] [PubMed]
  45. Li, X.; Guo, Q.; Wang, Y.; Xu, J.; Wei, Q.; Chen, L.; Liao, L. Enhancing Nitrogen and Phosphorus Removal by Applying Effective Microorganisms to Constructed Wetlands. Water 2020, 12, 2443. [Google Scholar] [CrossRef]
  46. Liu, M.; Chen, Y.; Wu, Y.; Guo, J.; Sun, P.; Zhang, Z. Synergistic Action of Plants and Microorganism in Integrated Floating Bed on Eutrophic Brackish Water Purification in Coastal Estuary Areas. Front. Mar. Sci. 2021, 8, 619087. [Google Scholar] [CrossRef]
  47. Morini, L.; Ferrari, C.; Bartoli, M.; Zilius, M.; Broman, E.; Visioli, G. Vallisneria spiralis L. adaptive capacity improves pore water chemistry and increases potential nitrification in organic polluted sediments. Ecol. Process. 2024, 13, 26. [Google Scholar] [CrossRef]
  48. Zhu, Y.; Dai, H.; Yuan, S. The competition between heterotrophic denitrification and DNRA pathways in hyporheic zone and its impact on the fate of nitrate. J. Hydrol. 2023, 626, 130175. [Google Scholar] [CrossRef]
  49. Zhang, J.; Yan, M.; Lu, X.; Wang, T. Nutrient removal performance from agricultural drainage by strengthening ecological ditches in hilly areas. Agric. Water Manag. 2024, 291, 108623. [Google Scholar] [CrossRef]
  50. Vymazal, J.; Březinová, T.D. Removal of nutrients, organics and suspended solids in vegetated agricultural drainage ditch. Ecol. Eng. 2018, 118, 97–103. [Google Scholar] [CrossRef]
  51. Zhao, Y.; Shu, X.; Tu, Q.; Yang, Y.; Liu, C.; Fu, D.; Li, W.; Duan, C. Pollutant removal from agricultural drainage water using a novel double-layer ditch with biofilm carriers. Bioresour. Technol. 2020, 310, 123344. [Google Scholar] [CrossRef]
  52. Cital, F.; Ramírez-Hernández, J.; García-Hernández, J.; García-Leyva, G.; Rodríguez-Burgueño, J.E.; Ramírez-Barreto, M.E. Ecosystem services (ES) provided by ditches in a desert agricultural valley. Ecol. Eng. 2022, 174, 106462. [Google Scholar] [CrossRef]
  53. Yang, J.R.; Tang, S.; Li, Y.; Zhu, J.; Liu, Z. Assessing the nutrient removal performance from rice-crayfish paddy fields by an ecological ditch-wetland system. Heliyon 2024, 10, e38373. [Google Scholar] [CrossRef] [PubMed]
  54. Xiao, H.; Jiang, M.; Su, R.; Luo, Y.; Jiang, Y.; Hu, R. Fertilization intensities at the buffer zones of ponds regulate nitrogen and phosphorus pollution in an agricultural watershed. Water Res. 2024, 250, 121033. [Google Scholar] [CrossRef] [PubMed]
  55. Hunter, R.G.; Combs, D.L.; George, D.B. Nitrogen, Phosphorous, and Organic Carbon Removal in Simulated Wetland Treatment Systems. Arch. Environ. Contam. Toxicol. 2001, 41, 274–281. [Google Scholar]
  56. Mondal, B.; Barman, K.; Mazumder, B.S. Environmental dispersion in wetland flow with wind effects under boundary absorptions. J. Earth Syst. Sci. 2024, 133, 130. [Google Scholar] [CrossRef]
  57. Raza, S.T.; Feyissa, A.; Li, R.; Rene, E.R.; Ali, Z.; Iqbal, H.; Sahito, Z.A.; Chen, Z. Emerging technology effects on combined agricultural and eco-vermicompost. J. Environ. Manag. 2024, 352, 120056. [Google Scholar] [CrossRef]
  58. Al-Saedi, R.; Smettem, K.; Siddique, K.H.M. Nitrogen removal efficiencies and pathways from unsaturated and saturated zones in a laboratory-scale vertical flow constructed wetland. J. Environ. Manag. 2018, 228, 466–474. [Google Scholar] [CrossRef]
  59. Yang, S.; Xu, J.; Zhang, J.; Wang, Y.; Peng, S. Reduction of Non-Point Source Pollution from Paddy Fields through Controlled Drainage in an Aquatic Vegetable Wetland–Ecological Ditch System. Irrig. Drain. 2016, 65, 734–740. [Google Scholar] [CrossRef]
  60. Doriean, N.J.; Bennett, W.W.; Spencer, J.R.; Garzon-Garcia, A.; Burton, J.M.; Teasdale, P.R.; Welsh, D.T.; Brooks, A.P. Intensive landscape-scale remediation improves water quality of an alluvial gully located in a Great Barrier Reef catchment. Hydrol. Earth Syst. Sci. 2021, 25, 867–883. [Google Scholar] [CrossRef]
Figure 1. (a) Location of the study area and distribution of water sampling sites in the eco-ditch; (b) design of the eco-ditch composition and plant sampling sites; (c) cross-sectional diagram of the eco-ditch.
Water 17 00882 g001
Figure 2. Variation in concentrations of (a) TN, (b) NH3-N, (c) NO3-N, (d) TP, (e) PP, and (f) DOP at different sampling sites of the eco-ditch during the study period. The dashed line represents level V of the Environmental Quality Standards for Surface Water (GB3838-2002, China [31]).
Water 17 00882 g002
Figure 3. Adsorption capacity of N and P by zeolite during the experiment.
Water 17 00882 g003
Figure 4. Absorption of N and P by plants in ecological floating beds.
Water 17 00882 g004
Figure 5. SEM images (ac) of zeolite before adsorption, on day 10, and day 50, (d) XRD diffraction pattern, (e) FT-IR spectrum, and (f) Zeta potential before and after adsorption.
Water 17 00882 g005
Figure 6. The conceptual diagram of the future development of the ecological ditch system.
Water 17 00882 g006
Table 1. Nutrient concentrations and interception rates (Mean ± SD) at water sampling sites of the eco-ditch.
Sampling SitesTN
(mg/L)
NH3-N
(mg/L)
NO3-N
(mg/L)
TP
(mg/L)
PP
(mg/L)
DOP
(mg/L)
W1 (n = 18) 2.30 ± 0.89 a0.97 ± 0.36 a0.90 ± 0.38 a0.63 ± 0.27 a0.51 ± 0.22 a0.12 ± 0.06 a
W2 (n = 18) 1.97 ± 0.76 b0.81 ± 0.32 ab0.78 ± 0.31 ab0.54 ± 0.19 ab0.43 ± 0.16 ab0.10 ± 0.05 ab
W3 (n = 18) 1.66 ± 0.59 bc0.71 ± 0.29 b0.68 ± 0.23 b0.48 ± 0.17 b0.39 ± 0.14 b0.09 ± 0.04 b
W4 (n = 18) 1.45 ± 0.49 c0.59 ± 0.24 bc0.61 ± 0.22 b0.45 ± 0.16 b0.37 ± 0.14 b0.08 ± 0.03 b
W5 (n = 18) 1.32 ± 0.44 c0.51 ± 0.22 c0.54 ± 0.19 b0.41 ± 0.13 b0.34 ± 0.12 b0.07 ± 0.03 b
Interception rate (%)41.0 ± 12.547.1 ± 12.538.3 ± 13.631.9 ± 11.931.2 ± 12.234.9 ± 14.9
Notes: n is the sample number. The nutrient concentrations at each water sampling site followed by the same letter are not significantly different; LSD test, p < 0.05.
Disclaimer/Publisher’s Note: The statements, opinions and data contained in all publications are solely those of the individual author(s) and contributor(s) and not of MDPI and/or the editor(s). MDPI and/or the editor(s) disclaim responsibility for any injury to people or property resulting from any ideas, methods, instructions or products referred to in the content.

