

Integrated Modeling Techniques for Understanding the Distribution and Impact of Human Activities on the Bryde’s Whale (Balaenoptera edeni) in the Sichang Islands, Thailand


Abstract
1. Introduction
2. Materials and Methods
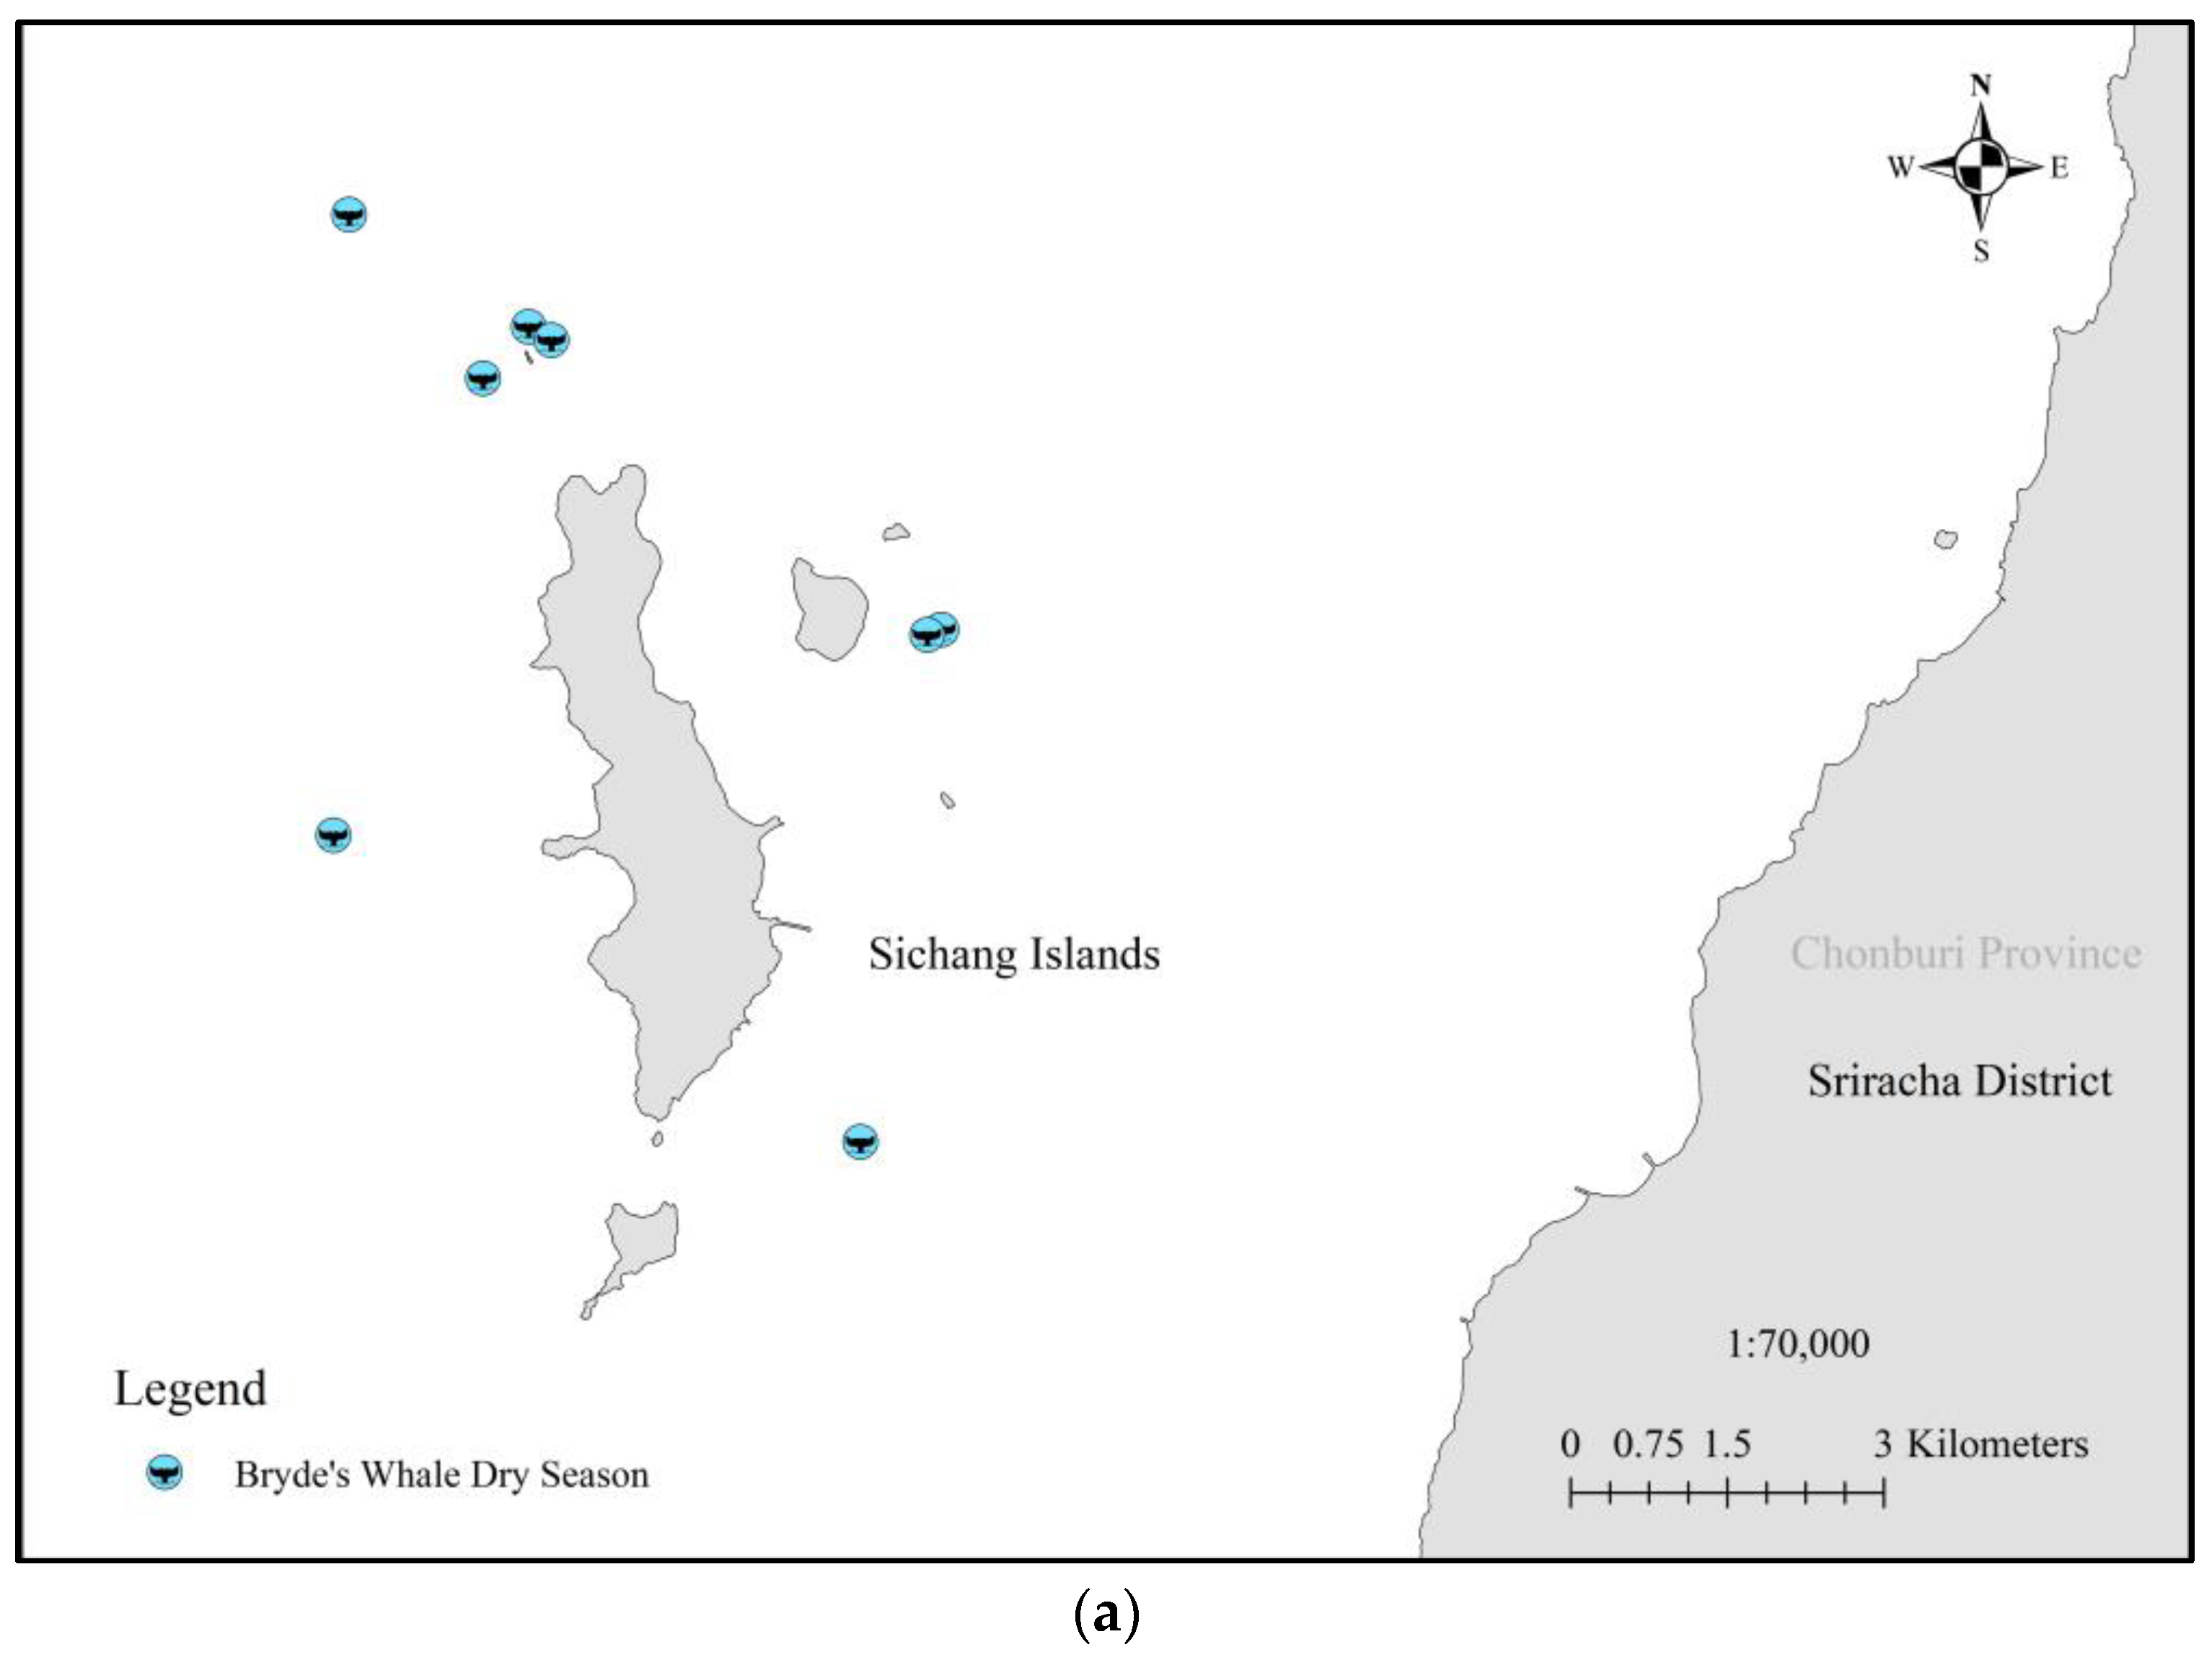
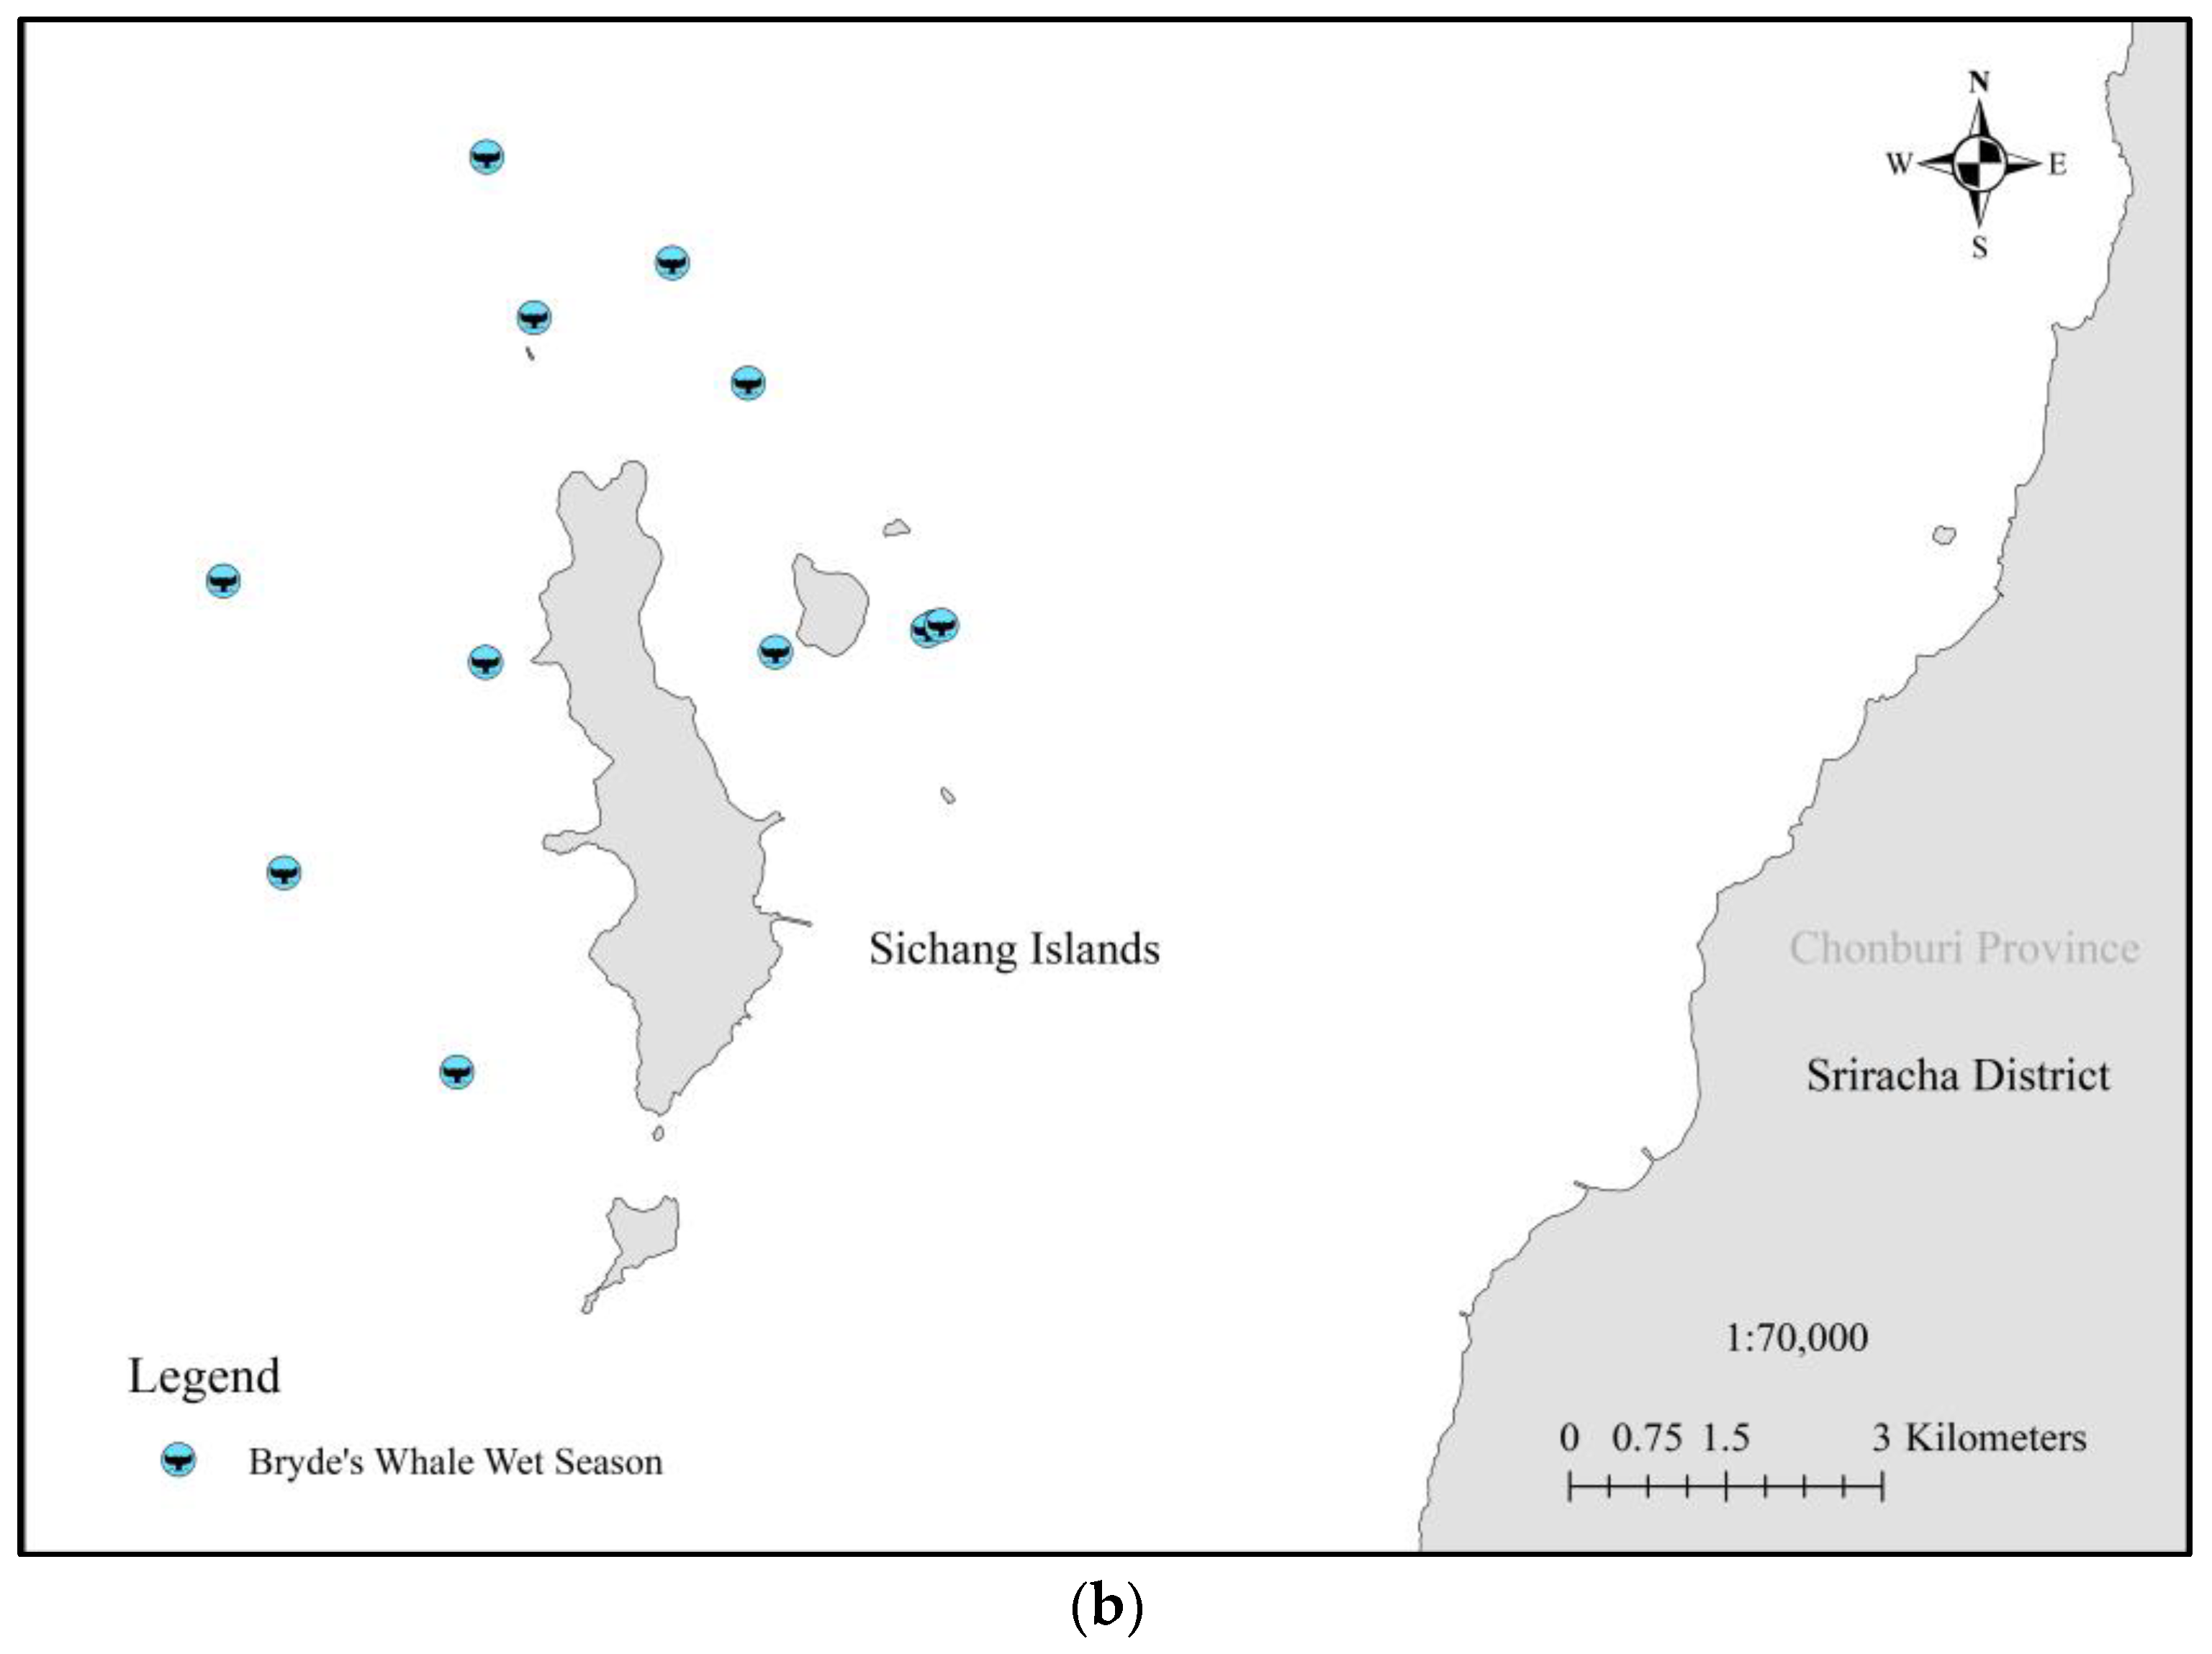
2.1. Study Sites
2.2. Data Collection
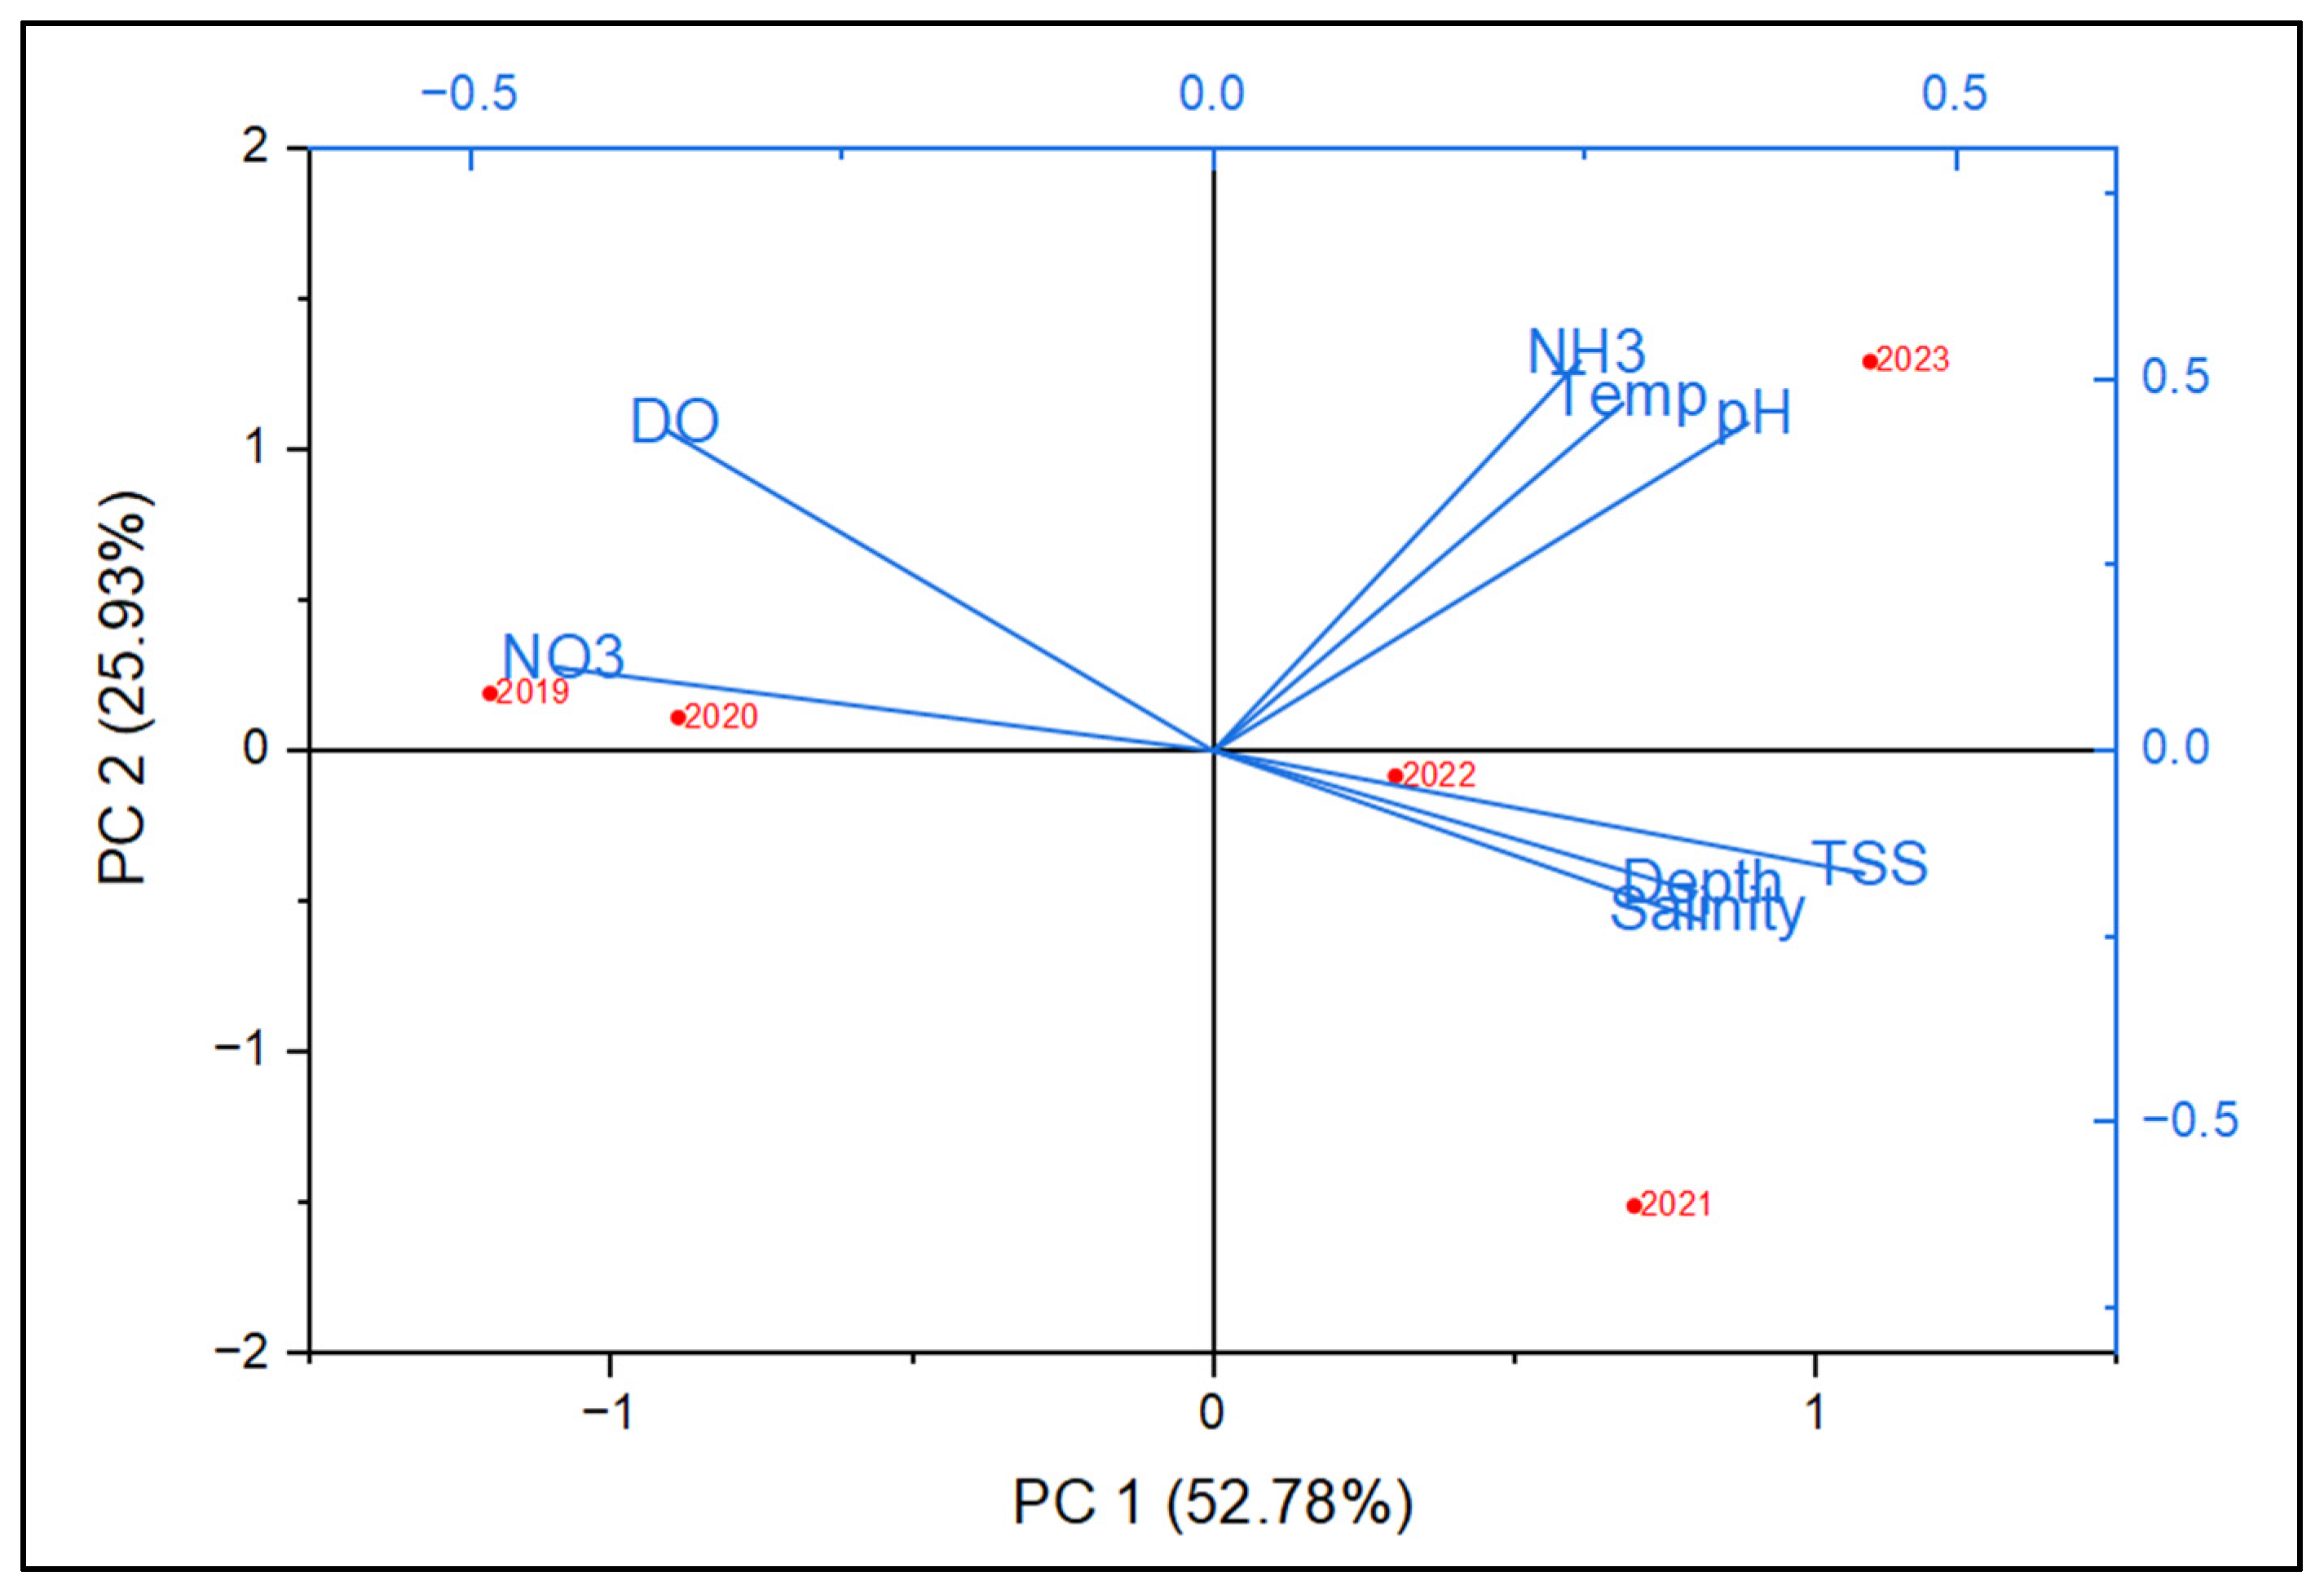
2.2.1. Physical and Biological Data
2.2.2. Human Activities
2.3. Methods
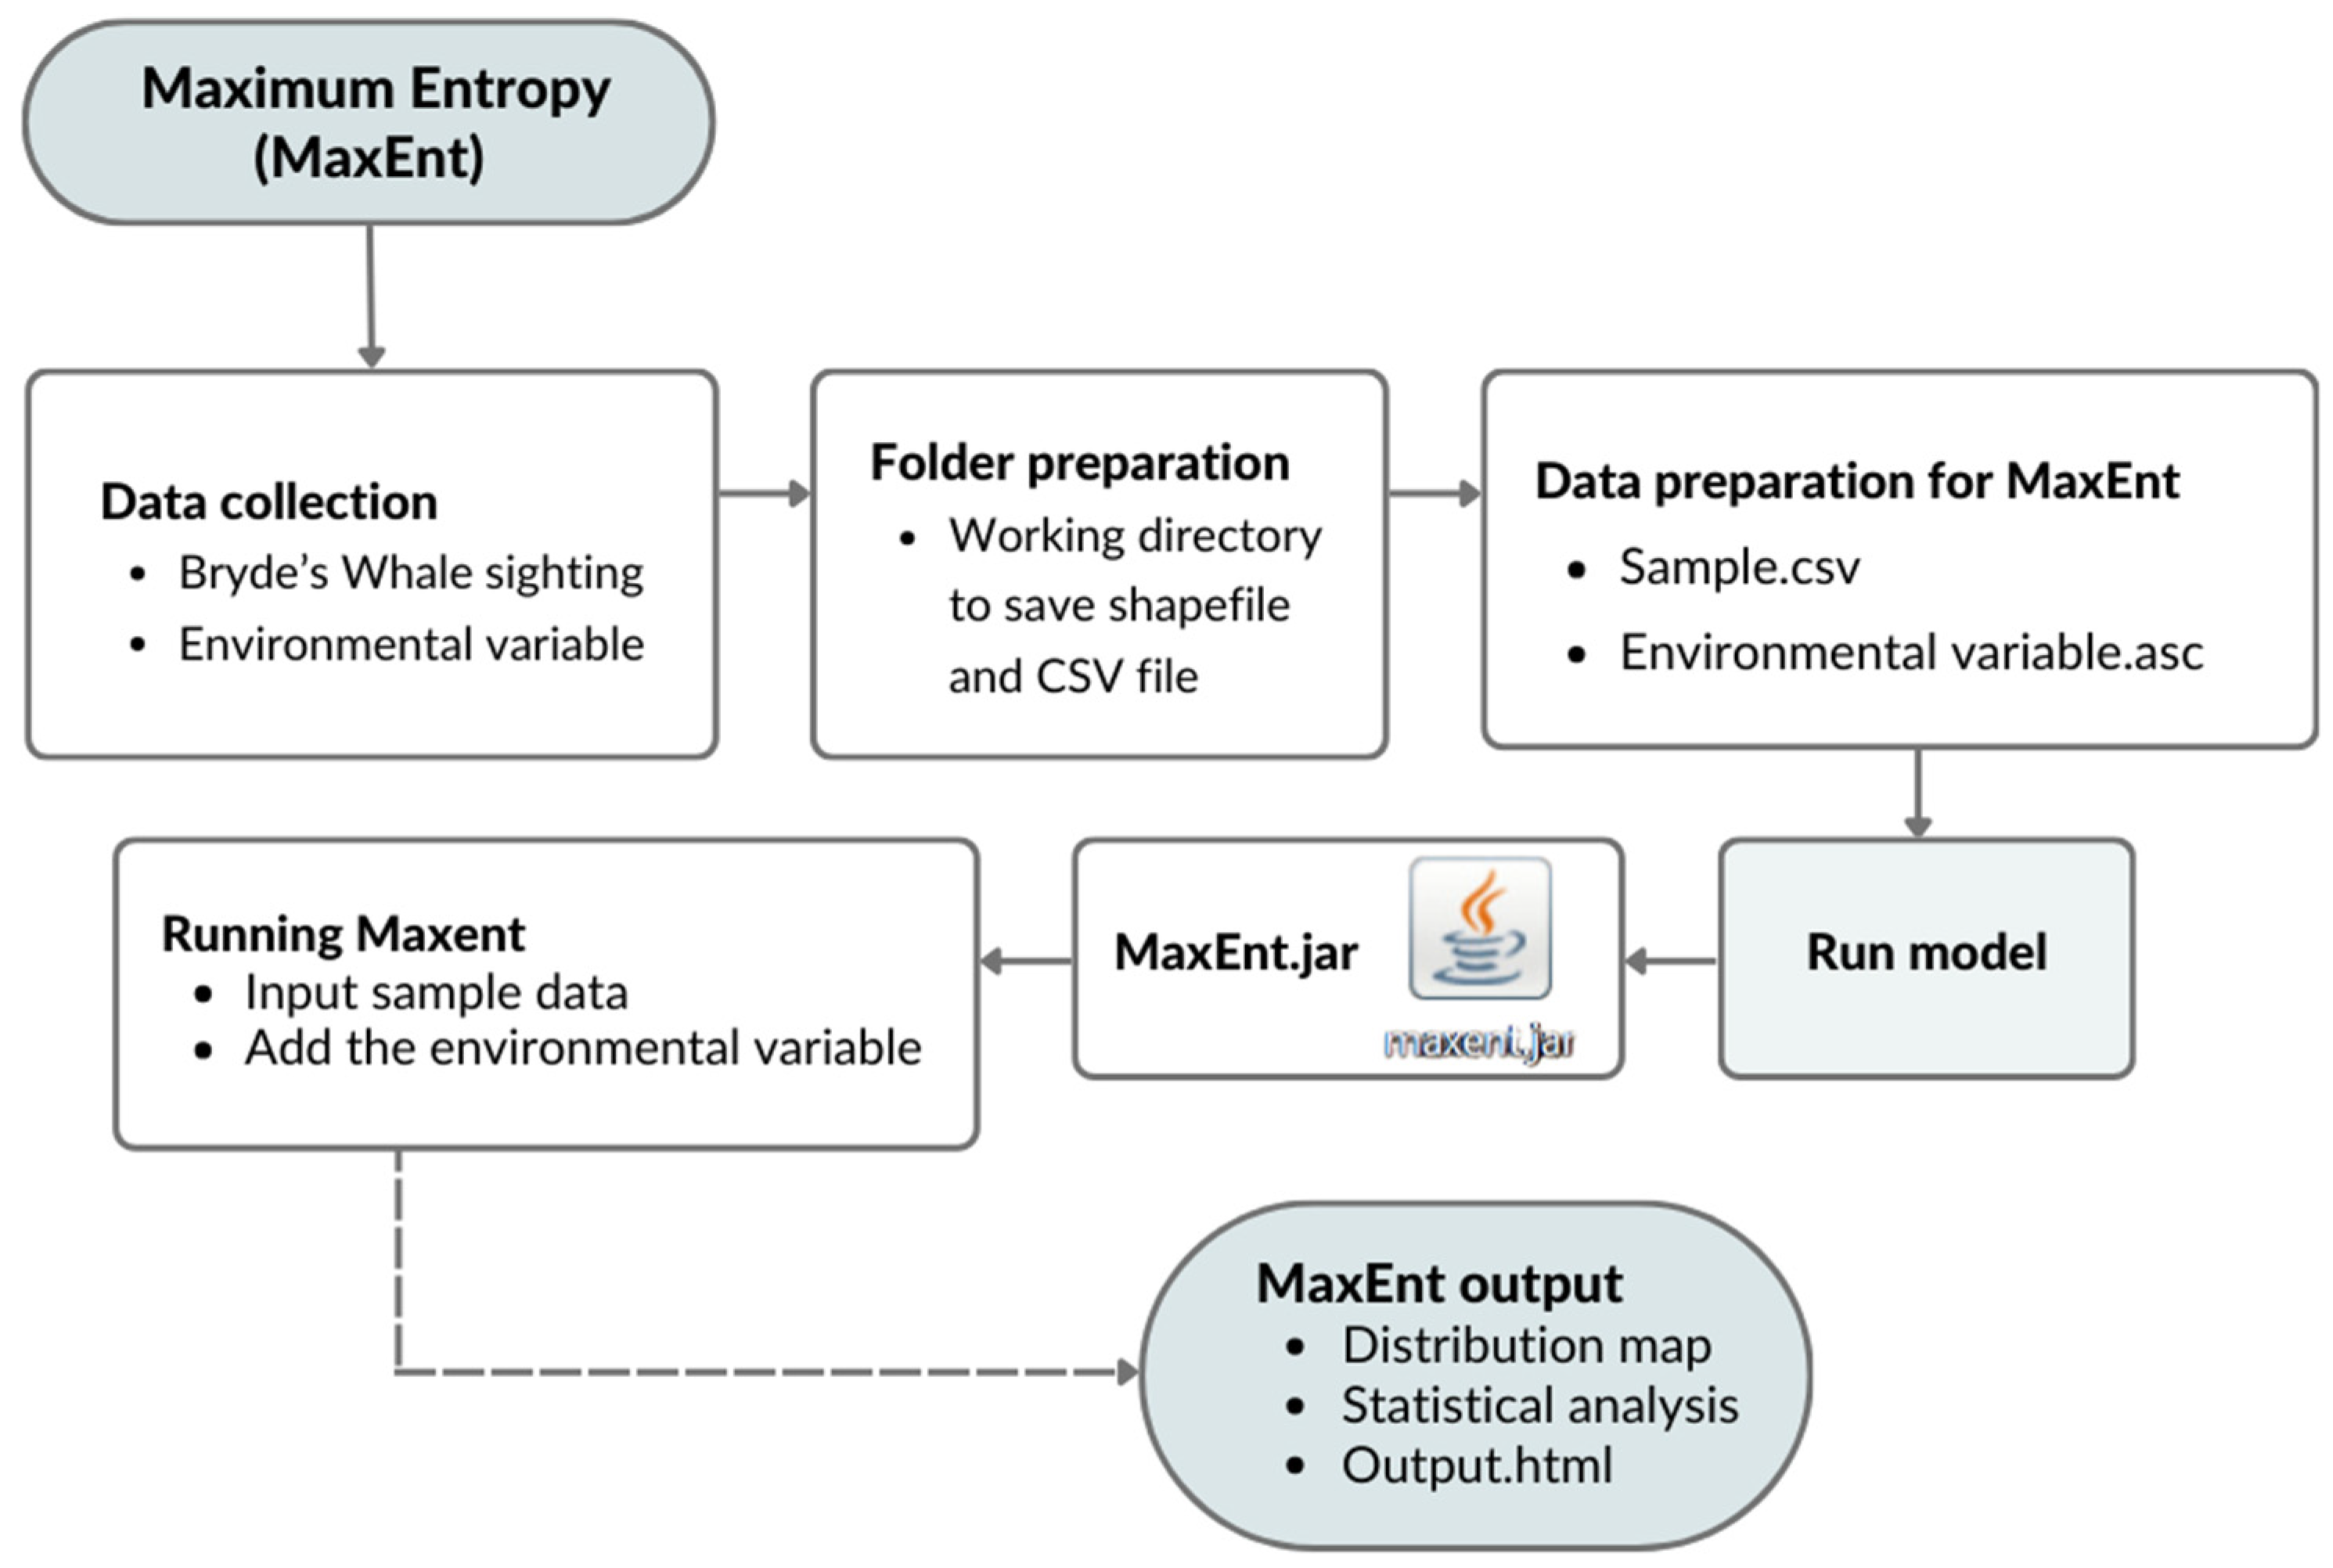
2.3.1. MaxEnt Model
2.3.2. The InVEST Species Risk Assessment (SRA) Model
2.3.3. Uncertainty Standards
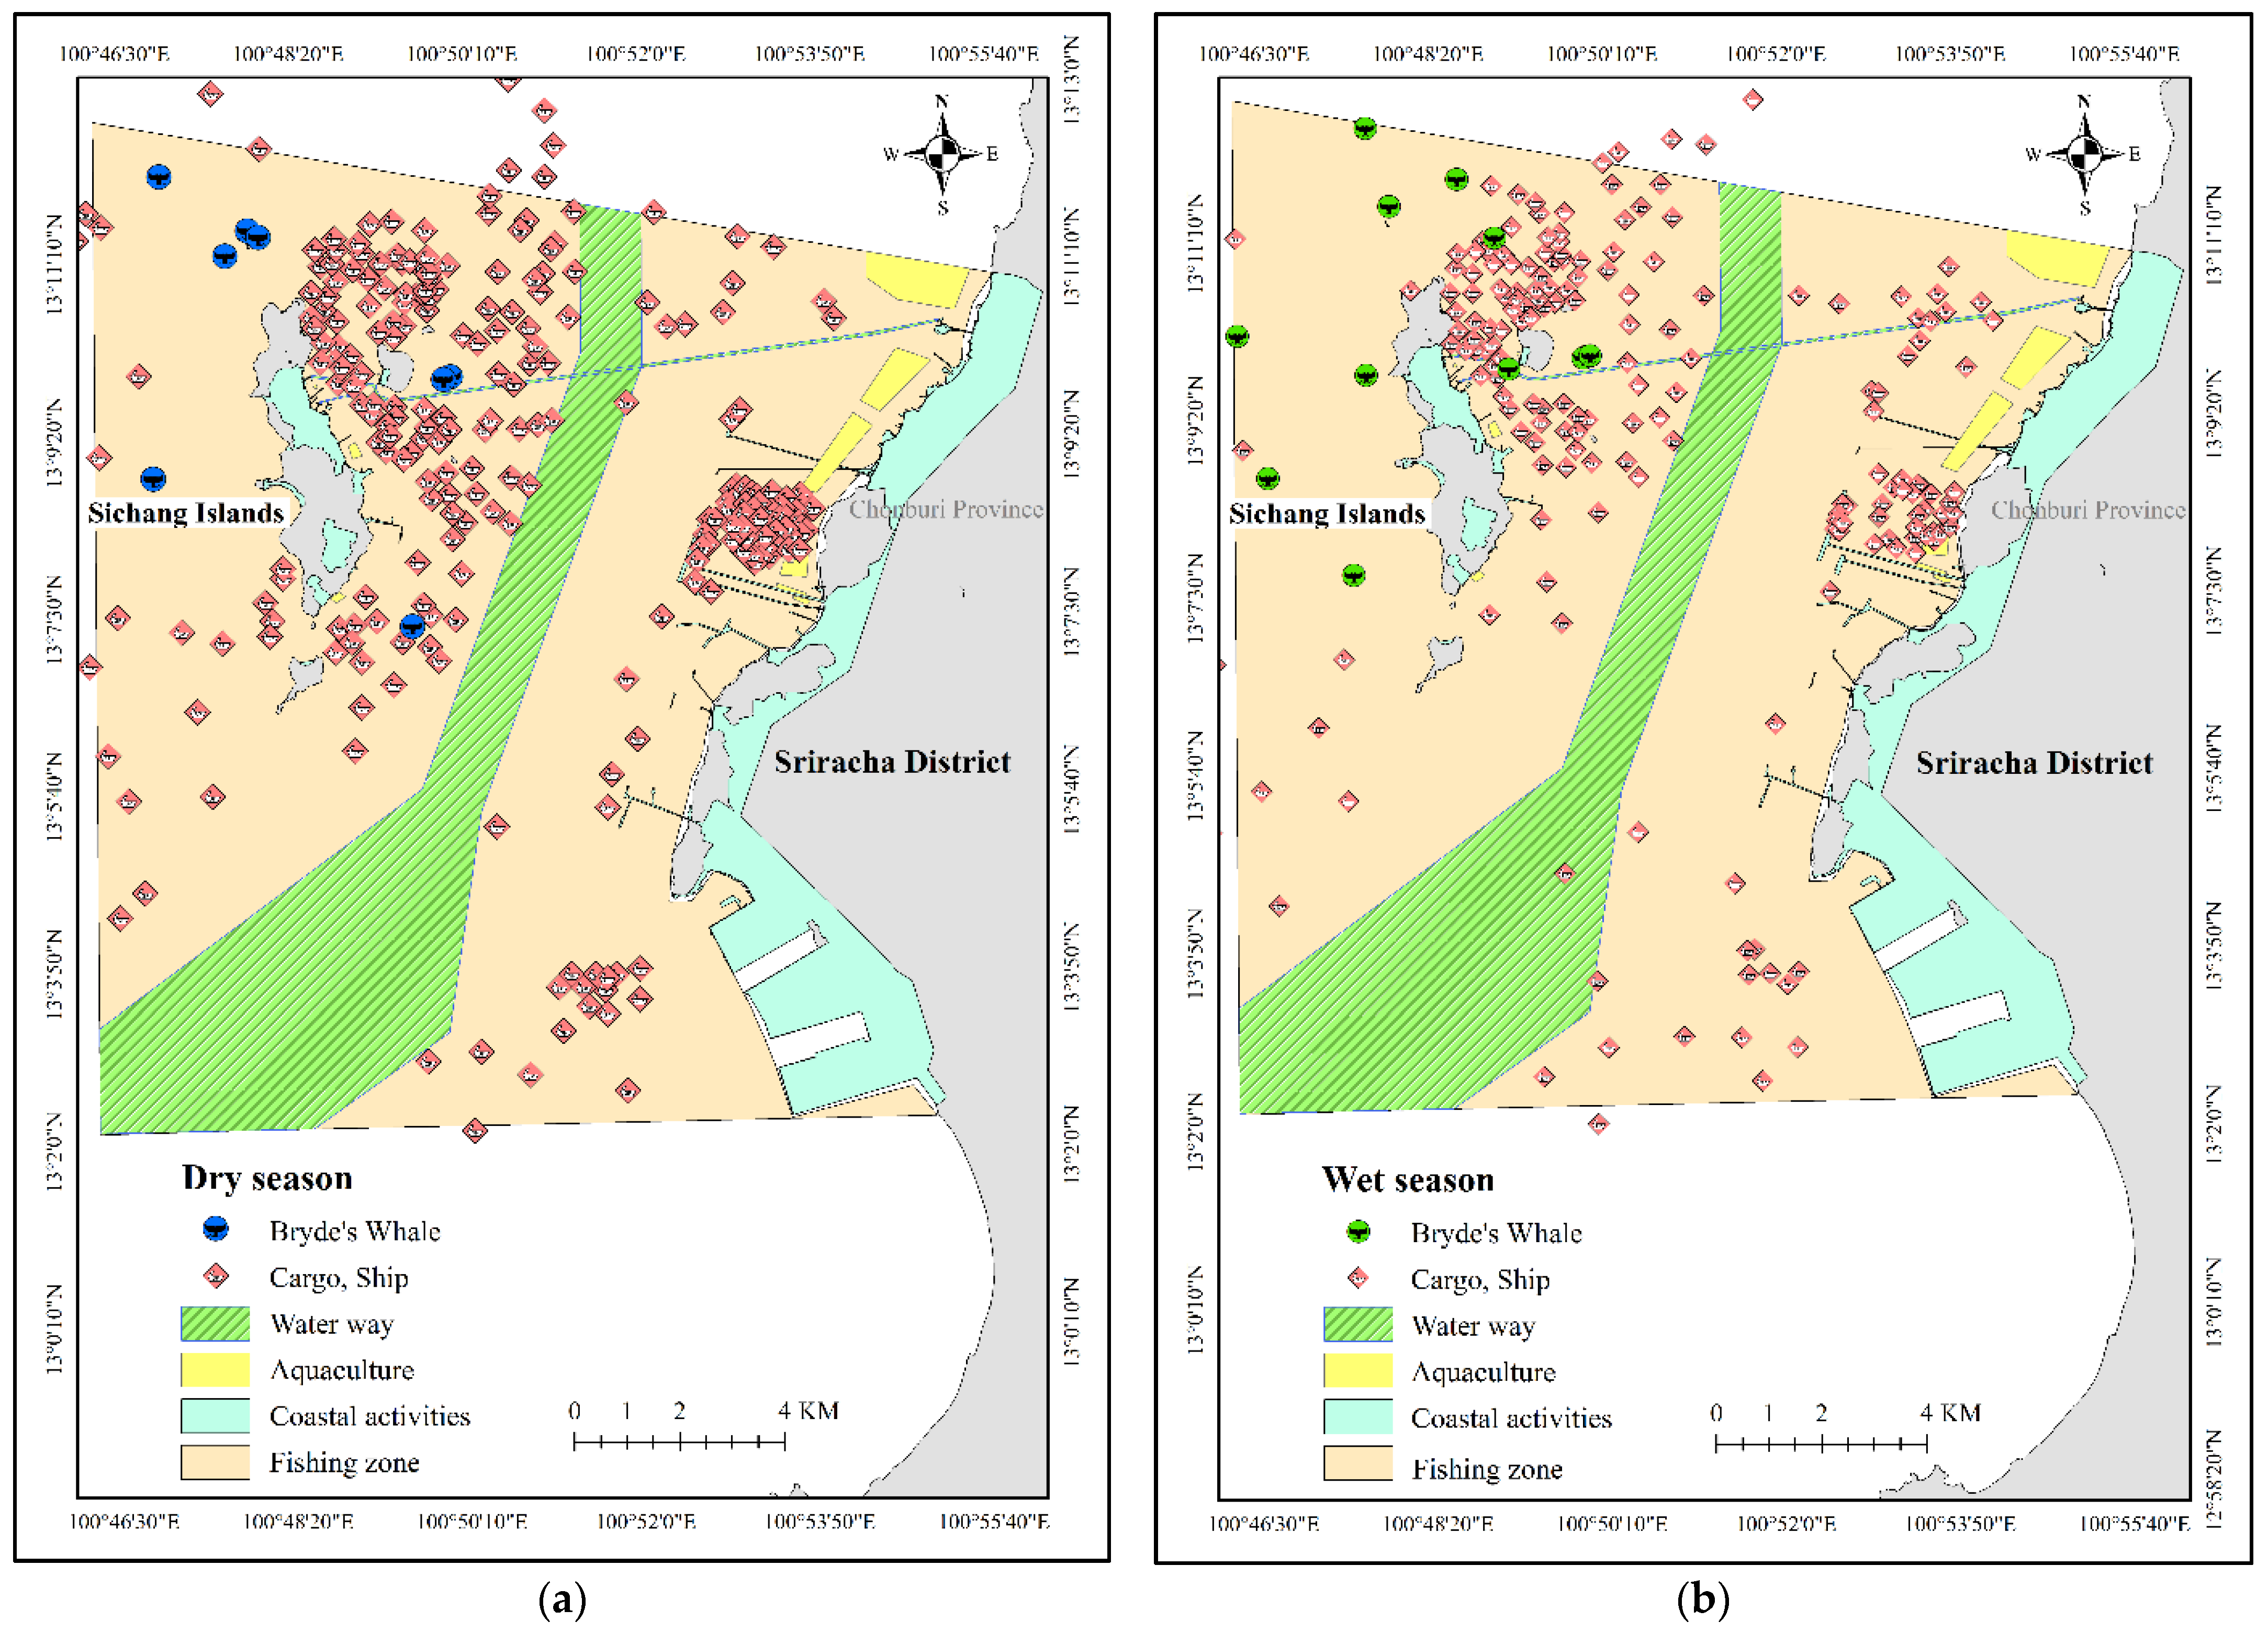
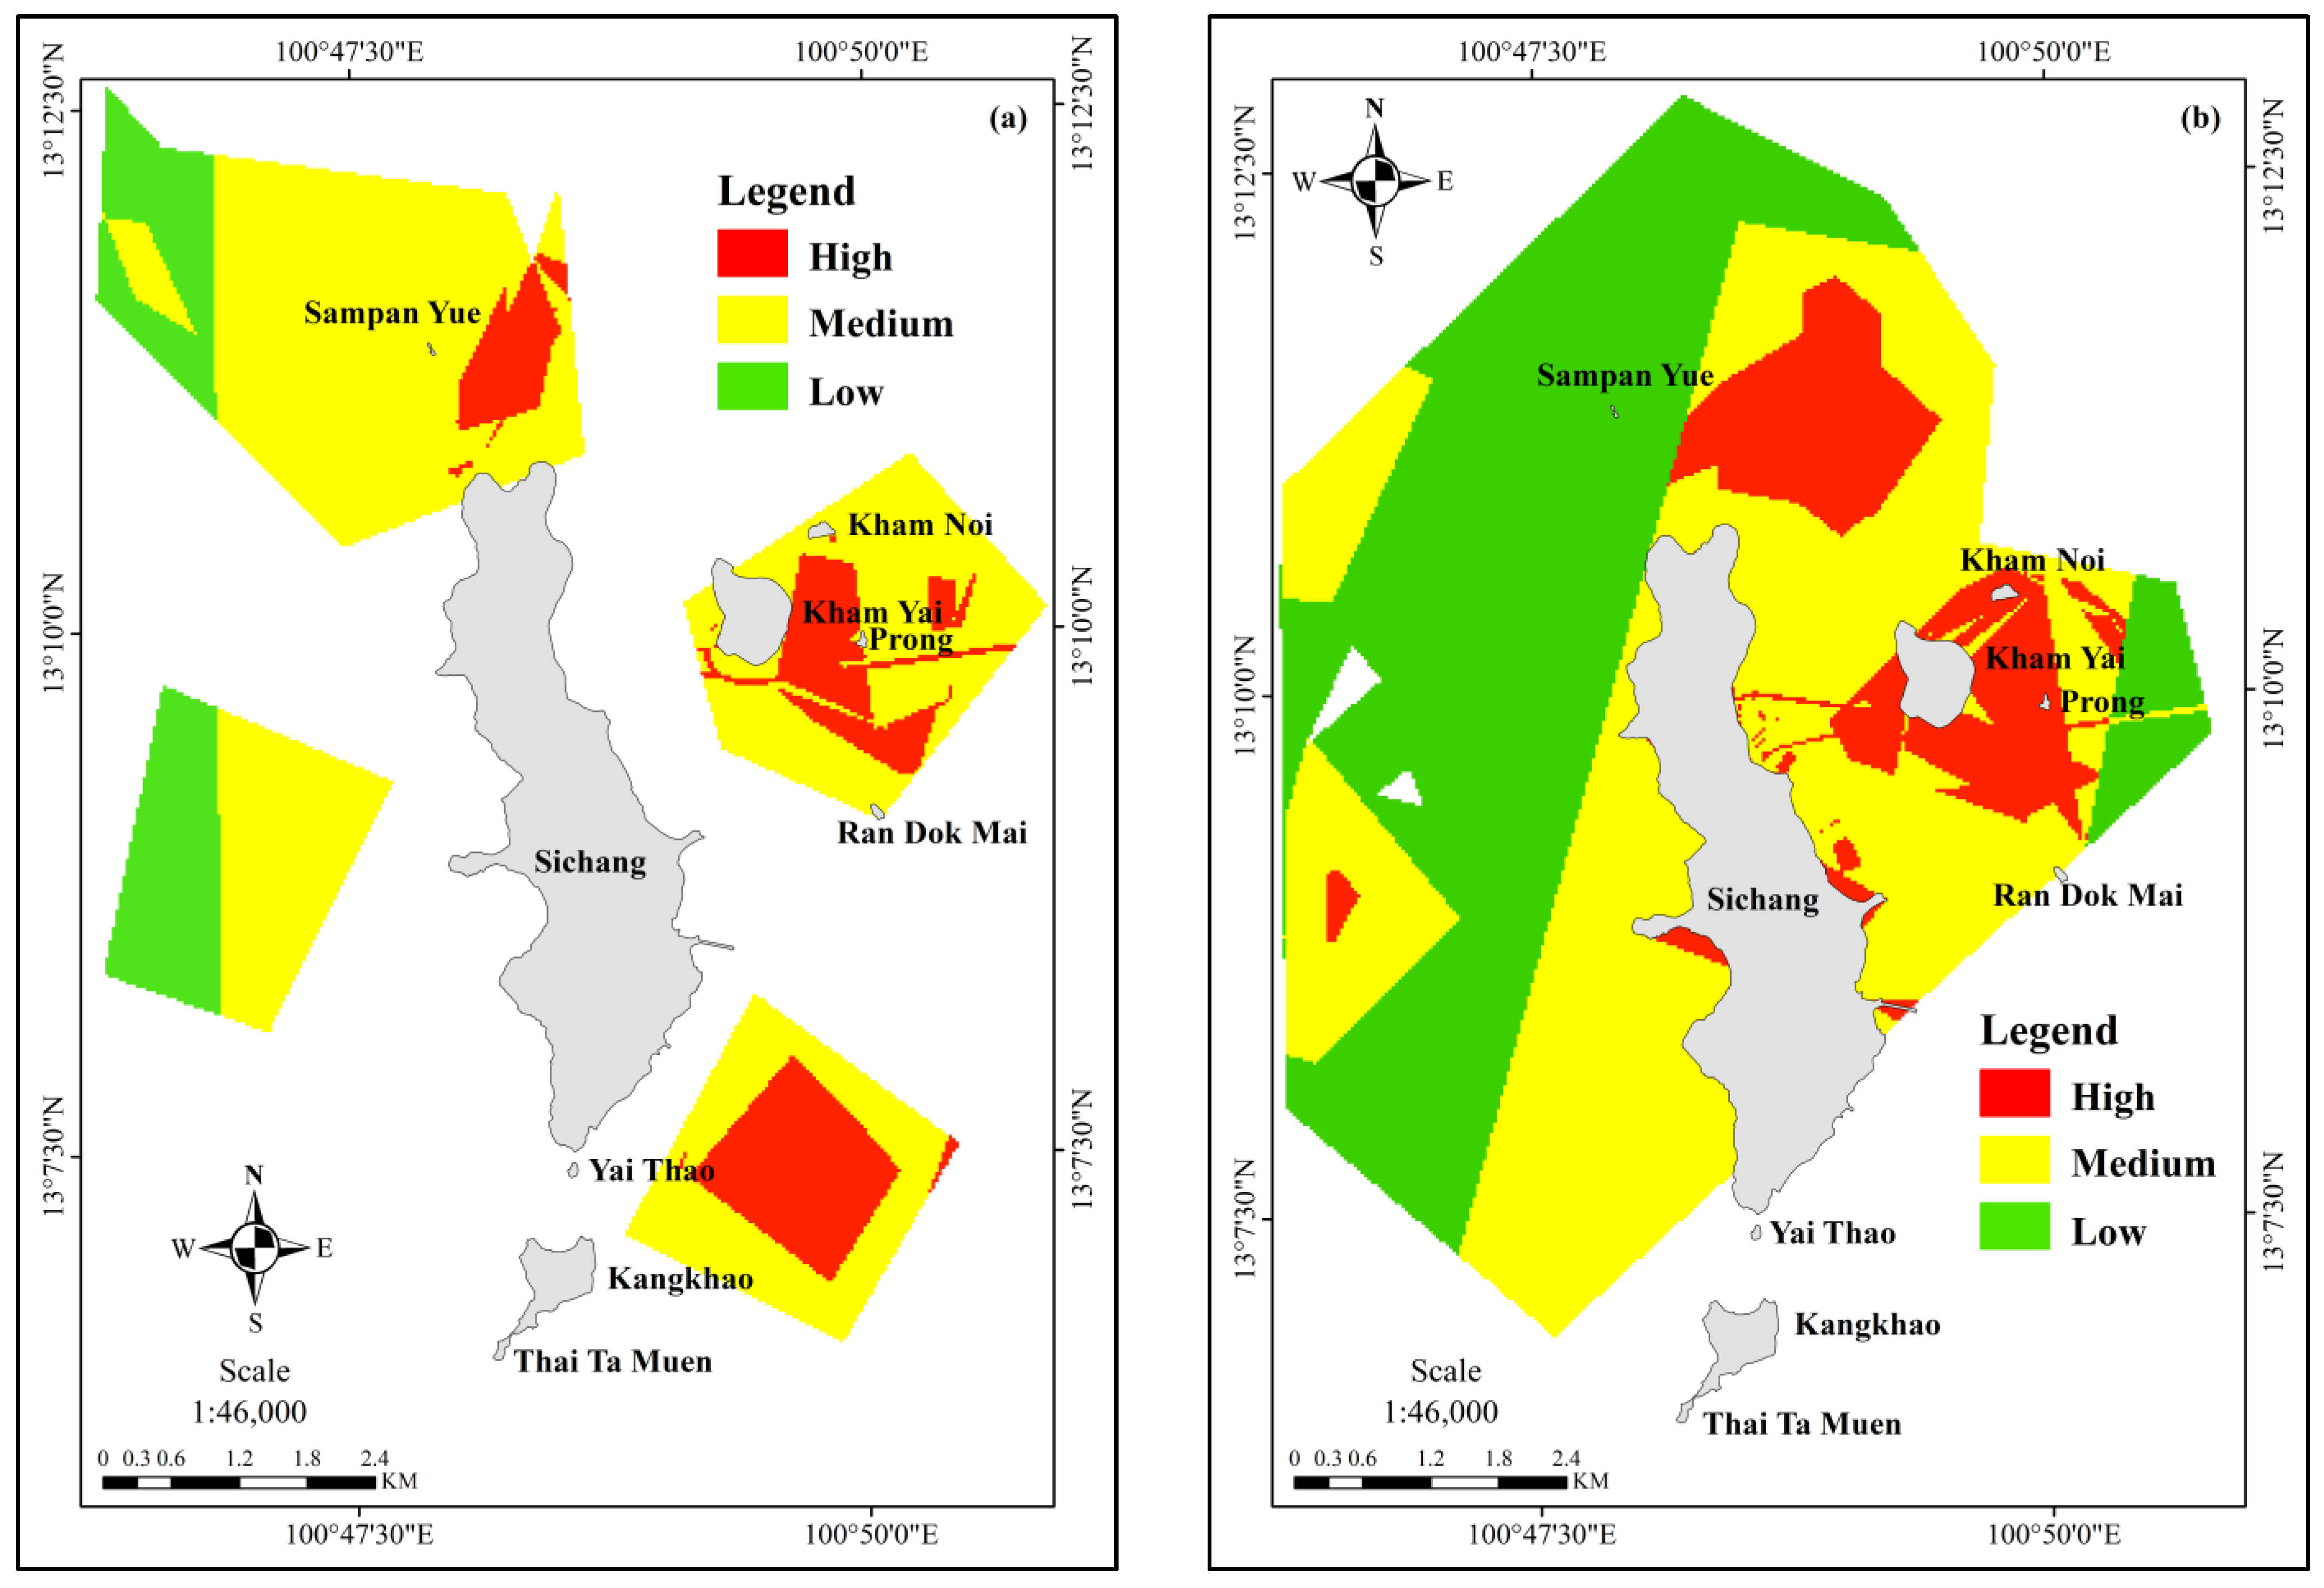
3. Results
3.1. MaxEnt Model Output
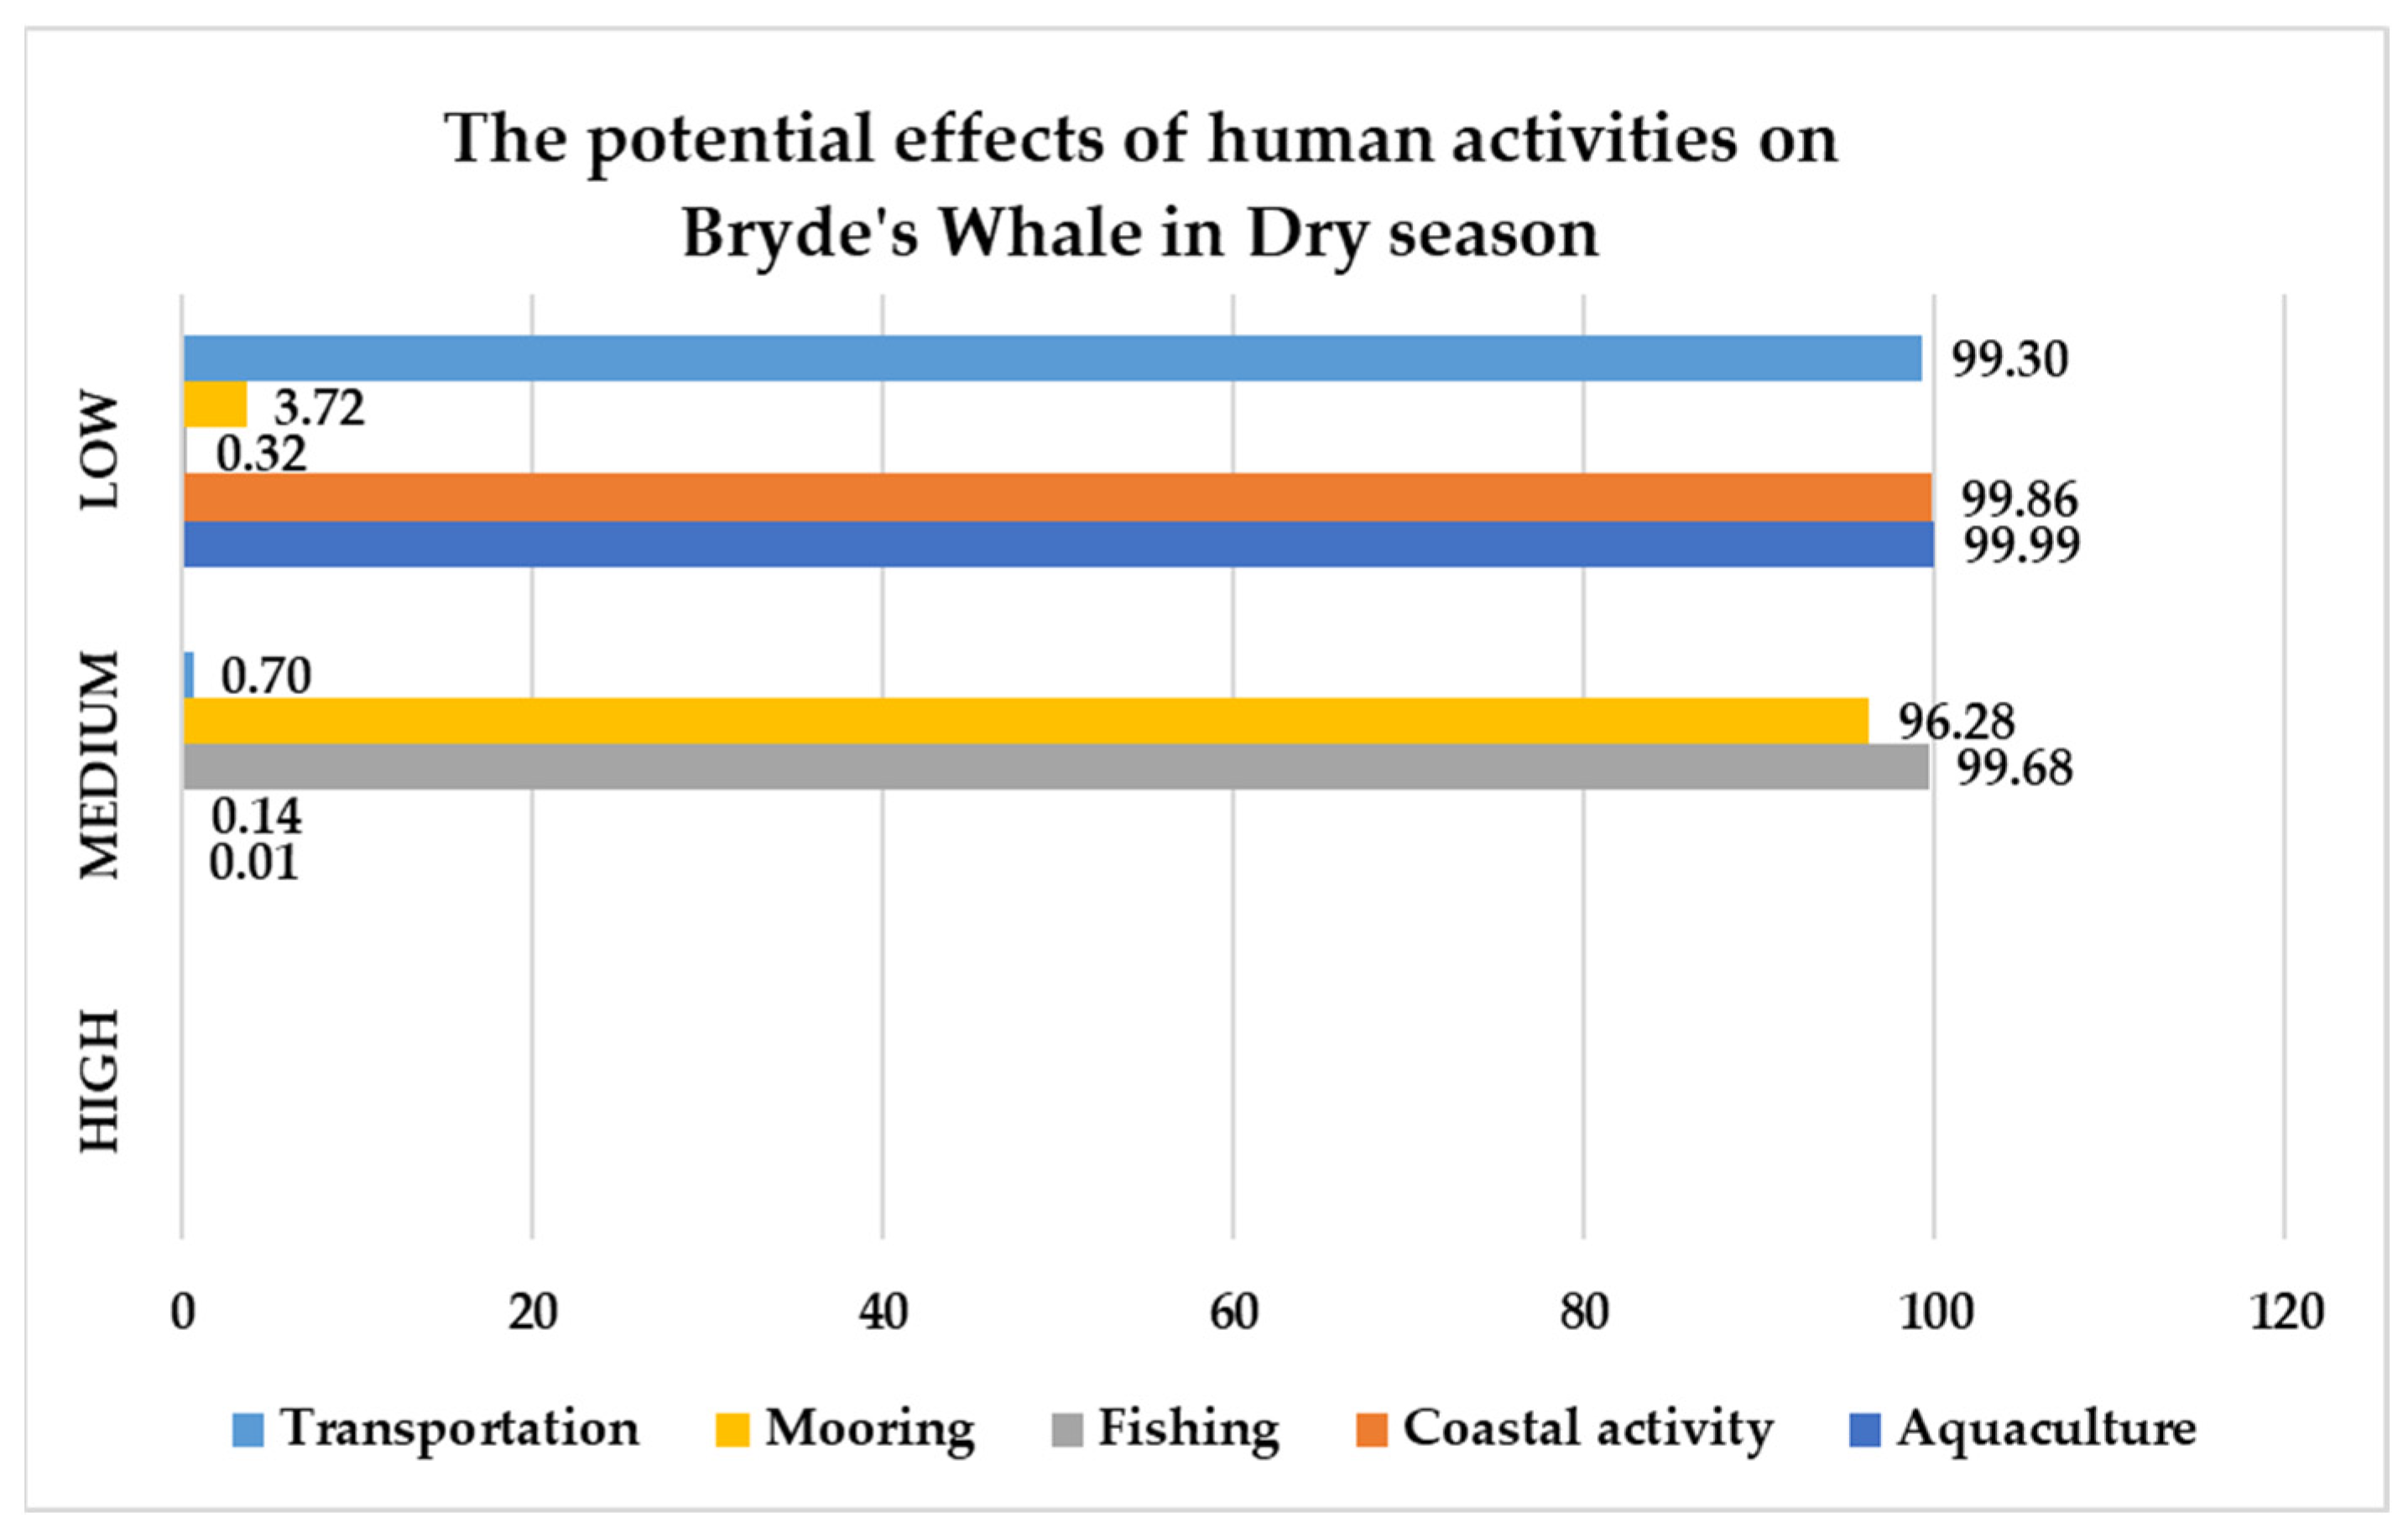
3.2. SRA Model Output
3.3. Uncertainly
4. Discussion
5. Conclusions
Supplementary Materials
Author Contributions
Funding
Data Availability Statement
Acknowledgments
Conflicts of Interest
Abbreviations
| AUC | Area under the curve |
| D | Dry season |
| DMCR | Department of Marine and Coastal resources and Research |
| DO | Dissolved oxygen |
| GIS | Geographic information system |
| InVEST | Integrated Valuation of Ecosystem Services and Trade-offs model |
| MaxEnt | The maximum entropy model |
| MSPs | Marine Spatial Planning |
| MPAs | Marine Protected Areas |
| NH3 | Ammonia |
| NO3 | Nitrate |
| PCA | Principal Component Analysis |
| SRA | Species Risk Assessment |
| SST | Sea surface temperature |
| TSS | Total suspended solids |
| W | Wet season |
References
- Kato, H.; Perrin, W.F. Bryde’s Whale: Balaenoptera edeni. In Encyclopedia of Marine Mammals, 3rd ed.; Würsig, B., Thewissen, J.G.M., Kovacs, K.M., Eds.; Academic Press: Cambridge, MA, USA, 2018; pp. 143–145. [Google Scholar] [CrossRef]
- National Oceanic and Atmospheric Administration (NOAA) Fisheries. Bryde’s Whale. Available online: https://www.fisheries.noaa.gov/species/brydes-whale/resource (accessed on 15 February 2025).
- Patcharaporn, Y.; Threrawat, P.; Rachawadee, C.; Supornchai, R. The Distribution of the Bryde’s Whales’ Diet in the Upper Gulf of Thailand; Upper Gulf of Thailand Marine and Coastal Resources Research Center: Bang Ya Praek, Thailand; Marine and Coastal Resources Research and Development Institute: Bangkok, Thailand, 2023. [Google Scholar]
- Adulyanukosol, K.; Thongsukdee, S.; Passada, S.; Prempree, T.; Wannarangsee, T. Bryde’s Whale in Thailand; EICS Business Co., Ltd.: Bangkok, Thailand; Upper Gulf of Thailand Marine and Coastal Resources Research Center: Bang Ya Praek, Thailand; Marine and Coastal Resources Research and Development Institute: Bangkok, Thailand, 2013. [Google Scholar]
- Thongsukdee, S.; Yaowasooth, P.; Prempree, T.; Rungreung, S.; Chantra, R.; Inthongcome, A. Estimate Bryde’s Whales (Balaenoptera edeni) population in The Gulf of Thailand using Mark and Recapture Method. In Proceedings of the Marine Science Virtual Conference to Support the United Nations Decade of Ocean Science for Sustainable Development, 2021–2030, Online Conference, 1−3 December 2021; pp. 57–64. [Google Scholar]
- Pirotta, V.; Cagnazzi, D.; Dixon, B.; Millar, S.; Millar, J.; Pickering, G.; Butcher, P.A.; Stockin, K.A.; Peters, K.J. Bryde’s whale (Balaenoptera edeni) occurrence and foraging behaviour along the east coast of Australia. N. Z. J. Mar. Freshw. Res. 2024, 1–16. [Google Scholar] [CrossRef]
- Iwata, T.; Akamatsu, T.; Thongsukdee, S.; Cherdsukjai, P.; Adulyanukosol, K.; Sato, K. Tread-water feeding of Bryde’s whales. Curr. Biol. 2017, 27, R1154–R1155. [Google Scholar] [CrossRef] [PubMed]
- Department of Marine and Coastal Resources. The 2018 Marine and Coastal Resources and Coastal Erosion Situations of Thailand; Ministry of Natural Resources and Environment: Bangkok, Thailand, 2018.
- Herbert-Read, J.E.; Thornton, A.; Amon, D.J.; Birchenough, S.N.R.; Côté, I.M.; Dias, M.P.; Godley, B.J.; Keith, S.A.; McKinley, E.; Peck, L.S.; et al. A global horizon scan of issues impacting marine and coastal biodiversity conservation. Nat. Ecol. Evol. 2022, 6, 1262–1270. [Google Scholar] [CrossRef] [PubMed]
- Lonsdale, J.; Blake, S. The need to manage emerging human activities, not just emerging chemicals, in chemical management in the marine environment. Integr. Environ. Assess. Manag. 2023, 19, 857–858. [Google Scholar] [CrossRef]
- IUCN. Human activity devastating marine species from mammals to corals—IUCN Red List. In International Union for Conservation of Nature and Natural Resources; IUCN: Gland, Switzerland, 2022. [Google Scholar]
- Taguchi, M.; Goto, M.; Matsuoka, K.; Tiedemann, R.; Pastene, L.A. Population genetic structure of Bryde’s whales (Balaenoptera brydei) on the central and western North Pacific feeding grounds. Can. J. Fish. Aquat. Sci. 2023, 80, 142–155. [Google Scholar] [CrossRef]
- Soldevilla, M.S.; Hildebrand, J.A.; Frasier, K.E.; Aichinger Dias, L.; Martinez, A.; Mullin, K.D.; Rosel, P.E.; Garrison, L.P. Spatial distribution and dive behavior of Gulf of Mexico Bryde’s whales: Potential risk of vessel strikes and fisheries interactions. Endanger. Species Res. 2017, 32, 533–550. [Google Scholar] [CrossRef]
- Campagna, C.; Short, F.T.; Polidoro, B.A.; McManus, R.; Collette, B.B.; Pilcher, N.J.; Sadovy de Mitcheson, Y.; Stuart, S.N.; Carpenter, K.E. Gulf of Mexico Oil Blowout Increases Risks to Globally Threatened Species. BioScience 2011, 61, 393–397. [Google Scholar] [CrossRef]
- Promotion of Marine and Coastal Resource Management Act B.E. 2558, R.; Gazette Volume 132, P., dated 26 March B.E. 2558(2015). Available online: https://faolex.fao.org/docs/pdf/tha170599.pdf (accessed on 30 January 2025).
- Segre, P.S.; di Clemente, J.; Kahane-Rapport, S.R.; Gough, W.T.; Meÿer, M.A.; Lombard, A.T.; Goldbogen, J.A.; Penry, G.S. High-speed chases along the seafloor put Bryde’s whales at risk of entanglement. Conserv. Sci. Pract. 2022, 4, e12646. [Google Scholar] [CrossRef]
- Tezanos-Pinto, G.; Hupman, K.; Wiseman, N.; Baker, C.; Brooks, L.; Outhwaite, B.; Lea, C.; Stockin, K. Local abundance, apparent survival and site fidelity of Bryde’s whales in the Hauraki Gulf (New Zealand) inferred from long-term photo-identification. Endanger. Species Res. 2017, 34, 61–73. [Google Scholar] [CrossRef]
- Zhang, Y.; Sun, X.; Nong, Z.; Chen, M.; Hao, Y.; Wang, J.; Wang, K.; Wang, D.; Mei, Z. The first baleen whale marine protected area proposed for Bryde’s whales in the Beibu Gulf, China. Mar. Mammal Sci. 2024, 40, e13082. [Google Scholar] [CrossRef]
- Moroz, N.Y.; Platonovskiy, N.; Kapustina, Y.A.; Fedotova, G.V.; Orlova, E.R.; Tsebekova, G.V.; Basanov, V.V. Economic and legal aspects of the protection of natural ecosystems. AIP Conf. Proc. 2023, 2700, 050043. [Google Scholar] [CrossRef]
- Nelms, S.E.; Alfaro-Shigueto, J.; Arnould, J.P.Y.; Avila, I.C.; Bengtson Nash, S.; Campbell, E.; Carter, M.I.D.; Collins, T.; Currey, R.J.C.; Domit, C.; et al. Marine mammal conservation: Over the horizon. Endanger. Species Res. 2021, 44, 291–325. [Google Scholar] [CrossRef]
- Almeida, R.J.; Bonachela, J.A.; Lockwood, J.L. Multiple co-occurring bioeconomic drivers of overexploitation can accelerate rare species extinction risk. J. Appl. Ecol. 2023, 60, 754–763. [Google Scholar] [CrossRef]
- Kazara-Belja, E.; Borg, S.; Attard, F.G.; Vella de Fremeaux, P.M. Research Handbook on Ocean Governance Law. In Chapter 10: Conservation of Living Marine Resources; Edward Elgar Publishing: Cheltenham, UK, 2023; pp. 162–177. [Google Scholar]
- Southall, B.L.; Tollit, D.; Amaral, J.; Clark, C.W.; Ellison, W.T. Managing human activity and marine mammals: A biologically based, relativistic risk assessment framework. Front. Mar. Sci. 2023, 10, 1090132. [Google Scholar] [CrossRef]
- Kennish, M.J. Environmental threats and environmental future of estuaries. Environ. Conserv. 2002, 29, 78–107. [Google Scholar] [CrossRef]
- Dong, L.; Liu, M.; Lin, W.; Li, S. First Suction Cup Tagging on a Small and Coastal Form Bryde’s Whale (Balaenoptera edeni edeni) in China to Investigate Its Dive Profiles and Foraging Behaviours. J. Mar. Sci. Eng. 2022, 10, 1422. [Google Scholar] [CrossRef]
- Burrows, J.; Johnston, D.; Straley, J.; Chenoweth, E.; Ware, C.; Curtice, C.; DeRuiter, S.L.; Friedlaender, A.S. Prey density and depth affect the fine-scale foraging behavior of humpback whales Megaptera novaeangliae in Sitka Sound, Alaska, USA. Mar. Ecol. Prog. Ser. 2016, 561, 245–260. [Google Scholar] [CrossRef]
- Meynecke, J.-O.; de Bie, J.; Barraqueta, J.-L.M.; Seyboth, E.; Dey, S.P.; Lee, S.B.; Samanta, S.; Vichi, M.; Findlay, K.; Roychoudhury, A.; et al. The Role of Environmental Drivers in Humpback Whale Distribution, Movement and Behavior: A Review. Front. Mar. Sci. 2021, 8, 720774. [Google Scholar] [CrossRef]
- Cipriano, G.; Cherubini, C.; Ricci, P.; Catacchio, A.; Fanizza, C.; Saccotelli, L.; Coppini, G.; Maglietta, R.; Carlucci, R. Insights into Environmental Variables Affecting Seasonal Cetacean Behaviors. In Proceedings of the 2024 IEEE International Workshop on Metrology for the Sea; Learning to Measure Sea Health Parameters (MetroSea), Portorose, Slovenia, 14–16 October 2024; pp. 277–282. [Google Scholar]
- Penry, G.S.; Cockcroft, V.G.; Hammond, P.S. Seasonal fluctuations in occurrence of inshore Bryde’s whales in Plettenberg Bay, South Africa, with notes on feeding and multispecies associations. Afr. J. Mar. Sci. 2011, 33, 403–414. [Google Scholar] [CrossRef]
- Salvadeo, C.; Flores-Ramirez, S.; Gomez Gallardo Unzueta, A.; MacLeod, C.; Belda, D.; Jaume-Schinkel, S. Bryde’s whale (Balaenoptera edeni) in the southwestern Gulf of California: Relationship with ENSO variability and prey availability. Cienc. Mar. 2011, 37, 215–225. [Google Scholar] [CrossRef]
- Meister, M.; Schall, E.; Dziak, R.; Spiesecke, S.; Thomisch, K. A multi-year analysis of acoustic occurrence and habitat use of blue and fin whales in eastern and central Fram Strait. PLoS ONE 2024, 19, e0314369. [Google Scholar] [CrossRef] [PubMed]
- Escajeda, E.; Stafford, K.M.; Woodgate, R.A.; Laidre, K.L. Variability in fin whale (Balaenoptera physalus) occurrence in the Bering Strait and southern Chukchi Sea in relation to environmental factors. Deep Sea Res. Part II Top. Stud. Oceanogr. 2020, 177, 104782. [Google Scholar] [CrossRef]
- Purdon, J.; Shabangu, F.W.; Yemane, D.; Pienaar, M.; Somers, M.J.; Findlay, K. Species distribution modelling of Bryde’s whales, humpback whales, southern right whales, and sperm whales in the southern African region to inform their conservation in expanding economies. PeerJ 2020, 8, e9997. [Google Scholar] [CrossRef]
- Huang, J.L.; Leroy, E.C.; Truong, G.; Rogers, T.L. Changes of Oceanic Conditions Drive Chagos Whale Migration Patterns in the Central Indian Ocean. Front. Mar. Sci. 2022, 9, 843875. [Google Scholar] [CrossRef]
- Kerosky, S.M.; Širović, A.; Roche, L.K.; Baumann-Pickering, S.; Wiggins, S.M.; Hildebrand, J.A. Bryde’s whale seasonal range expansion and increasing presence in the Southern California Bight from 2000 to 2010. Deep Sea Res. Part I Oceanogr. Res. Pap. 2012, 65, 125–132. [Google Scholar] [CrossRef]
- Phillips, S.J.; Anderson, R.P.; Schapire, R.E. Maximum entropy modeling of species geographic distributions. Ecol. Model. 2006, 190, 231–259. [Google Scholar] [CrossRef]
- Hacohen-Domené, A.; Martínez-Rincón, R.O.; Galván-Magaña, F.; Cárdenas-Palomo, N.; de la Parra-Venegas, R.; Galván-Pastoriza, B.; Dove, A.D.M. Habitat suitability and environmental factors affecting whale shark (Rhincodon typus) aggregations in the Mexican Caribbean. Environ. Biol. Fishes 2015, 98, 1953–1964. [Google Scholar] [CrossRef]
- Trisurat, Y.; Toxopeus, A.G. Modeling species distribution. In Land Use, Climate Change and Biodiversity Modeling: Perspectives and Applications; IGI Global: Hershey, PA, USA, 2011; pp. 171–197. [Google Scholar]
- Engler, R.; Guisan, A.; Rechsteiner, L. An improved approach for predicting the distribution of rare and endangered species from occurrence and pseudo-absence data. J. Appl. Ecol. 2004, 41, 263–274. [Google Scholar] [CrossRef]
- Sharp, R.; Chaplin-Kramer, R.; Wood, S.; Guerry, A.; Tallis, H.; Ricketts, T.; Nelson, E.; Ennaanay, D.; Wolny, S.; Olwero, N.; et al. InVEST User’s Guide. 2018. Available online: https://www.researchgate.net/publication/323832082_InVEST_User%27s_Guide?channel=doi&linkId=5aad657ea6fdcc1bc0badaab&showFulltext=true (accessed on 30 January 2025).
- Hines, E.; Ponnampalam, L.S.; Junchompoo, C.; Peter, C.; Vu, L.; Huynh, T.; Caillat, M.; Johnson, A.F.; Minton, G.; Lewison, R.L.; et al. Getting to the bottom of bycatch: A GIS-based toolbox to assess the risk of marine mammal bycatch. Endanger. Species Res. 2020, 42, 37–57. [Google Scholar] [CrossRef]
- Merow, C.; Smith, M.J.; Silander, J.A., Jr. A practical guide to MaxEnt for modeling species’ distributions: What it does, and why inputs and settings matter. Ecography 2013, 36, 1058–1069. [Google Scholar] [CrossRef]
- Verutes, G.M.; Johnson, A.F.; Caillat, M.; Ponnampalam, L.S.; Peter, C.; Vu, L.; Junchompoo, C.; Lewison, R.L.; Hines, E.M. Using GIS and stakeholder involvement to innovate marine mammal bycatch risk assessment in data-limited fisheries. PLoS ONE 2020, 15, e0237835. [Google Scholar] [CrossRef]
- Li, k.; Lin, Y. Research on Data Quality Evaluation and Comprehensive Analysis Decision-Making under the Integration of Regulation and Control. Highlights Sci. Eng. Technol. 2022, 1, 40–46. [Google Scholar] [CrossRef]
- Kalle, R.; Ramesh, T.; Qureshi, Q.; Sankar, K. Predicting the distribution pattern of small carnivores in response to environmental factors in the Western Ghats. PLoS ONE 2013, 8, e79295. [Google Scholar] [CrossRef]
- AlRuheili, A.; Boluwade, A. Towards Quantifying the Coastal Vulnerability Due to Natural Hazards Using the Invest Coastal Vulnerability Model. Water 2023, 15, 380. [Google Scholar] [CrossRef]
- Cherdsukjai, P.; Thongsukdee, S.; Passada, S.; Prempree, T. Mark and recapture population sizes of bryde’s whale (balaenoptera edeni) in the upper gulf of thailand, estimated by mark and recapture method. In Proceedings of the Design Symposium on Conservation of Ecosystem Volume 3 (The 14th SEASTAR2000 Workshop); Prince of Songkla University: Songkla, Thailand, 2014. [Google Scholar]
- Fanela, M.A.P.; Takarina, N.D.; Supriatna. Distribution of total suspended solids (TSS) and chlorophyll-a in Kendari Bay, Southeast Sulawesi. J. Phys. Conf. Ser. 2019, 1217, 012150. [Google Scholar] [CrossRef]
- Na-U-Dom, T.; Buranapratheprat, A.; Homhual, K.; Intracharoen, P. Temporal and Spatial Variations of Water Qualities in the Upper Gulf of Thailand During Two Seasons in 2009. Burapha Sci. J. 2009, 18, 32–42, (In Thai with English Abstract). [Google Scholar]
- Ibrahim, E.; Zaher, S.; Ibrahim, W.; Mosad, Y. Phytoplankton dynamics in relation to Red tide appearance in Qarun Lake, Egypt. Egypt. J. Aquat. Res. 2021, 47, 293–300. [Google Scholar] [CrossRef]
- Domingues, R.B.; Barbosa, A.B.; Sommer, U.; Galvão, H.M. Ammonium, nitrate and phytoplankton interactions in a freshwater tidal estuarine zone: Potential effects of cultural eutrophication. Aquat. Sci. 2011, 73, 331–343. [Google Scholar] [CrossRef]
- Izadi, S.; Aguilar de Soto, N.; Constantine, R.; Johnson, M. Feeding tactics of resident Bryde’s whales in New Zealand. Mar. Mammal Sci. 2022, 38, 1104–1117. [Google Scholar] [CrossRef]
- Whitehouse, M.J.; Atkinson, A.; Rees, A.P. Close coupling between ammonium uptake by phytoplankton and excretion by Antarctic krill, Euphausia superba. Deep Sea Res. Part I Oceanogr. Res. Pap. 2011, 58, 725–732. [Google Scholar] [CrossRef]
- Zhang, T.-X.; Li, M.-R.; Liu, C.; Wang, S.-P.; Yan, Z.-G. A review of the toxic effects of ammonia on invertebrates in aquatic environments. Environ. Pollut. 2023, 336, 122374. [Google Scholar] [CrossRef] [PubMed]
- Mahaffey, C.; Palmer, M.; Greenwood, N.; Sharples, J. Impacts of climate change on dissolved oxygen concentration relevant to the coastal and marine environment around the UK. MCCIP Sci. Rev. 2020, 31–53. [Google Scholar] [CrossRef]
- Yu, Z.; Wong, M.K.-S.; Inoue, J.; Ahmed, S.I.; Higuchi, T.; Hyodo, S.; Itoh, S.; Komatsu, K.; Saito, H.; Ito, S.-i. Environmental DNA in the Kuroshio reveals environment-dependent distribution of economically important small pelagic fish. Front. Mar. Sci. 2023, 10, 1121088. [Google Scholar] [CrossRef]
- Raluekmul, N.; Jarayabhand, P. Problems and guideline for solving on marine garbagefrom maritime industry from cargo vessels and barges inkoh sichang anchorage area, Chonburi. J. Grad. Sch. Commer.-Burapha Rev. 2019, 14, 141–155. Available online: https://so02.tci-thaijo.org/index.php/GSC/article/view/199763 (accessed on 30 January 2025).
- Fossi, M.C.; Baini, M.; Simmonds, M.P. Cetaceans as Ocean Health Indicators of Marine Litter Impact at Global Scale. Front. Environ. Sci. 2020, 8, 586627. [Google Scholar] [CrossRef]
- Jog, K.; Sutaria, D.; Diedrich, A.; Grech, A.; Marsh, H. Marine Mammal Interactions With Fisheries: Review of Research and Management Trends Across Commercial and Small-Scale Fisheries. Front. Mar. Sci. 2022, 9, 758013. [Google Scholar] [CrossRef]
- Akkaya, A.; Awbery, T.; Bakiu, R.; Beqiri, K.; Geijer, C.K.A.; Glarou, M.; Kerametsidis, G.; Nikpaljevic, N. Using off-the-shelf GPS loggers to assess co-occurrence between marine mammals and small-scale fisheries: A pilot study from the Mediterranean Sea. J. Mar. Biol. Assoc. UK 2022, 102, 322–332. [Google Scholar] [CrossRef]
- Priddel, D.; Wheeler, R. Rescue of a Bryde’s Whale Balaenoptera edeni entrapped in the Manning River, New South Wales: Unmitigated success or unwarranted intervention? Aust. Zool. 2014, 30, 261–271. [Google Scholar] [CrossRef]
- Othumpangat, S.; Fedan, J.S. Oil spills. In Encyclopedia of Toxicology, 4th ed.; Wexler, P., Ed.; Academic Press: Oxford, UK, 2024; pp. 79–83. [Google Scholar] [CrossRef]
- Coastal Resources Conservation Division. The Project Establishes a Stakeholder Participation Process and Creates a Plan to Define the Use Zone for Marine and Coastal Resources. Ready to Prepare a Utilization Map and Spatial Management Plan. (Koh Sichang Area Chonburi Province); Faculty of Marine Technology, Burapha University: Saen Suk, Thailand, 2023. [Google Scholar]
- Vinijchai, A. Legal Measures on the Protection of Bryde’s Whale; Thammasat University: Bangkok, Thailand, 2017. [Google Scholar]
- Fiedler, P.C.; Redfern, J.V.; Forney, K.A.; Palacios, D.M.; Sheredy, C.; Rasmussen, K.; García-Godos, I.; Santillán, L.; Tetley, M.J.; Félix, F.; et al. Prediction of Large Whale Distributions: A Comparison of Presence–Absence and Presence-Only Modeling Techniques. Front. Mar. Sci. 2018, 5, 419. [Google Scholar] [CrossRef]


| No | Date | Season | Lat | Group Size | Data Source | Behavior |
|---|---|---|---|---|---|---|
| 1 | 22 May 2019 | Dry | 13.20111, 100.7827 | 2 | Social Report | Feeding |
| 2 | 26 May 2019 | Wet | 13.19218, 100.7985 | 2 | Social Report | Feeding |
| 3 | 1 June 2019 | Wet | 13.20566, 100.7944 | 1 | Survey | Feeding |
| 4 | 20 July 2019 | Wet | 13.16322, 100.7944 | 2 | Social Report | Feeding |
| 5 | 2 September 2019 | Wet | 13.17006, 100.7717 | 2 | Survey | Feeding |
| 6 | 4 September 2019 | Wet | 13.18666, 100.817 | 3 | Survey | Feeding |
| 7 | 5 September 2019 | Wet | 13.1288, 100.7919 | 2 | Survey | Feeding |
| 8 | 9 September 2019 | Wet | 13.19679, 100.8104 | 3 | Social Report | Feeding |
| 9 | 10 March 2020 | Dry | 13.16632, 100.8337 | 2 | Social Report | Feeding |
| 10 | 9 April 2020 | Dry | 13.1659, 100.8325 | 1 | Social Report | Swimming |
| 11 | 27 May 2020 | Wet | 13.14556, 100.7769 | 3 | Social Report | Feeding |
| 12 | 20 August 2020 | Wet | 13.16624, 100.8331 | 3 | Social Report | Feeding |
| 13 | 4 September 2020 | Wet | 13.1659, 100.8325 | 1 | Social Report | Swimming |
| 14 | 3 October 2020 | Wet | 13.16632, 100.8337 | 2 | Social Report | Feeding |
| 15 | 22 January 2021 | Dry | 13.14909, 100.7813 | 2 | Social Report | Swimming |
| 16 | 4 February 2021 | Dry | 13.1234, 100.8267 | 1 | Social Report | Swimming |
| 17 | 28 April 2021 | Dry | 13.19172, 100.7982 | 4 | Social Report | Feeding |
| 18 | 29 June 2021 | Wet | 13.1641, 100.8193 | 1 | Social Report | Swimming |
| 19 | 30 April 2022 | Dry | 13.18739, 100.7942 | 2 | Social Report | Feeding |
| 20 | 21 March 2023 | Dry | 13.19058, 100.8001 | 1 | Social Report | Feeding |
| Water Quality (Dry Season) | 2019 | 2020 | 2021 | 2022 | 2023 |
| Total depth (m) | 2.17 ± 2.95 | 6.06 ± 2.14 | 6.36 ± 2.74 | 5.73 ± 2.57 | 6.77 ± 1.57 |
| Temp (°C) | 30.02 ± 1 | 30.08 ± 0.75 | 30.10 ± 2.06 | 28.35 ± 1.12 | 29.02 ± 0.82 |
| pH | 7.92 ± 0.15 | 7.99 ± 0.06 | 7.96 ± 0.09 | 7.98 ± 0.06 | 7.99 ± 0.04 |
| Salinity | 31.75 ± 1.08 | 32.51 ± 0.83 | 32.15 ± 0.76 | 32.02 ± 0.12 | 31.82 ± 0.52 |
| Dissolved oxygen (mg/L) | 6.66 ± 0.66 | 6.32 ± 0.45 | 6.32 ± 0.59 | 6.74 ± 0.58 | 7.93 ± 0.04 |
| Total suspended solids (mg/L) | 50.36 ± 32.39 | 15.6 ± 2.76 | 21.44 ± 8.75 | 12.24 ± 3.60 | 6.22 ± 0.51 |
| Nitrate (ug-at/L) | 2.57 ± 2.79 | 0.36 ± 0.37 | 0.36 ± 0.41 | 0.23 ± 0.30 | 14.20 ± 4.08 |
| Ammonia (ug-at/L) | 0.75 ± 1.89 | 0.38 ± 1.11 | 0.59 ± 069 | 0.31 ± 0.25 | 0.40 ± 0.27 |
| Water Quality (Wet Season) | 2019 | 2020 | 2021 | 2022 | 2023 |
| Total depth (m) | 2.12 ± 2.84 | 5.71 ± 1.90 | 6.27 ± 2.64 | 5.59 ± 1.05 | 5.48 ± 2.05 |
| Temp (°C) | 30.11 ± 0.91 | 29.84 ± 0.61 | 29.92 ± 0.49 | 30.37 ± 0.25 | 30.58 ± 0.57 |
| pH | 7.90 ± 0.30 | 7.95 ± 0.04 | 7.94 ± 0.12 | 7.98 ± 0.07 | 8.07 ± 0.06 |
| Salinity | 30.14 ± 3.91 | 26.99 ± 2.18 | 32.16 ± 1.29 | 30.87 ± 1.30 | 30.85 ± 1.46 |
| Dissolved oxygen (mg/L) | 6.97 ± 2.23 | 6.83 ± 0.48 | 5.25 ± 0.48 | 6.40 ± 0.64 | 6.24 ± 0.44 |
| Total suspended solids (mg/L) | 10.87 ± 3.21 | 9.77 ± 2.77 | 18.65 ± 8.38 | 13.71 ± 2.83 | 16.42 ± 3.85 |
| Nitrate (ug-at/L) | 1.31 ± 1.66 | 1.73 ± 0.73 | 0.47 ± 0.67 | 0.70 ± 0.56 | 0.53 ± 0.85 |
| Ammonia (ug-at/L) | 0.07 ± 0.27 | 0.25 ± 0.05 | 0.04 ± 0.17 | 0.09 ± 0.03 | 1.14 ± 0.65 |
| Environmental Parameter | Resolution | Duration | Sources |
|---|---|---|---|
| Bathymetry (depth and slope) (m) | 0.007 × 0.007 m | 2019–2023 | Royal Thai Navy |
| Distance to the river mouth (m) Distance to land (m) | 0.007 × 0.007 m | 2019–2023 | ArcGIS, QGIS |
| Sighting Dissolved oxygen (DO) (mg/L) Sea surface temperature (SST) (°C) Nitrate (NO3) (ug-at/L) Ammonia (NH3) (ug-at/L) Total suspended solids (TSS) (mg/L) pH Salinity (ppt) | 0.007 × 0.007 m | 2019–2023 | DMCR |
| Chlorophyll a (ug/L) | 0.007 × 0.007 m | 2019–2023 | NASA (https://oceancolor.gsfc.nasa.gov, accessed on 10 March 2023) |
| Type | Resolution | Duration | Source |
|---|---|---|---|
| Mooring zone Transportation | 30 × 30 m | 2019–2023 | Port Authority, Marine Department, satellite imagery (Google Earth) |
| Fishing Aquaculture | 30 × 30 m | 2019–2023 | Department of Fisheries |
| Coastal activity | 30 × 30 m | 2019–2023 | Land Development Department, Tourism Authority of Thailand, Department of Marine and Coastal Resources |
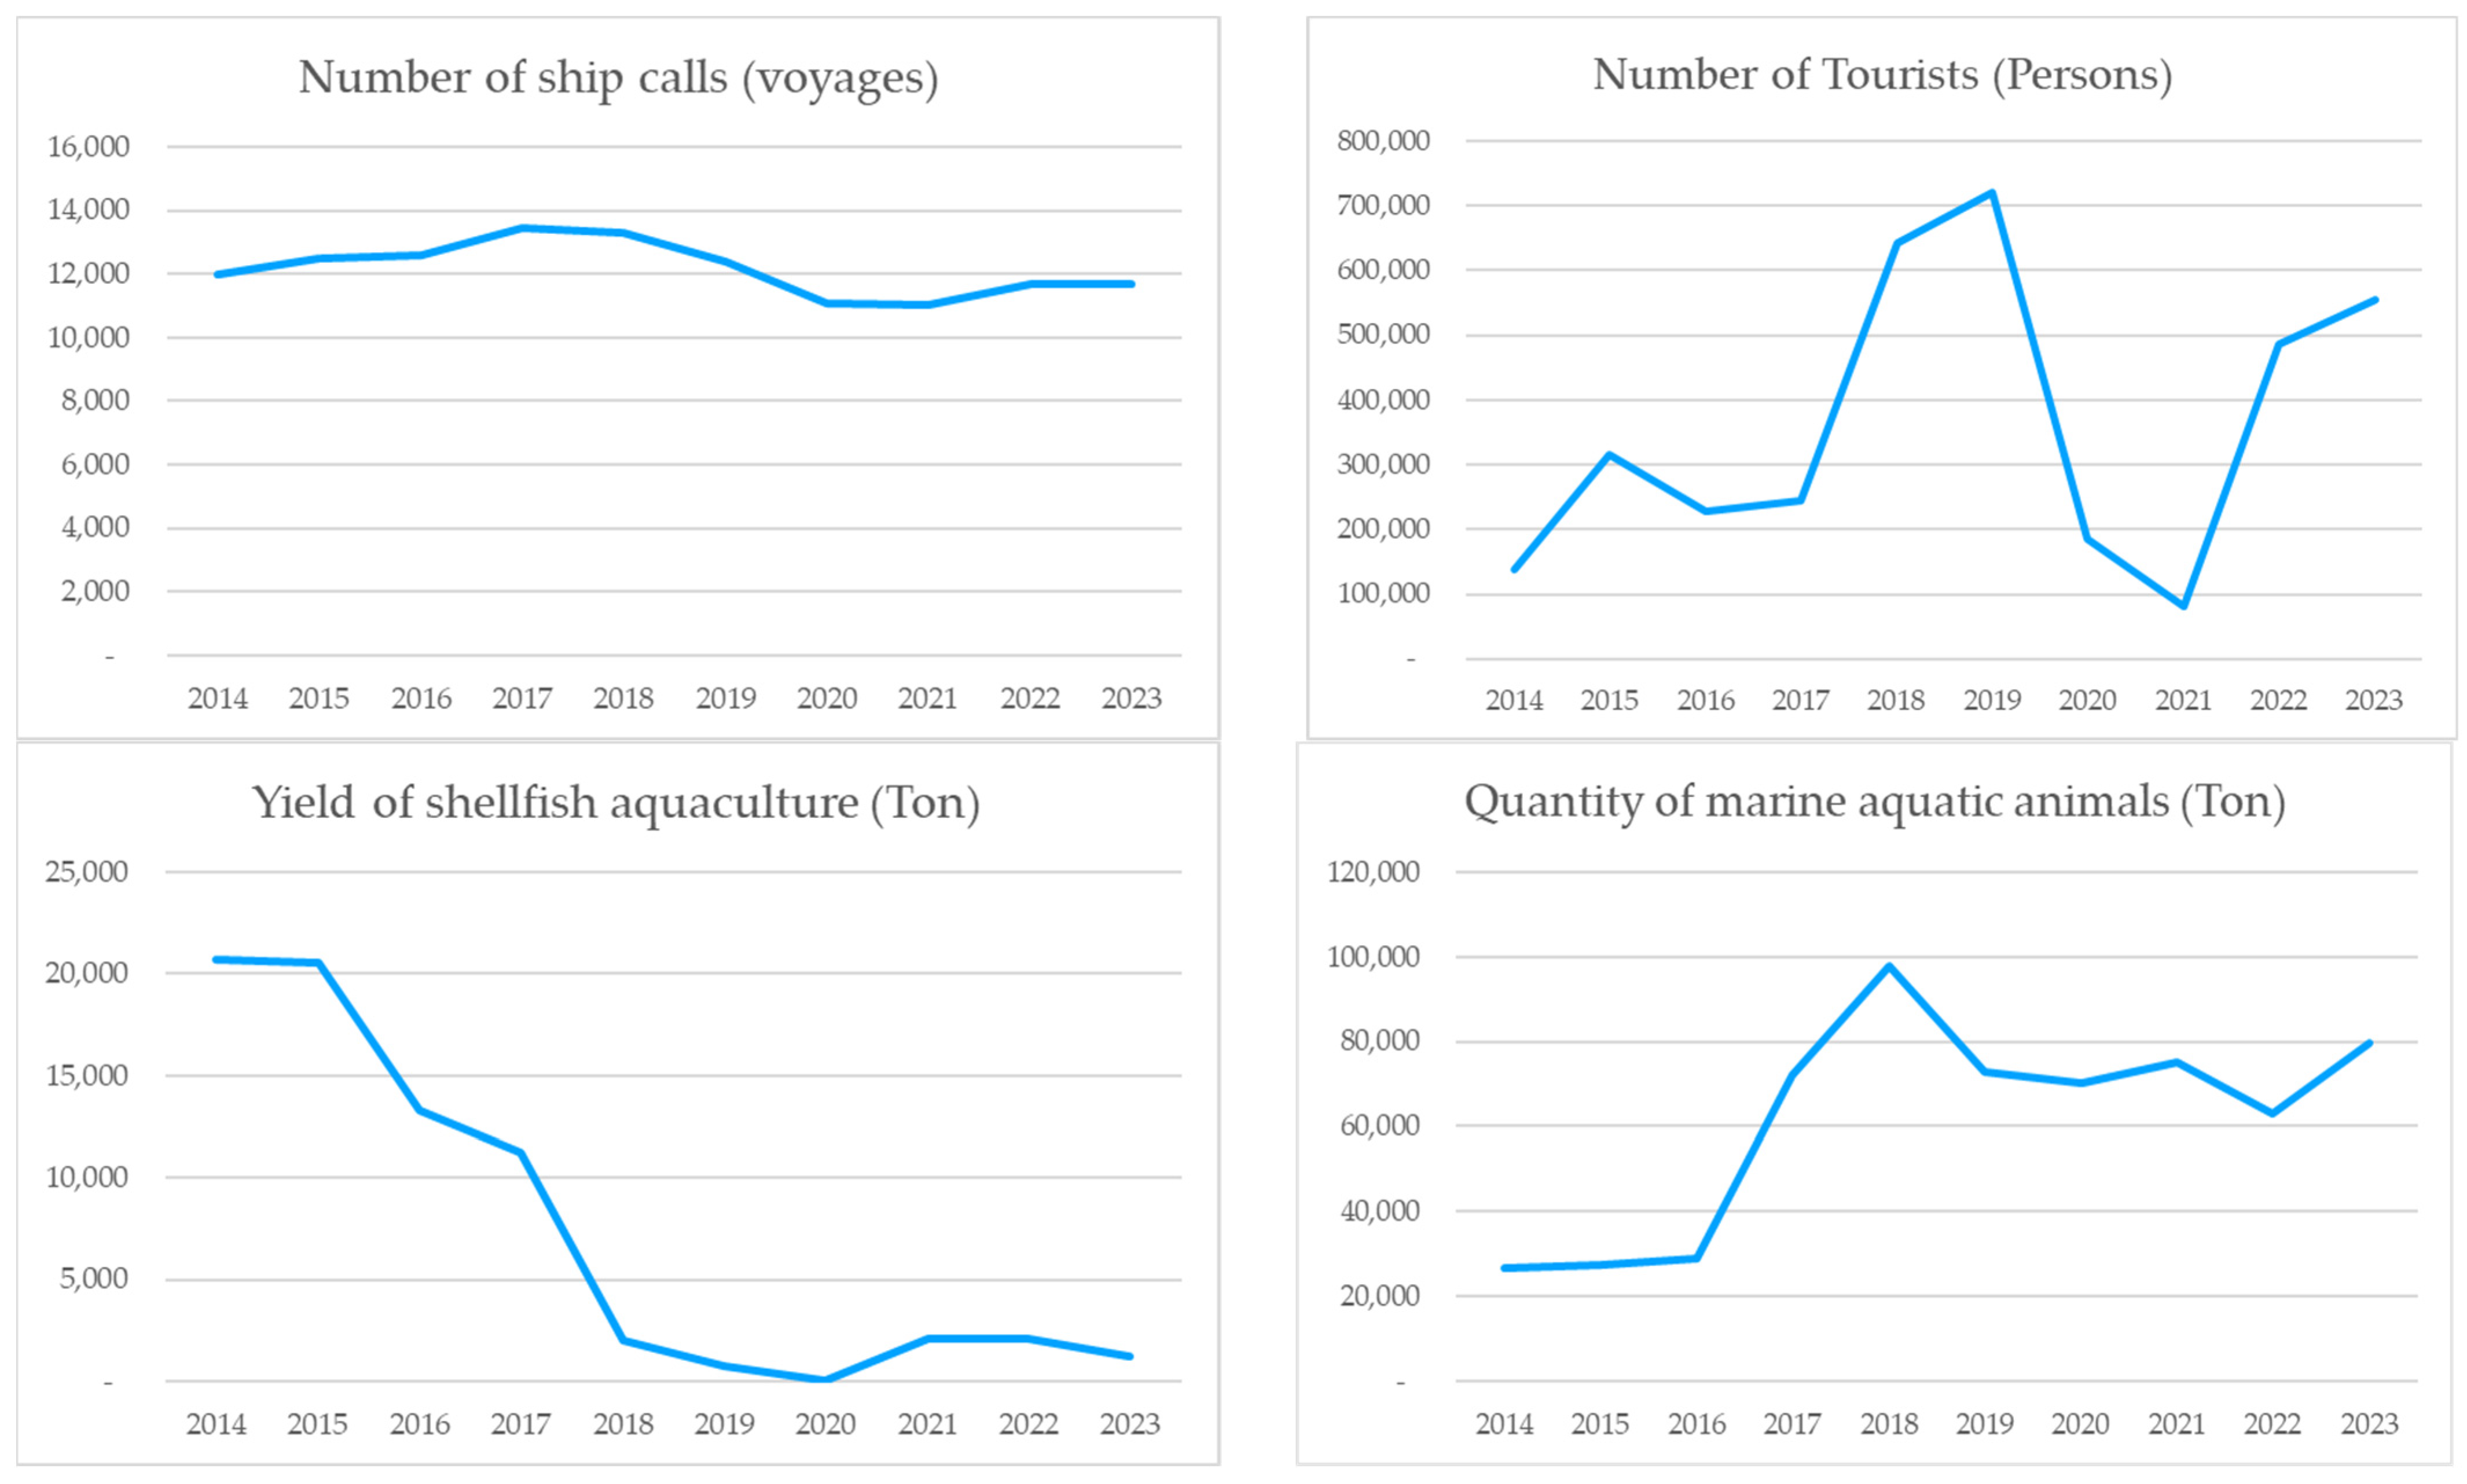
| Human Activity | 2014 | 2015 | 2016 | 2017 | 2018 | 2019 | 2020 | 2021 | 2022 | 2023 |
|---|---|---|---|---|---|---|---|---|---|---|
| Number of ship calls (voyages) | 11,975 | 12,478 | 12,607 | 13,461 | 13,310 | 12,391 | 11,092 | 11,041 | 11,696 | 11,692 |
| Number of tourists (Persons) | 137,724 | 193,340 | 228,888 | 243,525 | 240,431 | 256,546 | 186,459 | 80,574 | 486,345 | 555,635 |
| Quantity of marine aquatic animals (Ton) | 26,505 | 27,273 | 28,860 | 72,133 | 97,730 | 72,663 | 70,300 | 75,022 | 62,834 | 79,597 |
| Yield of shellfish aquaculture (Ton) | 20,688 | 20,531 | 13,294 | 11,212 | 2002 | 765 | 69 | 2086 | 2048 | 1254 |
| HABITAT RESILIENCE ATTRIBUTES | Rating Instruction | |||
|---|---|---|---|---|
| 3 | 2 | 1 | 0 | |
| Age of maturity | >4 years | 2–4 years | <2 years | No score |
| Reproductive strategy | Long calving interval, high parental investment | Medium calving interval/high parental investment | Short calving interval/short to medium parental investment | No score |
| Population connectivity | Negligible movement/exchange between the focal regional population and other populations | Occasional movement/exchange between the focal regional population and other populations | Regular movement/exchange between the focal regional population and other populations | No score |
| Local species status | Endangered | Threatened or of concern | Low concern | |
| STRESSOR OVERLAP PROPERTIES | ||||
| Mortality | Lethal | Sublethal | Negligible | No score |
| Potential threat | >5 problem | 3–4 problem | 1–2 problem | Unknown |
| Intensity | High | Medium | Low | No score |
| Likelihood of interaction | Calculated based on the suitability model | |||
| Temporal overlap | Timing of overlap all year (12 mo) | Most of the year (4–11 mo) | Occasional (1–3 mo) | No score |
| Frequency of disturbance | Annually or less often | Several times per year | Weekly or, more often, | No score |
| Current status of management | No strategy identified | Management strategy identified | Management strategy identified and implemented | No score |
| Uncertainty standards | Best | Acceptable | Limited |
| Data collected in study region/official data | Data collected based on literature review, interviews, or expert opinion | Limited reliability data derived from informal interviews with fishermen, or no empirical literature exists to justify scoring |
| Season | 2015 | 2016 | 2017 | 2018 | 2019 | 2020 | 2021 | 2022 | 2023 | |
|---|---|---|---|---|---|---|---|---|---|---|
| Dry | Nov | 1003 | 1021 | 1145 | 1171 | 1100 | 984 | 857 | 897 | 979 |
| Dec | 1033 | 1085 | 1127 | 1117 | 914 | 1021 | 936 | 965 | 993 | |
| Jan | 1000 | 1009 | 1144 | 1105 | 1070 | 986 | 863 | 965 | 936 | |
| Feb | 1001 | 1013 | 1065 | 1040 | 1075 | 971 | 872 | 971 | 923 | |
| Mar | 1114 | 1083 | 1132 | 1122 | 1154 | 987 | 925 | 993 | 1008 | |
| Apr | 1058 | 981 | 1071 | 1063 | 1068 | 908 | 934 | 897 | 964 | |
| Wet | May | 1077 | 1064 | 1133 | 1140 | 1033 | 946 | 971 | 977 | 1000 |
| Jun | 1026 | 1066 | 1170 | 1089 | 983 | 882 | 942 | 996 | 949 | |
| Jul | 1052 | 1096 | 1127 | 1108 | 951 | 904 | 971 | 1036 | 1022 | |
| Aug | 1030 | 1086 | 1124 | 1143 | 924 | 709 | 971 | 1040 | 957 | |
| Sep | 1012 | 1061 | 1104 | 1146 | 978 | 777 | 901 | 968 | 952 | |
| Oct | 1072 | 1042 | 1119 | 1066 | 1141 | 1017 | 898 | 991 | 1009 | |
| Summary | 12,478 | 12,607 | 13,461 | 13,310 | 12,391 | 11,092 | 11,041 | 11,696 | 11,692 | |
| Season | 2015 | 2016 | 2017 | 2018 | 2019 | 2020 | 2021 | 2022 | 2023 | |
|---|---|---|---|---|---|---|---|---|---|---|
| Dry | Nov | 13,641 | 19,234 | 14,339 | 21,601 | 31,446 | 14,422 | - | - | 2290 |
| Dec | 29,017 | 46,349 | 34,444 | 33,912 | 54,122 | 45,524 | - | - | 4534 | |
| Jan | 21,543 | 20,680 | 57,447 | 39,849 | 49,572 | 72,497 | - | - | 4729 | |
| Feb | 34,350 | 40,152 | 35,667 | 39,974 | 38,845 | 41,582 | - | - | 16,595 | |
| Mar | 38,130 | 43,739 | 49,523 | 37,789 | 30,364 | 6608 | - | - | 18,425 | |
| Apr | 12,358 | 25,599 | 14,696 | 5509 | 14,373 | - | - | - | 8045 | |
| Wet | May | - | 6550 | - | 11,160 | 6357 | - | - | - | 13,161 |
| Jun | - | - | 14,084 | 15,657 | - | - | - | - | - | |
| Jul | 11,376 | 4073 | 2719 | 7202 | 7188 | - | - | - | - | |
| Aug | 7633 | 5338 | - | 7877 | - | - | - | - | - | |
| Sep | 3701 | 3938 | - | 15,919 | 7198 | - | - | - | - | |
| Oct | 21,591 | 13,236 | 20,606 | 3982 | 17,081 | 5826 | - | - | - | |
| Summary | 193,340 | 228,888 | 243,525 | 240,431 | 256,546 | 186,459 | 0 | 0 | 67,779 | |
| Type | Resolution | Duration | |
|---|---|---|---|
| Sea surface temperature (SST) | (°C) | 30.23 (5) | 30.20–30.24 (0) |
| Dissolved oxygen (DO) | (mg/L) | *** 6.12 (15.9) | * 6.19 (29.9) |
| Nitrate (NO3) | (ug-at/L) | 2.8 (2.6) | 11.5 (0.1) |
| Ammonia (NH3) | (ug-at/L) | 5.5 (6) | ** 3 (29.4) |
| Total suspended solids (TSS) | (mg/L) | * 25.1 (32.8) | 18.4 (1) |
| Chlorophyll a | (ug/L) | ** 6.9–7.2 (20.1) | 5.8 (1.8) |
| Salinity | (ppt) | 30.86 (9) | 30.69 (2.5) |
| pH | 8.07 (0.8) | 8.09 (3.9) | |
| Depth | (m) | 5.5 (0) | 5.3 (0) |
| Slope | (m) | 15–65 (3.9) | 36–65 (13) |
| Distance to the river mouth | (m) | 3300 (1.9) | 2200 (5.1) |
Disclaimer/Publisher’s Note: The statements, opinions and data contained in all publications are solely those of the individual author(s) and contributor(s) and not of MDPI and/or the editor(s). MDPI and/or the editor(s) disclaim responsibility for any injury to people or property resulting from any ideas, methods, instructions or products referred to in the content. |
© 2025 by the authors. Licensee MDPI, Basel, Switzerland. This article is an open access article distributed under the terms and conditions of the Creative Commons Attribution (CC BY) license (https://creativecommons.org/licenses/by/4.0/).
Share and Cite
Umprasoet, W.; Mu, Y.; Junchompoo, C.; Guo, Z.; Zhang, Z. Integrated Modeling Techniques for Understanding the Distribution and Impact of Human Activities on the Bryde’s Whale (Balaenoptera edeni) in the Sichang Islands, Thailand. Water 2025, 17, 889. https://doi.org/10.3390/w17060889
Umprasoet W, Mu Y, Junchompoo C, Guo Z, Zhang Z. Integrated Modeling Techniques for Understanding the Distribution and Impact of Human Activities on the Bryde’s Whale (Balaenoptera edeni) in the Sichang Islands, Thailand. Water. 2025; 17(6):889. https://doi.org/10.3390/w17060889
Chicago/Turabian StyleUmprasoet, Wanchanok, Yongtong Mu, Chalatip Junchompoo, Zhen Guo, and Zhiwei Zhang. 2025. "Integrated Modeling Techniques for Understanding the Distribution and Impact of Human Activities on the Bryde’s Whale (Balaenoptera edeni) in the Sichang Islands, Thailand" Water 17, no. 6: 889. https://doi.org/10.3390/w17060889
APA StyleUmprasoet, W., Mu, Y., Junchompoo, C., Guo, Z., & Zhang, Z. (2025). Integrated Modeling Techniques for Understanding the Distribution and Impact of Human Activities on the Bryde’s Whale (Balaenoptera edeni) in the Sichang Islands, Thailand. Water, 17(6), 889. https://doi.org/10.3390/w17060889