Article

Microtopography Affects the Diversity and Stability of Vegetation Communities by Regulating Soil Moisture

School of Land Engineering, Shaanxi Key Laboratory of Land Consolidation, Chang’an University, Xi’an 710054, China
*
Author to whom correspondence should be addressed.
Water 2025, 17(7), 1012; https://doi.org/10.3390/w17071012
Submission received: 17 February 2025 / Revised: 21 March 2025 / Accepted: 27 March 2025 / Published: 29 March 2025
(This article belongs to the Section Soil and Water)

Abstract

:
Microtopography plays a crucial role in regulating soil moisture in arid and semi-arid regions, thereby significantly influencing vegetation growth and distribution. The Loess Plateau, characterized by a deeply incised and fragmented landscape, necessitates an in-depth understanding of the microtopograph–soil moisture–vegetation relationship to guide effective vegetation restoration. This study, based on field investigations and laboratory analyses in the hilly-gully region of the Loess Plateau, employed one-way ANOVA, Duncan’s multiple range test, and structural equation modeling to examine the effects of microtopography on vegetation community characteristics. The results revealed that microtopography significantly affects vegetation diversity and stability. Vegetation diversity and stability were higher on shady slopes than on sunny slopes, with diversity indices increasing by approximately 38% in certain regions. Additionally, downslope positions exhibited greater vegetation diversity than upslopes, with richness indices increasing by approximately 33% and the M. Godron index decreasing by 8.49, indicating enhanced stability. However, the effects of gullies varied significantly across different regions. Soil moisture content was higher on shaded slopes than on sunny slopes and greater at downslope positions than at upslopes, reaching up to 12.89% in gullies. Slope position exerted a direct and significant positive effect on soil moisture, which, in turn, indirectly influenced vegetation diversity and stability. This study reveals the dominant regulatory role of slope position in soil moisture, vegetation diversity, and stability, providing new perspectives and evidence for developing vegetation restoration strategies on the Loess Plateau and promoting the sustainable growth of regional vegetation.

1. Introduction

Microtopography refers to subtle surface undulations and morphological changes within a smaller spatial scale (typically ranging from a few meters to tens of meters), encompassing features such as slope direction, slope position, gradient, and relief. These microtopographical factors alter local thermal and water conditions on a medium to small scale, influencing the local ecological environment and hydrological conditions, thereby causing variations in vegetation growth [1,2]. Understanding the impact of microtopography on vegetation community diversity and stability is of great significance for vegetation construction and management and for achieving regional ecological sustainability.
In arid and semi-arid regions, soil moisture is a limiting factor for vegetation growth, and complex topographical conditions can significantly affect vegetation patterns by altering the spatial distribution of soil moisture [3]. Numerous studies have shown that microtopographical factors, such as slope direction and slope position, regulate the spatial distribution of soil moisture by affecting processes such as sunlight duration, evaporation intensity, and precipitation redistribution [4,5,6,7]. Different slope directions receive varying amounts of solar radiation, leading to differences in soil moisture evaporation. Additionally, changes in slope position affect the convergence and infiltration of surface runoff, which profoundly alters the spatial distribution of soil moisture [8,9].
Vegetation, as a key component of ecosystems, plays a direct role in ecosystem health and sustainable development through its diversity and stability [10]. Plant diversity forms the foundation of ecosystem stability by providing a rich species pool for vegetation restoration, while vegetation stability reflects the community’s ability to resist external disturbances and maintain structural and functional integrity, making it an important indicator of ecosystem health. Both factors jointly support the long-term resilience and balance of ecological networks [11,12]. In arid and semi-arid regions, vegetation diversity and stability are crucial for promoting vegetation restoration and maintaining regional ecological balance. Under complex topographical conditions, especially microtopographical factors such as slope aspect and position, soil moisture is redistributed within the microenvironment, leading to differences in vegetation growth and distribution [13]. For example, the growth distribution of mesophytes in the middle and downslopes of the sunny slopes increased; the better soil moisture conditions on the shady slopes promoted the richness and uniform distribution of vegetation species, and the community diversity was also correspondingly improved [14,15]. Moreover, in the northern Loess Plateau, there are significant differences in vegetation cover and community structure across different microtopographic conditions [16].
The Loess Plateau is characterized by arid climate, sparse precipitation, and fragmented topography, making it a globally significant ecologically fragile region and a key area for ecological engineering projects in China. Over the years, significant progress has been made in vegetation restoration through measures such as returning farmland to forest (or grassland) on the Loess Plateau. However, due to the limitations of single vegetation restoration strategies and the lack of precise planning, the initial vegetation construction did not adequately consider microtopographical differences, resulting in vegetation degradation in some areas [17,18]. Specifically, vegetation diversity is low, and stability is poor, severely hindering the sustainability of ecological development on the Loess Plateau [4,5,6,7]. In the hilly and gully region of the Loess Plateau, various microtopographic features, including different slope positions (up, middle, down), slope aspects (shady and sunny), and gully areas, create a complex and diverse terrain that encompasses the region’s primary landform characteristics [19]. The up slope positions are characterized by intense erosion and fragmented landforms, the middle slope positions exhibit complex runoff and erosion processes, and the down slope positions are predominantly depositional areas, while gully areas simultaneously exhibit both erosional and hydrological characteristics [12]. Although previous studies have examined the influence of microtopography on soil moisture and vegetation diversity, research on the effects of different microtopographic elements on vegetation community stability remains insufficient. This gap in understanding has, to some extent, hindered local vegetation restoration and ecological sustainability [1,20]. A more comprehensive investigation into how various microtopographic features influence vegetation is crucial for advancing research depth and relevance in this field.
Therefore, this study selects different slope positions (up, middle, down), slope directions (shady, sunny), and gully areas within regions of varying precipitation gradients in the hilly and gully areas of the Loess Plateau. By measuring soil moisture and various vegetation parameters and analyzing soil moisture, vegetation diversity, and community stability, this research aims to clarify the impact of microtopography on vegetation community characteristics on the Loess Plateau, providing scientific references for vegetation restoration and ecological sustainability in the region.

2. Materials and Methods

2.1. Study Areas and Experimental Design

The study area is located in the central region of the Loess Plateau, covering Dingbian County (A1), Wuqi County (A2), and Fu County (A3) (107°15′29″–109°42′56″ E, 35°44′03″–37°53′28″ N). This region is a key area for the implementation of China’s world-renowned ecological project, the “Grain-for-Green” program (GFG), which focuses on converting farmland into forest or grassland. Wuqi County (A2) is recognized as one of the most advanced counties in the implementation of this program [21,22]. Dingbian County is located in the transitional zone between the Loess Plateau and the Ordos Desert Steppe in Inner Mongolia. The southern part of the county is characterized by loess hills and gullies, dominated by loess terraces and ridges, while the northern part is part of the Maowusu Desert. The elevation ranges from 1303 to 1907 m, with an annual average rainfall of 346.9 mm and an average annual temperature of 9.3 °C. The region has a semi-arid temperate continental monsoon climate, and the main vegetation species include Artemisia ordosica, Caragana korshinskii, Salix psammophila, and Hippophae rhamnoides. Wuqi County’s landforms are characterized by loess plateau ridged hills and gully areas, with elevations ranging from 1233 to 1809 m. The annual average rainfall is 478.3 mm, and the average annual temperature is 8.5 °C. The region also has a semi-arid temperate continental monsoon climate, with the main vegetation species including Populus simonii, Prunus armenaica, Amygdalus pedunculata, Salix matsudana, and Pyrus communis. Fu County, located in the loess hill and gully region, has an elevation range of 846 to 1240 m, with annual average rainfall of 507.7 mm and an average annual temperature of 9.6 °C. The region has a warm temperate semi-humid continental monsoon climate, with dominant vegetation species including Quercus liaotungensis, Betula platyphylla, Pinus tabuliformis, and Populus davidiana. Rainfall in the three counties shows a distinct gradient, with a 400 mm isohyet marking the boundary between semi-arid and semi-humid areas. Vegetation types transition from forests in the east to grasslands in the west, exhibiting different growth and distribution patterns [23]. Therefore, we selected three regions, A1, A2, and A3, for this study (Figure 1).
From July to September, the Loess Plateau experiences abundant precipitation, favorable temperatures, and vigorous vegetation growth, making this period ideal for capturing vegetation growth conditions and ecological characteristics. Therefore, this study was conducted from July to September 2023. To ensure the representativeness and scientific rigor of the sampling sites, we selected one naturally enclosed area as the study site in each of the three regions (A1, A2, and A3) within the typical hilly and gully region of the Loess Plateau. The classification of microtopographic types integrates established standards for similar terrains and preliminary research findings, specifically as follows: Slope positions are divided based on the vertical height of the mountain slope [1,24]. The upslope refers to the top third of the mountain slope, from the ridge to the valley range; the middle slope is the middle third of the slope; the downslope is the lowest third, close to the valley bottom, and vegetation shows significant spatial differentiation with slope position [1,24,25]. Slope aspects are divided into sunny and shady sides based on sunlight exposure. The gully is a linear depression located at the bottom of the slope, formed by long-term erosion and accumulation of surface runoff [26]. By distinguishing slope aspect and slope position, each study area was divided into seven representative microtopographic habitats: upslope sunny side (TS), mid-slope sunny side (MS), downslope sunny side (BS), upslope shady side (TN), mid-slope shady side (MN), downslope shady side (BN), and gully (GU), resulting in a total of 21 sampling plots. Adequate spacing was maintained between plots to ensure uniform distribution within the study area. Additionally, key habitat variables, including latitude, longitude, elevation, slope aspect, and slope position, were recorded for each plot (Figure 2 and Table 1).

2.2. Vegetation Survey

The quadrat method was used to investigate the vegetation, including the tree layer, shrub layer, and herbaceous layer. The survey was conducted from July to September 2023, covering vegetation types such as grass, shrub-grass, arbor-grass, and arbor-shrub-grass. Based on the growth and distribution of different vegetation types in the study area, the size of the tree quadrats was selected as 30 m × 30 m, the shrub quadrats as 10 m × 10 m, and the herbaceous quadrats as 1 m × 1 m [27]. To enhance the robustness of the data, three tree plots were randomly established within each sampling site. Within each tree plot, three shrub plots and three herbaceous plots were also set up. In total, 189 tree-shrub-herbaceous plots were established across the 21 sampling sites in the A1, A2, and A3 regions. The survey recorded vegetation types, species numbers, species names, height, diameter at breast height (DBH), canopy width, and coverage within each quadrat.

2.3. Soil Data

Based on the vegetation survey, soil samples were collected [28]. Three soil sampling points were selected in each sample plot. A soil auger was used to collect soil samples from the 0–100 cm depth, with sampling intervals of 10 cm for the 0–20 cm layer and 20 cm for the 20–100 cm layer. Each sampling was repeated three times, and the average value represented the soil moisture content for each soil layer. Soil moisture content was determined using the oven-drying method. The soil moisture content in the study area was calculated based on the oven-drying method and is expressed as gravimetric moisture content.

2.4. Data Analysis

2.4.1. Vegetation Parameters

(1)
Vegetation diversity
Four indices were selected to represent plant diversity: the Shannon–Weiner diversity index (H), the Margalef richness index (R), the Simpson dominance index (D), and the Pielou evenness index (E) [29,30,31,32]. The Shannon–Weiner diversity index measures community species diversity, considering both species richness and evenness [29]. The Margalef richness index evaluates species richness in a community and can correct for sample size effects on species diversity [30]. The Simpson dominance index measures the degree of species dominance, where smaller values indicate more even species distribution [31]. The Pielou evenness index assesses the uniformity of species distribution, with values closer to 1 indicating higher evenness [32].
The four indices provide a comprehensive assessment and description of plant community structural characteristics from key dimensions such as species diversity, richness, dominance, and evenness. They are highly representative and complementary [33,34]. The plant diversity index calculation formula is as follows (Table 2).
(2)
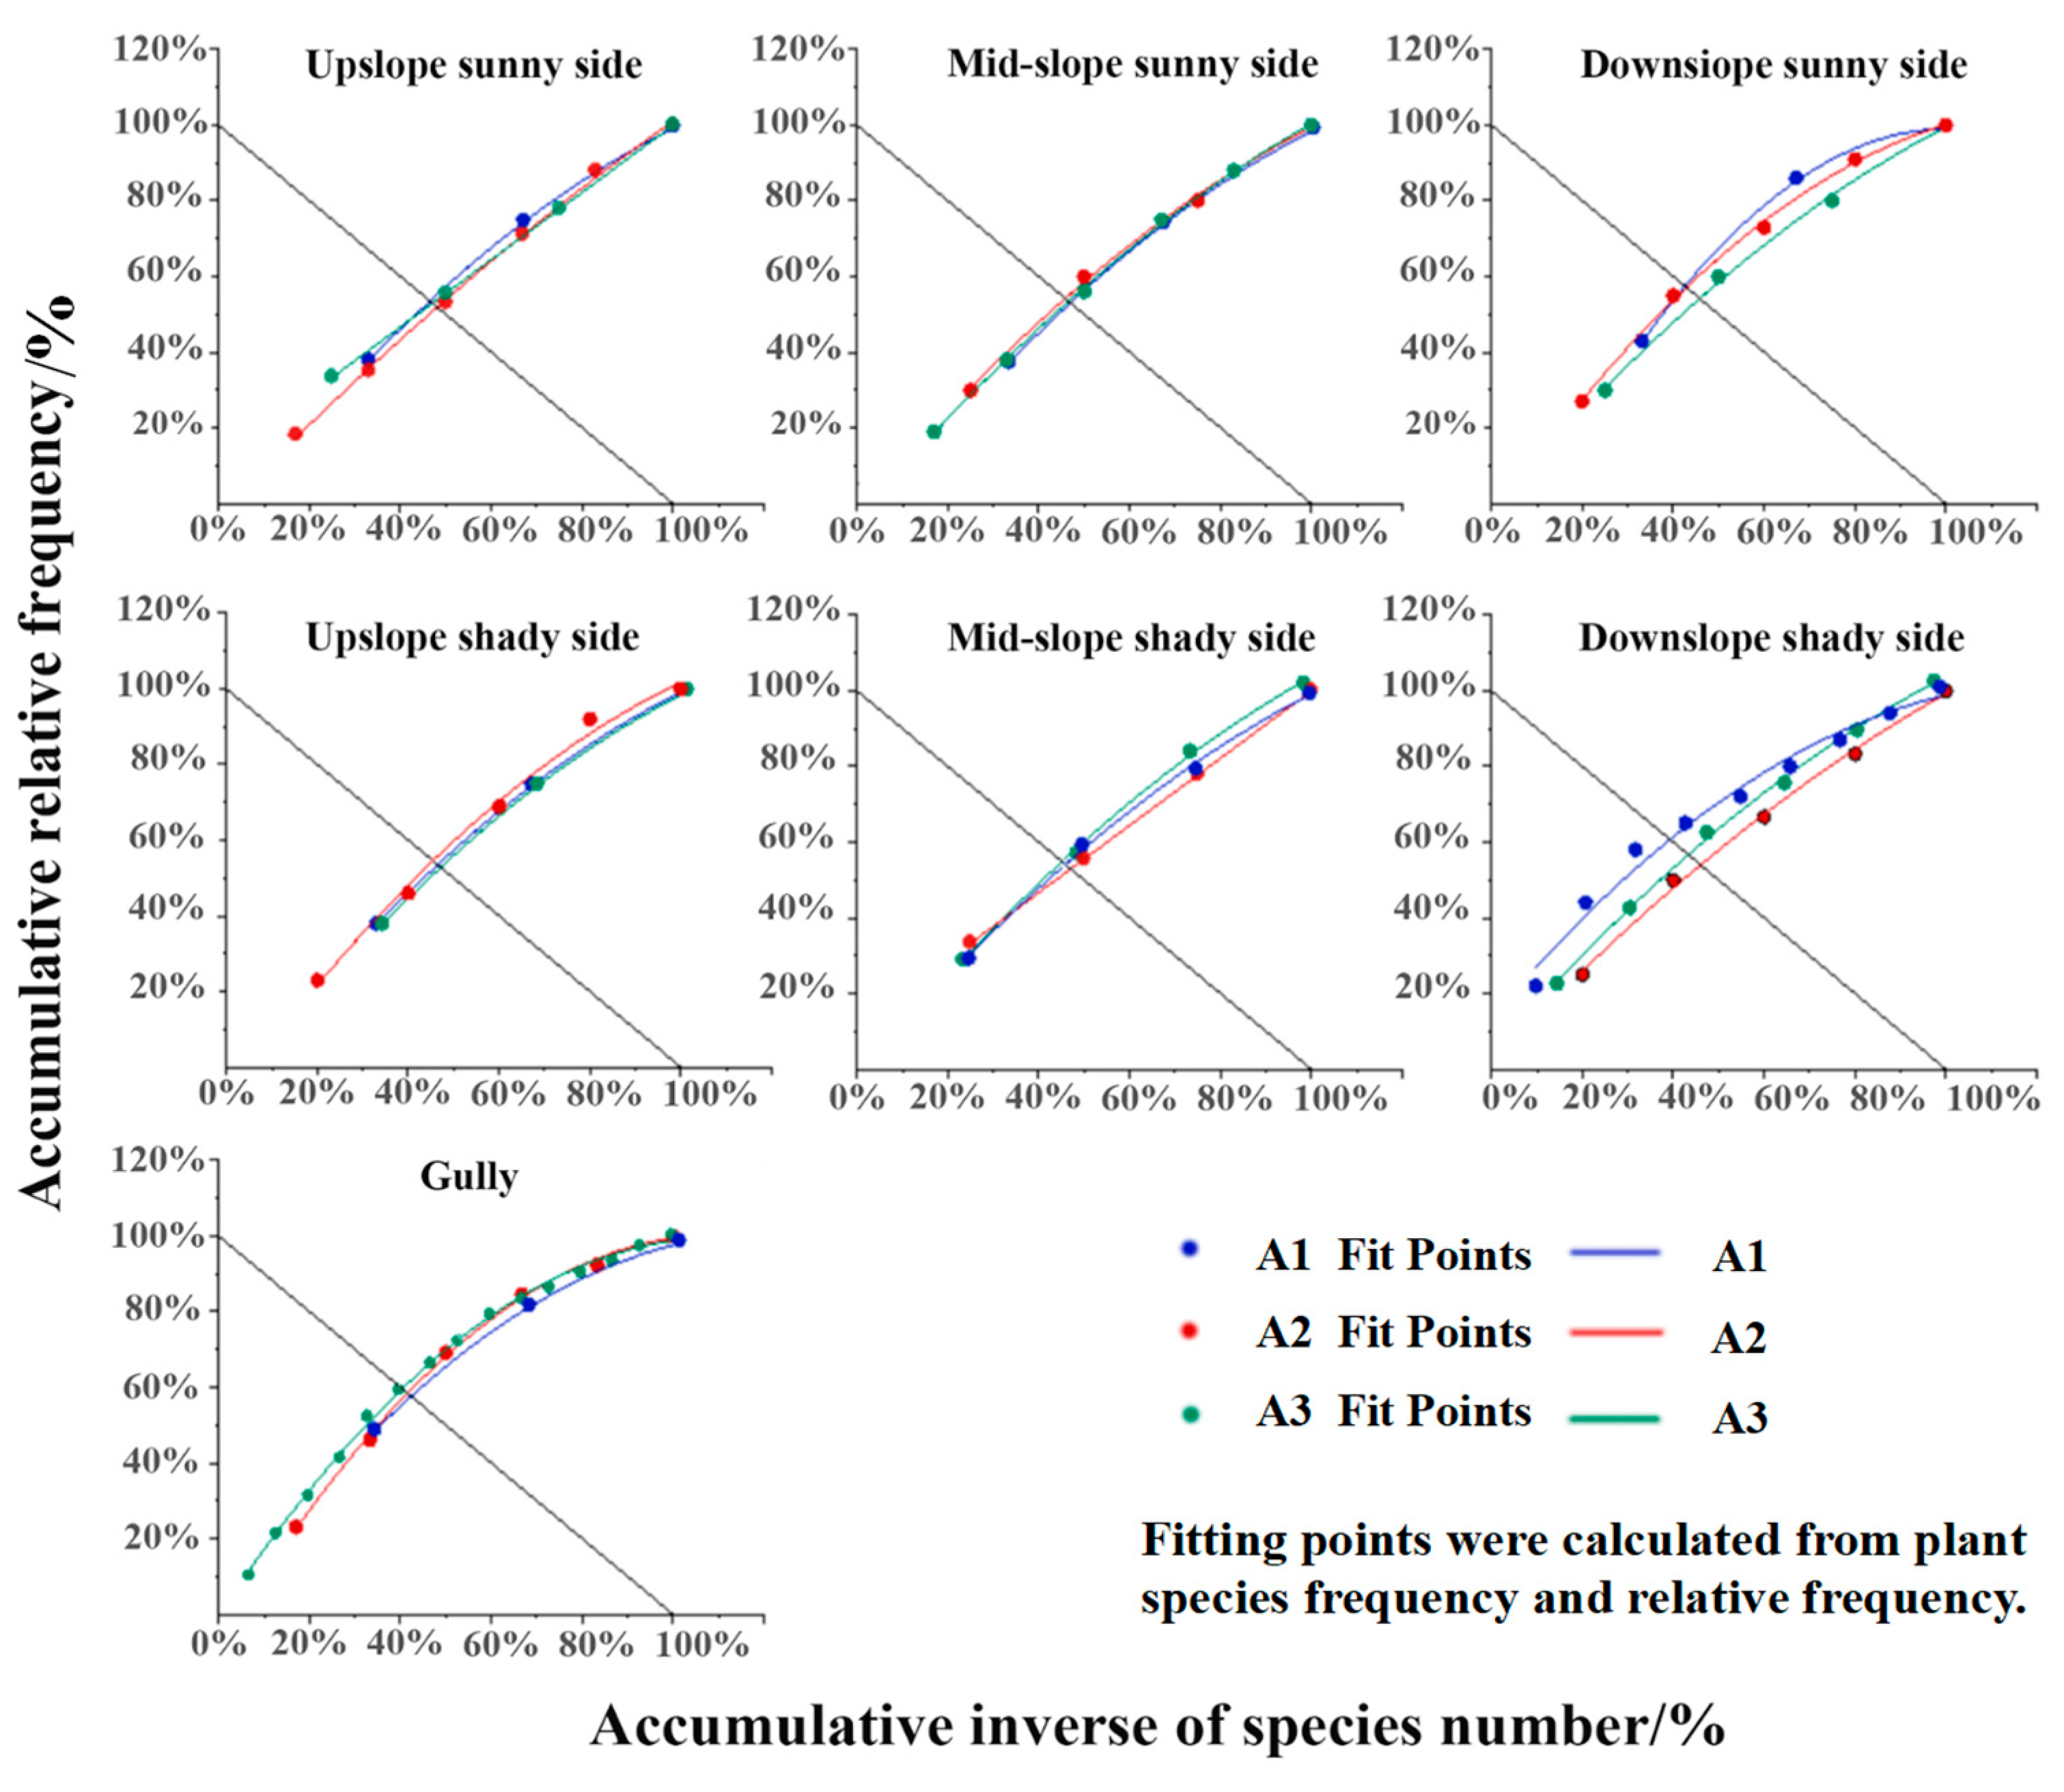
Vegetation stability
The stability of the vegetation community was analyzed using the M. Godron stability determination method [35,36,37,38]. All of the plant species in the community were ranked according to the frequency from the largest to the smallest, and the relative frequency was calculated. Then, the relative frequency and the inverse of the total number of species in the community were accumulated and the percentage was calculated. A scatter plot was constructed to connect the two one by one, and a smooth curve was constructed to connect the two one by one. Then, we intersected the line y = 100 − x with the curve, and the intersection point was the reference point of community stability. The distance between the coordinates of the reference point and (20, 80) is the Euclidean distance [35,36]. The smaller the Euclidean distance, the more stable the vegetation community, and vice versa, the more unstable it is. The formula used is as follows:
  • Cumulative percentage of species:
X = m/S
  • Cumulative relative frequency:
Y = i = 1 n C i
  • Smooth curve fitting equations:
Y = ax2 + bx + c
Linear equation:
Y = 100 − x
where m is the mth species, S is the total number of species in the community, Ci is the relative frequency of the ith species, and the coordinates of the intersection of the smoothed curve and straight line (x,y) are obtained according to the actual situation.

2.4.2. Soil Moisture Content

The soil moisture content is calculated by the following formula:
W = M 1 M 2 M 2 M 0 × 100 %
where W is soil mass moisture content (%);
M0 is the mass of the aluminum box after drying (g);
M1 is the total mass of the soil and aluminum box before drying (g);
M2 is the total mass of the soil and aluminum box after drying (g).
This study employed one-way analysis of variance (ANOVA) and Duncan’s multiple comparison test to assess the significant differences in soil moisture content and vegetation community diversity across different microtopographic features. Prior to conducting the ANOVA analysis, the Kolmogorov–Smirnov test and Levene’s test for homogeneity of variance were used to verify the normality and homogeneity of variance of the data. The results indicated that the data followed a normal distribution and met the homogeneity of variance assumption, ensuring the applicability of the ANOVA and Duncan’s multiple comparison test. A significance level of p = 0.05 was set (where p < 0.05 indicates a statistically significant difference between the two groups).
To further analyze the complex causal relationships between microtopographic factors (slope aspect, slope position), soil moisture, plant diversity, and community stability, this study employed structural equation modeling (SEM). The advantage of SEM is its ability to simultaneously consider the direct and indirect effects of multiple independent variables on multiple dependent variables, handle complex models containing latent variables, and effectively address multicollinearity issues between variables. In this study, slope aspect, slope position, soil moisture, diversity index, dominance index, richness index, evenness index, and stability index were selected as key variables. Model fit was evaluated using several indices, including the Comparative Fit Index (CFI > 0.9), Goodness-of-Fit Index (GFI > 0.9), Root Mean Square Error of Approximation (RMSEA < 0.08), Standardized Root Mean Square Residual (SRMR < 0.05), and significance probability (p > 0.05). The current model’s CFI value was 0.994, the GFI value was 0.970, the RMSEA value was 0.078, the SRMR value was 0.049, and the p value was 0.309, indicating good model fit. To enhance statistical rigor, the Bootstrap method (1000 resamples) was used to calculate the 95% confidence intervals for path coefficients. The results showed that the confidence intervals for all paths did not contain zero, further validating the statistical significance of the relationships between variables. Data processing and analysis were performed using Excel 2021 and SPSS 26.0 software, the SEM was constructed in Amos 21.0, and final chart creation was completed in Origin 2021.

3. Results

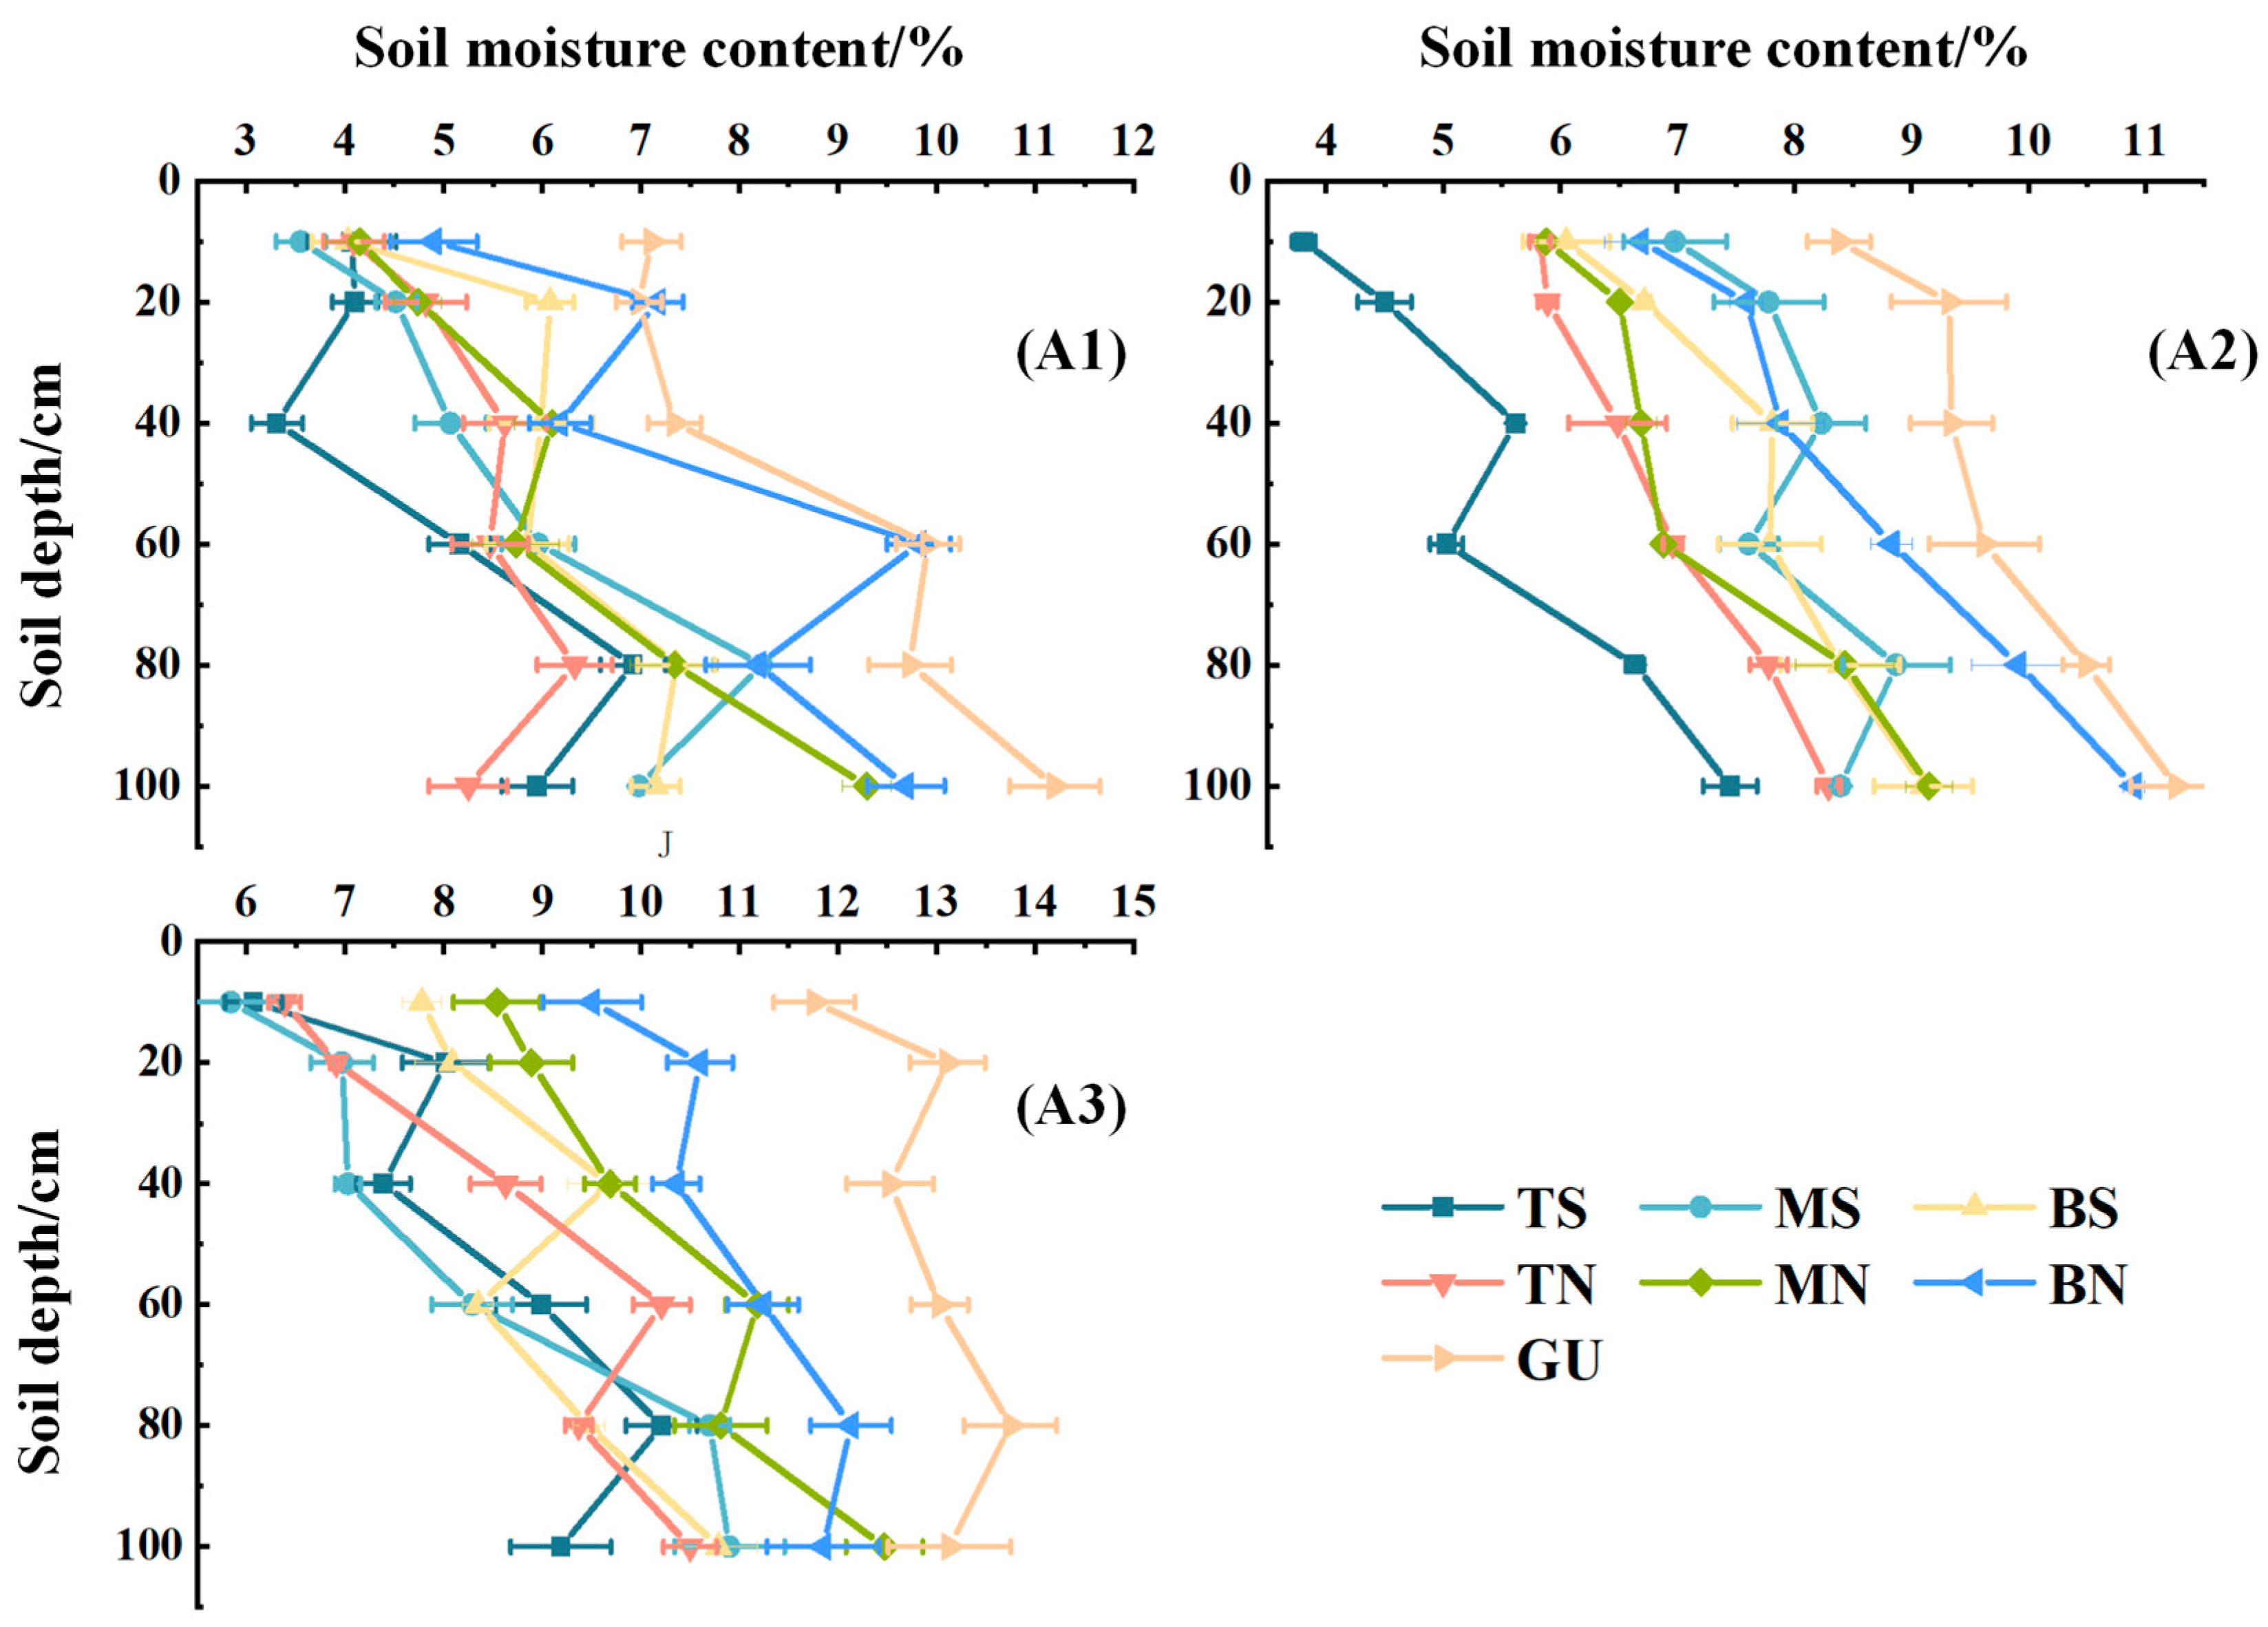
3.1. Characterization of Soil Water Content Under Different Microtopographic Conditions

By comparing the soil moisture content at depths of 0–100 cm across different microtopographic types, the study analyzes the variation trends of soil moisture under various microtopographic conditions. Overall, the soil moisture content in regions A1, A2, and A3 increased with depth, with A3 having higher soil moisture levels than A1 and A2 and A1 exhibiting the lowest soil moisture content. The average soil moisture content in the gullies was higher than that in the shady and sunny slopes. Additionally, the soil moisture content in the downslope positions was generally higher than in the mid-slope and upslope positions, and the soil moisture content on shady slopes was typically higher than on sunny slopes. These findings suggest that microtopography has a significant impact on soil moisture distribution in the Loess Plateau region, with notable differences in water dynamics between different slope aspects and positions.
Specifically, the water content of GU in the 0–10 cm soil layer was significantly higher than that of TS, BS, TN, and MN. There was no significant difference in the slope microtopography in the area A3 except for BN and GU. In the 10–20 cm soil layer, the soil water content of BN in A1 was significantly higher than that of TS, MS, TN, MN, and GU (p < 0.05), and there was no significant difference between BN and BS. GU water content was found to be significantly higher than other slope microtopography in A2 and A3 (p < 0.05); In the 20–40 cm soil layer, the GU water content was significantly higher than other slope microtopographies, and the TS water content was the lowest in A1 and A2; in the 40–60 cm soil layer, the GU and BN soil water content was found to be significantly higher than other slope microtopographies in A1 (p < 0.05), the GU water content was significantly higher than other slope microtopographies in A2 (p < 0.05), and the TS water content was significantly lower than other slope microtopographies (p < 0.05). In A3, for MN, BN, and GU, soil water content was significantly higher than TS, BS, and TN (p < 0.05), of which the GU soil water content was the highest; in the 60–80 cm soil layer, the GU soil water content was the highest and TS was the lowest, whereas in the 80–100 cm soil layer, the soil water content of BN and GU in A1 was significantly higher than that in TS, MS, BS, and TN (p < 0.05), for which the GU soil water content was the highest and TS was the lowest. In A2, the water contents of GU and BN were significantly higher than those of the other slope microtopographies (p < 0.05). In A3, the soil water content of TS was significantly lower than that of GU (p < 0.05), and there were no significant differences in the other slope microtopographies (Figure 3).

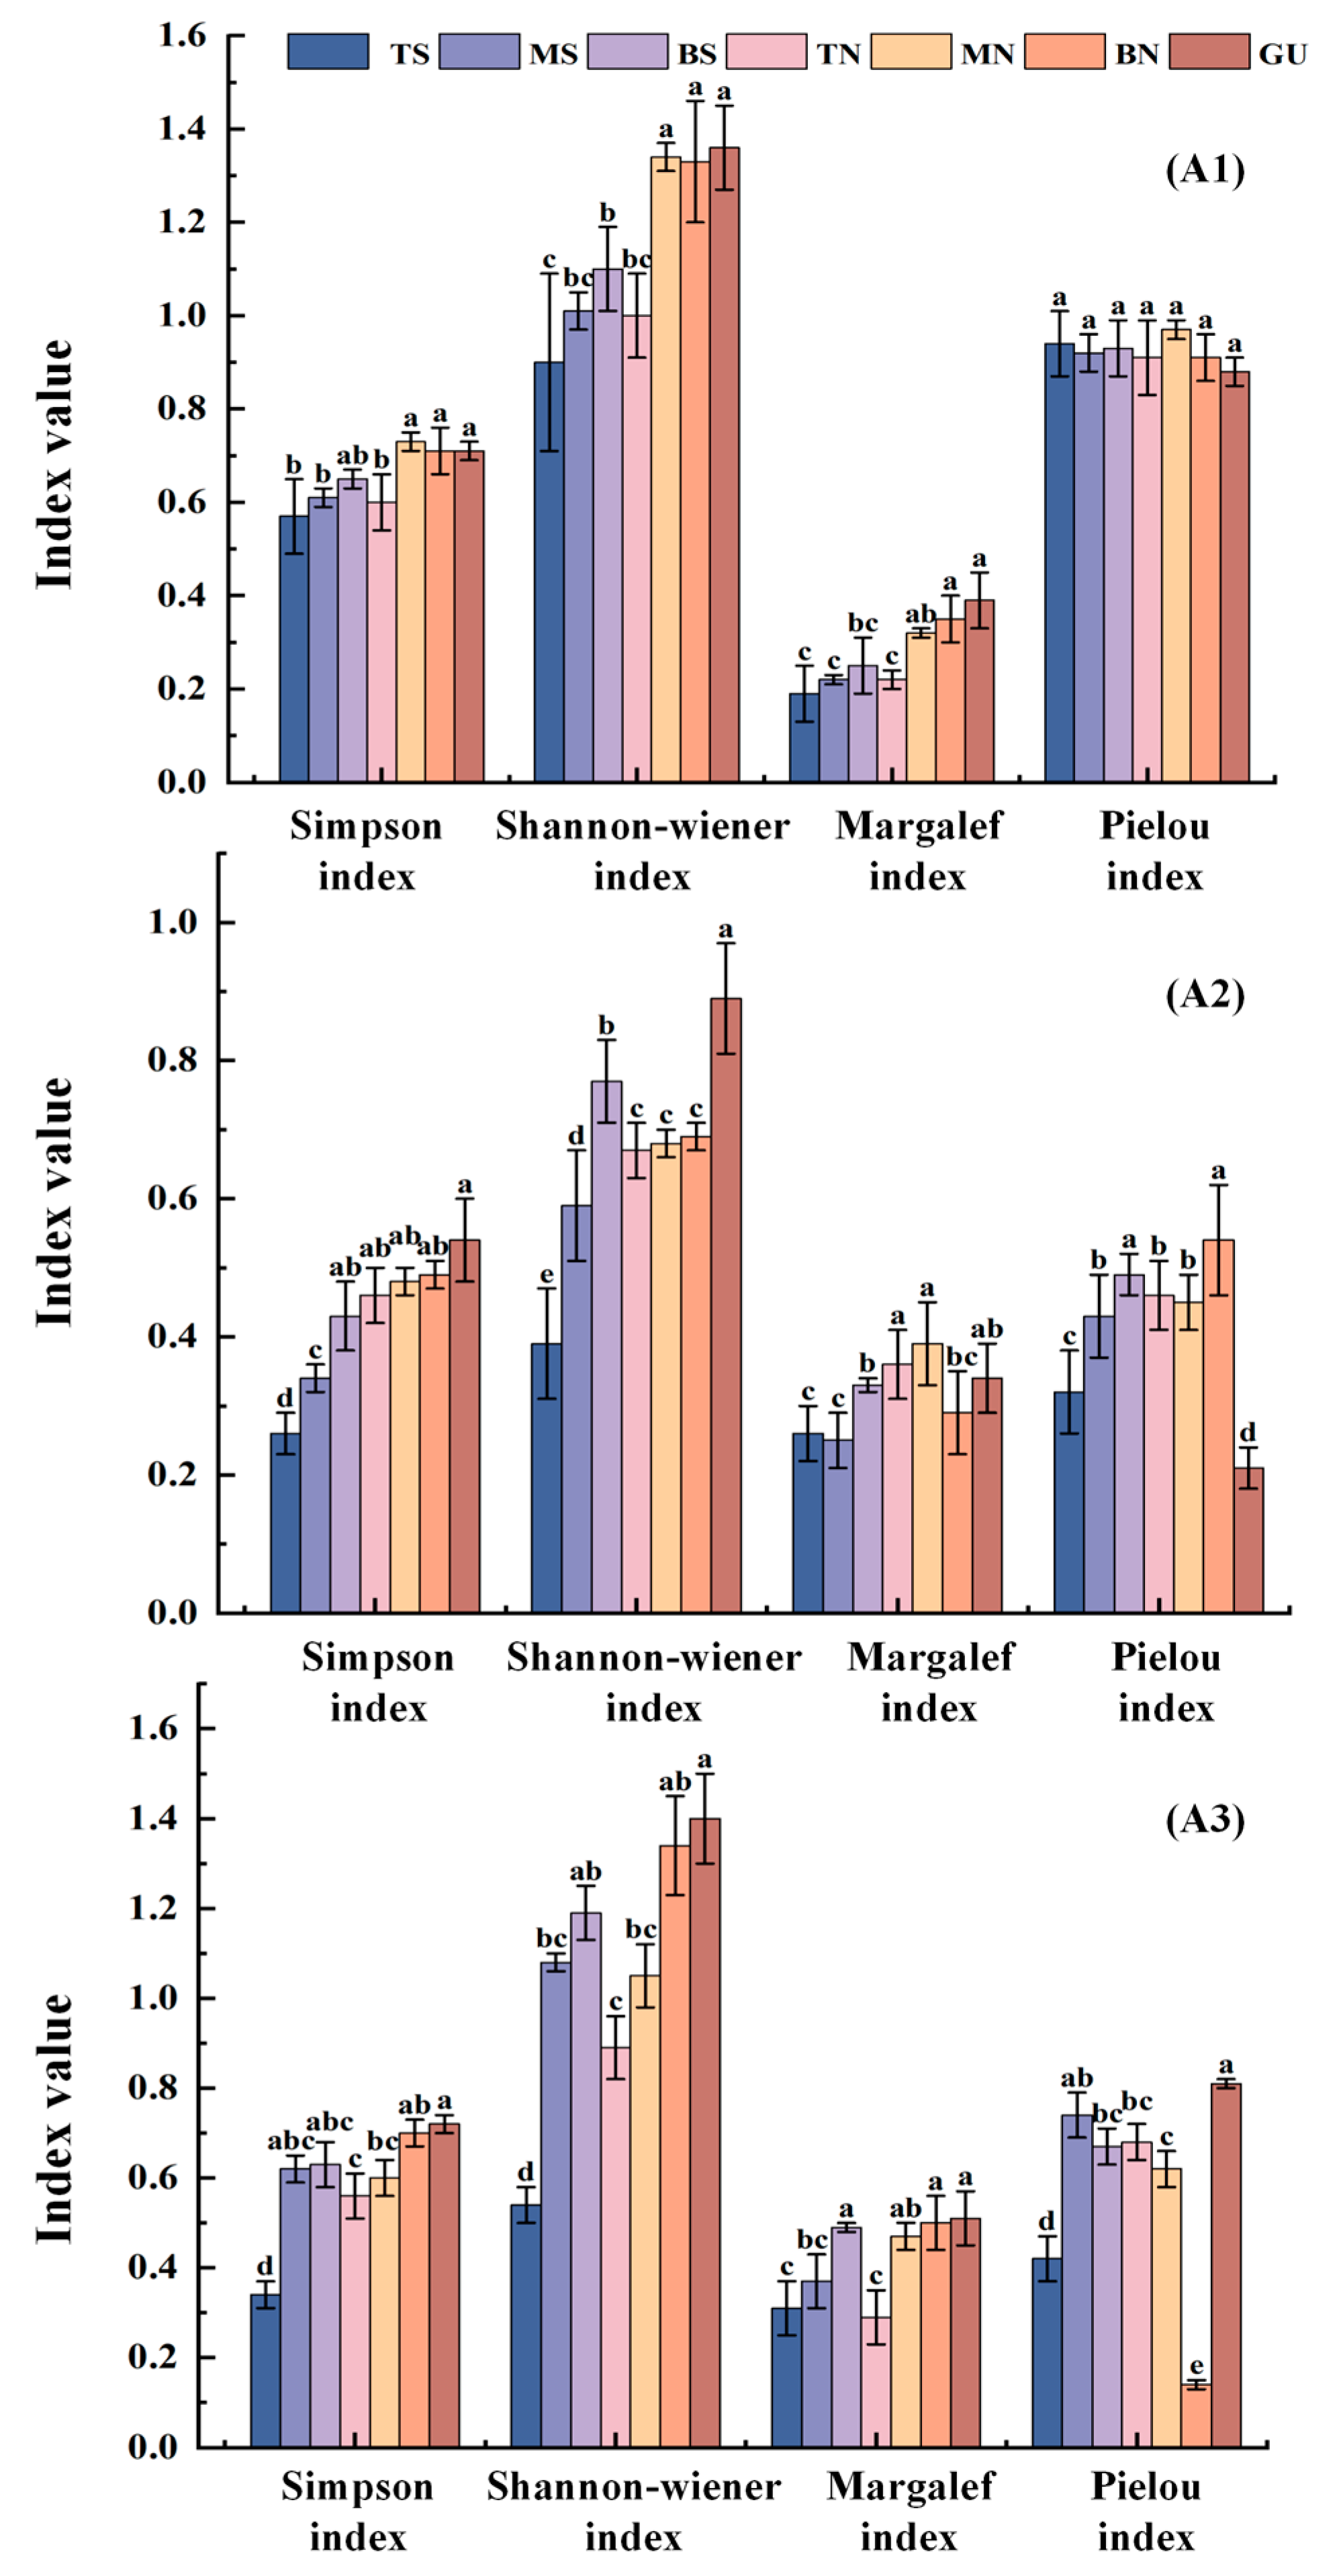
3.2. Characteristics of Changes in Vegetation Community Diversity Under Different Microtopographic Conditions

The Simpson index, Shannon–Wiener index, and Margalef index in regions A1, A2, and A3 were significantly affected by microtopographic differences, generally following these trends: gullies > downslopes > mid-slopes > upslopes, and shady slopes > sunny slopes. Specifically, in region A2, the Shannon–Wiener index in the upslope shady sides was approximately 38% higher than in the upslope sunny sides. In region A3, the Margalef index in the downslope sunny sides was about 33% higher than in the upslope sunny sides. The Pielou index was the lowest in the gully in regions A1 and A2. In region A3, significant differences in the Pielou index were observed among the different microtopographies, with the gullies showing the highest value and the downslope shady sides showing the lowest (Figure 4).
Specifically, in region A1, the Simpson index in MN, BN, and GU was significantly higher than in TS, MS, and TN (p < 0.05), with MN being the highest and TS being the lowest. No significant differences were observed between BS and other microtopographies. The Shannon–Wiener index in MN, BN, and GU was significantly higher than in TS, MS, BS, and TN (p < 0.05), with GU being the highest and TS the lowest. The Margalef index in MN, BN, and GU was significantly higher than in TS, MS, and TN (p < 0.05), with BS and MN showing no significant difference and GU being the highest and TS the lowest. The Pielou index showed no significant differences across microtopographies, with MN being the highest and GU the lowest. In region A2, the Simpson index and Shannon–Wiener index in GU were significantly higher than in other slope microtopographies (p < 0.05), and in TS, they were significantly lower than in other slope microtopographies (p < 0.05). There were no significant differences among TN, MN, and BN. Notably, the Shannon–Wiener index in TN was about 38% higher than in TS. The Margalef index in TN and MN was significantly higher than in other slope microtopographies (p < 0.05), with TS, MS, and BN showing no significant differences, and significantly lower than BS, TN, MN, and GU (p < 0.05). The Pielou index in BS and BN was significantly higher than in other slope microtopographies (p < 0.05), while TS was significantly lower than other slope microtopographies (p < 0.05). In region A3, the Simpson index in TS was significantly lower than in other slope microtopographies (p < 0.05), while MS, BS, TN, and MN showed no significant differences. GU was the highest. The Shannon–Wiener index in TS was significantly lower than in other slope microtopographies (p < 0.05), with MS, BS, MN, and BN showing no significant differences, and GU being the highest. The Margalef index in BS, BN, and GU was significantly higher than in other slope microtopographies (p < 0.05), with TS, MS, and TN showing no significant differences and BS being about 33% higher than TS. The Pielou index in GU was significantly higher than in TS, BS, TN, MN, and GU (p < 0.05), with MS and GU showing no significant difference and BN being significantly lower than other slope microtopographies (p < 0.05).

3.3. Characteristics of Vegetation Community Stability Changes Under Different Microtopographic Conditions

In the M. Godron stability measurement method, Euclidean distance is used to measure the stability state of a community [35,36]. The smaller the distance, the more stable the community is, meaning that the relationship between the cumulative percentage of species and the cumulative relative cover is more aligned with the expected stability pattern. This method is valuable for evaluating community stability characteristics under different microtopographic conditions. By comparing the Euclidean distance between the intersection points of the stability fitting curves and the community stability point (20, 80), we can identify which microtopographies are more favorable for maintaining community stability. This can provide scientific support for ecological restoration and management [35,36,37,38].
From an overall perspective, the stability on the shady slopes is greater than that on the sunny slopes, and the stability on the downslopes is greater than that on the upslopes in the three regions. This suggests that the microtopographic factors, such as slope orientation and position, play a significant role in influencing the stability of vegetation communities in the Loess Plateau. Specifically, the intersection coordinates of the TS stability fitting curves for region A1 were (46.89, 53.11), and the Euclidean distance from the community stabilization point (20, 80) was 38.18. The intersection coordinates of the stability fitting curves for MS, BS, TN, MN, BN, and GU were (46.49, 53.51), (43.60, 56.40), (46.49, 53.51), (45.45, 54.55), (40.47, 59.53), and (42.56, 57.44), and the Euclidean distances from the community stabilization point (20 and 80) were 36.77, 33.94, 36.77, 35.36, 28.28, and 32.53, respectively. The Euclidean distance for BN is 8.49 smaller than that for TN, indicating that the stability on the downslopes is significantly higher than that on the upslopes. The Euclidean distances of the microtopographies were in the order TS > MS > TN > MN > BS > GU > BN, with TS having the lowest community stability and BN having the highest. The intersection coordinates of the fitted stability curves for TS, MS, BS, TN, MN, BN, and GU in area A2 were (48.54, 51.45), (45.45, 54.55), (40.65, 59.35), (43.52, 56.48), (47.06, 52.94), (46.02,53.98), and (41.94,58.06), and the Euclidean distances from the community stabilization point (20, 80) were 41.01, 35.36, 29.70, 33.94, 38.18, 36.77, and 31.11, respectively. The Euclidean distances of each microtopography were in the order of TS > MN > BN > MS > TN > GU > BS. The community stability of TS was the lowest, whereas that of BS was the highest. The intersection coordinates of the fitted stability curves of TS, MS, BS, TN, MN, BN and GU in area A3 were (48.54, 51.46), (45.83, 54.17), (45.45, 54.55), (46.89, 53.11), (44.44, 55.55), (43.49, 56.51), and (40.47, 59.53), and the Euclidean distances from the community stabilization point (20, 80) were 41.01, 36.77, 35.36, 38.18, 33.94, 32.53, and 28.28, respectively. The Euclidean distances of each microtopography were ranked as TS > TN > MS > BS > MN > BN > GU, with TS communities being the least stable and GU gullies being the most stable. The three regions as a whole showed that the stability of shady slopes was greater than that of sunny slopes, and the stability of downslope sites was greater than that of upslope sites (Figure 5; Table 3).

3.4. Correlation Analysis Between Soil Moisture and Vegetation Community Diversity and Stability

Soil moisture was highly significantly positively correlated with the Margalef index (p < 0.01), significantly positively correlated with the M. Godron index (p < 0.05), and negatively correlated with the Pielou index, but did not reach a significant level. The Simpson index was highly significantly positively correlated with the Shannon–Weiner and Pielou indices (p < 0.01) and significantly positively correlated with the M. Godron index (p < 0.05). The Shannon–Weiner index was significantly positively correlated with the Margalef and Pielou indices (p < 0.05) and highly significantly positively correlated with the M. Godron index (p < 0.01). The Margalef richness index was significantly and positively correlated with the M. Godron index (p < 0.05). The Pielou index was positively correlated with the M. Godron stability index but did not reach a significant level (Figure 6).

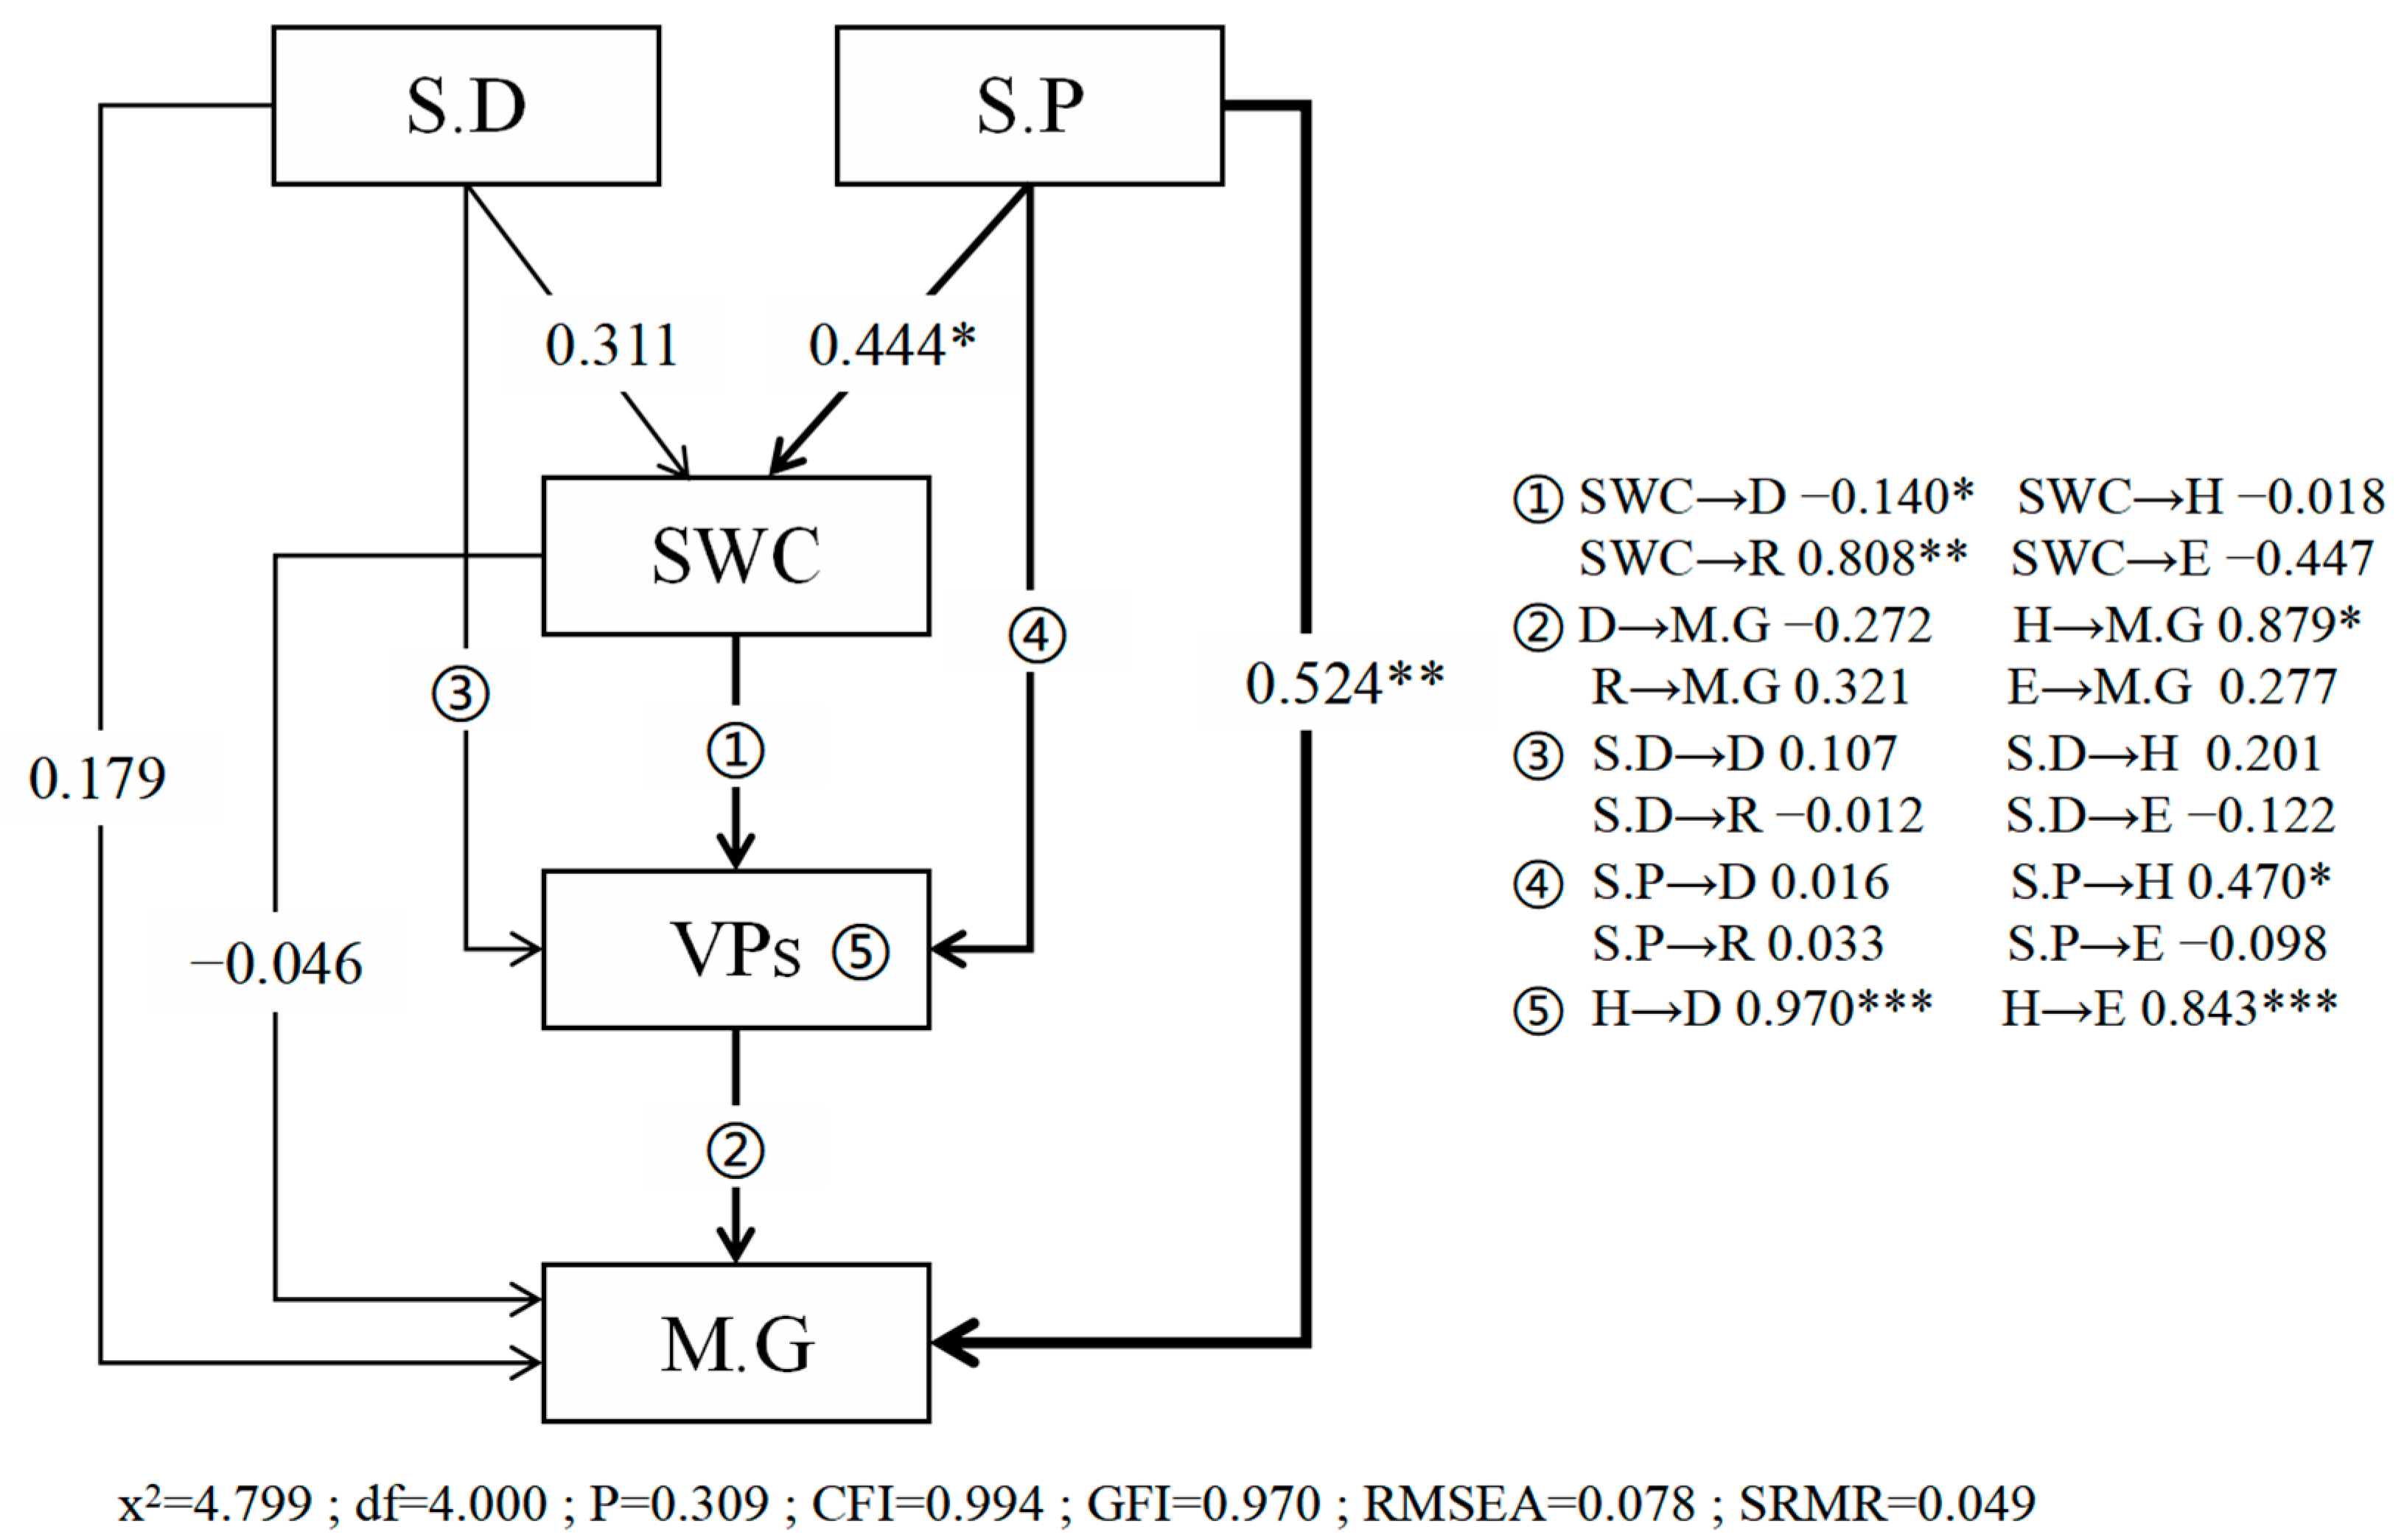
3.5. Microtopography-Soil Moisture-Vegetation Community Relationship Analysis

The structural equation model (SEM) analysis reveals the effects of soil water content (SWC), slope aspect (S.D), slope position (S.P), Simpson species dominance (D), Shannon–Weiner diversity index (H), Margalef species richness (R), and Pielou species evenness (E) on community stability (M.G) (Figure 7). Overall, the Shannon–Weiner diversity index is the central factor affecting community stability. Slope position can directly influence soil water content, which in turn affects plant diversity, ultimately indirectly and significantly impacting vegetation stability.
Specifically, slope position has a significant positive effect on soil water content and the Shannon–Weiner diversity index (p < 0.05), with effect values of 0.444 and 0.470, respectively, and a highly significant positive effect on community stability (p < 0.01), with an effect value of 0.524. Soil water content has a significant positive effect on Margalef species richness (p < 0.01), with an effect value of 0.808. The Shannon–Weiner diversity index has a highly significant positive effect on Simpson species dominance and Pielou species evenness (p < 0.0001), with effect values of 0.970 and 0.843, respectively, and is a significant positive predictor of community stability. Although Margalef species richness and Pielou species evenness do not have a direct significant effect on community stability, they may indirectly influence community stability by affecting the Shannon–Weiner diversity index (Figure 7).

4. Discussion

4.1. The Impact of Microtopography on Soil Moisture

Soil moisture content in the Loess Plateau exhibits significant spatial variation under different microtopographic conditions. The research findings show that the average soil moisture content in the gullies is higher than that in both shady and sunny slopes. The moisture content in the downslope positions is generally higher than in the middle and upslope positions, and the soil moisture on shady slopes is usually higher than that on sunny slopes. This indicates that microtopographic differences in the Loess Plateau significantly regulate the spatial distribution of soil moisture. From the perspective of slope direction, significant differences are observed between sunny and shady slopes. The sunny slopes receive more solar radiation, which leads to faster evaporation rates, directly causing soil moisture to be lost more quickly [23,39]. The rapid evaporation of water results in relatively lower soil moisture on sunny slopes, restricting vegetation growth and distribution. Vegetation on sunny slopes often faces more severe water stress and tends to favor drought-tolerant plant species [8,9,40]. In contrast, shady slopes receive less sunlight and have slower evaporation, allowing soil moisture to be retained for a longer period, providing vegetation with a relatively stable water environment. The difference in water retention capacity not only affects the types and growth conditions of vegetation but may also further impact soil fertility [41,42]. Regarding slope position, upslopes, being at a higher elevation, experience intense solar radiation and strong air convection, which leads to rapid evaporation and lower soil moisture compared to the gully and other slope positions [1,43,44]. Gullies, due to weaker light intensity, smaller temperature differences, and slower air convection, tend to retain soil moisture, resulting in relatively higher moisture content [45]. In addition, as a gathering area for surface runoff, the gully can further replenish moisture through the long-term erosion effects of surface runoff. The moisture differences caused by this terrain not only affect the current distribution of vegetation but may also have a profound impact on the process of vegetation succession [46]. Vegetation restoration is easier in the valley areas with the best moisture conditions and on the downslopes of the shady slopes, while it is more difficult on the upslopes of the sunny slopes [6,47]. This means that when reforesting in the Loess Plateau region, the soil moisture distribution under different microtopographical conditions should be carefully considered to improve the success rate of vegetation restoration and the stability of the ecosystem [48].

4.2. The Impact of Microtopography on Vegetation Community Diversity and Stability

Vegetation species diversity is a good indicator of community structure, organization level, successional stage, degree of stability, and habitat differences [5,45,49]. Compared to sunny slopes, shady slopes usually have higher soil moisture and nutrient retention capacities, which provide more favorable growth conditions for vegetation and thus contribute to vegetation diversity [43,50]. Downslope locations are more prone to water and nutrient accumulation because of their topographic advantages, thus maintaining higher soil wetness [43,51]. At the same time, due to the influence of sedimentation, the soil in downslopes often contains more nutrients, further enhancing soil fertility and providing a favorable soil foundation for vegetation diversity [41,42]. In contrast, the upslopes are more susceptible to erosion, causing water and nutrients in the soil to be more easily lost, leading to drier and nutrient-poor soils. These soil conditions limit vegetation growth and reduce vegetation diversity [42,43]. Consequently, vegetation growth is usually weaker on the upslope than on the downslope, and vegetation restoration and maintenance are relatively more difficult. Gullies, as a unique microtopography, play a crucial role in ecosystems. Located at the bottom of slopes, they are formed by the long-term erosion and accumulation of surface runoff, with distinctive moisture conditions. On one hand, gullies are lower in elevation and serve as areas where water converges, resulting in relatively high soil moisture content. This provides ample water resources for the growth of various plant species, leading to greater plant diversity [52,53]. On the other hand, the relatively stable moisture environment reduces competition between plants, as both intra- and interspecies competition pressures are lower than on sunny slopes and upper slopes. This helps maintain the stability of vegetation communities [47,54].
The environmental differences in different microtopographies ultimately led to the following patterns of vegetation Simpson, Shannon–Wiener, and Margalef indices: gully > downslope > mid-slope > upslope, and shady slope > sunny slope. Although the Pielou index did not differ significantly between microtopographies A1 and A2, it did differ significantly in microtopography A3. This may be due to differences in vegetation types, with large differences within some groups for each measurement index [14].
Vegetation community stability reflects the interspecific competition among plants and the ability of a community to resist environmental stress and anthropogenic disturbances [10]. However, previous studies have rarely considered the response of the vegetation community stability to microtopographic changes. The role of changes in plant community structure and composition on the corresponding stability should be considered in shaded sunny slope gradients, as these changes can have a strong impact on ecosystem service capacity [55]. Overall, this study showed that for A1, A2, and A3, the stability of shady slopes was greater than that of sunny slopes, and the stability of the downslopes was greater than that of the upslopes. This means that changes in slope direction and position on the Loess Plateau will significantly affect ecosystem service functions. The high rate of land exposure on the sunny slopes and upslopes is poor, which may be related to the harsh living environment, poor soil water storage capacity, nutrient and water scarcity, and the aggregation of plants in locally suitable patches to share scarce resources, thus exacerbating intraspecific and interspecific competition and leading to poor community stability [14].
On the Loess Plateau, soil moisture is a known major limiting factor for vegetation growth and is positively correlated with plant diversity and community stability. Vegetation recovery is largely dependent on soil moisture conditions, and favorable moisture conditions contribute positively to vegetation community diversity [55,56].

4.3. The Relationship Between Microtopography, Soil Moisture, and Vegetation

The structural equation model analysis reveals the complex relationships between microtopography, soil moisture, and vegetation. The analysis results show that slope position directly and significantly positively influences soil moisture content, which in turn indirectly positively influences the Shannon–Weiner index and community stability. Specifically, slope position has a significant positive effect on soil moisture content, while soil moisture content significantly affects the Margalef index. The Shannon–Weiner index directly and extremely significantly influences the Simpson index and Pielou index and serves as a significant positive predictor of community stability. Therefore, slope position and soil moisture content indirectly affect community stability through their influence on diversity indices. This result suggests that changes in slope position affect vegetation community structure and function by altering soil moisture conditions [41,42]. This unique influence pathway fully demonstrates the key role of slope position in the process of microtopography’s impact on vegetation communities. In the geomorphologically complex region of the Loess Plateau, there are significant differences in light, moisture, and nutrient conditions across different slope positions. The upslope position may have limited vegetation growth due to rapid water loss and shallow soil, while the downslope position typically accumulates more moisture and nutrients, favoring vegetation growth and development [1,43,44]. Therefore, the differences in slope positions lead to variations in vegetation community composition and structure, thereby affecting community stability [55,56]. This result underscores the critical role of slope position in maintaining community stability. Moreover, a higher Shannon–Weiner index indicates higher species richness and evenness in the community, with more complex and stable species interactions, which enhances the community’s resistance to and resilience against environmental changes. Although the Margalef index and Pielou index do not have a direct significant effect on community stability, they may indirectly influence community stability through their effect on the Shannon–Weiner index.
Compared with some existing studies, which mainly focus on the impact of microtopographic factors such as slope aspect and slope position on plant communities, this study, using the powerful tool of Structural Equation Modeling (SEM), quantifies the direct and indirect relationships between slope position, soil moisture, and vegetation communities. It reveals the significant dominant role of slope position in maintaining community stability in the Loess Plateau region and clearly explains the intrinsic mechanism by which changes in slope position affect vegetation community structure and function through changes in soil moisture conditions. This discovery not only makes up for the lack of research on the impact of microtopography factors on vegetation communities but also provides a new perspective for understanding the interactive relationship between topography, soil and vegetation in ecosystems.
In the vegetation construction of the Loess Plateau, it is essential to consider habitat differences due to microtopographic types for the reasonable configuration of vegetation. Among them, slope position has an extremely important influence on vegetation community stability and is a key factor to focus on when formulating vegetation restoration strategies. For sunny slopes and upslope positions, drought-resistant and nutrient-poor tolerant plant species with strong adaptability should be selected to reduce intra- and interspecies competition and enhance community stability [57,58]. For shady slopes and downslope positions, it is necessary to strengthen the protection and fine management of existing vegetation, prioritizing the stability and resilience of the vegetation. Scientific regulation should be applied to promote the natural succession of the community, transitioning from annual to perennial plants, gradually enhancing vegetation diversity and community stability [51,58,59]. Previous studies have focused more on slope aspect, neglecting the influence of slope position on vegetation restoration. In the future, more research should be conducted on how microtopographic factors like slope position affect vegetation growth. By fully considering slope position factors and integrating both slope aspect and slope position, more scientifically effective ecological restoration can be achieved. On this basis, vegetation restoration plans should be formulated according to local conditions, integrating microtopography with natural geographic characteristics and key ecological environmental issues, thus promoting the sustainable improvement of the ecological environment of the Loess Plateau. This approach will also provide scientific references for environmental restoration in ecologically fragile regions worldwide.

5. Conclusions

This study utilized soil moisture sampling data and vegetation survey data from the typical hilly area of the Loess Plateau between July and September 2023 to comprehensively analyze the differences in soil moisture and vegetation growth conditions under varying microtopographies. The research found that the spatial distribution of soil moisture, as well as vegetation community diversity and stability, significantly varied due to microtopographic differences. The soil moisture content of each microtopography in the study area increased with soil depth, with the highest moisture content observed in the gullies, followed by the shady slopes, which were greater than the sunny slopes, and downslopes generally had higher moisture content than upslopes. In terms of plant diversity, the species abundance and dominance were greater in downslopes compared to upslopes. The evenness distribution was lowest in the gully areas of regions A1 and A2, with no significant differences in other microtopographies. In region A3, the differences were significant, with the gully area being the largest and the downslope shady side the smallest. Regarding vegetation stability, overall, the stability of shady slopes was higher than that of sunny slopes, and the stability of downslopes was higher than that of upslopes. In the microtopography–soil moisture–vegetation relationship, slope position directly and significantly positively affects soil moisture, which in turn indirectly influences vegetation diversity and stability.
The vegetation restoration of the Loess Plateau should be tailored to habitat differences associated with microtopographic types, ensuring a rational selection of plant species. In relatively arid regions, drought-tolerant and nutrient-poor-adapted plants should be prioritized for sunny slopes and upslopes, with a primary focus on grasses. In contrast, shady and downslopes should adopt a balanced mix of trees, shrubs, and grasses in appropriate proportions, while also enhancing the protection and meticulous management of existing vegetation to promote natural succession and improve community stability. Future research should pay closer attention to the impact of slope position on soil moisture, nutrients, and vegetation communities. It is essential to incorporate studies on microtopographic features such as convex and concave slopes and establish long-term monitoring plots to collect continuous multi-year data. This would facilitate an in-depth exploration of the dynamic changes in soil moisture and nutrients across different seasons and years under various microtopographic conditions, as well as their influence on vegetation community succession. Additionally, potential factors such as land use should be considered to achieve more scientifically effective ecological restoration. Understanding the relationships between microtopography, soil moisture, and vegetation communities enables precise, site-specific vegetation restoration strategies. This is crucial for promoting the sustainable development of ecosystems in arid and semi-arid regions.

Author Contributions

Conceptualization, L.H., Y.L. and F.T.; methodology, L.H. and Y.L.; software, Y.L., L.H., J.L. and F.T.; investigation, L.H., Z.L., H.K., J.L., Y.R., S.G. and C.Y.; resources, L.H.; data curation, L.H., Y.L., J.L., Z.L. and G.H.; writing—original draft preparation, L.H. and Y.L.; writing—review and editing, L.H., Y.L. and F.T. All authors have read and agreed to the published version of the manuscript.

Funding

This study was funded by the National Key Research and Development Program of China (No. 2023YFF1305105), the National Natural Science Foundation of China (Program No. 41871190), and the Fundamental Research Funds for the Central Universities, CHD (Program No. 300102353201). The sponsors had no role in the design, execution, interpretation, or writing of the study.

Data Availability Statement

The datasets analyzed during the current study are available from the corresponding author on reasonable request.

Acknowledgments

We are grateful to the anonymous reviewers whose comments have helped to clarify and improve the text.

Conflicts of Interest

The authors declare that they have no known competing financial interests or personal relationships that could have appeared to influence the work reported in this paper.

References

  1. He, J.; Shi, X.; Fu, Y. Identifying vegetation restoration effectiveness and driving factors on different micro-topographic types of hilly Loess Plateau: From the perspective of ecological resilience. J. Environ. Manag. 2021, 289, 112562. [Google Scholar] [CrossRef]
  2. Ju, J.; Masek, J.G. The vegetation greenness trend in Canada and US Alaska from 1984–2012 Landsat data. Remote Sens. Environ. 2016, 176, 1–16. [Google Scholar] [CrossRef]
  3. Huang, L. Advances and perspectives on soil water research in China’s Loess Plateau. Earth-Sci. Rev. 2019, 199, 102962. [Google Scholar] [CrossRef]
  4. Alarcón, R.; Hernández-Plaza, E.; Navarrete, L.; Sánchez, M.J.; Escudero, A.; Hernanz, J.L.; Sánchez-Giron, V.; Sánchez, A. Effects of no-tillage and non-inversion tillage on weed community diversity and crop yield over nine years in a Mediterranean cereal-legume cropland. Soil Tillage Res. 2018, 179, 54–62. [Google Scholar] [CrossRef]
  5. Grime, J.P. Benefits of plant diversity to ecosystems: Immediate, filterand founder effects. J. Ecol. 1998, 86, 902–910. [Google Scholar] [CrossRef]
  6. Liao, C.; Liu, B.; Xu, Y.; Li, Y.; Li, H. Effect of topography and protecting barriers on revegetation of sandy land, Southern Tibetan Plateau. Sci. Rep. 2019, 9, 6501. [Google Scholar] [CrossRef]
  7. Sun, C.; Chai, Z.; Liu, G.; Xue, S. Changes in species diversity patterns and spatial heterogeneity during the secondary succession of grassland vegetation on the Loess Plateau, China. Front. Plant Sci. 2017, 8, 1465. [Google Scholar] [CrossRef] [PubMed]
  8. Clifford, M.J.; Royer, P.D.; Cobb, N.S.; Breshears, D.D.; Ford, P.L. Precipitation thresholds and drought-induced tree die-off: Insights from patterns of Pinus edulis mortality along an environmental stress gradient. New Phytol. 2013, 200, 413–421. [Google Scholar] [CrossRef]
  9. Kong, W.; Yao, Y.; Zhao, Z.; Qin, X.; Zhu, H.; Wei, X.; Su, M.; Wang, Z.; Bao, K.; Su, M. Effects of vegetation and slope aspect on soil nitrogen mineralization during the growing season in sloping lands of the Loess Plateau. Catena 2019, 172, 753–763. [Google Scholar] [CrossRef]
  10. Fang, J.-Y.; Shen, Z.-H.; Cui, H.-T. Ecological characteristics of mountains and re-search issues of mountain ecology. Biodivers Sci. 2004, 12, 10–19. [Google Scholar] [CrossRef]
  11. Cadotte, M.W.; Carscadden, K.; Mirotchnick, N. Beyond species: Functional diversity and the maintenance of ecological processes and services. J. Appl. Ecol. 2011, 48, 1079–1087. [Google Scholar]
  12. Sun, W.; Shao, Q.; Liu, J.; Zhai, J. Assessing the effects of land use and topography on soil erosion on the Loess Plateau in China. Catena 2014, 121, 151–163. [Google Scholar] [CrossRef]
  13. Gao, X.; Zhao, X.; Wu, P.; Brocca, L.; Zhang, B. Effects of large gullies on catchment-scale soil moisture spatial behaviors: A case study on the Loess Plateau of China. Geoderma 2016, 261, 1–10. [Google Scholar] [CrossRef]
  14. Qiao, H.; Li, Q.; He, G.; Ji, T.; Yang, D.Y.; Wen, T.; Guan, W.H.; Liu, Z.G.; Yang, J.Y.; Liu, X.N. Biodiversity and community stability of mountain meadow vegetation in response to slope orientation. J. Grassl. Sci. 2022, 30, 2173–2181. [Google Scholar] [CrossRef]
  15. Lei, S.; Liao, L.; Wang, J.; Zhang, L.; Ye, Z.; Liu, G.; Zhang, C. Relationship between plant diversity and Godron community stability in alpine grassland and its environmental drivers. J. Grassl. Sci. 2023, 32, 1–12. [Google Scholar]
  16. Zhao, W.; Zhang, Y.; Zhu, Q. Effects of microtopography on tree growth characteristic in loess slope of northern Shaanxi. J. Basic Sci. Eng. 2014, 22, 69. [Google Scholar]
  17. Jiang, C.; Zhang, H.; Wang, X.; Feng, Y.; Labzovskii, L. Challenging the land degradation in China’s Loess Plateau: Benefits, limitations, sustainability, and adaptive strategies of soil and water conservation. Ecol. Eng. 2019, 127, 135–150. [Google Scholar] [CrossRef]
  18. Yu, Y.; Zhao, W.; Martinez-Murillo, J.F.; Pereira, P. Loess Plateau: From degradation to restoration. Sci. Total Environ. 2020, 738, 140206. [Google Scholar]
  19. Yang, L.; Wei, W.; Chen, L.; Jia, F.; Mo, B. Spatial variations of shallow and deep soil moisture in the semi-arid Loess Plateau, China. Hydrol. Earth Syst. Sci. 2012, 16, 3199–3217. [Google Scholar]
  20. Liu, Y.; Du, J.; Xu, X.; Kardol, P.; Hu, D. Microtopography-induced ecohydrological effects alter plant community structure. Geoderma 2020, 362, 114119. [Google Scholar]
  21. Yao, S.; Li, H. Agricultural productivity changes induced by the sloping land conversion program: An analysis of Wuqi county in the Loess Plateau region. Environ. Manag. 2010, 45, 541–550. [Google Scholar]
  22. Lin, Y.; Yao, S. Impact of the Sloping Land Conversion Program on rural household income: An integrated estimation. Land Use Policy 2014, 40, 56–63. [Google Scholar]
  23. Yu, B.; Liu, G.; Liu, Q.; Wang, X.; Feng, J.; Huang, C. Soil moisture variations at different topographic domains and land use types in the semi-arid Loess Plateau, China. Catena 2018, 165, 125–132. [Google Scholar]
  24. Cui, M.; Zhou, R.; Zheng, C.; Wei, J.; Wan, J.; Zhao, Y.; Wen, Z. Responses of Aboveground Biomass and Soil Moisture and Nutrients to Microtopographic Changes in Grassland in the Loess Hilly Region. Res. Soil Water Conserv. 2024, 31, 18–26. [Google Scholar]
  25. Huffman, R.L.; Fangmeier, D.D.; Elliot, W.J.; Workman, S.R.; Schwab, G.O. Soil and Water Conservation Engineering; American Society of Agricultural and Biological Engineers: St. Joseph, MI, USA, 2013. [Google Scholar]
  26. Chen, Y.; Jiao, J.; Yan, X.; Li, J.; Vanmaercke, M.; Wang, N. Response of gully morphology and density to the spatial and rainy-season monthly variation of rainfall at the regional scale of the Chinese Loess Plateau. Catena 2024, 236, 107773. [Google Scholar]
  27. Chase, J.M.; Knight, T.M. Scale-dependent effect sizes of ecological drivers on biodiversity: Why standardised sampling is not enough. Ecol. Lett. 2013, 16, 17–26. [Google Scholar]
  28. Mallarino, A.P.; Wittry, D.J. Efficacy of grid and zone soil sampling approaches for site-specific assessment of phosphorus, potassium, pH, and organic matter. Precis. Agric. 2004, 5, 131–144. [Google Scholar]
  29. Shannon, C.E. The mathematical theory of communication. MD Comput. 1997, 14, 306–317. [Google Scholar]
  30. Margalef, R. Information Theory in Ecology; Real Academia de Ciencias y Artes de Barcelona: Barcelona, Spain, 1973. [Google Scholar]
  31. Simpson, E.H. Measurement of diversity. Nature 1949, 163, 688. [Google Scholar]
  32. Pielou, E.C. The measurement of diversity in different types of biological collections. J. Theor. Biol. 1966, 13, 131–144. [Google Scholar]
  33. Li, X.; Yang, W.; Sun, T.; Su, L. Framework of multidimensional macrobenthos biodiversity to evaluate ecological restoration in wetlands. Environ. Res. Lett. 2019, 14, 054003. [Google Scholar] [CrossRef]
  34. Li, S.; Sun, T.; Yang, W.; Cui, B.; Yin, X. A biodiversity evaluation framework for restoration of aquatic macrophyte communities in shallow lakes driven by hydrological process management. Hydrol. Process. 2021, 35, e13983. [Google Scholar] [CrossRef]
  35. Godron, M. Some aspecets of heterogeneity in grasslands of Cantal. Statis. Ecol. 1972, 3, 397–415. [Google Scholar]
  36. Zheng, Y. Comparison of methods for studying stability of forest community. Sci. Silvae Sin. 2000, 36, 28–32. [Google Scholar] [CrossRef]
  37. Li, L.; Jiang, E.; Yin, H.; Wu, K.; Dong, G. Ultrashort-term responses of riparian vegetation restoration to adjacent cycles of ecological water conveyance scheduling in a hyperarid endorheic river basin. J. Environ. Manag. 2022, 320, 115803. [Google Scholar] [CrossRef]
  38. Jin, S.S.; Zhang, Y.Y.; Zhou, M.L.; Dong, X.M.; Chang, C.H.; Wang, T.; Yan, D.F. Interspecific association and community stability of tree species in natural secondary forests at different altitude gradients in the southern Taihang Mountains. Forests 2022, 13, 373. [Google Scholar] [CrossRef]
  39. Zhang, X.; Zhao, W.; Wang, L.; Liu, Y.; Liu, Y.; Feng, Q. Relationship between soil water content and soil particle size on typical slopes of the Loess Plateau during a drought year. Sci. Total Environ. 2019, 648, 943–954. [Google Scholar] [CrossRef]
  40. Miyasaka, T.; Okuro, T.; Miyamori, E.; Zhao, X.; Takeuchi, K. Effects of different restoration measures and sand dune topography on short-and long-term vegetation restoration in northeast China. J. Arid Environ. 2014, 111, 1–6. [Google Scholar] [CrossRef]
  41. Gao, R.; Zhao, Y.G.; Liu, X.F.; Li, W.Y.; Du, Y.J.; Zhang, X.X. Effects of stand age and slope position of Caragana korshinskii plantations on soil aggregate stability in the loess hilly region. Acta Ecol. Sin. 2020, 40, 2964–2974. [Google Scholar] [CrossRef]
  42. Luo, J.; Zheng, Z.; Li, T.; He, S.; Zhang, X.; Huang, H.; Wang, Y. Quantifying the contributions of soil surface microtopography and sediment concentration to rill erosion. Sci. Total Environ. 2021, 752, 141886. [Google Scholar] [CrossRef]
  43. Tian, X.; Gao, K.; Zhang, L.J.; Yu, Y.Q.; Han, G.D. Effect of slope position on spatial distribution of soil water and vegetation in sandy land. J. Soil Water Conserv. 2015, 35, 12–16. [Google Scholar] [CrossRef]
  44. Zhang, L.; Yu, Y.; Gao, K. Response of plant functional groups and their diversity to microtopographic changes in sandy areas. J. Grassl. 2015, 23, 41–46. [Google Scholar] [CrossRef]
  45. Coverdale T, C.; Davies A, B. Unravelling the relationship between plant diversity and vegetation structural complexity: A review and theoretical framework. J. Journal of Ecology. 2023, 111, 1378–1395. [Google Scholar]
  46. Jahantigh, M.; Pessarakli, M. Causes and effects of gully erosion on agricultural lands and the environment. Commun. Soil Sci. Plant Anal. 2011, 42, 2250–2255. [Google Scholar]
  47. Tong, X.; Wang, K.; Brandt, M.; Yue, Y.; Liao, C.; Fensholt, R. Assessing future vegetation trends and restoration prospects in the karst regions of southwest China. Remote Sens. 2016, 8, 357. [Google Scholar] [CrossRef]
  48. Gao, X.; Wu, P.; Zhao, X.; Shi, Y.; Wang, J.; Zhang, B. Soil moisture variability along transects over a well-developed gully in the Loess Plateau, China. Catena 2011, 87, 357–367. [Google Scholar] [CrossRef]
  49. Chesson, P.; Gebauer, R.L.E.; Schwinning, S.; Huntly, N.; Wiegand, K.; Ernest, M.S.K.; Sher, A.; Novoplansky, A.; Weltzin, J.F. Resource pulses, species interactions, and diversity maintenance in arid and semi-arid environments. Oecologia 2004, 141, 236–253. [Google Scholar]
  50. Wang, J.; Zhao, W.; Zhang, X.; Liu, Y.; Wang, S.; Liu, Y. Effects of reforestation on plant species diversity on the Loess Plateau of China: A case study in Danangou catchment. Sci. Total Environ. 2019, 651, 979–989. [Google Scholar] [CrossRef]
  51. Zhang, Y.W.; Deng, L.; Yan, W.M.; Shangguan, Z.P. Interaction of soil water storage dynamics and long-term natural vegetation succession on the Loess Plateau, China. Catena 2016, 137, 52–60. [Google Scholar] [CrossRef]
  52. Yu, B.; Liu, G.; Liu, Q.; Feng, J.; Wang, X.; Han, G.; Huang, C. Effects of micro-topography and vegetation type on soil moisture in a large gully on the Loess Plateau of China. Hydrol. Res. 2018, 49, 1255–1270. [Google Scholar]
  53. Li, C.; Yang, X.; Chen, Y.; Zhou, X.; Li, S.; Cui, X.; Tang, G. Assessing the influence of geo-environmental factors on discontinuous gully erosion at regional scales: A case study of spoon gullies on the loess plateau of China. J. Environ. Manag. 2025, 373, 123940. [Google Scholar] [CrossRef] [PubMed]
  54. Fan, F.; Gu, X.; Luo, J.; Zhang, B.; Liu, H.; Yang, H.; Wang, L. Identification of gully erosion activity and its influencing factors: A case study of the Sunshui River Basin. PLoS ONE 2024, 19, e0309672. [Google Scholar] [CrossRef] [PubMed]
  55. de Mazancourt, C.; Isbell, F.; Larocque, A.; Berendse, F.; De Luca, E.; Grace, J.B.; Haegeman, B.; Polley, H.W.; Roscher, C.; Schmid, B.; et al. Predicting ecosystem stability from community composition and biodiversity. Ecol. Lett. 2013, 16, 617–625. [Google Scholar] [CrossRef] [PubMed]
  56. He, S.; Zhang, C.; Meng, F.-R.; Bourque, C.P.-A.; Huang, Z.; Li, X. Impacts of re-vegetation on soil water dynamics in a semiarid region of Northwest China. Sci. Total Environ. 2024, 911, 168496. [Google Scholar] [CrossRef]
  57. Brandt, M.; Hiernaux, P.; Rasmussen, K.; Mbow, C.; Kergoat, L.; Tagesson, T.; Ibrahim, Y.Z.; Wélé, A.; Tucker, C.J.; Fensholt, R. Assessing woody vegetation trends in Sahelian drylands using MODIS based seasonal metrics. Remote Sens. Environ. 2016, 183, 215–225. [Google Scholar] [CrossRef]
  58. Tian, Q.; Zhang, X.; Wang, M.; Wang, H.J.; Yi, H.J.; He, J.; Xu, X.M.; Lyu, D.; Sun, W.N. Relationship between plant compositional diversity and community stability with soil aggregates under vegetation succession. China Environ. Sci. 2022, 42, 5885–5895. [Google Scholar] [CrossRef]
  59. Jiao, F.; Wen, Z.M.; An, S.S. Changes in soil properties across a chronosequence of vegetation restoration on the Loess Plateau of China. Catena 2011, 86, 110–116. [Google Scholar] [CrossRef]
Figure 1. Geographic location map of the study area: Dingbian County (A1), Wuqi County (A2), and Fu County (A3).
Water 17 01012 g001
Figure 2. (a) Schematic topographic profile of area A1; (b) schematic topographic profile of area A2; (c) schematic topographic profile of area A3; (d) schematic of vegetation sample plots and sampling.
Water 17 01012 g002
Figure 3. Characteristics of microtopographic soil moisture changes: TS: upslope sunny side; MS: mid-slope sunny side; BS: downslope sunny side; TN: upslope shaded side; MN: mid-slope shaded side; BN: downslope shaded side; GU: gully. A1: Dingbian County; A2: Wuqi County; A3: Fu County.
Water 17 01012 g003
Figure 4. Characteristics of microtopographic vegetation communities: TS: upslope sunny side; MS: mid-slope sunny side; BS: downslope sunny side; TN: upslope shady side’ MN: mid-slope shady side; BN: downslope shady side; GU: gully. A1: Dingbian County; A2: Wuqi County; A3: Fu County. The letter markers (a, b, c) are used to indicate statistically significant differences.
Water 17 01012 g004
Figure 5. Godron stability fitting curves.
Water 17 01012 g005
Figure 6. Correlation analysis between soil moisture and various vegetation indicators. SWC, soil water content; D, Simpson index; H, Shannon–Weiner index; R, Margalef index; E, Pielou index; M.G, M.G index (replace with 100 minus actual M.G value). * and ** indicate p < 0.05 and p < 0.01, respectively.
Water 17 01012 g006
Figure 7. The width of the arrows is proportional to the strength of the effect, and the numbers on the arrows represent the standardized path coefficients. Structural equation model of microtopography, soil water, vegetation community diversity and stability. S.D, slope direction; S.P, slope position; SWC, soil water content; VPs, vegetation parameters; D, Simpson index; H, Shannon–Weiner index; R, Margalef index; E, Pielou index; M.G, M.G index (replace with 100 minus actual M.G value). * indicates p < 0.05, ** indicates p < 0.01, *** indicates p < 0.001.
Water 17 01012 g007
Table 1. Basic information on the sample sites.
Area NumberSample PlotSlope
Micro-Topography
Longitude and LatitudeElevation/mQuadrat Vegetation TypeDominant Species *
A11TS107°84′37″ E, 37°38′63″ N1797grassLinum perenne L. Stipa capillata L.
2MS107°84′39″ E, 37°38′58″ N1771grassLinum perenne L. Stipa capillata L. Artemisia frigida Willd.
3BS107°84′39″ E, 37°38′58″ N1743grassLinum perenne L. Stipa capillata L. Stipa bungeana Trin.
4TN107°84′53″ E, 37°38′71″ N1788grassLinum perenne L. Stipa capillata L.
5MN107°85′89″ E, 37°38′90″ N1691grassStipa capillata L. Artemisia frigida Willd. Potentilla acaulis L.
6BN107°85′86″ E, 37°38′95″ N1658grassCaragana Korshinskii Kom. Stipa capillata L. Cymbaria mongolica Maxim.
7GU107°85′72″ E, 37°38′38″ N1648grassArtemisia frigida Willd. Stipa capillata L. Lespedeza tomentosa (Thunb.) Siebold ex Maxim.
A28TS108°14′12″ E, 37°12′76″ N1549arbor-grassPrunus sibirica L. (arbor) Stipa capillata L. (grass)
9MS108°14′02″ E, 37°12′75″ N1503arbor-grassPrunus sibirica L. (arbor) Stipa capillata L. (grass) Artemisia stechmanniana Besser.(grass)
10BS108°19′41″ E, 37°47′05″ N1472arbor-grassPrunus sibirica L. (arbor) Pyrus betulifolia Bunge.(arbor) Stipa capillata L. (grass)
11TN108°14′06″ E, 37°12′56″ N1528arbor-shrub-grassPrunus sibirica L. (arbor) Hippophae rhamnoides L. (shrub) Stipa capillata L. (grass)
12MN108°14′07″ E, 37°12′58″ N1504arbor-shrub-grassPrunus sibirica L. (arbor) Hippophae rhamnoides L. (shrub) Artemisia stechmanniana Besser.(grass) Stipa capillata L. (grass)
13BN108°14′08″ E, 37°12′54″ N1476arbor-shrub-grassPopulus simonii Carrière Prunus sibirica L. (arbor) Caragana korshinskii Kom.(shrub) Stipa capillata L. (grass)
14GU108°14′08″ E, 37°12′55″ N1465arbor-shrub-grassPopulus simonii.(arbor) Carrière Prunus sibirica L. (arbor) Caragana korshinskii Kom.(shrub) Stipa capillata L. (grass)
A315TS109°66′57″ E, 36°11′43″ N1246arbor-grassPinus tabuliformis Carrière.(arbor) Acer tataricum L. (arbor) Allium ramosum L. (grass)
16MS109°66′60″ E, 36°11′41″ N1228arbor-grassPinus tabuliformis Carrière.(arbor) Prunus sibirica L. (arbor) Allium ramosum L. (grass) Phtheirospermum japonicum (Thunb.) Kanitz.(grass)
17BS109°66′61″ E, 36°11′39″ N1212arbor-grassAcer tataricum L. (arbor) Allium ramosum L. (grass) Rubia cordifolia L. (grass)
18TN109°65′89″ E, 36°11′27″ N1234arbor-grassPinus tabuliformis Carrière.(arbor) Quercus wutaishansea Mary.(arbor) Allium ramosum L. (grass)
19MN109°65′86″ E, 36°11′22″ N1215arbor-shrub-grassPinus tabuliformis Carrière.(arbor) Quercus wutaishansea Mary.(arbor) Allium ramosum L. (grass) Rubus parvifolius L. (grass)
20BN109°65′85″ E, 36°11′26″ N1199arbor-shrub-grassPinus tabuliformis Carrière.(arbor) Acer tataricum L. (arbor) Allium ramosum L. (grass) Chrysanthemum chanetii H. Lév.(grass)
21GU109°65′85″ E, 36°11′25″ N1193arbor-shrub-grassTamarix chinensis Lour.(arbor) Rubus parvifolius L. (grass) Amethystea caerulea L. (grass)
Note(s): * The dominant species in the study area are determined based on relative cover (the percentage of a species’ cover to the total cover of all species).
Table 2. Calculation formula for vegetation parameters.
Vegetation ParametersFormula
Shannon–Wiener indexH = − i = 1 s ( P i l n P i )
Margalef indexR = (S − 1)/lnN
Simpson indexD = 1 − i = 1 s ( P i 2 )
Pielou indexE = H/lnS
Note(s): S is the number of species in the sample plot; Pi is the relative importance of species i within the community; N is the total number of individuals of all species in the sample.
Table 3. Effect of microtopography on the stability of vegetation communities.
Area
Number
MicrotopographyFitting CurveR2Coordinates of the Intersection Point with the Line y = 100 − xEuclidean Distance from the Stable Point of the Community (20, 80)
TSy = −0.09x2 + 1.57x − 0.490.9991(46.89,53.11)38.18
MSy = −0.09x2 + 1.57x − 0.490.9991(46.49,53.51)36.77
BSy = −0.26x2 + 2.49x − 1.240.9989(43.60,56.40)33.94
A1TNy = −0.09x2 + 1.57x − 0.490.9991(46.49,53.51)36.77
MNy = −0.02x2 + 1.42x − 0.400.9981(45.45,54.55)35.36
BNy = 0.11x2 + 1.43x − 0.570.9833(40.47,59.53)28.28
GUy = 0.03x2 + 1.63x − 0.670.9985(42.56,57.44)32.53
TSy = −0.03x2 + 1.24x − 0.200.9979(48.54,51.45)41.01
MSy = −0.02x2 + 1.42x − 0.400.9944(45.45,54.55)35.36
BSy = −0.04x2 + 1.72x − 0.680.9969(40.65,59.35)29.70
A2TNy = −0.09x2 + 1.64x − 0.540.9874(43.52,56.48)33.94
MNy = 0.11x2 + 0.89x − 0.0040.9998(47.06,52.94)38.18
BNy = 0.02x2 + 1.27x − 0.300.9953(46.02,53.98)36.77
GUy = −0.09x2 + 1.99x − 0.910.9970(41.94,58.06)31.11
TSy = −0.03x2 + 1.24x − 0.200.9987(48.54,51.46)41.01
MSy = −0.02x2 + 1.42x − 0.400.9981(45.83,54.17)36.77
BSy = −0.02x2 + 1.41x − 0.390.9986(45.45,54.55)35.36
A3TNy = −0.09x2 + 1.57x − 0.490.9991(46.89,53.11)38.18
MNy = −0.09x2 + 1.64x − 0.540.9874(44.44,55.55)33.94
BNy = −0.1x2 + 1.86x − 0.750.9977(43.49,56.51)32.53
GUy = −0.01x2 + 1.82x − 0.820.9983(40.50,59.50)29.00
Note(s): x is the accumulative inverse of species number; y is the accumulative relative frequency; R2 is the correlation coefficient.
Disclaimer/Publisher’s Note: The statements, opinions and data contained in all publications are solely those of the individual author(s) and contributor(s) and not of MDPI and/or the editor(s). MDPI and/or the editor(s) disclaim responsibility for any injury to people or property resulting from any ideas, methods, instructions or products referred to in the content.

