Article

Coupled Coordination of the Water–Food–Energy System in Nine Provinces of the Yellow River Basin: Spatiotemporal Characteristics and Driving Mechanisms

1
Research Institute of Resource-Based Economic Transformation and Development, Shanxi University of Finance and Economics, Taiyuan 030012, China
2
UniSA Business, University of South Australia, Adelaide 5001, Australia
3
School of Finance, Hunan University, Changsha 410012, China
*
Author to whom correspondence should be addressed.
Water 2025, 17(7), 1040; https://doi.org/10.3390/w17071040
Submission received: 8 February 2025 / Revised: 27 March 2025 / Accepted: 31 March 2025 / Published: 1 April 2025
(This article belongs to the Topic Water and Energy Monitoring and Their Nexus)

Abstract

:
This study focuses on the Yellow River Basin, a key economic region spanning nine provinces in China, and explores the complex interactions within the water–food–energy systems. Based on the theoretical framework of the coupled coordination of the water–food–energy system, an indicator system is developed to assess the coordination of these systems. Using ArcGIS, the study identifies the spatiotemporal characteristics of the coupling coordination of the water–food–energy systems in the Yellow River Basin. Additionally, a panel data model is employed to analyze the driving mechanisms and optimization pathways for enhancing system coordination in the region. The results reveal that (1) The degree of coupling coordination between the water–food–energy systems in the Yellow River Basin varies significantly across space. (2) Overall, the coupling coordination in the region is relatively low and exhibits a clustered pattern. (3) Research and development (R&D) intensity is a significant factor influencing the coupling coordination of these systems in the region.

1. Introduction

The Yellow River, often referred to as the “Mother River” of China, has profoundly influenced the civilizations along its course, shaping disparities in ecological environments, natural resources, and economic development across the Yellow River Basin. As a key food production center in China, the sustainable development of agriculture in the Yellow River Basin has encountered significant challenges in recent years [1], including the rapid increase in industrial and urban water demands [2], limited energy exploitation [3], environmental concerns [4], and the escalating threat of water pollution [5,6]. In response to these challenges, the Chinese government has implemented various measures, including policy coordination [7] and ecological protection [8] efforts to address issues related to water resources, food production, and energy supply in the Yellow River Basin. In October 2021, the Central Committee of the Communist Party of China and the State Council issued the “Ecological Protection and High-Quality Development Plan for the Yellow River Basin”, which established the principle of “water resources as the most rigid constraint” and set a development direction centered on “ensuring food and energy security while emphasizing the high-quality development of the basin”. In 2022, four government departments, including the Ministry of Ecology and Environment, jointly issued the “Ecological Environmental Protection Plan for the Yellow River Basin”, outlining key tasks and protection measures for ecological conservation in the region, thereby providing additional legal support for advancing the ecological health of the basin. On 1 April 2023, the “Yellow River Protection Law of the People’s Republic of China” officially came into effect, further highlighting the national commitment to the eco-management and governance of the Yellow River Basin.
As one of China’s ecological barriers [9] and major economic zones, the Yellow River Basin is a crucial area for the success of the country’s poverty alleviation efforts. However, due to its fragile ecological environment [10,11,12], the overlap of the “Three Zones” (ethnic minority concentration areas, revolutionary base areas, and high-altitude areas), and other unique characteristics, issues such as imbalanced water resource supply, demand, and allocation [13,14,15,16] have further jeopardized the food and energy security in the region. The Yellow River Basin has become a region where conflicts related to water, food, and energy are highly concentrated, severely limiting high-quality economic development [17]. In addition, the systemic imbalance of these three sectors affects various aspects such as agricultural sustainability [18], multi-departmental synergies [19], water supply conditions [20], optimal crop farming [21], and climate change [22]. These imbalances also pose risks to basic survival [23], significantly impacting the healthy economic development of provincial regions [24]. Understanding the interactions within the water–food–energy system [25] and ensuring its coordinated and orderly development [26] are crucial for achieving social, economic, and environmental sustainability [27]. This coordination serves as a vital support mechanism and a key pathway to ensuring high-quality development. Therefore, scientifically evaluating the coupling and coordination mechanisms within the water–food–energy system of the Yellow River Basin is essential for promoting the integrated development of these systems, accelerating the sustainable utilization of resources, and driving high-quality development in the basin.
With the increasing pressures of climate change and resource scarcity, the sustainable utilization of water resources and energy has become a critical factor limiting economic and social development. The coupling relationship between water resources and energy has also become a focal point of academic research. From a methodological perspective, some scholars have conducted multi-dimensional ecological network analyses [28], integrating system cycle rates, system sustainability, ecological structure, and network dynamics. Others have developed an uncertain interval-based opportunity-constrained EWC coupling system (ICCF-EWC) management fractional optimization model [29], which addresses uncertain parameters represented by random probability distributions and interval values, providing an effective approach to solving bi-objective optimization problems. From a research focus perspective, both water resources and energy are classified as natural resources, and their utilization is inherently linked to carbon emissions [30,31]. As a result, it is essential to balance water conservation, energy usage, climate change mitigation, and urban development to achieve optimal configurations of resource utilization and carbon emissions. The extraction of resources involves issues such as land use [32] and technological development [33], where strategic land planning and technological investments can enhance water and energy supply while ensuring effective resource utilization. Furthermore, some scholars focus on the economic sustainability driven by water–energy synergy [34], examining the intrinsic mechanisms and connections between water–energy cooperation and economic development, such as promoting urban water–energy interactions [35] to support two key national priorities: meeting residents’ daily needs and supporting economic growth, as well as ensuring the sustainable development of business models [36]. Therefore, optimizing and coordinating water–energy relationships [37] remains an ongoing challenge across regions.
Food security and water security are critical for human survival and development. In terms of research methodology, some scholars have utilized multi-regional input–output analysis [38], combined with the nexus index, to examine the resource export pressures arising from the water–land–food system. Other researchers have conducted systematic quantitative analyses of the interrelationships and benefits among food, water, and land under different CRT scenarios [39], evaluating the comprehensive benefits of these three elements. From a research focus perspective, ensuring reliable water resources, safe food production, and sustainable energy supply are essential for economic growth and the improvement of human living standards. As a result, the sustainable utilization of water resources to ensure food safety [40] has become a focal point for scholars both domestically and internationally. As a populous nation, China faces ongoing challenges related to population growth and the supply of water and food [41], with environmental carrying capacity emerging as a significant concern. The trend of declining arable land resources [42] is difficult to reverse, and the trade-off between converting farmland to forest and increasing food demand continues to challenge the situation. Factors such as carbon emissions [43] and land use changes [44] further complicate the efforts to boost food production. The need for green, low-carbon, and efficient production is increasingly evident, and the associated ecological issues [45] have drawn significant attention. Thus, addressing how to enhance both the quantity and quality of production without disrupting the existing ecological balance remains a critical consideration. As such, researching the relationship between water and food is crucial for safeguarding watershed water environmental security and ensuring national food security [46].
The conference titled “The Nexus of Water–Food–Energy Security”, held in Bonn, Germany, in 2011, marked a pivotal moment in the academic exploration of the interconnected nexus between water, food, and energy. This event initiated in-depth academic research into the water–food–energy system. Subsequent studies have explored various concepts and methods [47], including the calculation of flows and dependencies between different resources, the evaluation of technological and policy applications, and the quantification of system performance. These studies aim to bridge the gap between theory and practice [48], creating tangible mechanisms to translate sustainability visions into actionable plans. Additionally, systematic visual analyses [49] have been conducted to clarify the connections between water, energy, and food resources, as well as their stakeholders within both social and natural systems. Research on future development trends [50] has shown that the water–food–energy system is increasingly being integrated into other sectors, such as health, innovation, and society—key factors in enhancing human well-being.
Some scholars have focused on achieving coordination among water, food, and energy to optimize resource allocation and upgrade resource utilization methods. By coordinating these three elements, the efficient use and allocation of regional resources can be achieved. Furthermore, from the viewpoint of promoting regional sustainable development [51], the evolution of the water–food–energy relationship has transformed society’s resource consumption patterns, increased the use of renewable energy, improved energy efficiency, reduced food waste, and contributed to better livestock management. Overall, the aim of proposing this nexus is to explore its inherent contradictions and develop strategies that can integrate the coordinated development of water, food, and energy [52]. Integration is crucial for incorporating these elements into macro decision-making processes, addressing the tension between economic development and resource scarcity, and ultimately achieving sustainable economic and social development.
In summary, research on the factors influencing the water, food, and energy systems and their interrelationships indicates that academic studies on the coupling mechanisms of the water–food–energy system are still in the qualitative or semi-quantitative phase, relying on static evaluation frameworks. There has been limited research on the spatiotemporal characteristics of the coupling coordination among the three elements from a dynamic perspective, and the understanding of the spatiotemporal dynamics of this system remains incomplete. Moreover, the existing literature on ecological protection in the Yellow River Basin mainly focuses on current status analysis and policy recommendations based on the existing situation, without addressing the impact of coordination among water, food, and energy on policy outcomes.
Building upon established research in resource systems theory, this study uses the Yellow River Basin as a case study to explore the interconnected dynamics of water–energy–food security. A multidimensional indicator framework is developed to assess the synergistic relationships within this integrated system. This research aims to achieve two primary objectives: (1) characterizing spatiotemporal heterogeneity in system coordination across the basin and (2) identifying key drivers of synergistic development through quantitative analysis of intersystem interactions. Methodologically, this study employs spatial econometric techniques to evaluate system interdependencies, while panel data regression models isolate the most influential factors that promote resource system integration. By systematically analyzing the mutual feedback mechanisms among water resources, energy production, and food security, this research provides actionable insights for formulating ecosystem stabilization strategies. These findings are particularly relevant for regional sustainability planning in monsoon-influenced river basin ecosystems.

2. Materials and Methods

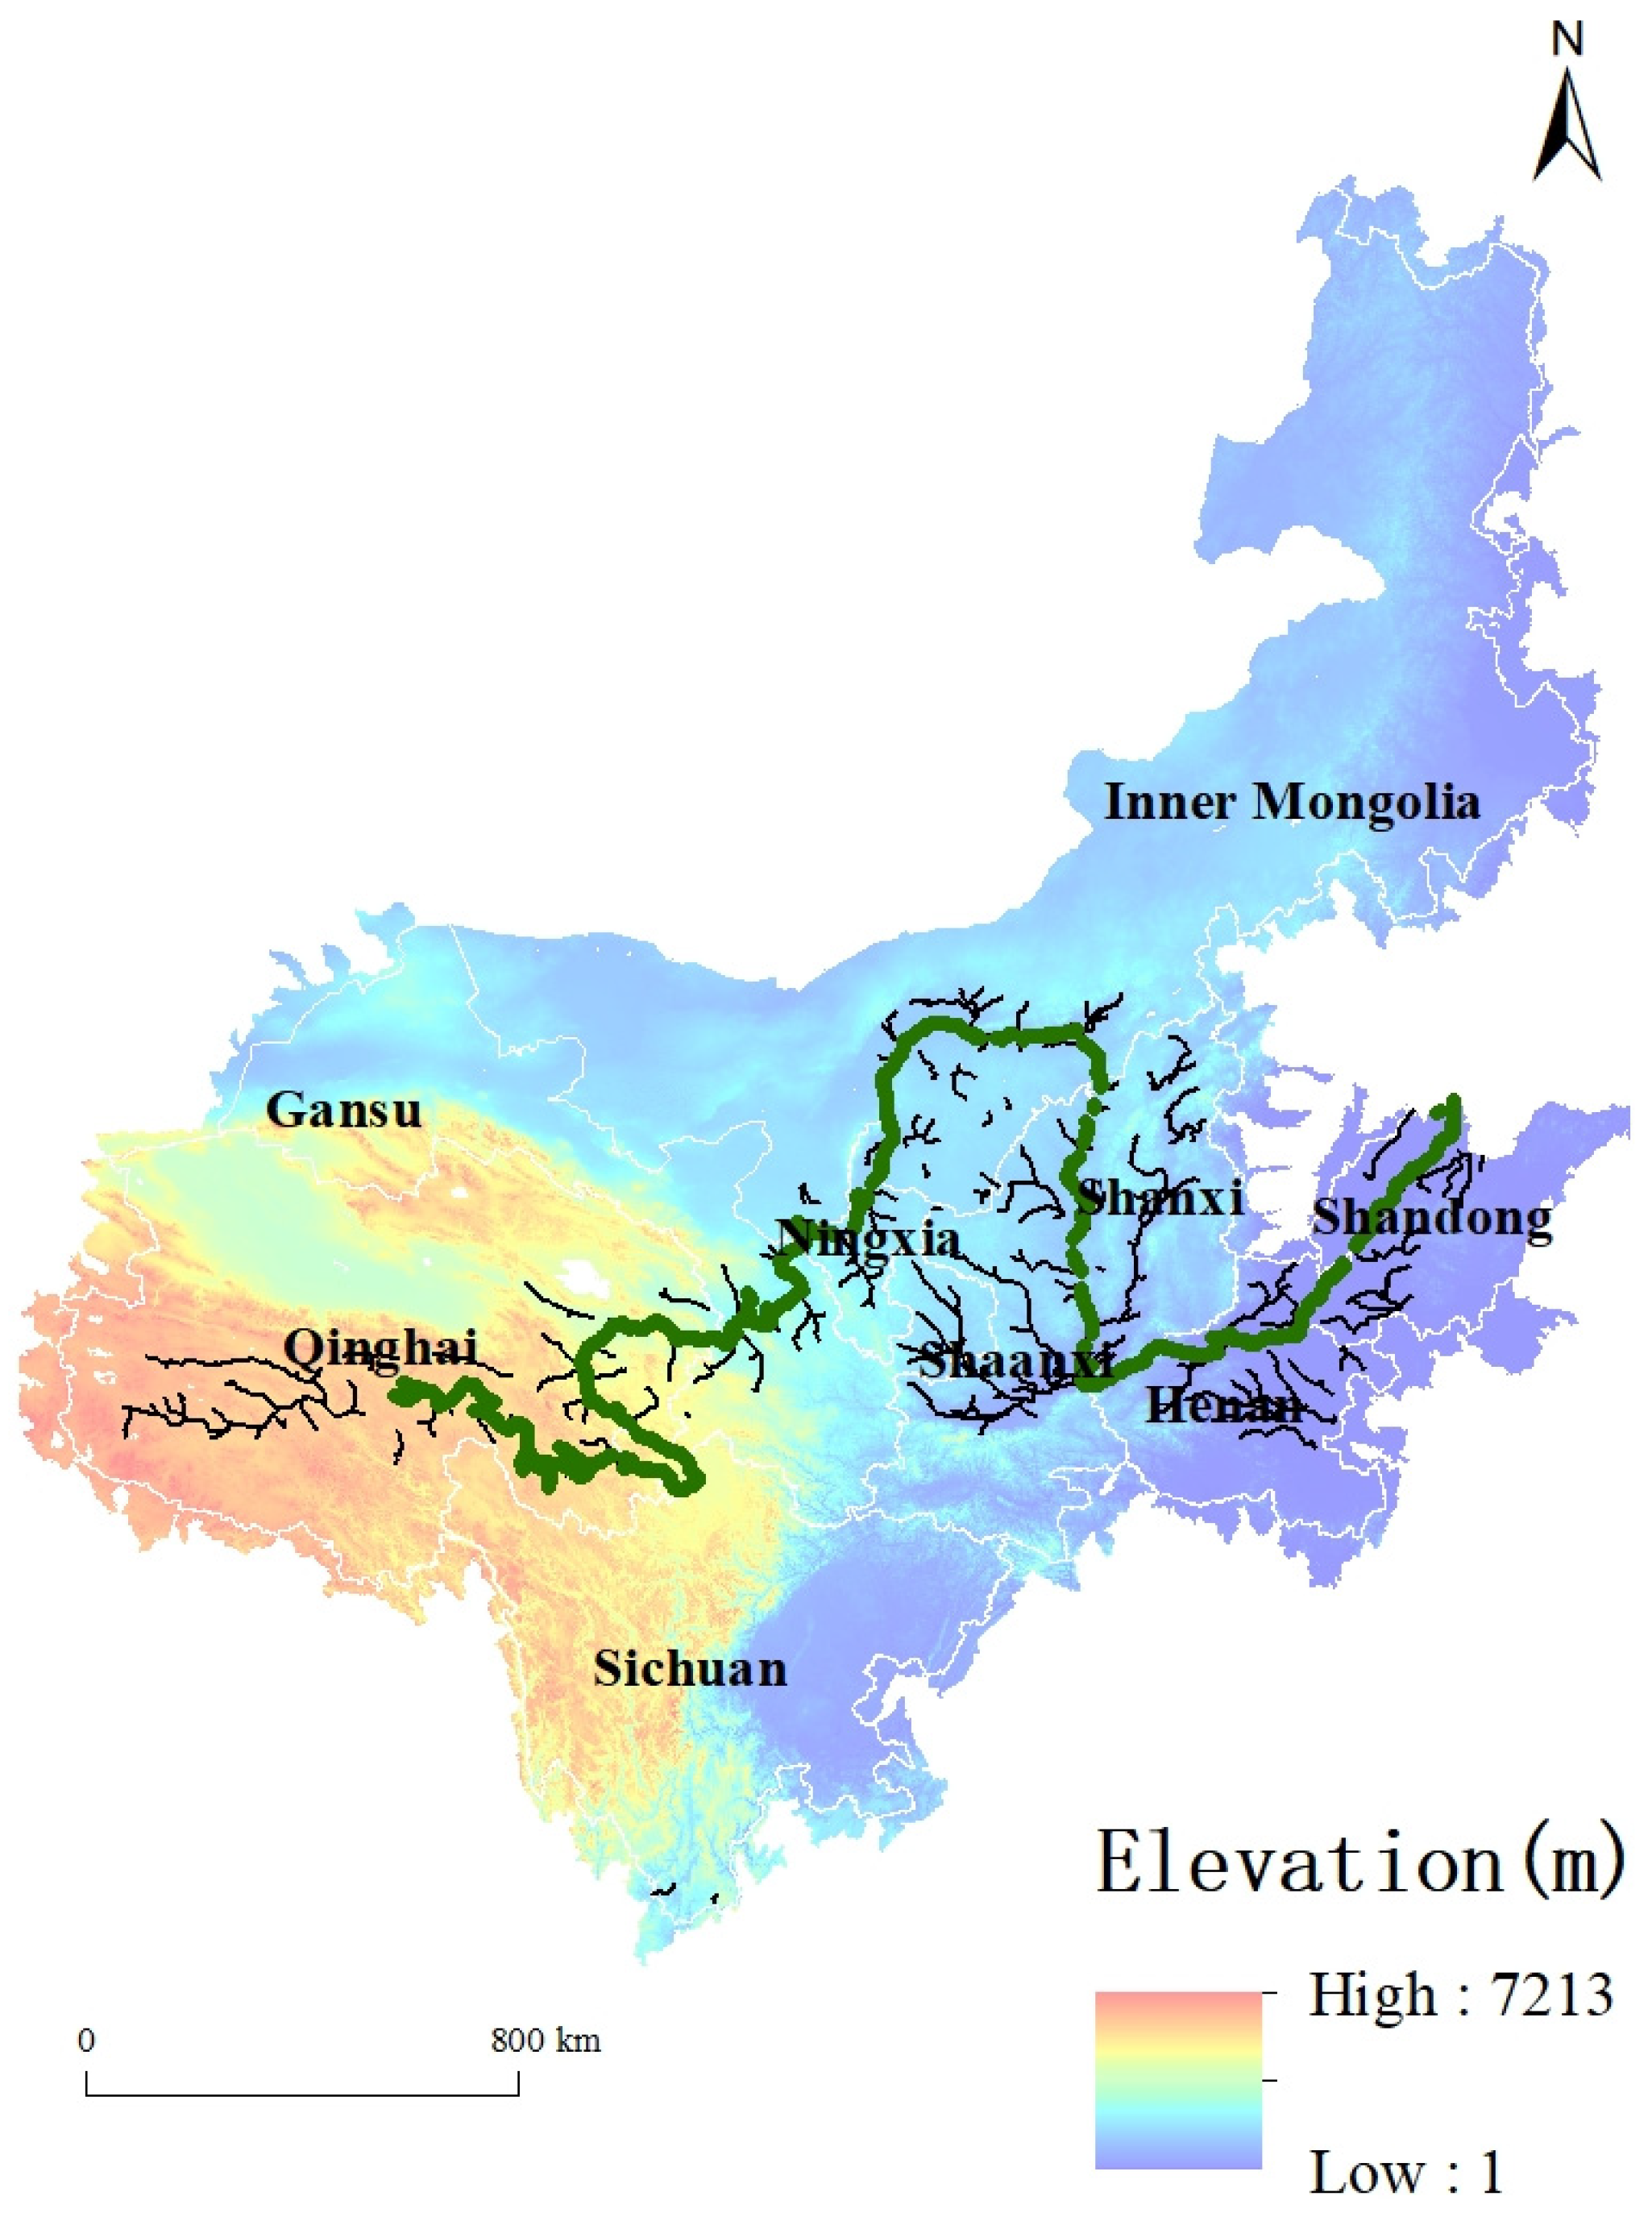
2.1. Overview of the Research Area

Figure 1 illustrates the geographic distribution of the nine provincial-level administrative divisions within the Yellow River Basin, divided into three main hydrological segments: upstream, midstream, and downstream. The upstream region includes five jurisdictions: Inner Mongolia Autonomous Region, Sichuan Province, Gansu Province, Ningxia Hui Autonomous Region, and Qinghai Province. The midstream region comprises Shanxi Province and Shaanxi Province, while the downstream region is made up of Shandong Province and Henan Province. This division follows established hydrological boundaries and facilitates comparative analysis of regional resource dynamics. The elevation map in the figure also indicates the direction of water flow across these regions. Additionally, the Yellow River Basin referred to in this article is an economic concept, defined according to the national planning for high-quality development of the Yellow River Basin (https://www.gov.cn/gongbao/content/2021/content_5647346.htm, accessed on 20 January 2025). It includes all prefecture-level cities within the nine provinces, rather than being limited to the cities directly along the Yellow River as defined in geographical terms.
The Yellow River Basin faces significant challenges due to water scarcity. With a total annual water availability of approximately 6.47 × 10¹⁰ m3, the per capita freshwater resources in the basin are only about 27% of China’s national average. This limited water supply is further exacerbated by inefficiency in water use, with current exploitation rates reaching 80%. This is double the ecological warning threshold of 40%, which has been set for major river systems in China (https://www.nmgnews.com.cn; data are from Inner Mongolia News Network, accessed on 24 March 2025). To address these challenges, the basin has recently introduced a comprehensive water allocation framework. Recent efforts, including systematic planning and adaptive management, have led to significant improvements in water use efficiency. For instance, during the 2023–2024 allocation cycle, the volume of water diverted from the main channel reached a historic 23.277 × 10⁹ m3, while still maintaining ecological flow requirements. This marks a key milestone in sustainable resource management within the basin.
The Yellow River Basin is also a major agricultural hub in China, with important grain-producing regions such as the Huang-Huai-Hai Plain, Fenwei Plain, and Hetao Plain. While water scarcity in these regions presents challenges to food production, strategies like diverting water from the Yellow River for irrigation have ensured the stability of grain production. However, some areas within the basin still face inefficient water use in agriculture. In recent years, the adoption of water-saving irrigation technologies has improved water use efficiency. For example, in Shandong Province, which is a key agricultural area in the basin, the area under water-saving irrigation increased by nearly 20 million mu (approximately 13.3 million hectares) by the end of 2022. This was the result of a large-scale promotion of these technologies starting in 2015. As a result, the effective irrigation water utilization coefficient in Shandong province rose from 0.52 to 0.62 (https://sd.dzwww.com; data are from China Network New Shandong, accessed on 19 January 2025), meaning more agricultural products can be produced per unit of water, thus effectively alleviating the pressure on the basin’s water resources.
The energy sector in the Yellow River Basin remains predominantly reliant on coal, but there is significant potential for developing sustainable energy alternatives. The region’s geographic and climatic conditions are favorable for harnessing wind, solar, and hydroelectric power. National policies focusing on decarbonization have accelerated the adoption of clean energy technologies. For example, Henan Province has become a leader in renewable energy deployment, ranking second nationally in newly installed wind and photovoltaic (PV) generation capacity. Since 2015, Henan’s renewable energy infrastructure has grown at a compound annual growth rate (CAGR) of 42% (https://yjj.henan.gov.cn; data are from Henan Provincial Medical Products Administration, accessed on 20 January 2025). This shift aligns with national energy security goals and supports efforts to reduce carbon emissions. The success of Henan serves as a model for how traditional energy systems in the basin can transition to a more diverse, low-carbon energy mix while still addressing the region’s unique socio-ecological needs.

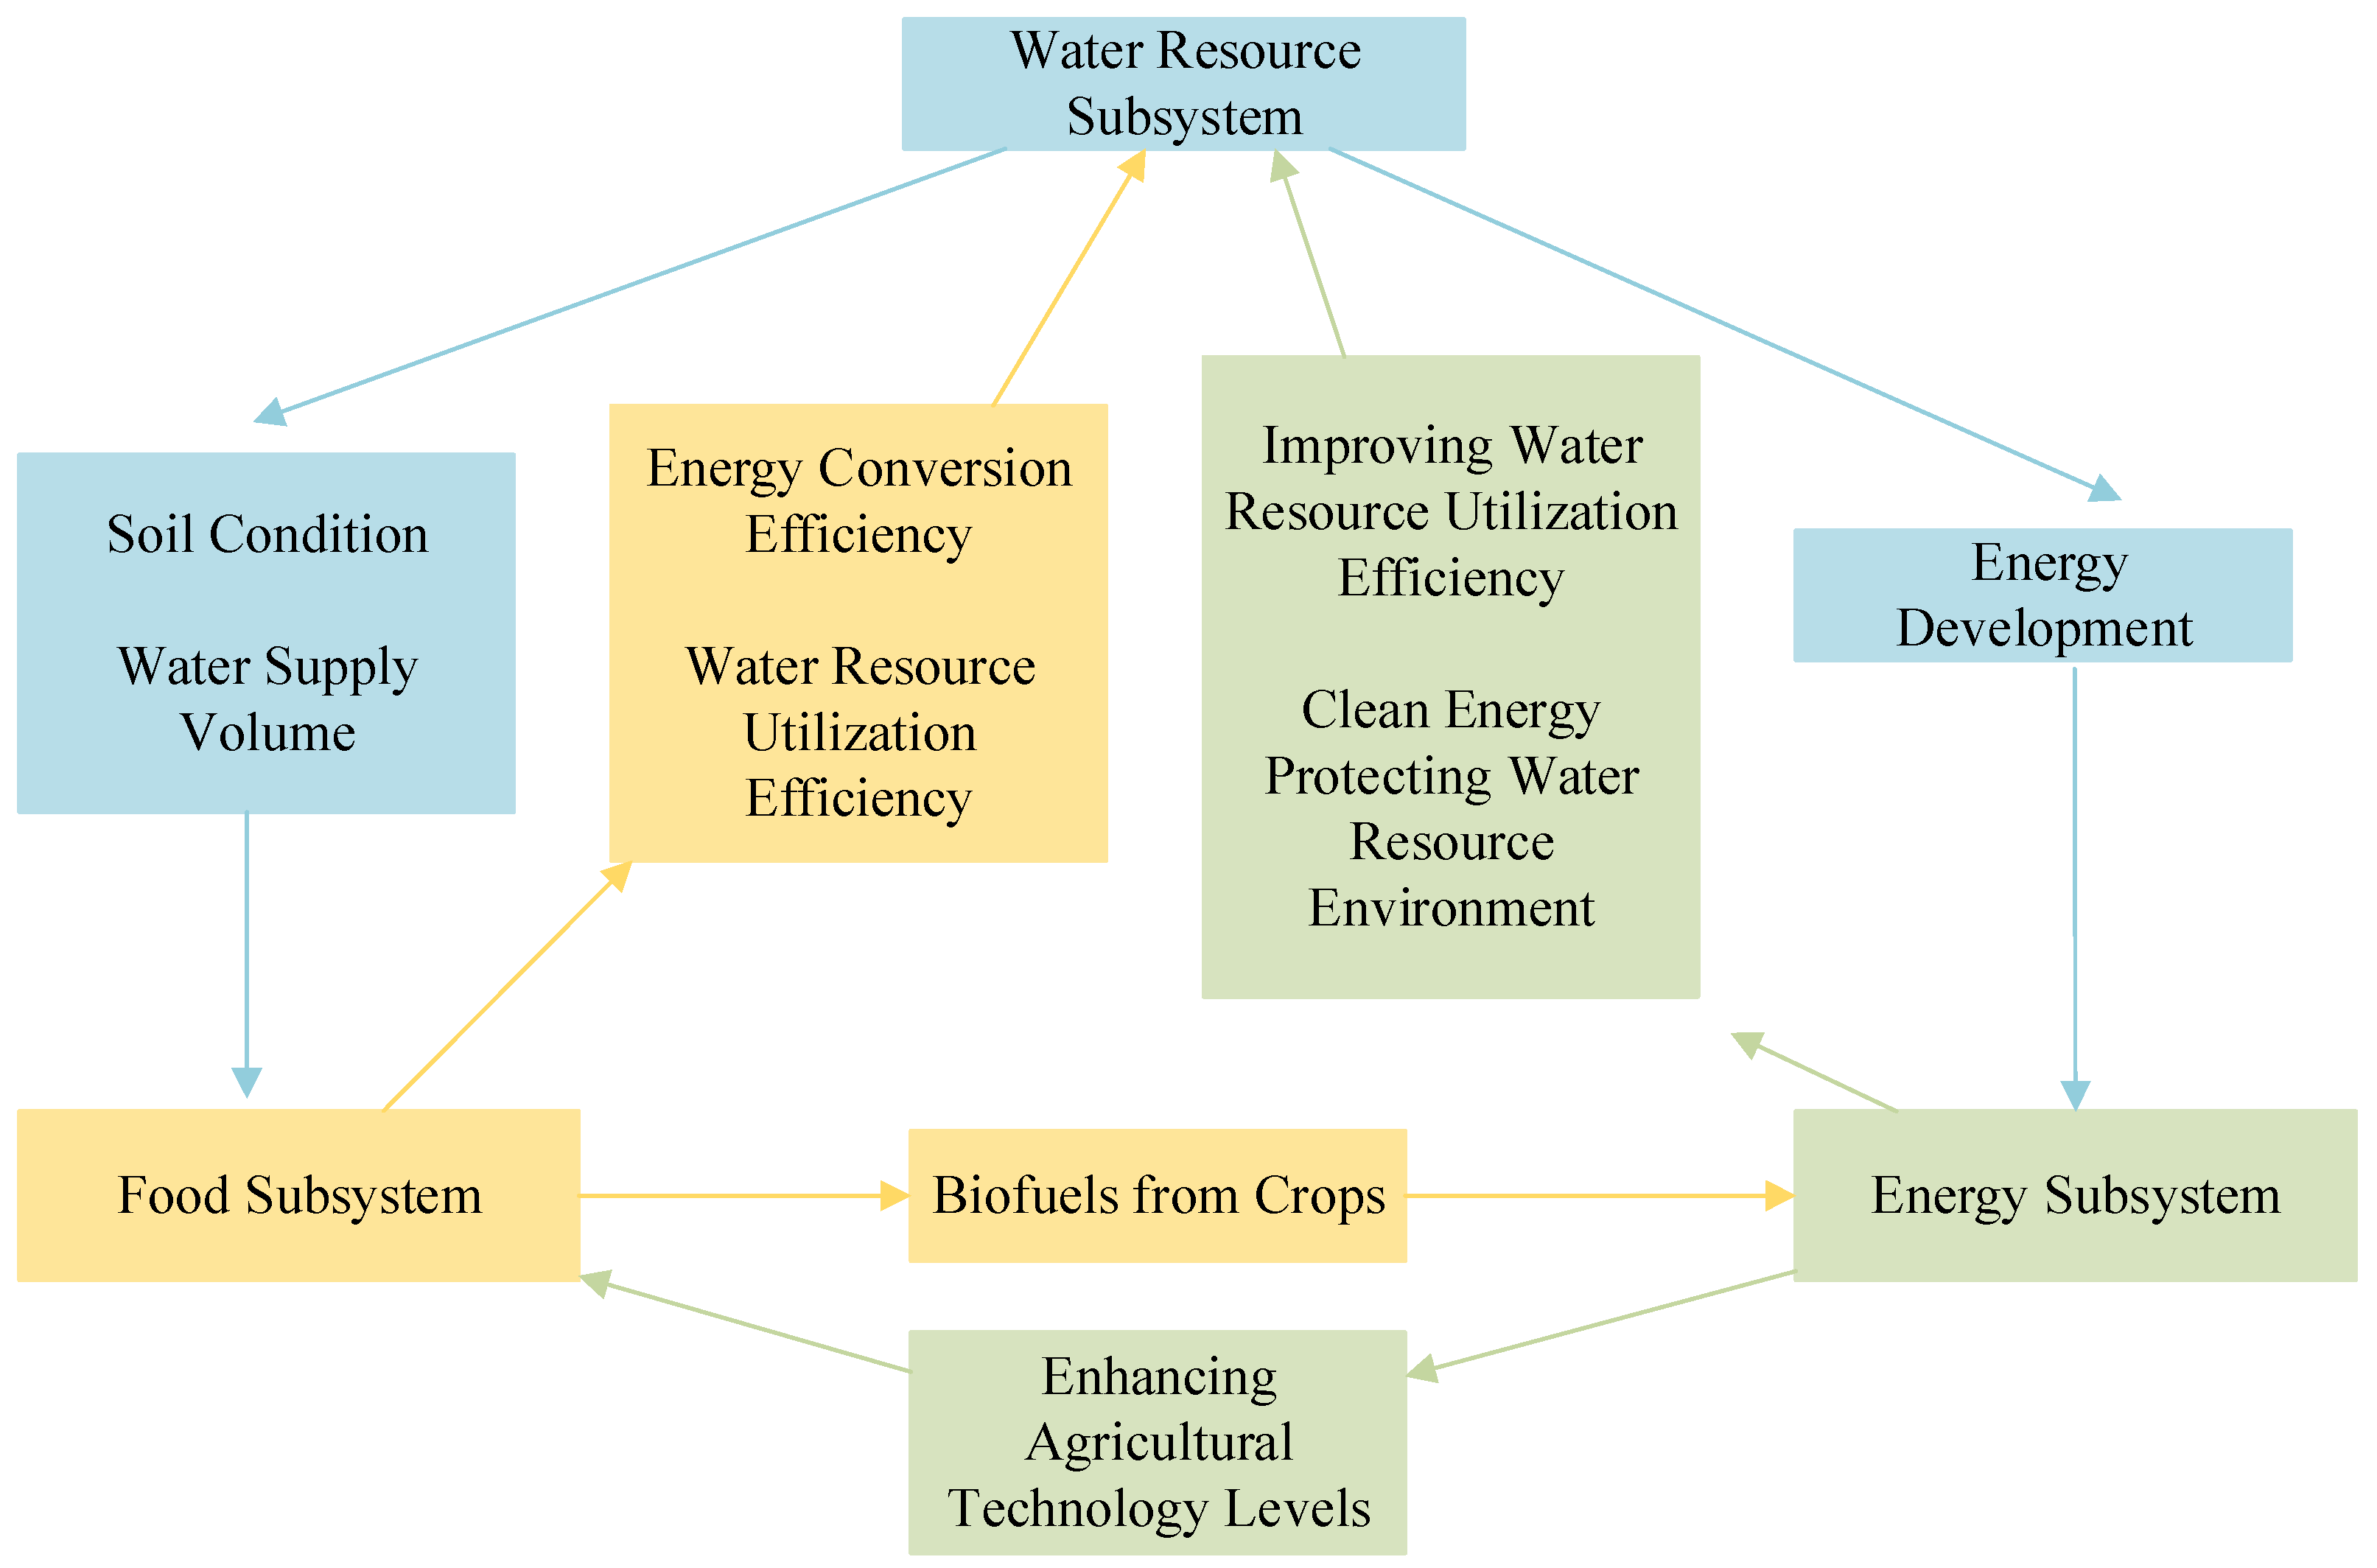
2.2. Theoretical Mechanism Analysis

Water, food, and energy are fundamental resources essential for human survival, each playing a unique role in human production activities and economic life. These elements are interdependent and complementary, together forming the foundational resources for human production and operation. They are also influenced by various common external factors. The following analysis will explore the mechanisms of interaction among these three elements from three perspectives (as shown in Figure 2, the arrows in the figure indicate the direction of influence):

2.2.1. Water Resource Subsystem

The water resource subsystem serves as the production foundation for both the food and energy subsystem [53]. The food subsystem is directly influenced by the availability of water resources, which in turn affects environmental sustainability [54], soil health [55], and the types and yields of crops [56], ultimately resulting in variations in both the quantity and quality of food produced. Specifically, when water resources are abundant, they can effectively support sustainable environmental protection measures, such as wetland conservation and ecological replenishment, thereby providing a stable and favorable ecological environment for soil. This, in turn, enhances soil fertility and biodiversity, promoting healthy soil development. Under such conditions, farmers can cultivate a greater diversity of crops, selecting high-yield and high-quality varieties, ensuring both stable food production and superior quality. Moreover, the supply and demand of water resources play a crucial role in determining the stability and efficiency of the energy subsystem. In the energy subsystem, the development and processing of key energy sources, such as natural gas and coal, are heavily reliant on water resources [57]. For instance, water is essential in coal mining for dust suppression, cooling equipment, and washing operations. Similarly, hydraulic fracturing techniques in natural gas extraction require substantial amounts of water. Additionally, the efficiency of energy conversion and processing is partially influenced by the availability of water resources. When water supply is sufficient, energy companies can utilize more advanced and efficient technologies, such as wet desulfurization and wastewater recycling systems, thereby improving energy conversion efficiency and resource utilization. Therefore, the water resource subsystem serves as the foundation of the water–food–energy system.

2.2.2. Food Subsystem

The food subsystem exerts a feedback effect on the water resource subsystem and partially substitutes for the energy subsystem. The demand and production levels of food are indicative of water resource demand. This is primarily driven by the growing demand for food due to population growth and rising living standards, which directly leads to the expansion of agricultural production and increases the demand for water in irrigation, planting, processing, and other stages. Furthermore, fluctuations in food production can influence water consumption patterns. High-yield years may result in higher water usage for agricultural production, while low-yield years may encourage the adoption of water-saving technologies to reduce water consumption. Additionally, the efficiency of water resource utilization within the food subsystem impacts the overall supply and demand of water resources [58]. Efficient water utilization technologies, such as drip irrigation, sprinkler irrigation, and water recycling systems, can significantly increase food output per unit of water used, thereby alleviating some of the pressure on water resource supply and demand. As a result, the food subsystem also has a feedback effect on the water resource subsystem, with the two systems interacting and influencing each other. For the energy subsystem, biofuels derived from crops [59] can reduce dependence on imported energy to a certain extent. The degree of substitution provided by biofuels [60] affects energy development and utilization; when biofuels offer strong substitutive capacity, they can significantly reduce reliance on traditional fossil fuels and promote the optimization and transformation of the energy structure. This not only helps reduce greenhouse gas emissions and alleviate environmental pressures but also stimulates research, development, and investment in renewable energy technologies, driving innovation and growth in the energy industry sector. However, it is evident that the food subsystem exerts a significant, albeit limited, influence on the energy subsystem considering the feasibility and efficiency of biofuels.

2.2.3. Energy Subsystem

The energy subsystem supports the development of both the water resource and food subsystem. The development and utilization of energy can, to some extent, promote the exploration and efficient use of water resources [61]. For instance, hydropower plants harness the potential energy of flowing water to generate electricity, thereby achieving sustainable energy utilization while facilitating the effective use of water resources and minimizing waste. In the process of developing and utilizing biomass energy, significant amounts of water resources are often required for the cultivation, growth, and processing of biomass feedstocks, which, in turn, drives innovation in agricultural irrigation and water resource management technologies, enhancing the efficiency of water utilization. Moreover, the use of these clean energy sources can help protect ecosystems, thereby creating a favorable environment for water resources. In relation to the food subsystem, advancements in the energy subsystem can elevate agricultural technology levels [62]. Modern agricultural machinery, for instance, often relies on electric or fuel-driven power. The development of the energy subsystem has made agricultural machinery more efficient and intelligent, thereby improving agricultural productivity. Additionally, the introduction of new energy technologies, such as solar irrigation systems and biomass energy greenhouses, not only provides clean and sustainable energy for agricultural production but also fosters innovation and the application of water-saving and temperature-control technologies in agriculture. These advancements further elevate agricultural technology levels, leading to improvements in crop quality and yield while reducing harmful emissions associated with chemical fertilizers and pesticides.

2.3. Indicator Selection

2.3.1. Indicator System

This study extends the theoretical framework of the water–energy–food (WEF) nexus, synthesizes insights from the relevant scholarship [63,64,65], and operationalizes a tripartite analytical model comprising aquatic resource dynamics, energy systems, and agro-food production networks. A multidimensional assessment framework for the WEF nexus has been developed (detailed in Table 1), integrating three primary dimensions and nine subordinate parameters, selected according to data accessibility and contextual relevance.
The hydrological component evaluation incorporates three core metrics: (1) water use efficiency, operationalized through water consumption per unit GDP metrics [66]; (2) per capita water resource availability, reflecting both resource endowment and sustainable utilization potential; and (3) hydrological sensitivity to climate change, quantified via the water production coefficient.
Energy system analysis adopts a three-scale approach [67,68]: (1) macro-level energy productivity measured by energy consumption per unit GDP; (2) micro-level energy access assessed through per capita energy demand; and (3) environmental performance indicated by carbon intensity.
Agro-food system evaluation comprises three indicators [69,70]: (1) agricultural productivity measured by per capita cereal output; (2) technological modernization level assessed via mechanical power density; and (3) nutrient management efficiency evaluated through fertilizer application rates.
The framework distinguishes between progressive indicators (per capita water availability, hydrological resilience coefficient, cereal productivity, mechanization density, and fertilizer efficiency) and regressive indicators (water intensity, energy intensity, per capita energy demand, and carbon emissions intensity). This bidirectional categorization enables systematic benchmarking of sustainable development trajectories within the WEF nexus.

2.3.2. Influencing Factors

To explore the factors influencing the coupling coordination degree of the water–food–energy system, regarding technological advancement, research and development (R&D) intensity is chosen as another core explanatory variable. This factor plays a more direct and significant influencing role in driving technological innovation and industrial upgrading [71], facilitating the efficient and circular utilization of water resources, energy, and food production. The aim is to identify the primary influencing factors for the healthy and coordinated development of the water–food–energy system. Additionally, PM2.5 is selected as the control variable from the perspective of environmental quality. From an economic perspective, industrial structure and per capita GDP are selected as control variables, while urbanization rate and population density are chosen as control variables from the social dimension [72,73,74]. This approach aims to enhance the precision and scientific rigor of the model as much as possible. An overview of the specific variables involved is provided in Table 2.

2.4. Methods

2.4.1. Entropy Weight Method

Using the entropy weight method, the secondary indicators within each subsystem are normalized and weighted to form a comprehensive indicator. The specific steps are as follows [75]:
Data normalization process: Due to the differences in dimensions, magnitudes, and the positive or negative orientations of the selected indicators, it is necessary to normalize the initial data. The specific methods for normalization are outlined below:
For positive indicators:
X i j = ( X i j min X i j ) ( max X i j min X i j )
For negative indicators:
X i j = ( max X i j X i j ) ( max X i j min X i j )
where X i j represents the (i)-th data point of the (j)-th indicator, max X i j is the maximum value of the (j)-th indicator, and min X i j is the minimum value of the (j)-th indicator.
Next, the proportion of the (i)-th indicator value in the (n)-th year is calculated:
Y i j = X i j i = 1 m X i j
The calculation of the information entropy of the indicators is as follows: e j = k i = 1 m ( Y i j × ln Y i j )
k = 1 ln m
Then, we have 0 e j 1 , and when Y i j = 0 , we set Y i j × ln Y i j = 0 ,
The calculation of the redundancy of information entropy is as follows:
d j = 1 e j
The determination of indicator weights is as follows:
ω j = d j j = 1 m d j
Using the weights, the comprehensive values of each of the three subsystems can be determined:
f W = j = 1 m ω j W i j
f E = j = 1 m ω j E i j
f F = j = 1 m ω j F i j
where W i j , E i j and F i j represent the normalized values of the indicators within the water, energy, and food subsystems, respectively.

2.4.2. Coupling Coordination Model

The coupling degree is employed to reflect the extent of interaction and mutual influence among the water, energy, and food subsystems. The specific formula for the coupling degree (C) among the subsystems is [76]:
C = f W f E f F f W + f E + f F 1 3
To evaluate the synergistic interdependence among the three constituent systems, this study adopts a Coupling Coordination Degree Model (CCDM) for quantitative analysis of the interactive dynamics between the hydrological, energetic, and agricultural subsystems. The methodological framework incorporates a composite index system to assess system-level coordination, with computational procedures structured as follows:
D = C T
where (T) is given by
T = f W + f E + f F 3
In this equation, f W , f E , and f F represent the comprehensive values of the water resource subsystem, energy subsystem, and food subsystem, respectively. The coupling coordination degree ranges from [0, 1], with larger values indicating stronger interactions and mutual influences among the subsystems [77]. Given that the study focuses on the 97 prefecture-level cities within the Yellow River Basin, this research references the existing literature [78] to provide a more detailed classification of the coupling coordination degree, allowing for a more precise assessment of the coupling and coordination degrees between different systems or modules. The specific classification criteria are presented in Table 3.

2.4.3. Empirical Model

This study employs the following benchmark model to investigate the primary influencing factors of the coordinated and orderly development of the water–food–energy system:
D i t = α 0 + α 1 X 1 i t + α 2 X 2 i t + η C o n t r o l s i t + λ i + ν t + ε i t
In this context, D i t represents the coupling coordination degree of the water–food–energy system for city (i) in the Yellow River Basin during year (t). X 1 i t and X 2 i t denote the research and development intensity and the annual average concentration of PM2.5 for city (i) in year (t), respectively, which are the core explanatory variables of this study. The C o n t r o l s i t includes variables such as industrial structure, urbanization rate, per capita GDP, and population density. λ i represents the individual fixed effects, ν t indicates the time fixed effects, and ε i t represents the random error term.

2.5. Data Sources

The Yellow River Basin region comprises a total of nine provinces, including 107 prefecture-level cities. However, due to the limited availability of data at the prefecture-level city level, some cities with excessive missing values were excluded from the analysis. Consequently, 97 prefecture-level cities were selected as the subjects of this study. The research covers the period from 2011 to 2022. The sample size is deemed sufficient to support the final research conclusion, and the excluded cities did not impact the validity of research results. The data primarily derive from authoritative sources, including the “China Water Resources Statistical Yearbook” (2012–2023), the “China Energy Statistical Yearbook” (2012–2023), the “China Rural Statistical Yearbook” (2012–2023), the “China Urban Statistical Yearbook” (2012–2023), and the “China Environmental Yearbook” (2012–2023), ensuring the reliability of the data sources. Missing values were supplemented using linear interpolation, and the descriptive statistical results for each variable are presented in Table 4.

3. Results

3.1. Temporal and Spatial Characteristics

Based on the established water–energy–food nexus indicator framework, this study developed a comprehensive evaluation model to quantify the system synergy in the Yellow River Basin and its three sub-basins (upstream, midstream, downstream) across temporal scales. The spatiotemporal evolution characteristics are visualized in Figure 3, which demonstrates the following findings: Longitudinal analysis of the dataset reveals that the basin-wide water–energy–food system synergy index fluctuated between 0.342 and 0.362 during the study period, with the peak values recorded in 2011 and the trough in 2019. Notably, a decreasing trend (−4.27%) was observed from 2011 to 2022, with the most significant fluctuation (−4.41%) occurring during the “acute degradation” phase. Latitudinal comparisons across sub-basins reveal distinct evolutionary patterns in regional synergy performance. The upstream region followed a trajectory of “rapid decline → gradual stabilization → undulating recovery”, while the midstream and downstream areas exhibited more complex fluctuations, characterized by phase lags in system response. This spatial heterogeneity reflects differential impacts of regional development policies and disparities in resource endowments.
The “rapid decline phase” occurred from 2011 to 2015, likely due to the excessive development and utilization of water resources in the Yellow River Basin during this period, which led to ecological degradation and a decline in the regenerative capacity of water resources [79]. Furthermore, the agricultural irrigation technology in the Yellow River Basin was relatively underdeveloped, resulting in low water utilization efficiency. At that time, coal was the dominant energy source in the region, and the extraction and consumption of coal required substantial water resources. The combustion of coal also generated significant pollutants, damaging the water environment and disrupting the coupling coordination of the system.
The “slow stabilization” phase lasted from 2015 to 2018, indicating an enhancement in the stability of the water–food–energy system in the Yellow River Basin during this period. This stability was likely due to strengthened water resource management and protection efforts, including the implementation of stricter water allocation and utilization policies. These measures reduced the waste and over-exploitation of water resources, thereby maintaining a relatively stable supply of water resources. Although coal remained the primary energy source in the Yellow River Basin during this phase, there was likely an increased focus on the development and utilization of clean energy sources, such as wind and solar energy. The growth of clean energy helped reduce the dependence on water resources and pollution, thereby contributing to the stability of the system’s coupling coordination degree.
During the 2018–2022 observation period, the system exhibited a distinct undulating pattern, characterized by significant interannual variability. This period coincided with heightened hydro-climatic variability in the Yellow River Basin, as evidenced by intensified extreme weather events and significant interannual precipitation variability [80]. These variations in renewable water resources triggered cascading effects throughout the water–energy–food nexus. Hydrological stress directly compromised the reliability of water supplies, which in turn disrupted the synergy of the entire system. Concurrent policy interventions, driven by national ecological protection and high-quality development initiatives, further influenced this dynamic. Notably, evolving regulatory frameworks governing resource allocation and utilization introduced structural shifts in water–energy–food resource distribution. These institutional changes, along with technological advancements in agricultural and energy sectors, created compounding effects on nexus coordination. The simultaneous occurrence of climatic stressors and policy transitions suggests synergistic influences on the observed fluctuations in system-level integration, warranting further investigation into the relative contributions of natural and anthropogenic factors.
Regionally, the midstream provinces of the Yellow River Basin (Shaanxi and Shanxi) exhibited the highest water–food–energy coupling coordination degree at 0.357, followed by the upstream region (Gansu, Ningxia, Qinghai, Sichuan, and Inner Mongolia) at 0.351, and the downstream region (Shandong and Henan) at 0.342. The trends in the coupling coordination degrees of the upstream, midstream, and downstream regions aligned with the average level of the Yellow River Basin, displaying characteristics of “initial decline—subsequent stabilization—then fluctuation”. However, regionally, the decline in the coupling coordination degree in the upstream areas was relatively gradual, with a decline rate of 3.51%, lower than the average rate for the Yellow River Basin. In contrast, the decline rates for the midstream and downstream regions were higher than the average, at 5.21% and 5.07%, respectively.
In the stable stage, the water–food–energy coupling coordination degree of the whole basin presents the characteristics of “midstream > upstream > downstream”, and the difference between regions is more obvious, and the difference of coupling coordination degree is obvious. This may be attributed to the relatively sufficient water resources in the midstream region, along with favorable development and utilization conditions that can meet the energy and food production demands of the area. Furthermore, the midstream region serves as an important agricultural and energy production base in China, possessing favorable agricultural production conditions and abundant coal and electricity resources. In contrast, while the upstream region has some capacity for energy and food production, natural constraints limit its production scale. The downstream region primarily focuses on the service sector and light industry, resulting in relatively less energy and food production. In the later fluctuation phase, both the midstream and downstream regions exhibited significant upward trends. The midstream region experienced an increase of 2.80% in the coupling coordination degree from 2020 to 2022, while the downstream region saw a more pronounced increase of 6.84% from 2019 to 2022, indicating a stronger upward trend.
Figure 4 illustrates the spatial evolution trend of the coupling coordination degree in the Yellow River Basin. As shown in Figure 4, the coupling coordination degree among the 97 cities in the Yellow River Basin exhibits significant disparities and demonstrates a clustered spatial characteristic. Specifically, the key points can be summarized as follows:
First, the overall coupling coordination degree of the water–food–energy system in the Yellow River Basin was relatively low, with a trend of “low-value locking”. The four panels (a–d) in Figure 4 illustrate that the coupling coordination degree of the water–food–energy system in the Yellow River Basin ranged between moderate imbalance and barely coordinated degrees. There were very few cities classified as barely coordinated; among the four selected years, only Jiuquan City in Gansu Province and Ankang City in Shaanxi Province in 2011, as well as Ankang City in 2022, were at the barely coordinated degree. The development trend depicted in the figure indicates an increasing number of cities classified as moderately imbalanced, with the peak occurring in 2022. This trend may be attributed to a series of factors, such as floods, soil erosion, and the COVID-19 pandemic during that period, which exacerbated water shortages and led to a decline in both quantity and quality of food production, resulting in a slight imbalance in the development of water, food, and energy.
The spatial distribution of the water–energy–food nexus coordination in the Yellow River Basin exhibited notable clustering characteristics during 2011–2022. Hierarchical analysis revealed predominant mild imbalance across sub-basin units, with significant concentration in the mid-lower reaches, encompassing the Shanxi, Shandong, and Henan provinces. Among the 97 prefecture-level cities, transitional zones between balanced and imbalanced states were primarily identified in the Shaanxi and Sichuan provinces, reflecting a relatively superior integration of resource flows compared to other regions. This spatial differentiation can be partially attributed to disparities in regional development. For instance, the Dujiangyan Irrigation District in Sichuan Province, recognized as a national agricultural hub [81], demonstrated enhanced water productivity through optimized resource management. Conversely, municipalities in Inner Mongolia, the Ningxia Hui Autonomous Region, and Qinghai Province exhibited the lowest coordination indices. This disparity correlates with their socio-economic marginalization, resource scarcity (particularly water and energy), and underdeveloped infrastructure, collectively impeding nexus synergy. The study period revealed two distinct clustering patterns: (1) mid-to-lower-reach agglomerations with moderate coordination capacity, and (2) upper-reach regions marked by significant development gaps. These findings highlight the need for regionally differentiated policy interventions to address spatial heterogeneity in nexus performance across the Yellow River Basin.
Second, there was a notable clustering trend in the distribution of the coupling coordination degree values for the water–food–energy system in the Yellow River Basin. The majority of areas in the basin fell into the mild imbalance category, with these regions predominantly concentrated in the midstream and downstream regions, such as the Shanxi, Shandong, and Henan provinces. Among the 97 prefecture-level cities, those bordering on imbalance are primarily located in the Shaanxi and Sichuan provinces, indicating more coordinated development of water, food, and energy in these regions compared to other areas of the Yellow River Basin. This may be due to Sichuan’s Dujiangyan irrigation district, a major agricultural production base, which contributes to higher water resource utilization efficiency. Additionally, cities with low coupling coordination degrees are mostly concentrated in Inner Mongolia, Ningxia Hui Autonomous Region, and Qinghai Province. This is due to the poor economic development of these areas and the lack of water resources and energy, so the coordination of the three is poor. Overall, the coupling coordination degree of the water–food–energy system in the Yellow River Basin exhibits distinct clustering characteristics during the study period of 2011–2022.

3.2. Regression Results

3.2.1. Baseline Regression

To clarify the core factors influencing the coupling coordination degree of the water–food–energy system in the Yellow River Basin, this study first conducted a baseline regression analysis, with the results presented in Table 5. Column (1) shows the results without the control variables, while column (2) includes the results after incorporating the control variables. An analysis of Table 5 reveals that, prior to the inclusion of the control variables, the regression coefficients for research and development (R&D) intensity were significant at the 1% level. Even after adding a series of control variables, the regression coefficients for the core explanatory variables remained significant at the 1% level, indicating that the conclusions are robust. This demonstrates that R&D intensity has a significant impact on the coupling coordination of the water–food–energy system.
An increase in R&D intensity can significantly promote the coordinated development of the water–food–energy system in the Yellow River Basin. This is primarily achieved through the innovation and application of key technologies such as water-saving irrigation, drought-resistant crop breeding, and renewable energy [82], which enhance water resource utilization efficiency, reduce energy consumption, and ensure food security. Additionally, an increase in R&D intensity fosters cross-sector collaboration, strengthens the coordinated management of water, food, and energy systems, and optimizes resource allocation, thereby improving overall system efficiency. Therefore, continued investment in R&D is a critical strategy for advancing the coordinated and sustainable development of the water–food–energy system.

3.2.2. Robustness Test

To ensure the reliability of the baseline regression results, this study has conducted a robustness check by substituting core explanatory variables. Since both the number of patent grants and R&D intensity can serve as proxies for the level of technological advancement, the number of patent grants is used here to replace R&D intensity as a core explanatory variable. The regression results presented in Table 6 indicate that, after this substitution, the regression coefficient for the new explanatory variable, the number of patent grants, is significant at the 5% level. These consistent findings align with the previous conclusions, suggesting that the level of technological advancement significantly influence the coupling coordination degree of the water–food–energy system, thereby validating the robustness of the results.

4. Discussion

4.1. Coupled Coordination Degree

By analyzing the spatial and temporal characteristics of the coupled coordination degree of the water–grain–energy system in the Yellow River Basin, it is found that the coupled coordination degree of the water–grain–energy system in the Yellow River basin has low value locking and clustering characteristics. It also reveals that the coupling coordination degree of the water–food–energy system of the regions within the basin exhibits a pattern of “midstream > upstream > downstream”. Similar spatial differentiation in the coupling coordination degree has been observed in existing studies on the coordinated development of the water–food–energy system in the basin [83], where cities with better economic development generally demonstrate higher degrees of coupling coordination [84]. This trend may be related to variations in resource endowment and climate change among different regions, aligning with the conclusions drawn in this study.

4.2. Influencing Factors

In this research, it is posited that an increase in R&D intensity can facilitate the coordinated development of the water–food–energy system in the Yellow River Basin, a finding corroborated by a series of empirical studies and robustness checks. Comparative analysis with existing research indicates that prior studies typically focus on identifying primary factors influencing coupling coordination within the system itself [85]. These studies often assess the impact of water resources, food, or energy system development on specific regions through quantitative analysis, identifying key subsystems that hinder system coupling coordination and proposing corresponding policy recommendations. In studies studying external factors, some scholars argue that variables such as educational expenditure, population density [86], and urbanization [87] significantly impact the coupling coordination degree of the water–food–energy system in the Yellow River Basin, which is consistent with the findings from the control variable regression in this study.

4.3. Future Research Opportunities

This study, based on an analysis of the current state of water, food, and energy in the Yellow River Basin and referencing existing research, quantifies an indicator system for these three systems from fresh perspectives and dimensions. It analyzes the coupling coordination degree among the systems and explores the main factors influencing their coordinated development. Ultimately, this research aims to integrate the coupling coordination of the water–food–energy system into policy frameworks, utilizing the interrelationships among these three elements to maintain a healthy state of nature and achieve harmonious coexistence between humans and the environment. However, there is still room for improvement in this study, and future research can focus on the following two aspects:
(1) Regarding the evaluation indicator system for the water, food, and energy systems, future endeavors can be made based on the latest economic developments. This will involve continuously revising the indicators to identify more appropriate and representative metrics, ensuring that the evaluation system evolves and remains scientifically robust and relevant. Such updates will facilitate a more comprehensive exploration of the coordination status among the three systems.
(2) Regarding identifying the factors influencing the coupling coordination of the water–food–energy system, the real economy is constantly evolving, and the factors affecting their coordinated development are similarly subject to change. Therefore, it is crucial to identify more precise driving forces and influencing factors based on current development scenarios. Future research can draw on existing studies to examine key internal factors within the system, addressing issues from the perspective of the three subsystems. Additionally, data collection is often constrained by the availability of reliable data sources. Since this study focuses on prefecture-level data, limitations in data availability may restrict the identification of certain influencing factors. Addressing these challenges will be an important area of improvement in future research.

5. Conclusions and Recommendations

5.1. Conclusions

Based on the current state of the water resource system, food system, and energy system in the Yellow River Basin, this study constructs a theoretical framework and evaluation indicator system for the three components. Utilizing panel data from 2011 to 2022 available for the 97 prefecture-level cities in the basin, it analyzes the coupling coordination degree of the water–food–energy system in the Yellow River Basin and further investigates the factors influencing the coordination degree among these three systems. The findings are as follows:
(1) The coupling coordination degree of the water–food–energy system in the Yellow River Basin exhibits significant spatial differentiation. Influenced by external economic factors and climate-related disasters, the coordination degree within the basin shows a pattern of “midstream > upstream > downstream”, reflecting notable temporal and spatial disparities.
(2) The overall coupling coordination degree of the water–food–energy system in the Yellow River Basin remains relatively low, characterized by three phases: “rapid decline—slow stabilization—upward and downward fluctuations”, with distinct clustering features. The coupling coordination degree across the 97 prefecture-level cities in the Yellow River Basin ranges between moderate imbalance and barely coordinated degrees, with very few cities classified as barely coordinated. Overall, the coordination degree is inadequate, with cities in the midstream and downstream regions exhibiting a clear clustering effect, predominantly showing mild imbalance.
(3) R&D intensity significantly influences the coupling coordination degree of the water–food–energy system in the Yellow River Basin. An increase in R&D intensity can significantly promote the orderly and coordinated development of the water–food–energy system. This, in turn, positively impacts fundamental livelihood issues and essential economic development challenges, fostering healthy and sustainable economic growth in the Yellow River Basin.

5.2. Recommendations

Based on the analysis and empirical results concerning the coupling coordination degree of the water–food–energy system in the Yellow River Basin, this study proposes the following three recommendations:
(1) Leverage modern technology to construct a land space development and utilization mechanism, as well as an energy development system, that are resilient to climate change. Based on the findings of this study, increasing R&D intensity is crucial for achieving the coordinated development of regional water–food–energy systems. Since the production and development of water, food, and energy systems are inherently connected to land space development and utilization and significantly affected by climate change, it is essential to invest in modern technology, improve government regulatory efficiency and governance capacity, and establish a land space development and utilization mechanism and energy development system that are resilient to climate change. This approach will help optimize the coordination among water, food, and energy systems. By comprehensively utilizing meteorological and evaporation data and integrating spatial information on renewable energy, biomass energy, and storage projects, a systematic analysis of climate change impacts on critical elements such as water resources, energy, agriculture, and ecology should be conducted. Establishing a climate-resilient, interconnected planning and usage adjustment mechanism for the water–food–energy–ecology system will maximize water resource utilization efficiency, unlock the development potential of renewable energy, accelerate energy transition, and proactively address extreme climate events while enhancing ecological value.
(2) Establish a comprehensive cross-departmental and cross-regional consultation mechanism to promote collaborative development among provinces and cities in the Yellow River Basin. The Yellow River Basin is an indivisible entity, and the coordination degree among the water, food, and energy systems in each region is closely tied to the overall development of the basin. Therefore, local governments should strengthen communication and collaboration among natural resources, energy, and agriculture departments to ensure effective coordination of management and planning across these sectors. Additionally, cross-regional resource coordination and cooperation should be enhanced to facilitate the movement of resources across regions, promoting sustainable regional development within the Yellow River Basin. Moreover, not only government departments but also the public, as the key stakeholders, should actively participate in the decision-making and implementation processes relating to the coordinated development of the water–food–energy system in the Yellow River Basin. This will help raise public awareness and foster greater support for ecological protection and sustainable development efforts.

Author Contributions

Conceptualization, L.N., J.Z. and M.W.; methodology, M.W., J.Z. and X.L.; software, M.W.; validation, M.W.; formal analysis, M.W.; data curation, M.W. and X.L.; writing—original draft preparation, L.N. and M.W.; writing—review and editing, L.N., J.Z. and Z.W.; visualization, L.N.; supervision, L.N. and Z.W.; project administration, L.N. and Z.W.; funding acquisition, L.N. All authors have read and agreed to the published version of the manuscript.

Funding

This study was supported by the Humanities and Social Science Project of the Ministry of Education (Grant No. 22YJAZH124), a research project supported by Shanxi Scholarship Council of China (Grant No. 2024-101), the Basic Research Program Project of Shanxi (Grant No. 202203021212494), and the General Research Project on Socioeconomic Statistics of Shanxi (Grant No. 2024Z023).

Data Availability Statement

The data presented in this study are available on request.

Conflicts of Interest

The authors declare no conflicts of interest.

References

  1. Cai, X.M.; Rosegrant, M.W. Optional Water Development Strategies for the Yellow River Basin: Balancing Agricultural and Ecological Water Demands. In 1st International Yellow River Forum; Shang, H.Q., Ed.; Yellow River Conservancy Publisher: Zhengzhou, China, 2003; pp. 125–138. [Google Scholar]
  2. Xu, Z.X. Urban Water Resources Management in the Yellow River Basin: Perspectives of Sustainability. In 2nd International Yellow River Forum; Shang, H.Q., Ed.; Yellow River Conservancy Publisher: Zhengzhou, China, 2005; pp. 253–260. [Google Scholar]
  3. Liu, J.H.; Zhang, Y.Y.; Pu, L.Y.; Huang, L.C.; Wang, H.Y.; Sarfraz, M. Research on the Impact of Energy Efficiency on Green Development: A Case Study of the Yellow River Basin in China. Energies 2023, 16, 3660. [Google Scholar] [CrossRef]
  4. Su, M.L. Yellow River Action on Climate Changes. In 5th International Yellow River Forum on Ensuring Water Right of the River’s Demand and Healthy River Basin Maintenance; Shang, H.Q., Xiang, X.L., Eds.; Yellow River Conservancy Publisher: Zhengzhou, China, 2015; pp. 29–33. [Google Scholar]
  5. Yong, Z. Strengthening Integrated River Basin Management in order to Realize the Long-term of Stability and Security in the Yellow River. In 5th International Yellow River Forum on Ensuring Water Right of the River’s Demand and Healthy River Basin Maintenance; Shang, H.Q., Xiang, X.L., Eds.; Yellow River Conservancy Publisher: Zhengzhou, China, 2015; pp. 74–79. [Google Scholar]
  6. Yan, Z.Q.; Zhou, Z.H.; Liu, J.J.; Wang, H.; Li, D. Water use characteristics and impact factors in the Yellow River basin, China. Water Int. 2020, 45, 148–168. [Google Scholar]
  7. Ren, L.Z.; Yi, N.; Li, Z.Y.; Su, Z.X. Research on the Impact of Energy Saving and Emission Reduction Policies on Carbon Emission Efficiency of the Yellow River Basin: A Perspective of Policy Collaboration Effect. Sustainability 2023, 15, 12051. [Google Scholar] [CrossRef]
  8. Wohlfart, C.; Kuenzer, C.; Chen, C.; Liu, G.H. Social-ecological challenges in the Yellow River basin (China): A review. Environ. Earth Sci. 2016, 75, 1066. [Google Scholar]
  9. Zhang, X.Y.; Liu, K.; Wang, S.D.; Wu, T.X.; Li, X.K.; Wang, J.N.; Wang, D.C.; Zhu, H.T.; Tan, C.; Ji, Y.H. Spatiotemporal evolution of ecological vulnerability in the Yellow River Basin under ecological restoration initiatives. Ecol. Indic. 2022, 135, 108586. [Google Scholar]
  10. Wang, X.R.; Duan, L.R.; Zhang, T.J.; Cheng, W.; Jia, Q.; Li, J.S.; Li, M.Y. Ecological vulnerability of China’s Yellow River Basin: Evaluation and socioeconomic driving factors. Environ. Sci. Pollut. Res. 2023, 30, 115915–115928. [Google Scholar]
  11. Niu, H.P.; Xiu, Z.Y.; Xiao, D.Y. Impact of land-use change on ecological vulnerability in the Yellow River Basin based on a complex network model. Ecol. Indic. 2024, 166, 112212. [Google Scholar]
  12. Zhang, Q.; Wang, G.; Yuan, R.Y.; Singh, V.P.; Wu, W.H.; Wang, D.Z. Dynamic responses of ecological vulnerability to land cover shifts over the Yellow river Basin, China. Ecol. Indic. 2022, 144, 109554. [Google Scholar]
  13. Qian, X.; Wang, L.; Liu, B.; Yang, J.S. Study on the Water Resources Allocation Mode of the Yellow River. In 1st International Yellow River Forum; Shang, H.Q., Ed.; Yellow River Conservancy Publisher: Zhengzhou, China, 2003; pp. 96–104. [Google Scholar]
  14. Yang, Z.F.; Sun, T.; Cui, B.S.; Chen, B.; Chen, G.Q. Environmental flow requirements for integrated water resources allocation in the Yellow River Basin, China. Commun. Nonlinear Sci. 2009, 14, 2469–2481. [Google Scholar]
  15. Guan, X.K.; Dong, Z.C.; Luo, Y.; Zhong, D.Y. Multi-Objective Optimal Allocation of River Basin Water Resources under Full Probability Scenarios Considering Wet-Dry Encounters: A Case Study of Yellow River Basin. Int. J. Environ. Res. Public Health 2021, 18, 11652. [Google Scholar] [CrossRef]
  16. Li, X.; Wan, J.; Jia, J.L.; Wang, Q. Research on Water Resource initial allocation of Yellow River Basin based on the AHP Model. In Proceedings of the 1st International Conference on Energy and Environmental Protection (ICEEP 2012), Hohhot, China, 23–24 June 2012; Iranpour, R., Zhao, J., Wang, A., Yang, F.L., Li, X., Eds.; Trans Tech Publications, Ltd.: Singapore, 2012; Volume 518–523, pp. 4216–4221. [Google Scholar]
  17. Wang, S.; Yang, J.; Wang, A.; Liu, T.; Du, S.; Liang, S. Coordinated analysis and evaluation of water–energy–food coupling: A case study of the Yellow River basin in Shandong Province, China. Ecol. Indic. 2023, 148, 110138. [Google Scholar] [CrossRef]
  18. Karamian, F.; Mirakzadeh, A.A.; Azari, A. Application of multi-objective genetic algorithm for optimal combination of resources to achieve sustainable agriculture based on the water-energy-food nexus framework. Sci. Total Environ. 2023, 860, 160419. [Google Scholar] [CrossRef] [PubMed]
  19. Sun, L.; Niu, D.; Yu, M.; Li, M.; Yang, X.; Ji, Z. Integrated assessment of the sustainable water-energy-food nexus in China: Case studies on multi-regional sustainability and multi-sectoral synergy. J. Clean. Prod. 2022, 334, 130235. [Google Scholar] [CrossRef]
  20. Li, H.; Li, M.; Fu, Q.; Singh, V.P.; Liu, D.; Xu, Y. An optimization approach of water-food-energy nexus in agro-forestry-livestock system under uncertain water supply. J. Clean. Prod. 2023, 407, 137116. [Google Scholar] [CrossRef]
  21. Zhang, Y.; Cui, J.; Liu, X.; Liu, H.; Liu, Y.; Jiang, X.; Li, Z.; Zhang, M. Application of water-energy-food nexus approach for optimal tillage and irrigation management in intensive wheat-maize double cropping system. J. Clean. Prod. 2022, 381, 135181. [Google Scholar] [CrossRef]
  22. Wu, L.; Elshorbagy, A.; Helgason, W. Assessment of agricultural adaptations to climate change from a water-energy-food nexus perspective. Agric. Water Manag. 2023, 284, 108343. [Google Scholar] [CrossRef]
  23. Maia, R.G.T.; Junior, A.O.P. Eco-Efficiency of the food and beverage industry from the perspective of sensitive indicators of the water-energy-food nexus. J. Clean. Prod. 2021, 324, 129283. [Google Scholar] [CrossRef]
  24. Wang, Y.; Song, J.; Sun, H. Coupling interactions and spatial equilibrium analysis of water-energy-food in the Yellow River Basin, China. Sustain. Cities Soc. 2023, 88, 104293. [Google Scholar] [CrossRef]
  25. Cansino-Loeza, B.; Munguía-López, A.D.C.; Ponce-Ortega, J.M. A water-energy-food security nexus framework based on optimal resource allocation. Environ. Sci. Policy 2022, 133, 1–16. [Google Scholar] [CrossRef]
  26. Francisco, É.C.; Ignácio, P.S.D.A.; Piolli, A.L.; Dal Poz, M.E.S. Food-energy-water (FEW) nexus: Sustainable food production governance through system dynamics modeling. J. Clean. Prod. 2023, 386, 135825. [Google Scholar] [CrossRef]
  27. Raya-Tapia, A.Y.; López-Flores, F.J.; Ponce-Ortega, J.M. Incorporating deep learning predictions to assess the water-energy-food nexus security. Environ. Sci. Policy 2023, 144, 99–109. [Google Scholar] [CrossRef]
  28. Chen, Q.; Liu, Y.; Su, M.; Hu, Y.; Cao, X.; Dang, Z.; Lu, G. The effect of energy–water nexus on single resource system in urban agglomerations: Analysis based on a multiregional network approach. Appl. Energy 2025, 378, 124781. [Google Scholar] [CrossRef]
  29. Zheng, Y.L.; Huang, G.H.; Li, Y.P.; Han, D.C.; Luo, B.; Liu, Y.Y.; Tang, W.C. A risk-based stochastic energy-water-carbon nexus analytical model to support provincial multi-system synergistic management—A case study of Shanxi, China. Sci. Total Environ. 2024, 957, 177608. [Google Scholar] [CrossRef] [PubMed]
  30. Ding, Y.K.; Li, Y.P.; Zheng, H.R.; Ma, Y.; Huang, G.H.; Li, Y.F.; Shen, Z.Y. Mapping Water, Energy and Carbon Footprints Along Urban Agglomeration Supply Chains. Earths Future 2022, 10, e2021EF002225. [Google Scholar] [CrossRef]
  31. He, Z.G. The Water-Energy-Carbon Coupling Coordination Level in China. Sustainability 2024, 16, 383. [Google Scholar] [CrossRef]
  32. Taherzadeh, O.; Bithell, M.; Richards, K. Water, energy and land insecurity in global supply chains. Global Environ. Change 2021, 67, 102158. [Google Scholar] [CrossRef]
  33. Rao, P.; Kostecki, R.; Dale, L.; Gadgil, A. Technology and Engineering of the Water-Energy Nexus. Annu. Rev. Environ. Resour. 2017, 42, 407–437. [Google Scholar] [CrossRef]
  34. Ke, J.; Khanna, N.; Zhou, N. Analysis of water-energy nexus and trends in support of the sustainable development goals: A study using longitudinal water-energy use data. J. Clean. Prod. 2022, 371, 133448. [Google Scholar] [CrossRef]
  35. Fang, D.L.; Chen, B. Linkage analysis for the water-energy nexus of city. Appl. Energy 2017, 189, 770–779. [Google Scholar] [CrossRef]
  36. Mosalam, H.A.; El-Barad, M. Design an Integration Platform Between Water Energy Nexus and Business Model Applied for Sustainable Development. In Proceedings of the 2nd WaterEnergyNEXUS Conference, Online, 2–4 December 2020; Naddeo, V., Balakrishnan, M., Choo, K.H., Eds.; Springer: Cham, Switzerland, 2020; pp. 481–484. [Google Scholar]
  37. Tsolas, S.D.; Karim, M.N.; Hasan, M. Systematic Design, Analysis and Optimization of Water-Energy Nexus. In Proceedings of the 9th International Conference on the Foundations of Computer Aided Process Design (FOCAPD), Online, 14–18 July 2019; Munoz, S.G., Laird, C.D., Realff, M.J., Eds.; Elsevier: Amsterdam, The Netherlands, 2019; Volume 47, pp. 227–232. [Google Scholar]
  38. Liu, Y.; Gao, Y.; Gai, J.; Liu, H.; Zhang, Z.; Diogo, V.; Hersperger, A.M. The Water-Land-Food nexus reveals growing resource export pressure in middle-income economies. Resour. Conserv. Recycl. 2025, 212, 108006. [Google Scholar] [CrossRef]
  39. Yang, D.; Liu, Y.; Wang, J. Trade-offs and synergies of food-water-land benefits for crop rotation optimization in Northeast China. Agric. Ecosyst. Environ. 2025, 379, 109377. [Google Scholar] [CrossRef]
  40. Miyagawa, K. Development for water, food, and nutrition security in Asia. Irrig. Drain. 2021, 70, 555–559. [Google Scholar]
  41. Imasiku, K.; Ntagwirumugara, E. An impact analysis of population growth on energy-water-food-land nexus for ecological sustainable development in Rwanda. Food Energy Secur. 2020, 9, e185. [Google Scholar]
  42. Ren, D.D.; Yang, H.; Zhou, L.F.; Yang, Y.H.; Liu, W.F.; Hao, X.H.; Pan, P.P. The Land-Water-Food-Environment nexus in the context of China’s soybean import. Adv. Water Resour. 2021, 151, 103892. [Google Scholar]
  43. Liu, G.Y.; Du, S.P.; Gao, Y.; Xiong, X.P.; Lombardi, G.V.; Meng, F.X.; Chen, Y.; Chen, C.C. A study on energy-water-food-carbon nexus in typical Chinese northern rural households. Energy Policy 2024, 188, 114100. [Google Scholar]
  44. Yao, L.M.; Li, Y.L.; Chen, X.D. A robust water-food-land nexus optimization model for sustainable agricultural development in the Yangtze River Basin. Agric. Water Manag. 2021, 256, 107103. [Google Scholar]
  45. Zhang, J.X.; Yang, T.; Deng, M.J. Ecosystem Services’ Supply-Demand Assessment and Ecological Management Zoning in Northwest China: A Perspective of the Water-Food-Ecology Nexus. Sustainability 2024, 16, 7223. [Google Scholar] [CrossRef]
  46. Mortada, S.; Abou Najm, M.; Yassine, A.; El Fadel, M.; Alamiddine, I. Towards sustainable water-food nexus: An optimization approach. J. Clean. Prod. 2018, 178, 408–418. [Google Scholar]
  47. Zhang, C.; Chen, X.X.; Li, Y.; Ding, W.; Fu, G.T. Water-energy-food nexus: Concepts, questions and methodologies. J. Clean. Prod. 2018, 195, 625–639. [Google Scholar]
  48. Ali, S.M.; Acquaye, A. An examination of Water-Energy-Food nexus: From theory to application. Renew. Sustain. Energy Rev. 2024, 202, 114669. [Google Scholar]
  49. Endo, A.; Kumazawa, T.; Kimura, M.; Yamada, M.; Kato, T.; Kozaki, K. Describing and Visualizing a Water-Energy-Food Nexus System. Water 2018, 10, 1245. [Google Scholar] [CrossRef]
  50. Rhouma, A.; El Jeitany, J.; Mohtar, R.; Gil, J.M. Trends in the Water-Energy-Food Nexus Research. Sustainability 2024, 16, 1162. [Google Scholar] [CrossRef]
  51. Zhu, M.C. Water-energy-food Nexus based on a new perspective of regional sustainable development. Water Supply 2023, 23, 4466–4478. [Google Scholar]
  52. Núnez-López, J.M.; Rubio-Castro, E.; Ponce-Ortega, J.M. Optimizing resilience at water-energy-food nexus. Comput. Chem. Eng. 2022, 160, 107710. [Google Scholar]
  53. Gartsiyanova, K.; Genchev, S.; Kitev, A. Assessment of Water Quality as a Key Component in the Water-Energy-Food Nexus. Hydrology 2024, 11, 36. [Google Scholar] [CrossRef]
  54. Makanda, K.; Nzama, S.; Kanyerere, T. Assessing the Role of Water Resources Protection Practice for Sustainable Water Resources Management: A Review. Water 2022, 14, 3153. [Google Scholar] [CrossRef]
  55. Voronkov, N.A. Hydrologic Role of Soils and Ecological Methods of Regulating Water-Resources. Eurasian Soil Sci. 1995, 27, 101–112. [Google Scholar]
  56. Campos, B.C.; Ren, Y.J.; Loy, J.P. Scarce Water Resources and Cereal Import Dependency: The Role of Integrated Water Resources Management. Water 2020, 12, 1750. [Google Scholar] [CrossRef]
  57. D’Odorico, P.; Davis, K.F.; Rosa, L.; Carr, J.A.; Chiarelli, D.; Dell’Angelo, J.; Gephart, J.; MacDonald, G.K.; Seekell, D.A.; Suweis, S.; et al. The Global Food-Energy-Water Nexus. Rev. Geophys. 2018, 56, 456–531. [Google Scholar]
  58. Lu, S.B.; Bai, X.; Zhang, J.; Li, J.K.; Li, W.; Lin, J. Impact of virtual water export on water resource security associated with the energy and food bases in Northeast China. Technol. Forecast. Soc. 2022, 180, 121635. [Google Scholar]
  59. Li, M.; Fu, Q.; Singh, V.P.; Liu, D.; Li, J. Optimization of sustainable bioenergy production considering energy-food-water-land nexus and livestock manure under uncertainty. Agric. Syst. 2020, 184, 102900. [Google Scholar]
  60. Terneus Páez, C.F.; Viteri Salazar, O. Analysis of biofuel production in Ecuador from the perspective of the water-food-energy nexus. Energy Policy 2021, 157, 112496. [Google Scholar]
  61. Wang, W.; Niu, Y.F.; Gapich, A.; Strielkowski, W. Natural resources extractions and carbon neutrality: The role of geopolitical risk. Resour. Policy 2023, 83, 103577. [Google Scholar]
  62. Luqman, M.; Al-Ansari, T. Energy, water and food security through a waste-driven polygeneration system for sustainable dairy production. Int. J. Hydrogen Energy 2022, 47, 3185–3210. [Google Scholar]
  63. Li, W.; Jiang, S.; Zhao, Y.; Li, H.; Zhu, Y.; He, G.; Xu, Y.; Shang, Y. A copula-based security risk evaluation and probability calculation for water-energy-food nexus. Sci. Total Environ. 2023, 856, 159236. [Google Scholar]
  64. Feng, M.; Chen, Y.; Duan, W.; Zhu, Z.; Wang, C.; Hu, Y. Water-energy-carbon emissions nexus analysis of crop production in the Tarim river basin, Northwest China. J. Clean. Prod. 2023, 396, 136566. [Google Scholar]
  65. Huang, D.; Li, G.; Chang, Y.; Sun, C. Water, energy, and food nexus efficiency in China: A provincial assessment using a three-stage data envelopment analysis model. Energy 2023, 263, 126007. [Google Scholar]
  66. Tao, M.; Zhao, Y.; Jiang, Q.; Wang, Z.; Wu, Y. Study on the nonlinear transition relationship between water resources consumption and economic development in Heilongjiang province based on system dynamics. J. Hydrol. Reg. Stud. 2025, 57, 102193. [Google Scholar]
  67. Bangjun, W.; Linyu, C.; Feng, J.; Yue, W. Research on club convergence effect and its influencing factors of per capita energy consumption: Evidence from the data of 243 prefecture-level cities in China. Energy 2023, 263, 125657. [Google Scholar]
  68. Raza, M.Y.; Chen, Y. Nuclear energy consumption, low-carbon transition and factor productivity in South Korea. Nucl. Eng. Technol. 2025, 57, 103315. [Google Scholar]
  69. Peng, S.; Wang, L.; Xu, L. Does farmland transfer promote green agricultural production? An empirical analysis of fertilizer and pesticide reduction. J. Clean. Prod. 2025, 489, 144631. [Google Scholar] [CrossRef]
  70. Cheng, X.; Fang, L.; Li, J.; Wang, H. An empirical analysis of the impact of the coupling coordination degree of the water-energy-food nexus on food security in China. Curr. Res. Environ. Sustain. 2024, 8, 100261. [Google Scholar] [CrossRef]
  71. Xu, L.; Shu, H.; Lu, X.; Li, T. Regional technological innovation and industrial upgrading in China: An analysis using interprovincial panel data from 2008 to 2020. Financ. Res. Lett. 2024, 66, 105621. [Google Scholar]
  72. Wang, Q.; Li, L. The effects of population aging, life expectancy, unemployment rate, population density, per capita GDP, urbanization on per capita carbon emissions. Sustain. Prod. Consum. 2021, 28, 760–774. [Google Scholar] [CrossRef]
  73. Tong, K. Urbanization moderates the transitional linkages between energy resource use, greenhouse gas emissions, socio-economic and human development: Insights from subnational analyses in China. J. Clean. Prod. 2024, 476, 143776. [Google Scholar] [CrossRef]
  74. Su, M.; Wang, Q.; Li, R.; Wang, L. Per capita renewable energy consumption in 116 countries: The effects of urbanization, industrialization, GDP, aging, and trade openness. Energy 2022, 254, 124289. [Google Scholar] [CrossRef]
  75. Liu, D.J.; Li, L. Application Study of Comprehensive Forecasting Model Based on Entropy Weighting Method on Trend of PM2.5 Concentration in Guangzhou, China. Int. J. Environ. Res. Public Health 2015, 12, 7085–7099. [Google Scholar] [CrossRef]
  76. Qi, Y.Y.; Farnoosh, A.; Lin, L.; Liu, H. Coupling coordination analysis of China’s provincial water-energy-food nexus. Environ. Sci. Pollut. Res. 2022, 29, 23303–23313. [Google Scholar]
  77. Li, Y.; Zhou, B. Coupling coordination degree measurement and spatial characteristics analysis of green finance and technological innovation -Empirical analysis based on China. Heliyon 2024, 10, e33486. [Google Scholar] [CrossRef]
  78. Zhao, Y.H.; Hou, P.; Jiang, J.B.; Zhai, J.; Chen, Y.; Wang, Y.C.; Bai, J.J.; Zhang, B.; Xu, H.T. Coordination Study on Ecological and Economic Coupling of the Yellow River Basin. Int. J. Environ. Res. Public Health 2021, 18, 10664. [Google Scholar] [CrossRef]
  79. Luan, S. Restriction factors and improvement paths of ecological environment and water resources protection in Qinghai Section of the Yellow River basin. Desalin Water Treat. 2023, 315, 565–571. [Google Scholar]
  80. Zhao, J.; Zhang, Q.; Xu, L.; Sun, S.; Wang, G.; Singh, V.P.; Wu, W. Flood-susceptible areas within the Yellow River Basin, China: Climate changes or socioeconomic behaviors. J. Hydrol. Reg. Stud. 2024, 55, 101900. [Google Scholar]
  81. Chen, M.; Zhao, J.; Zhao, S. Measurement and evaluation of agricultural technological innovation efficiency in the Yellow River Basin of China under water resource constraints. Heliyon 2024, 10, e32521. [Google Scholar]
  82. Zhang, J.X. Comprehensive Evaluation and Analysis of Water Resources Development and Utilization Degree. Fresen Environ. Bull. 2021, 30, 3221–3227. [Google Scholar]
  83. Ding, T.H.; Chen, J.F. Evaluation and obstacle factors of coordination development of regional water-energy-food-ecology system under green development: A case study of Yangtze River Economic Belt, China. Stoch. Environ. Res. Risk Assess. 2022, 36, 2477–2493. [Google Scholar]
  84. Wang, Y.R.; Song, J.X.; Zhang, X.X.; Sun, H.T.; Bai, H.F. Coupling coordination evaluation of water-energy-food and poverty in the Yellow River Basin, China. J. Hydrol. 2022, 614, 128461. [Google Scholar]
  85. Liu, S.Y.; Wang, L.C.; Lin, J.; Wang, H.; Li, X.G.; Ao, T.Q. Evaluation of Water-Energy-Food-Ecology System Development in Beijing-Tianjin-Hebei Region from a Symbiotic Perspective and Analysis of Influencing Factors. Sustainability 2023, 15, 5138. [Google Scholar] [CrossRef]
  86. Wang, S.S.; Yang, R.J.; Shi, S.; Wang, A.L.; Liu, T.F.; Yang, J.Y. Characteristics and Influencing Factors of the Spatial and Temporal Variability of the Coupled Water-Energy-Food Nexus in the Yellow River Basin in Henan Province. Sustainability 2023, 15, 13977. [Google Scholar] [CrossRef]
  87. Li, C.G.; Liu, Y.; Xu, Z.C.; Zhao, G.; Bao, Y.H.; Cai, C.C.; Lu, Y.; Mao, Y.F.; Wang, A.B.; Wu, L. Impacts and influencing pathways of urbanization on carbon-water-energy-food nexus across Chinese cities. Environ. Dev. Sustain. 2024. [Google Scholar] [CrossRef]
Figure 1. A map of the Yellow River Basin.
Water 17 01040 g001
Figure 2. An illustration of the interactions between water, food, and energy.
Water 17 01040 g002
Figure 3. Coupling coordination degree in the Yellow River Basin.
Water 17 01040 g003
Figure 4. Spatial evolution trend of the coupling coordination degree in the Yellow River Basin.
Water 17 01040 g004aWater 17 01040 g004b
Table 1. Water–food–energy indicator system.
Primary IndicatorsSecondary IndicatorsIndicator Description (Units)
Water Resource SubsystemWater Consumption per Unit GDPWater consumption per 10,000 Yuan GDP
(billion cubic meters/10,000 Yuan)
Per Capita Water Resource AvailabilityPer capita water resource availability of the urban population at year-end (cubic meters/person)
Water Production Coefficient *Total water resources/Annual precipitation
Energy SubsystemEnergy Consumption per Unit GDPEnergy consumption per 10,000 Yuan GDP
(tons/10,000 Yuan)
Per Capita Energy ConsumptionPer capita energy consumption of the urban population at year-end (tons/person)
Carbon IntensityCarbon dioxide emissions/GDP (tons/10,000 Yuan)
Food SubsystemPer Capita Grain YieldPer capita grain yield of the urban population at year-end (tons/person)
Per Capita Total Power of Agricultural MachineryTotal power of agricultural machinery in agriculture, forestry, animal husbandry, and fishery/Population (kilowatts/person)
Fertilizer Application per Unit AreaFertilizer application amount/Cultivated land area (10,000 tons/square kilometer)
Note: * The water production coefficient refers to the ratio of the total water resources in a region to the total annual precipitation. It primarily reflects the extent to which the groundwater system can more rapidly release groundwater when subjected to external pressures. The calculation of the water production coefficient is the total water resources of a region divided by the total annual precipitation.
Table 2. Influencing factors of the coupling coordination degree of the water–food–energy system.
Variable TypeIndicator NameIndicator Description
Indicator NameWater–Food–Energy Coupling Coordination Degree/
Core Explanatory VariablesR&D IntensityR&D Expenditure as a Percentage of GDP
Control VariablesAverage PM2.5 ConcentrationAnnual Average PM2.5 Concentration
Industrial StructureThe total GDP of the tertiary industry/The total GDP of the country
Urbanization RateUrban Population/Total Population
Per Capita GDPTotal Output/Resident Population
Population DensityTotal Population/Regional Area
Table 3. Classification criteria for the coupling coordination degree of the water–food–energy system.
Coupling
Coordination Degree
Coordination TypeCoupling Coordination DegreeCoordination Type
[0, 0.1)Extreme Imbalance[0.1, 0.2)Severe Imbalance
[0.2, 0.3)Moderate Imbalance[0.3, 0.4)Mild Imbalance
[0.4, 0.5)Near Imbalance[0.5, 0.6)Barely Coordinated
[0.6, 0.7)Primary Coordination[0.7, 0.8)Intermediate Coordination
[0.8, 0.9)Good Coordination[0.9, 1]High-Quality Coordination
Table 4. Descriptive statistics of variables.
VariablesNMeanStdMinMax
Coupling Coordination Degree11640.3490.0480.2110.531
R&D Intensity11640.0180.06901.741
Average PM2.5 Concentration11640.0490.0180.0150.11
Industrial Structure11640.420.0990.1650.886
Urbanization Rate11640.5420.1420.1960.96
Per Capita GDP11645.7293.8780.69228.518
Population Density11645.6181.0861.6287.273
Table 5. Results of the baseline regression.
Variables(1)(2)
Coupling Coordination DegreeCoupling Coordination Degree
R&D Intensity−0.0410 ***−0.0372 ***
(−6.5977)(−5.7359)
Average PM2.5 Concentration −0.2114 ***
(−3.5089)
Industrial Structure −0.0380 ***
(−3.9887)
Urbanization Rate −0.0407 ***
(−3.5965)
Per Capita GDP −0.0023 ***
(−5.2045)
Population Density −0.0080
(−1.1843)
City Fixed EffectsYESYES
Year Fixed EffectsYESYES
_cons0.3626 ***0.4561 ***
(286.2043)(11.8924)
N11641164
Adj. R20.1460.083
F25.53134.430
Note: *** p < 0.01, ** p < 0.05, * p < 0.10; results in parentheses are t-values.
Table 6. Results of the robustness test.
VariablesCoupling Coordination Degree
Average PM2.5 Concentration−0.2328 ***
(−3.7948)
Number of Patent Grants−0.0015 **
(−2.4315)
Industrial Structure−0.0323 ***
(−3.3533)
Urbanization Rate−0.0433 ***
(−3.7789)
Per Capita GDP−0.0024 ***
(−5.5142)
Population Density−0.0085
(−1.2381)
City Fixed EffectsYES
Year Fixed EffectsYES
_cons0.4601 ***
(11.8426)
Adj. R20.059
F29.218
Note: *** p < 0.01, ** p < 0.05, * p < 0.10; results in parentheses are t-values.
Disclaimer/Publisher’s Note: The statements, opinions and data contained in all publications are solely those of the individual author(s) and contributor(s) and not of MDPI and/or the editor(s). MDPI and/or the editor(s) disclaim responsibility for any injury to people or property resulting from any ideas, methods, instructions or products referred to in the content.

