Article

A Comparative Study on Leakage Magnitude Occurred in Reservoir While Passing a Tunnel Beneath Reservoir

1
CCCC Second Harbour Engineering Company Ltd., Wuhan 430000, China
2
China State Construction Engineering Corporation Ltd., Beijing 100020, China
3
School of Transportation, Southeast University, Nanjing 211189, China
*
Author to whom correspondence should be addressed.
Water 2025, 17(7), 1068; https://doi.org/10.3390/w17071068
Submission received: 11 March 2025 / Revised: 31 March 2025 / Accepted: 2 April 2025 / Published: 3 April 2025
(This article belongs to the Section Hydraulics and Hydrodynamics)

Abstract

:
To prevent a decrease in the water level of the reservoir caused by water surges and seepage from the tunnel beneath the reservoir, it is essential to clarify the hydraulic connection between the reservoir and the underpass tunnel. A MODFLOW three-dimensional grid model was developed using GMS 10.6 software to examine this hydraulic connection. The model focused on the section of the tunnel beneath the reservoir, investigating the effects of factors such as the permeability coefficient of the stratum, rainfall recharge, fault permeability, aquifer thickness, and the silt layer at the reservoir’s bottom on tunnel water inflow. Additionally, the relationship between tunnel water inflow and reservoir water levels was analyzed. The results indicate that the presence of faults enhances the hydraulic connection between the tunnel and the reservoir. An increase in fault permeability leads to greater water inflow into the tunnel at the fault location. As the permeability coefficient of the stratum increases, the decline in reservoir water levels follows an S-shaped curve. The silt layer at the bottom of the reservoir helps mitigate the drop in water levels caused by tunnel water inflow. When the water influx is below 0.4 m3/d, the reservoir water level remains unaffected. However, when the influx exceeds 0.7 m3/d, the water level decreases rapidly as the influx increases. At an influx near 1 m3/d, the reservoir level drops by approximately 7 m. The reservoir is particularly susceptible to leakage when the fault penetrates the bottom of the reservoir and forms a hydraulic connection with the tunnel. This study provides a predictive method for assessing reservoir water level reductions caused by tunnel surges, which can aid in mitigating such effects in the future.

1. Introduction

The rapid development of tunneling has led to a significant increase in the number of tunnels in operation. By the end of 2022, the total number of tunnels in China is expected to exceed 17,000, with a combined length surpassing 20,000 km. By 2030, this figure is projected to exceed 30,000 km [1,2,3]. However, numerous challenges must be addressed during tunnel construction [4,5,6,7]. One major challenge is encountering adverse geological conditions during construction [8,9,10]. Additionally, tunnel construction often involves the coupling of multiple physical fields, such as the stress field of the surrounding rock and the seepage field of groundwater. The excavation of underground chambers can alter these fields, particularly under the influence of water–force coupling, creating further difficulties in tunnel construction [11,12].
In geotechnical and tunneling studies, the main problem studied is usually groundwater seepage. Terzaghi (1943) [13] developed a one-dimensional consolidation model in 1923 and proposed the theory of one-dimensional consolidation and the principle of effective stress. In the mid-twentieth century, Biot (1941) [14] began to extend the one-dimensional consolidation of geotechnical bodies to three dimensions and gave the corresponding formulas. Witherspoon et al. (1981) [15] developed a physical model to discuss the hydrodynamics of flow in a single fracture, proposing a coupling of stress and seepage fields. Zhuo (2000) [16] found that the ratio of the maximum fracture spacing to the minimum boundary size should be greater than 1/50 or 1/20 in the study of continuous media. Huyakorn et al. (1983) [17] developed four conceptual models of groundwater seepage in fractured rock bodies and proposed two numerical solutions to the governing equations associated with the flow models. Meanwhile, when traversing through broken rock and soil bodies during cave excavation, due to the good penetration between structural surfaces inside the broken rock, the construction process is prone to palm face collapse, water seepage, water burst, and water surge, which affects the safety and quality of the project, and results in safety accidents, such as the Zhuhai Tunnel water penetration accident (2021, China) [18], the Anshi Tunnel exit water surge accident (2019, China) [19], and the Malu Turnip Tunnel inlet spillway water surge accident (2008, China) [20]. Therefore, before excavation for underwater tunnel construction, it is very important to carry out research on the hydraulic connection between the water body and the rock body to ensure the safety of tunnel construction.
In recent years, many scholars have conducted a lot of studies on the prediction of tunnel water influx and risk assessment. Li et al. (2024) [21] developed a dynamic modeling method for the prediction of water influx in tunnels excavated in a relatively homogeneous rock body and explored the effect of tunnel diameter on the influx, which provided theoretical and numerical support for the safety of the construction of tunnels excavated in a relatively homogeneous rock body in a karst area. Mahmoodzadeh et al. (2021, 2023) [22,23] worked on the prediction of tunnel water influx using a machine learning-based solution to improve the safety of tunnel construction and verified the potential of machine learning in the estimation of tunnel water influx by comparing the results with the actual calculations. Liu et al. (2023) [24] developed a stable tunnel water influx and the radius of influence prediction considering the non-Darcy effect in a semi-empirical model was developed to help evaluate the steady water inflow and radius of influence of tunnels under non-Darcy flow conditions. Shi et al. (2023) [25] developed a stochastic deterministic 3D fracture network-based model for predicting water inflow in tunnels, which solved the problem of searching seepage paths quickly and accurately with a lot of data and a complex logical structure in fracture networks. Dall’Alba et al. (2023) [26] presented a workflow for probabilistic estimation of karst pipeline inflows using Monte Carlo methods and showed that even if system differential pressure and matrix permeability values are important factors controlling long-term inflows, the geometry and connectivity of karst pipeline networks play a key role in determining the potential flow.
Dall’Alba et al. (2023) [26] proposed a method for predicting water inflow in tunnels considering the non-Darcy effect. In [26] they presented a workflow for probabilistic estimation of karst pipe inflow using Monte Carlo methods, and the results showed that the geometry and connectivity of the karst pipe network play a key role in determining the potential flow rate even though the system differential pressure and the value of the matrix permeability are important factors in controlling the long-term inflow. Li et al. (2021) [27] derived a model for steady-state groundwater inflow in circular tunnels that takes into account the anisotropic permeability, and the validation results show that the method can predict the total head and pressure head around the tunnel and the water inflow along the tunnel surface with high accuracy.
In this study, a large-scale, macroscopic three-dimensional groundwater flow model was developed using GMS 10.6, and a numerical analysis of groundwater flow was conducted through the MODFLOW module to enable macroscopic analysis of the groundwater system beneath the tunnel in the reservoir project. The three-dimensional (3D) model incorporates the relative positions of the tunnel and reservoir, faults, and hydrogeological conditions, and analyzes the hydraulic connection between tunnel water influx and the reservoir through groundwater flow calculations. Additionally, the study quantitatively assesses the effects of stratigraphic characteristics, rainfall, and the reservoir on tunnel water influx, and explores the relationship between tunnel water influx and changes in the water level of Tianzhu Lake.

2. Methods

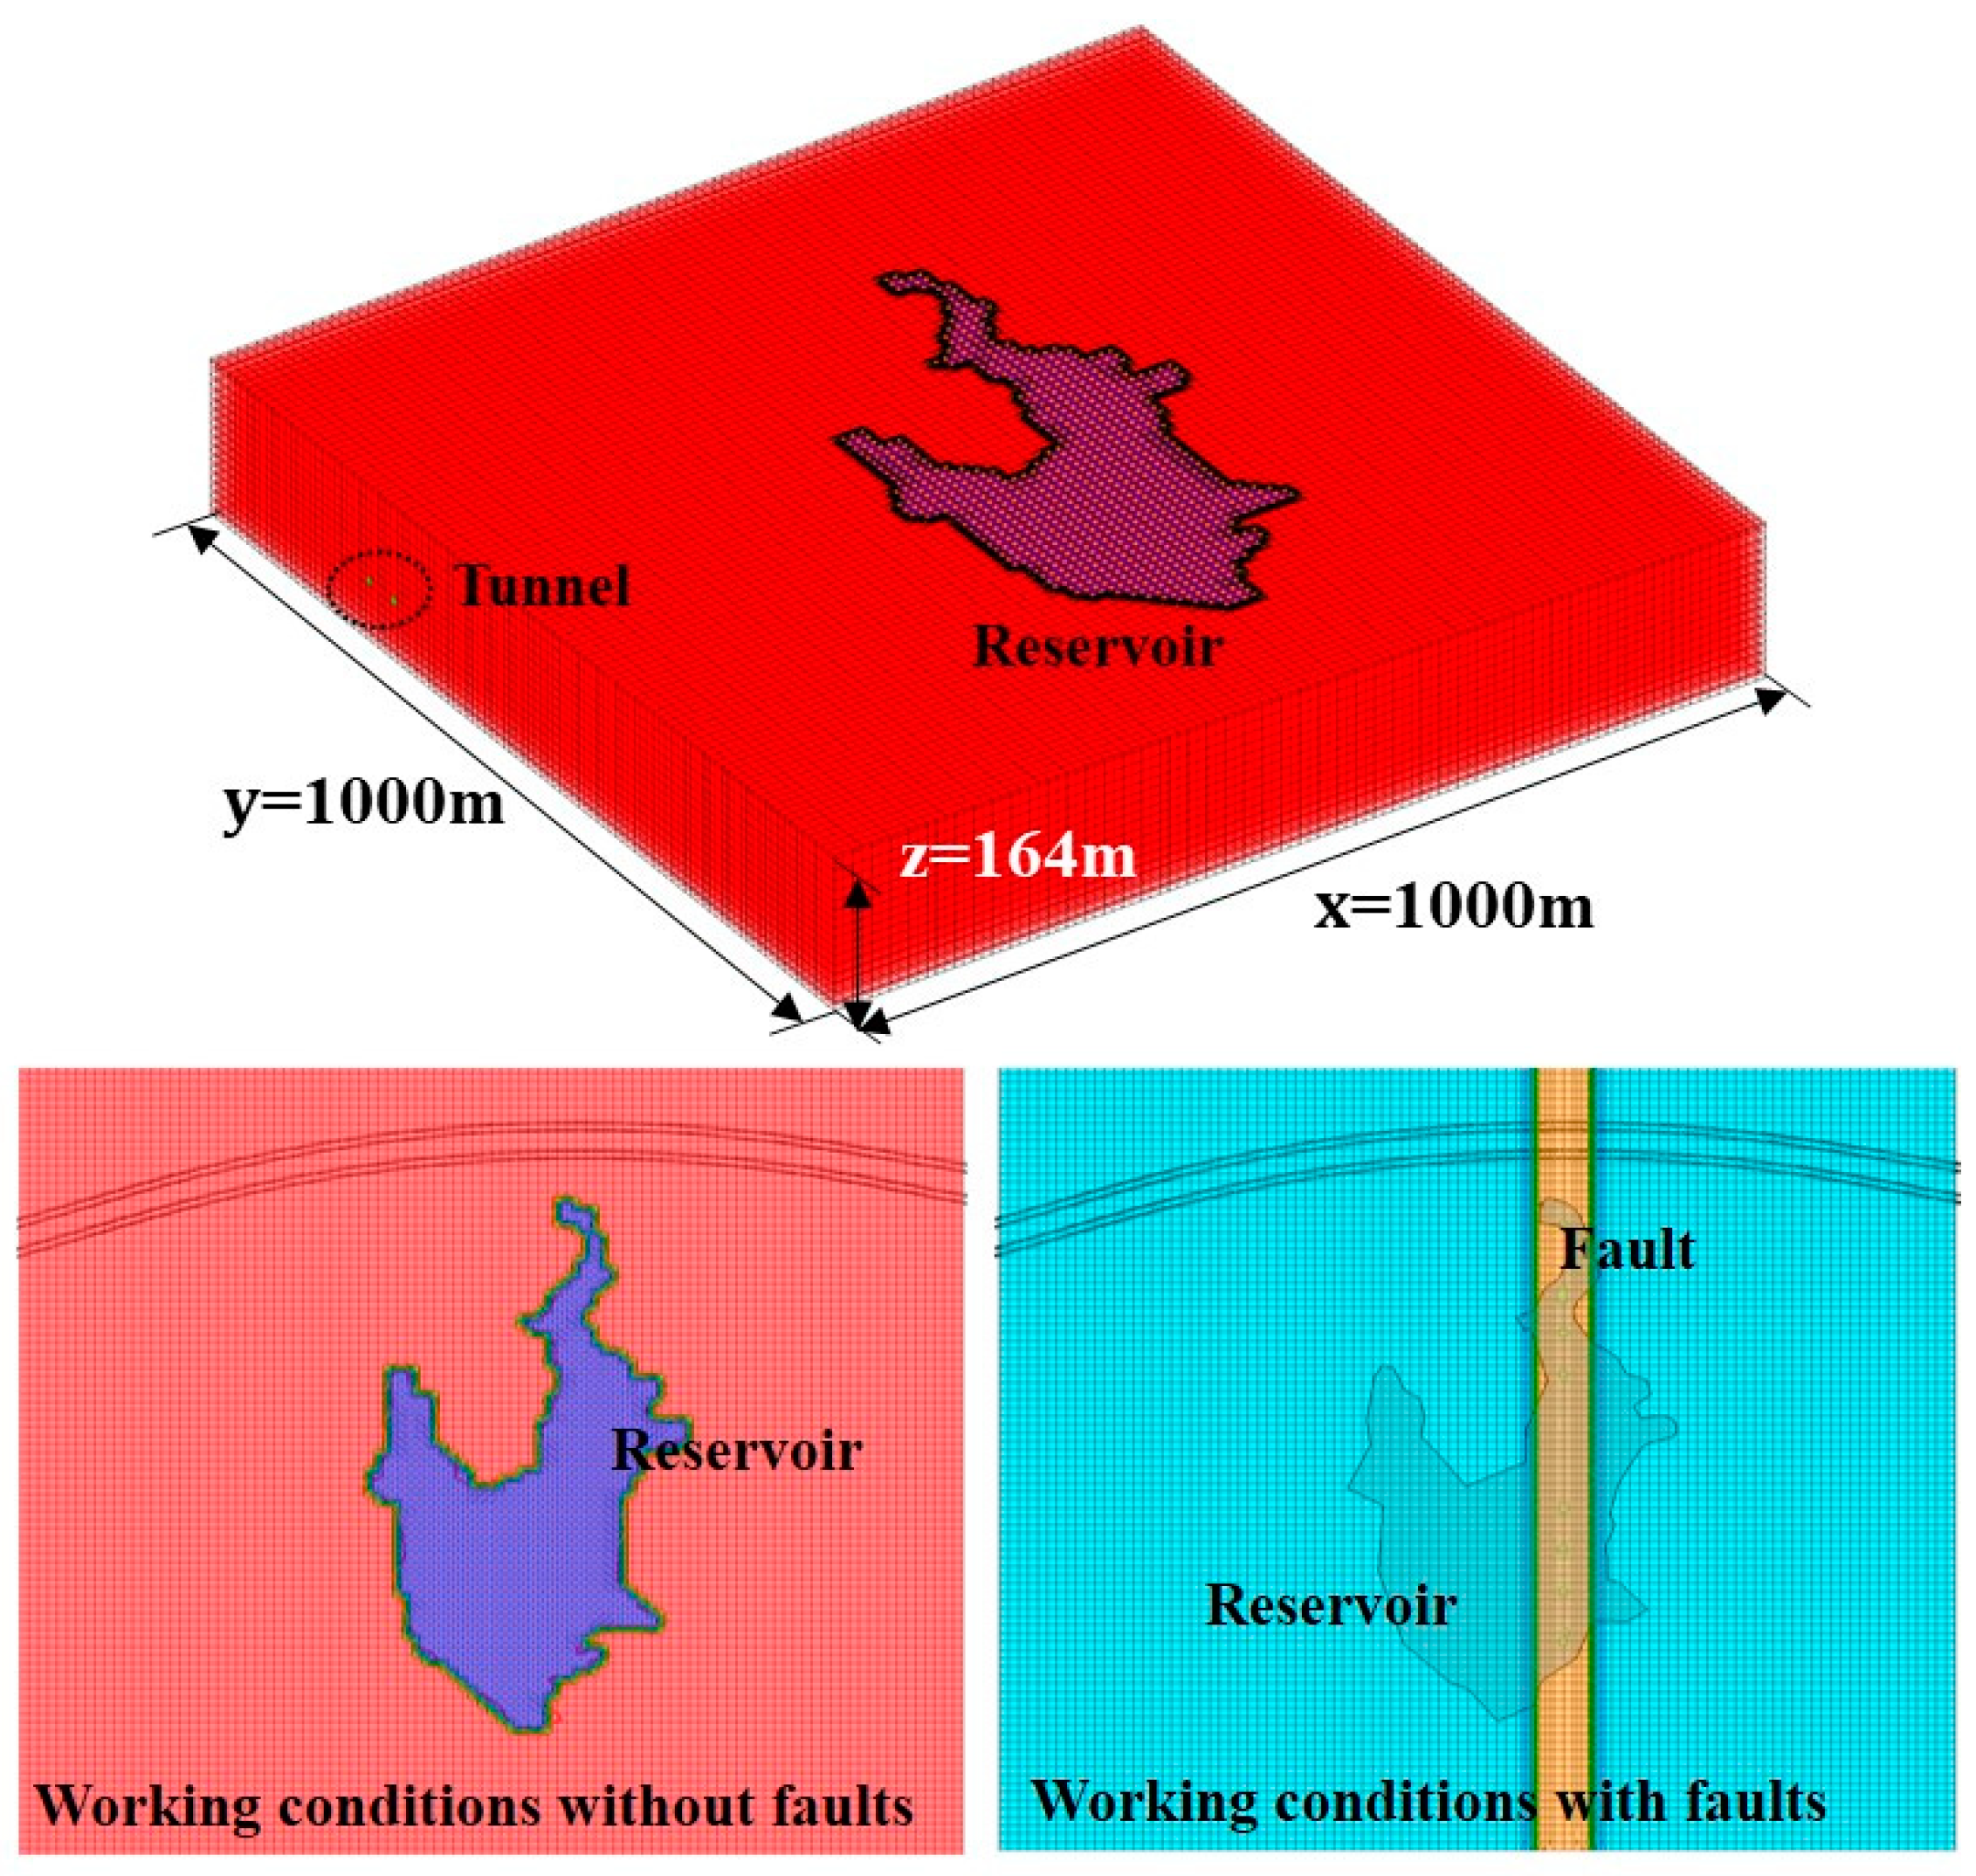
2.1. Project Overview

The tunnel project is located in Section B of the Xiazhangjie to Fengshan segment of National Highway 324 (Vertical Second Line) in Xiamen, Fujian Province, China. The starting and ending points are at YK4 + 660,000 and YK9 + 827.967, respectively, situated in Haicang District and Jimei District of Xiamen. The route passes through complex and sensitive environments, including the Provincial Party School, Tianzhu Lake Reservoir, and military land. The Dajianshan Tunnel is a separate, extra-long tunnel. The left line ranges from ZK4 + 792 to ZK7 + 980, with a total length of 3188 m, while the right line spans from YK4 + 797 to YK7 + 975, with a total length of 3178 m. The inner diameter of the tunnel is 5.55 m.

2.2. Mathematical Formulation

GMS is a comprehensive modeling software that supports multiple types of models and provides tools for sharing information across different models and data types. These tools facilitate field characterization, model conceptualization, grid and mesh generation, geostatistics, and postprocessing. MODFLOW is a modular hydrologic model developed by the U.S. Geological Survey, which is used to simulate and predict groundwater conditions as well as groundwater/surface-water interactions. GMS’s groundwater model, MODFLOW, performs both steady-state and transient analyses, offering a wide range of boundary conditions and input options. In GMS, MODFLOW operates in conjunction with the 3D Grid module and the 3D UGrid module. The current suite of MODFLOW-related programs includes capabilities to simulate coupled groundwater/surface-water systems, solute transport, variable-density flow (including brine), aquifer system compaction and ground subsidence, parameter estimation, and groundwater management.
There are two methods for constructing MODFLOW models in GMS: the grid method and the conceptual model method. The grid method involves directly using 3D grids and adding other model parameters based on the cells. The conceptual modeling method utilizes geographic information system (GIS) tools in the map module to develop a conceptual model of the area being modeled and subsequently integrates the data from the conceptual model into the grid. This study employs the 3D mesh method to create a MODFLOW 3D model. To simplify calculations, the following basic assumptions are typically made: (1) the surrounding rock is a porous, homogeneous material, and its thermal properties remain constant with temperature; (2) the effects of formation porosity and gases in the water are neglected, and it is assumed that the formation below the water table is fully saturated, with the water column being incompressible; (3) the density variation of water is neglected; (4) geomorphic relief is neglected, and the groundwater table and the maximum reservoir level are modeled as the upper surface; (5) the water head of the tunnel excavation is set to 0, causing water from the surrounding high-head strata to flow toward the tunnel, simulating water influx into the tunnel excavation.
MODFLOW uses the finite difference method for calculation, and in this case, the flow/partial differential equation of groundwater in three-dimensional space in the formation pore medium is shown in Equation (1):
S h t = x ( K x x h x ) + x ( K y y h y ) + x ( K z z h z ) W
where Kxx, Kyy, and Kzz are the permeability coefficients in the x, y, and z directions, respectively, m/s; h is the height of the water head, m; W is the unit volume flow, s−1; S is the water storage rate of the formation pore medium, m−1; t is time, s.
The velocity field of porous media is calculated using Darcy’s law:
ε p ρ f t + ρ f u f = 0
u f = κ u f + p f + ρ f g D
where κ is the permeability, m2; uf is the dynamic viscosity of groundwater, Pa·s; pf is pore pressure, Pa; g is the gravitational acceleration, m2/s; D is the elevation along the vertical coordinate direction, m.

2.3. Modeling Process

A large-scale 3D mesh model of MODFLOW was created by integrating AutoCAD 2014 and GMS 10.6 software. First, a 3D finite difference mesh model was developed in the GMS module by controlling the scale and number of cells in the X, Y, and Z directions (in meters). Background images of reservoirs, tunnels, faults, and rivers were then imported into GMS, with the cells corresponding to the locations of the river and tunnel drainage, which were assigned and defined to their respective bodies. Subsequently, a 2D polygon was created, and the grid was divided to define the area and position based on the reservoir boundary wireframe. The imported reservoir bottom elevation point data were used to generate the elevation grid for the reservoir bottom within the TIN module. Finally, the 2D reservoir model was extended to a 3D model, and the reservoir model data were discretized into the stratigraphic grid.

2.4. Initial and Boundary Conditions

The 3D finite difference mesh model established by MODFLOW is shown in Figure 1. The geometric dimensions of the model are 1000 m length, 1000 m width, and 164 m height. The grid cells of the model are hexahedra and properly densify the grid at the boundary of the reservoir. The average depth of the reservoir is 7.5 m and the maximum depth is 12 m. The area of the tunnel excavation cross-section was 97.6 m2 and the circumference was 36.3 m. The size of the tunnel grid section in the MODFLOW model is 10 m × 5 m, the area of the excavation surface corresponding to the two-layer grid section is 100 m2, and the drainage perimeter is 40 m. Therefore, the drainage boundary of the MODFLOW grid model is close to that of the actual project. In the case of faults, the width of the fault is set to be 60 m, the dip of the fault is 90°, and the strike is approximately perpendicular to the tunnel and runs through the bottom of the reservoir, according to the actual distribution of the faults in the geological survey and on-site investigation, and taking into account the most unfavorable situation, as shown in Figure 1. The calculation parameters in the numerical model are listed in Table 1. A grid-dependent work was performed. The grids in the above numerical model converged at 719,000 domain grids.

2.5. Model Verification

The precipitation infiltration method based on the theory of groundwater equilibrium in steady state can estimate the tunnel influx. The theoretical estimated tunnel inflows were compared to the tunnel inflows predicted by the MODFLOW model to verify the reliability of the groundwater model. Groundwater in the tunnel area is mainly fissure-porous water in the moderately weathered bedrock, which is greatly affected by precipitation and seasonality, and the amount of water varies greatly. Therefore, the amount of water in the tunnel is calculated according to the annual average precipitation infiltration and recharge. According to the 1:2000 topographic map, the catchment area of the tunnel is about 2.62 × 10⁴ m2.
Disregarding the effect of formation permeability, the formula for estimating the tunnel influx is as follows:
Q = α F A T
where Q is the estimated tunnel influx, A is the area of the tunnel catchment region, F is the average annual rainfall, and T is the calculation time.
Disregarding the radius of influence of the tunnel surge, according to the “Handbook of Hydrogeology” and “Code for Hydrogeological Investigation of Railway Engineering” the empirical formula for the normal water influx of the tunnel is as follows:
Q = K H 0 . 676 - 0 . 06 K
Considering the permeability coefficient of the stratum and the radius of influence of tunnel water influx, based on the theoretical formula of groundwater dynamics Dupuit, the tunnel water influx is calculated as follows:
Q = K H 2 R
When the depth of water is shallow, it is calculated as follows:
R = 2 H K H
When the water is pressurized water due to being deep enough, it is calculated as follows:
R = 10 H K
where Q is the water influx per unit length of tunnel; K is the permeability coefficient of aquifer; H is the thickness of aquifer; and R is the radius of influence of water influx in the tunnel.
The comparison of simulated and measured values is shown in Table 2. The average influx of water per unit length of tunnel was calculated to be approximately 0.72 m3/d using Equation (6). In the MODFLOW model, the simulation with the same parameters resulted in an influx of 0.88 m3/d per unit length of the tunnel without considering the effect of silt at the bottom of the lake, while considering the effect of silt at the bottom of the lake, the influx of water per unit length of the tunnel is 0.69 m3/d. The maximum error between the simulated value and theoretical value was within 22%. Therefore, the MODFLOW model and parameter values are reasonable and can be used to perform groundwater system analysis.

2.6. Parametric Study

Figure 2 shows the distribution of the waterhead of the reservoir and groundwater above the tunnel caused by the water influx. As shown in Figure 2a, the tunnel generates water influx, which firstly causes the loss of water in the stratum close to the tunnel side. Due to the presence of the reservoir, the waterhead is distributed in a band along the edge of the reservoir. Under the influence of precipitation recharge, the waterhead of the topsoil around the reservoir away from the tunnel is higher than the reservoir waterhead. In the topsoil that is less affected by the tunnel surge, groundwater converges towards the reservoir. When anthropogenic pumping is not considered, the reservoir is recharged by rainfall which causes the water level to rise slightly. As shown in Figure 2b, with the increase in stratum depth, the waterhead distribution is gradually reduced by the influence of the reservoir and gradually increased by the influence of the tunnel water influx. The water body above the tunnel clearly exhibits a waterhead contour distributed along the tunnel belt, as shown in Figure 2c. In Figure 2d, it is shown that due to the formation of two-banded distribution of waterhead contours by the tunnel drainage, the waterhead at the fault is obviously larger than that at the non-faulted area because the permeability coefficient of the fault is larger than that of the non-faulted section. Therefore, the following five parameters are used for parametric analysis, as shown in Table 3.

3. Results and Analysis

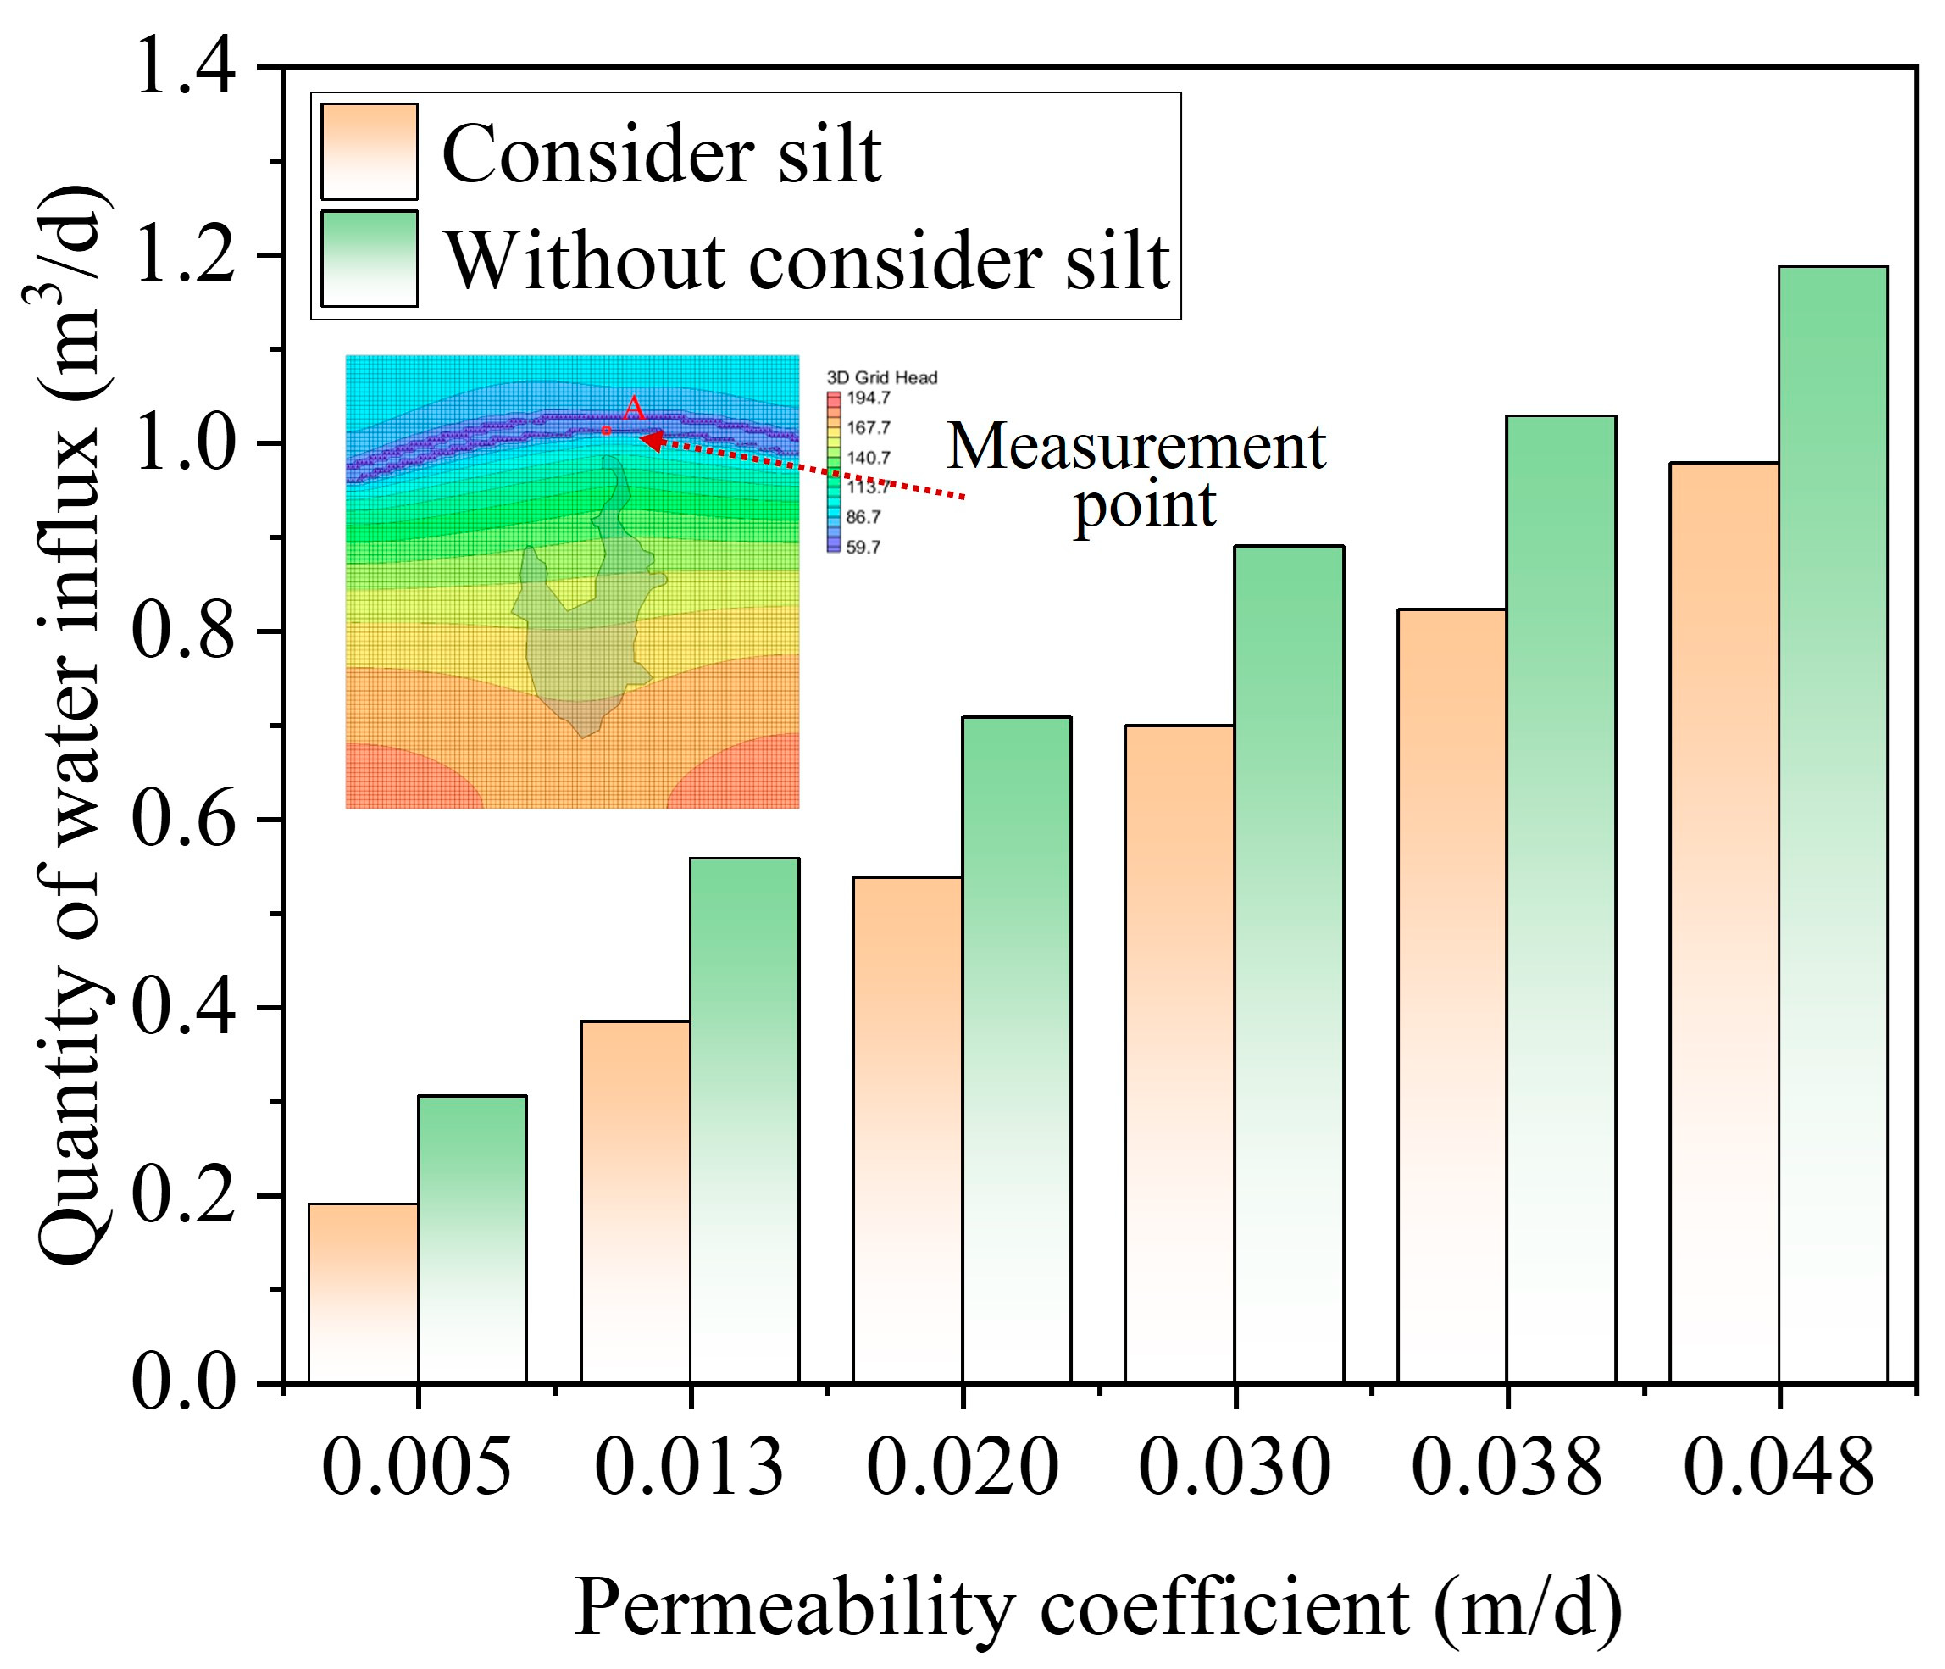
3.1. Effect of Permeability Coefficient of the Surrounding Rock

Figure 3 shows the variation in the quantity of water influx with various permeability coefficients of the rock. In the absence of faults, the tunnel surge monitoring point is the point closest to the reservoir (Point A). As shown in Figure 3, the quantity of water influx increases with increasing permeability coefficients of the rock. The water influx quantity in the tunnel at 0.5 m of lake bottom silt is slightly less than that without considering lake bottom silt. When the permeability coefficient is 0.013–0.048 m/d, the difference in inflow per unit tunnel length between those with and without lake bottom silt is about 0.18 m3/d. When the permeability coefficient is 0.013 m/d, the daily influx of water per unit length of the tunnel is about 0.4 m3/d. When the permeability coefficient is 0.048 m/d, the daily influx of water per unit length of the tunnel without consideration of the silt at the bottom of the lake and with consideration of the silt at the bottom of the lake is 1.11 m3/d and 0.95 m3/d, respectively, which shows that the size of the influx of water in the tunnel is affected by the silt at the bottom of the lake at the same time. Additionally, the difference between the tunnel considering silt and without considering silt increases when the permeability coefficient increases.

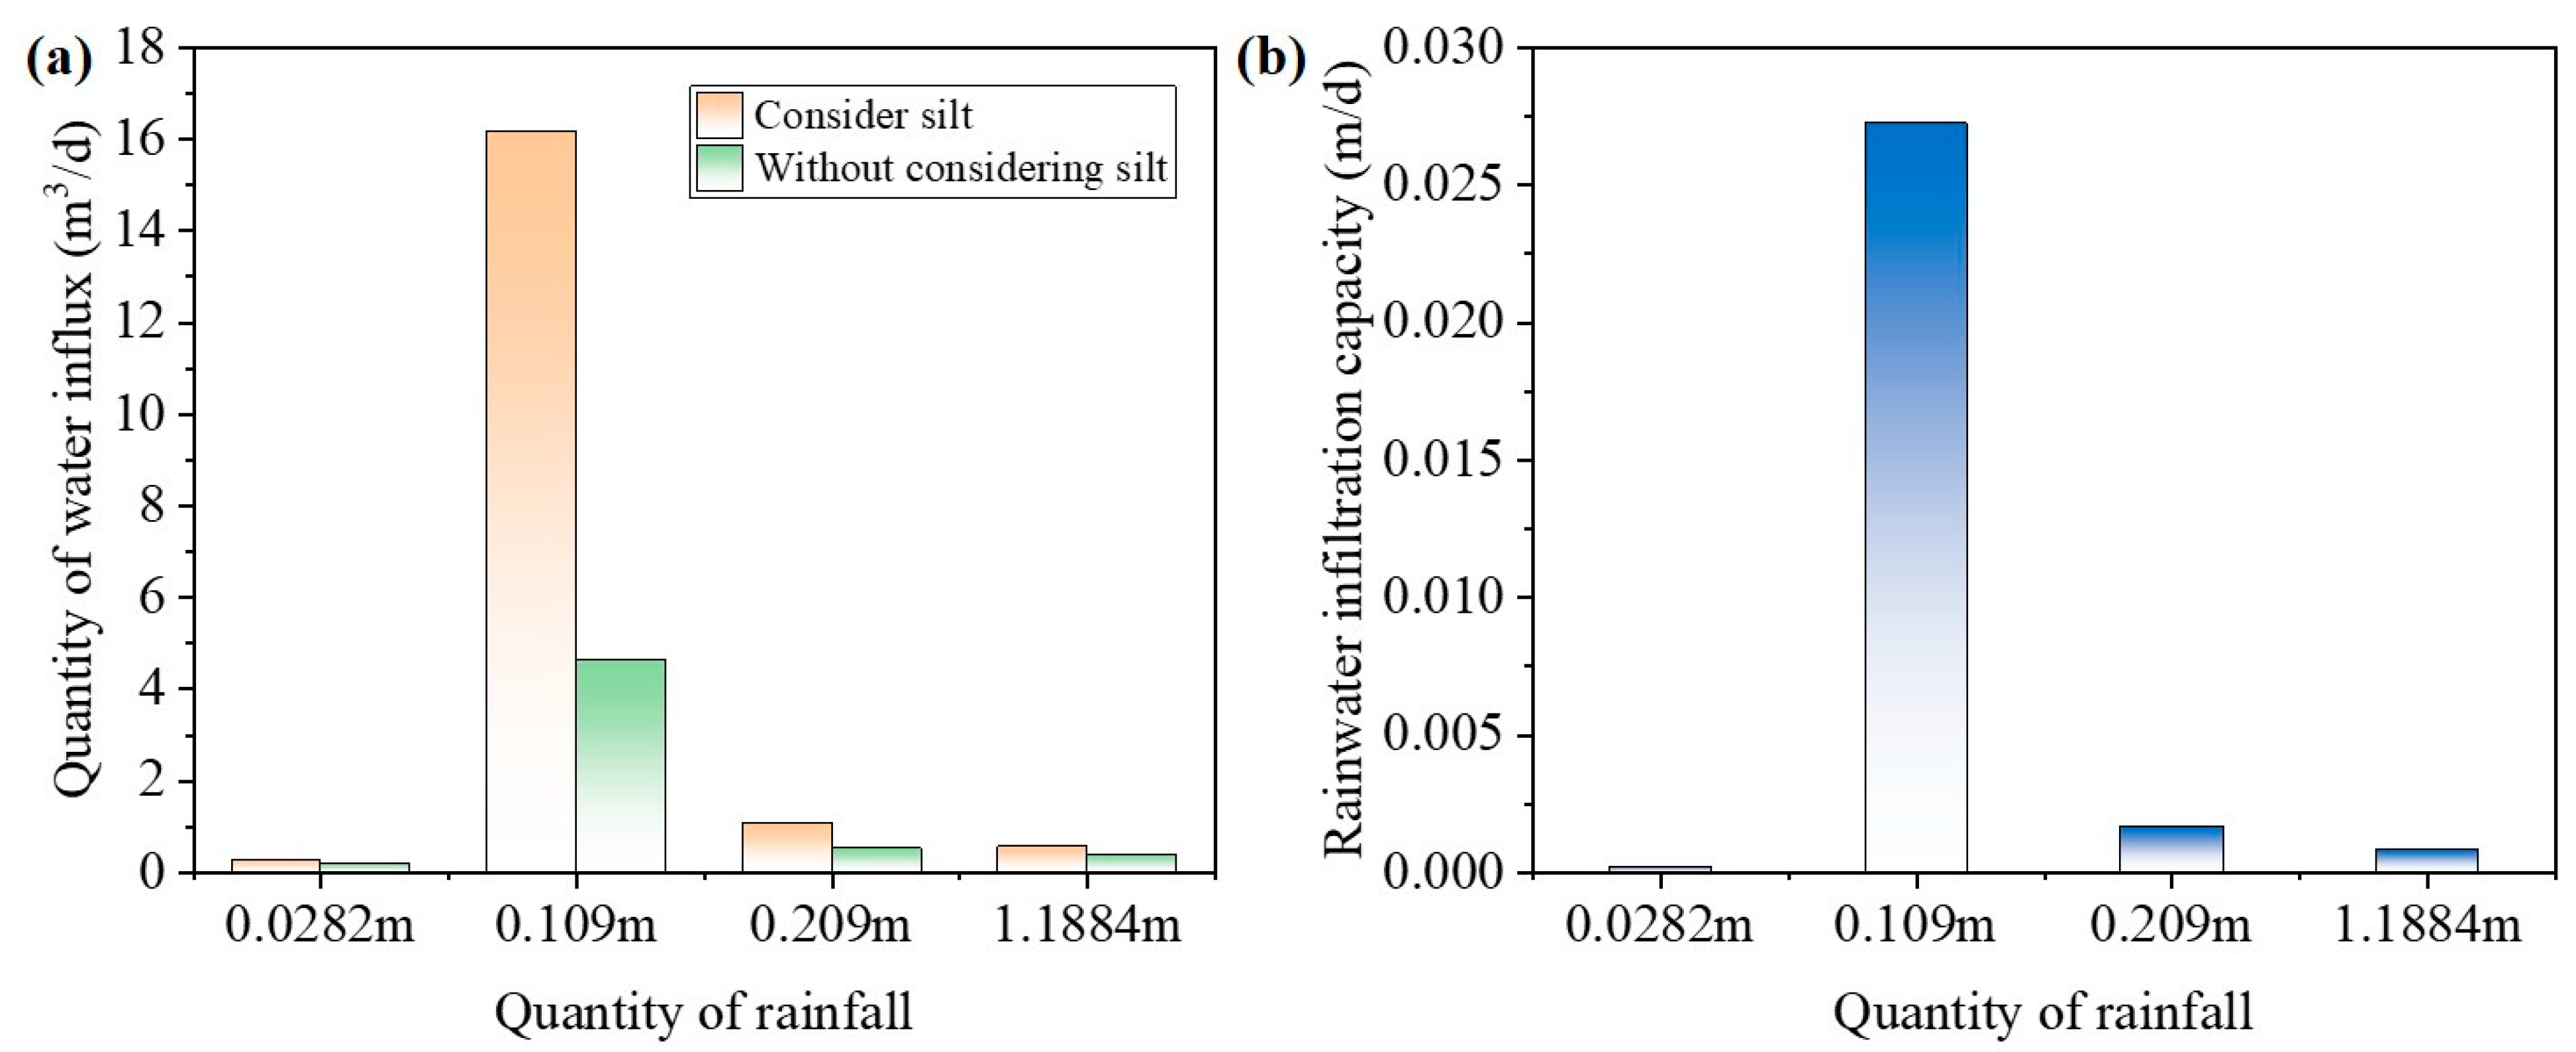
3.2. Effect of Quantity of Rainfall Recharge

The effect of rainfall on the tunnel surge is shown in Table 4. According to the meteorological conditions where the reservoir area is located, the average annual rainfall in the reservoir area is 1188.4 mm, with 200.5 mm in the spring rainy season (March–April), accounting for 17.5% of the year; 361.8 mm in the summer rainy season (May–June), accounting for 31.6% of the year; and 390.7 mm in the typhoon season (July–September), accounting for 34.1% of the year.
The magnitude of tunnel water used for four different precipitation levels—dry (December), abundant (August), average annual rainfall, and storm days (average daily peak)—is shown in Figure 4. The influence of rainfall on the size of the tunnel inflow is very obvious, with a clear positive correlation. Without considering the silt at the bottom of the reservoir, when the annual average rainfall is 1188.4 mm, the rainfall infiltration reaches 0.000814 m/d, and at this time, the daily influx of water per unit length of the tunnel reaches 0.564 m3/d. The rainfall during the dry period is 27.9% of the annual average rainfall, and the daily influx is 0.198 m3/d, which is 35.1% of the influx of water per unit length of the tunnel under the annual average rainfall. On the day of heavy rainfall and in the period of abundant water, the precipitation is 33.48 times and 2.07 times the average annual rainfall, respectively, and the daily influx of water per unit length of the tunnel is 16.166 m3/d and 1.078 m3/d, which are 28.66 times and 1.91 times the influx of water in the tunnel under the average annual rainfall, respectively. When considering the role of the silt layer, the tunnel inflow is reduced to a certain extent and the presence of the silt layer blocks the inflow of more water into the tunnel, but on the contrary, during the dry season, the presence of the silt layer increases the tunnel inflow.

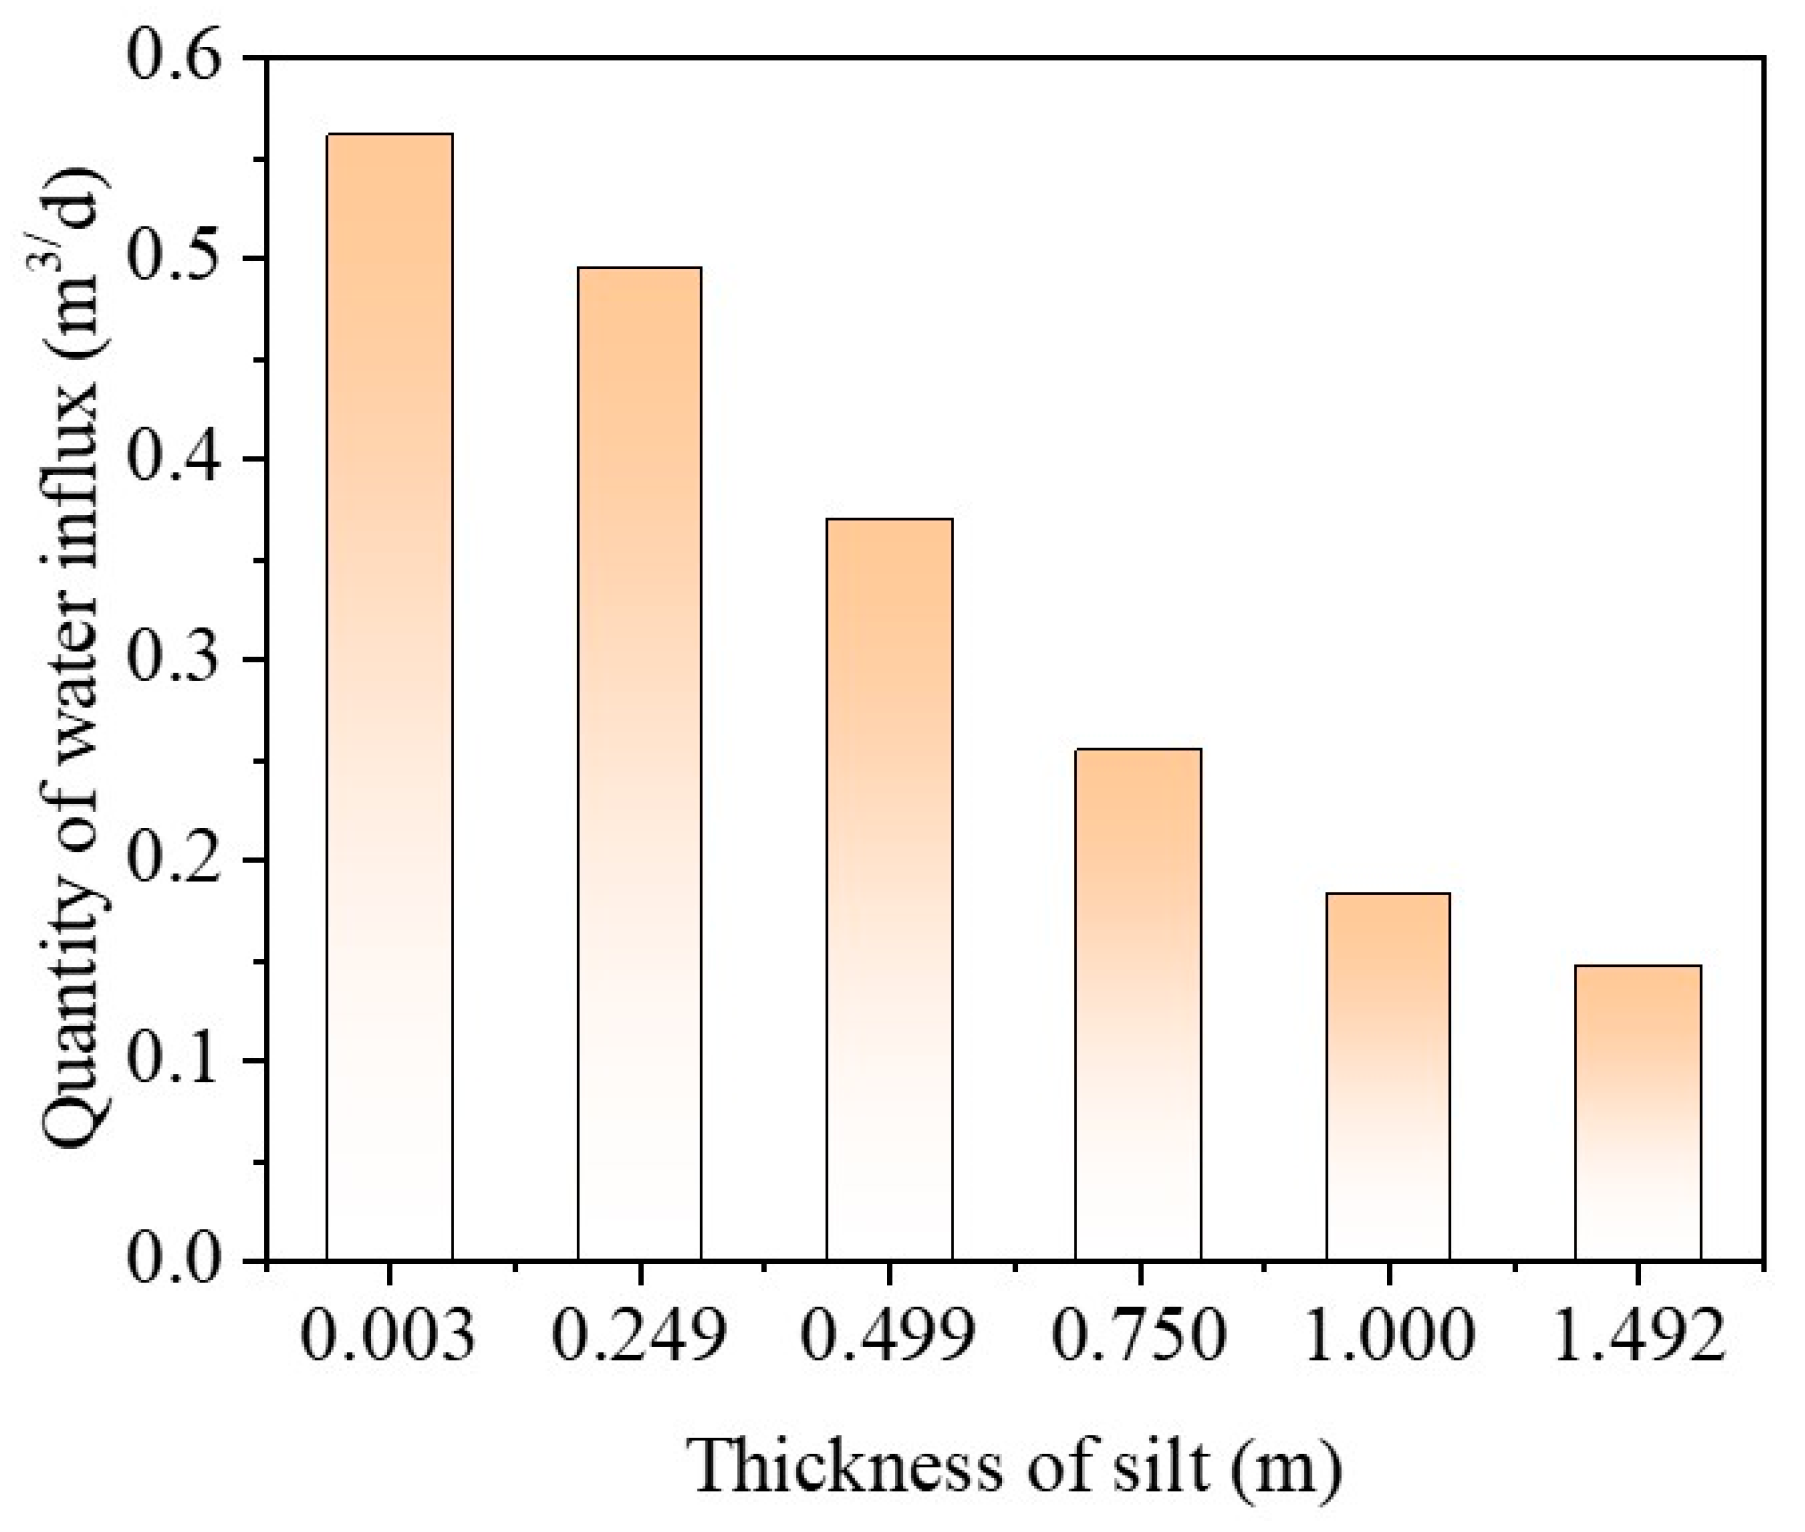
3.3. Effect of Thickness of Silt on the Bottom of the Lake

Figure 5 shows the variation in the quantity of water influx with various permeability coefficients of the rock. As the thickness of the silt layer increases, the daily water inflow per unit length of the tunnel decreases gradually. When the silt thickness is 0.25 m–1 m, the daily influx of water per unit length of the tunnel is almost negatively correlated with the thickness, with a reduction rate of 0.36 m3/d. After the thickness of the silt layer exceeds 1 m, the reduction in daily influx slows down with the increase in silt thickness and reaches a stable state after reaching 0.08 m3/d.

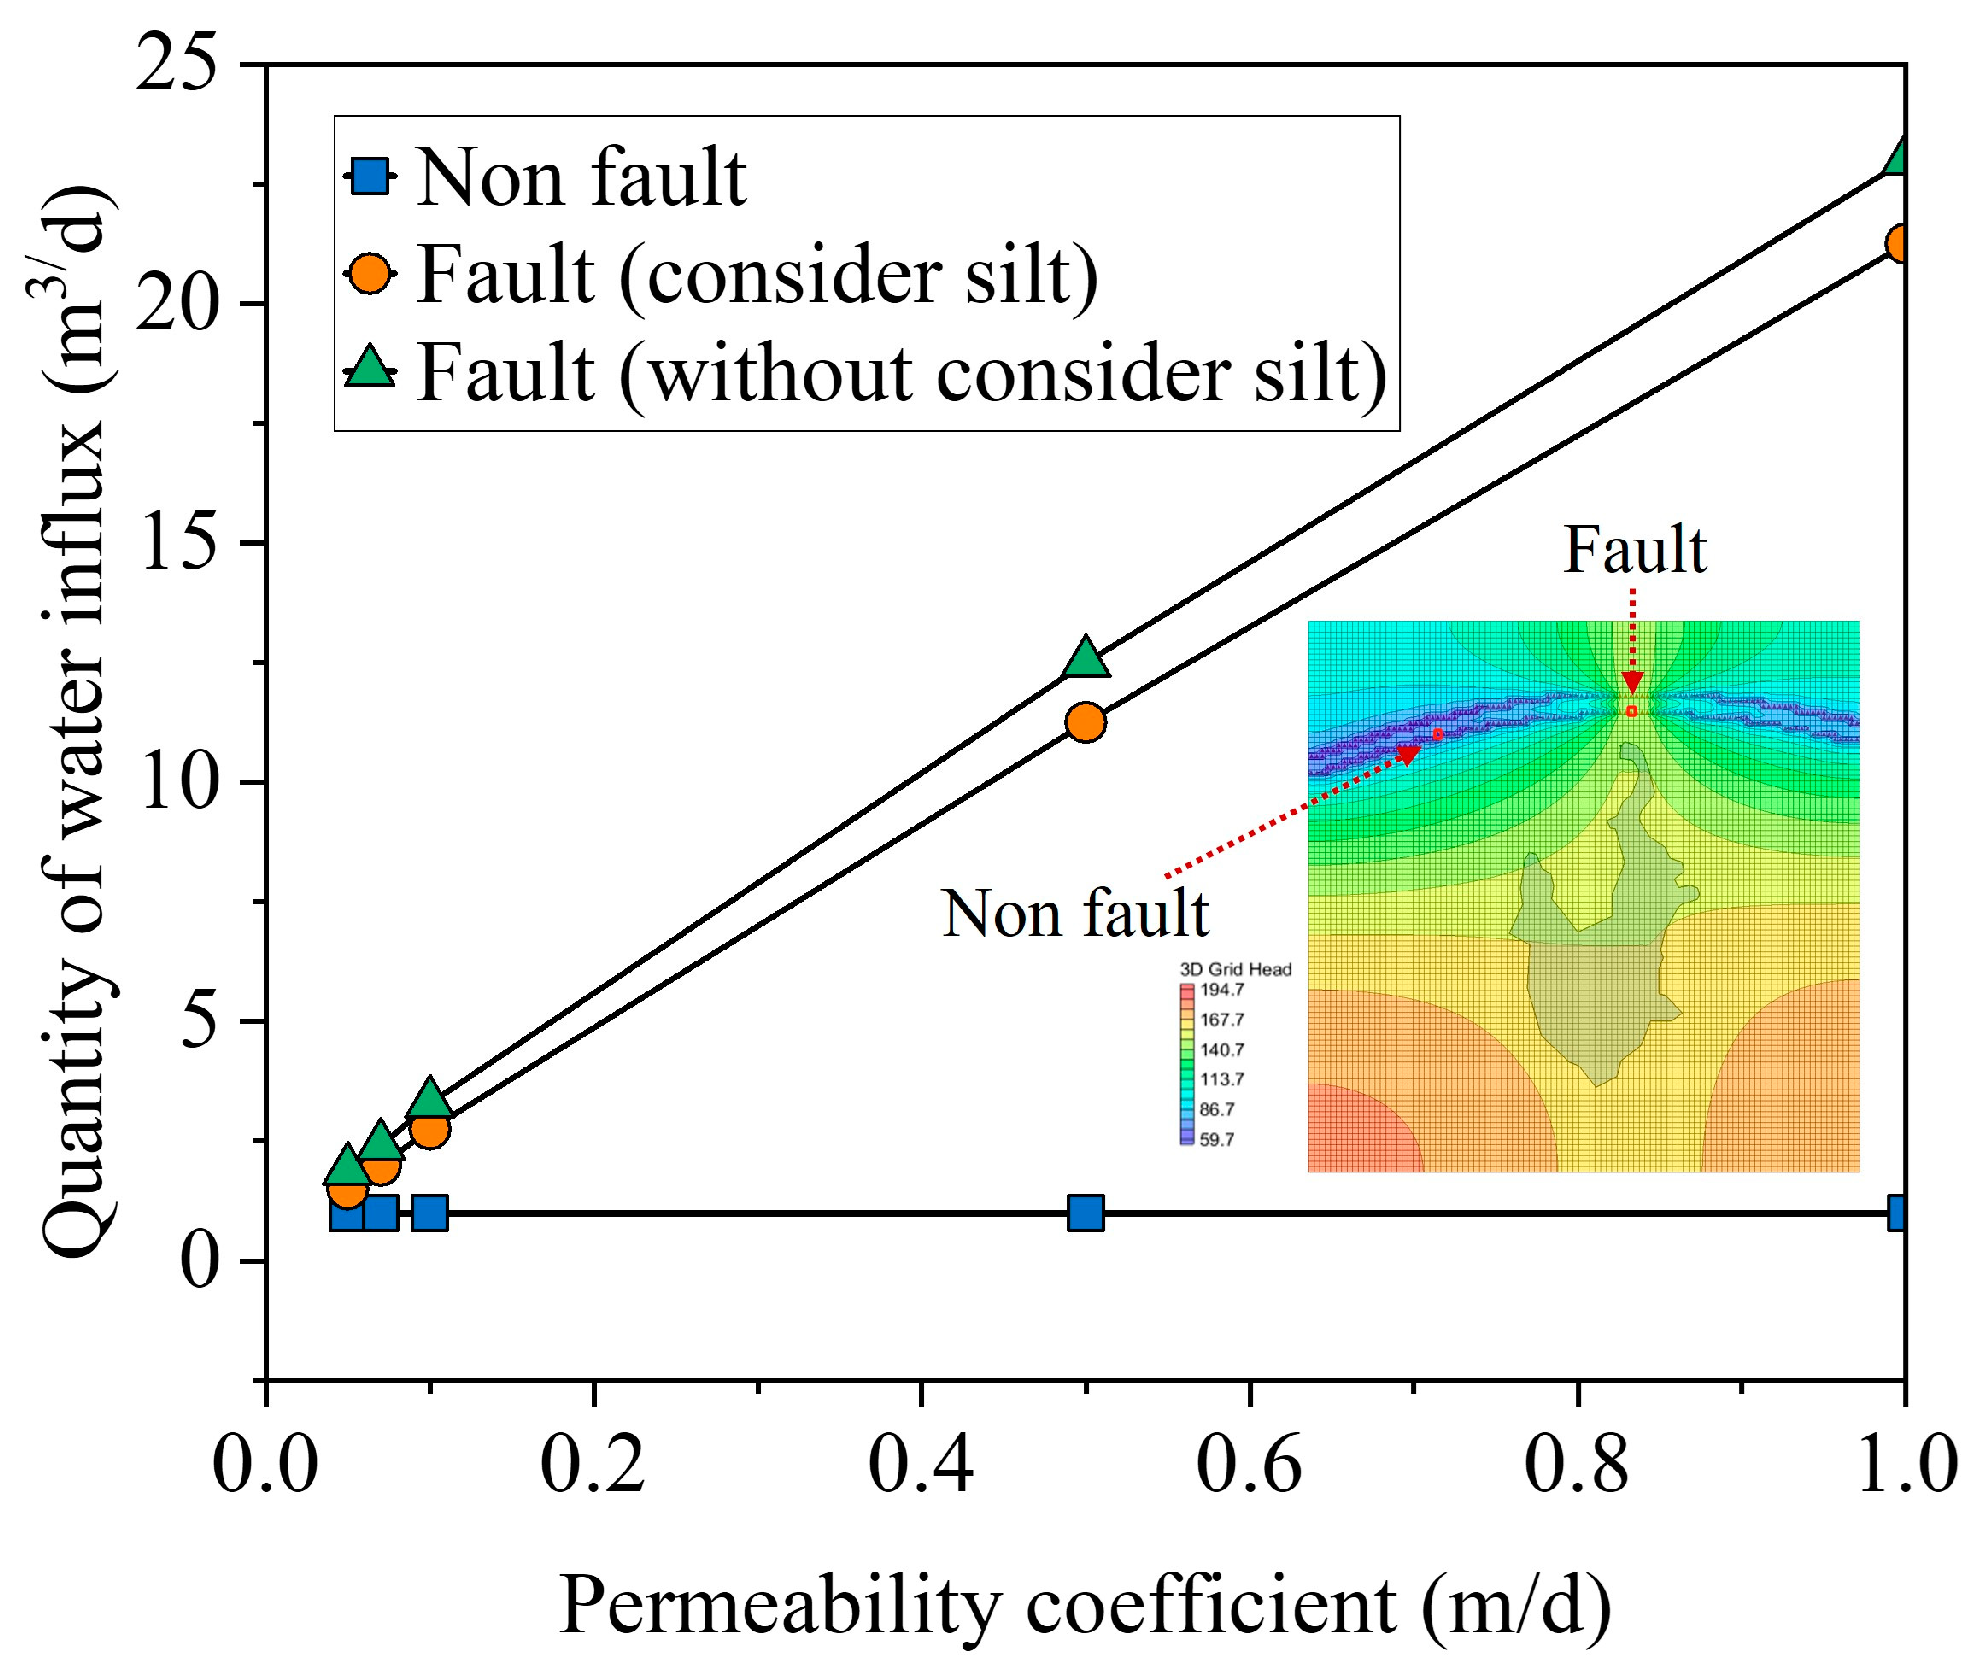
3.4. Effect of Permeability Coefficient of the Fault

Figure 6 shows the variation in the quantity of water influx with various permeability coefficients of the fault. It is assumed that the fault crossing the bottom of the reservoir is the most unfavorable for reservoir leakage. In the case of a fault, the monitoring points of the tunnel inflow are the nearest fault monitoring point to the reservoir and the non-fault monitoring point far away from the reservoir, as shown in Figure 6, and the permeability coefficient of the non-fault is kept constant at 0.013 m/d. The tunnel inflow of the non-fault section is almost constant, and it is less affected by the permeability coefficient. The tunnel water inflow at the fault increases linearly with the permeability coefficient of the fault. When the permeability coefficient of the fault is 0.5 m/d, the daily water inflow per unit length of the tunnel at the fault is 11.29 m3/d; when the permeability coefficient of the fault is 1 m/d, the daily water inflow per unit length of the tunnel at the fault is 22.4 m3/d. Therefore, the fault has a large influence on the tunnel water inflow, especially that the tunnel water inflow increases rapidly with the increase of the permeability coefficient of the fault.

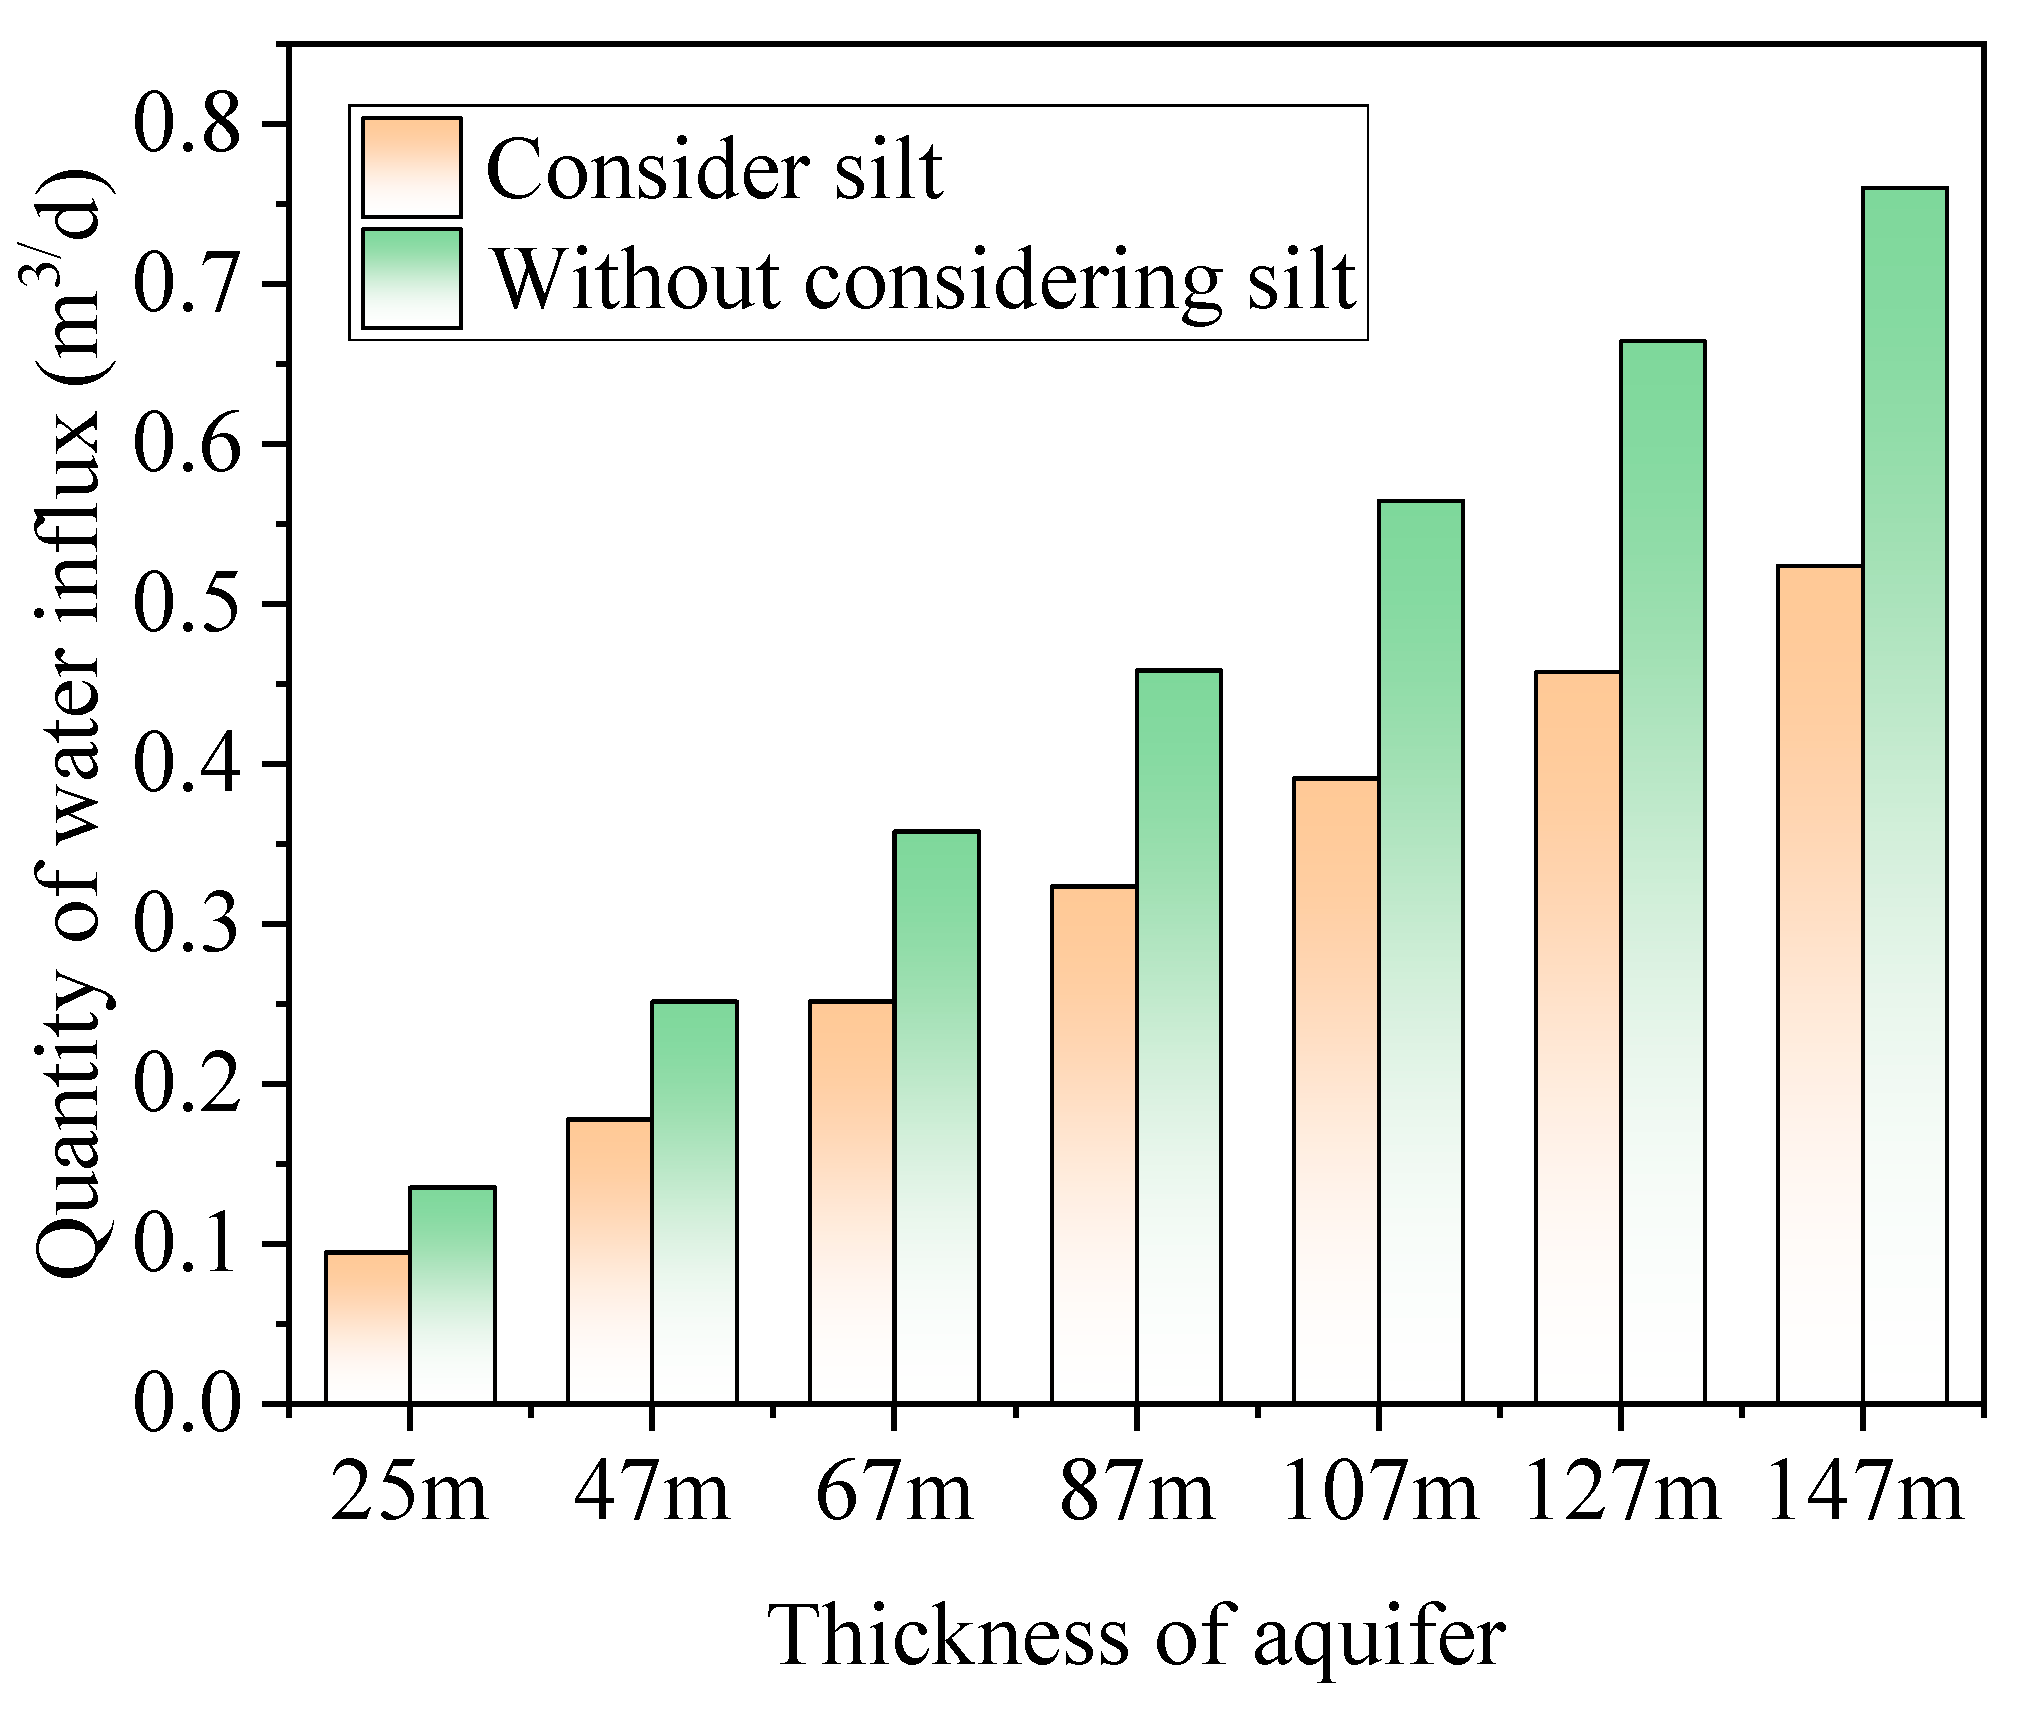
3.5. Effect of Thickness of Aquifer

The relationship between the tunnel influx and aquifer thickness is shown in Figure 7. When the thickness of the aquifer is 24.5 m, the water inflow per unit length of the tunnel is only 0.09 m3/d considering the silt at the bottom of the lake and 0.14 m3/d without considering the silt at the bottom of the lake; when the thickness of the aquifer is 147 m, the water inflow per unit length is only 0.52 m3/d considering the silt at the bottom of the lake; 0.77 m3/d without considering the silt at the bottom of the lake; and 0.77 m3/d with no consideration of the silt at the bottom of the lake. When the thickness of the aquifer is 147 m, the water inflow per unit length of the tunnel is 0.52 m3/d; without considering the silt at the bottom of the lake, the water inflow per unit length of the tunnel is 0.77 m3/d. To summarize, the water inflow per unit length of the tunnel is 0.63 m3/d when the thickness of the aquifer varies by 122.5 m. The water inflow per unit length of the tunnel is 0.14 m3/d when the silt at the bottom of the lake is not considered.

4. Discussion

4.1. Without Fault

Tianzhu Lake Reservoir was built in March 1956 to store water; it has been more than 60 years since then, and a thick silt layer has formed at the bottom of the reservoir, which plays a certain impermeable effect. As shown in Figure 8a,b, when the permeability coefficient of the rock body around the tunnel is 0.048 m/d, and the precipitation recharge is 0.000814 m/d, without considering the influence of the silt layer at the bottom of the lake on the reservoir seepage, the water level elevation of the reservoir drops by 12 m to reach a stable state, and at this time, the reservoir has been experienced complete seepage, and it is in the state of dryness. Considering the influence of the silt layer at the bottom of the lake on the leakage of the reservoir, the water level of the reservoir reaches a stable state after dropping by 6.8 m. The groundwater level near the tunnel decreases significantly, and it is distributed in the shape of a loophole along the axis of the tunnel. As shown in Figure 8c,d, when the permeability coefficient of the rock body around the tunnel is 0.038 m/d and the recharge is 0.000814 m/d, without considering the influence of the silt layer under the lake bottom on the leakage of the reservoir, the water level of the reservoir reaches a stable state after dropping by 11.7 m. At this time, the reservoir leaks almost completely, and the lake water is only 0.3 m. The head of the groundwater in the vicinity of the tunnel decreases obviously, and it distributes into a loophole shape along the axis of the tunnel. The groundwater head in the vicinity of the tunnel decreased significantly and became distributed in the shape of a hole along the tunnel axis. Considering the influence of the silt layer at the bottom of the lake on the leakage of the reservoir, the water level elevation of the reservoir reaches a stable state after decreasing by 0.6 m. The water level of the reservoir reaches a stable state after decreasing by 0.6 m. As shown in Figure 8e,f, when the permeability coefficient of the rock body around the tunnel is 0.03 m/d and the recharge is 0.000814 m/d, and when the influence of the silt layer at the bottom of the lake on the reservoir leakage is considered, the water level of the reservoir does not decrease when the final groundwater system reaches a steady state after the tunnel influx, and the reservoir is not affected by the influx of water from the tunnel. In the case of neglecting the influence of the silt layer at the bottom of the lake on the leakage of the reservoir, the water level elevation of the reservoir reaches a steady state after decreasing by 7.7 m. The groundwater in the vicinity of the tunnel decreases significantly and is distributed in the shape of a loophole along the axis of the tunnel. As shown in Figure 8g,h, when the permeability coefficient of the rock body around the tunnel is 0.013 m/d and the recharge is 0.000814 m/d, and the groundwater system reaches a steady state, the water level of the reservoir remains unchanged both in the case of considering the influence of the silt layer at the bottom of the lake and the case of disregarding the silt layer at the bottom of the lake, and the reservoir is not affected by the tunnel water influx.
Variations in the drop height of the lake with various permeability coefficients are shown in Figure 9. Figure 9 shows the relationship between the lake level drop and the permeability coefficient. When the silt layer at the bottom of the lake is not considered, the lake level drop caused by the permeability coefficient grows in an S-curve, and the lake level drop caused by the tunnel influx has the largest rate when the permeability coefficient is greater than 0.02 m/d. However, when the permeability coefficient is greater than 0.038 m/d, the water influx from the tunnel causes the lake water to leak completely. When the silt layer at the bottom of the lake is considered, the water level changes very little when the permeability coefficient is less than 0.03 m/d; when the permeability coefficient is 0.048 m/d, the water level decreases by 6.8 m. The water level decreases by 6.8 m when the permeability coefficient is 0.048 m/d.
In the case of considering the silt layer at the bottom of the lake, the relationship between the lake level decline and the daily water influx per unit length of the tunnel is shown in Figure 10, where the tunnel influx is the main cause of lake water leakage; when the influx of water is less than 0.4 m3/d, the lake water is not affected by the tunnel influx; when the influx is greater than 0.71 m3/d, the lake water by the tunnel influx of the impact of the tunnel is significant, and the water level with the increase in the influx of water rapidly declines. As shown in Figure 8, the increase in daily water inflow per unit length of the tunnel will cause the influence range of the tunnel inflow to increase; when the daily water inflow per unit length of the tunnel is greater than 0.83 m3/d, the whole reservoir is almost in the influence range of the tunnel inflow, so the water level of the reservoir decreases at a sudden increase in the rate. When the daily water influx per unit length of the tunnel is about 1 m3/d, the lake level drops by about 7 m. The water level of the reservoir is also reduced when the daily water influx per unit length of the tunnel is about 1 m3/d. Due to the presence of a silt layer at the bottom of the reservoir, reservoir seepage will be very slow. When the permeability coefficient of the rock mass is less than 0.03 m/d or the daily water influx per unit length of the tunnel is less than 0.71 m3/d, the water influx from the tunnel has almost no effect on the reservoir level.

4.2. With Fault

Table 5 shows that even if the fault extends through the bottom of the reservoir, creating a highly unfavorable condition for leakage, without considering the seepage control effect of the silt at the reservoir’s bottom, the tunnel water surge will not affect the reservoir in this unfavorable case. When the permeability coefficient of the strata at the non-fault location is smaller, even if the permeability coefficient of the fault is higher, no leakage occurs from the reservoir. Specifically, when the permeability coefficient of the stratum is 0.013 m/d, increasing the fault’s permeability coefficient from 0.048 m/d to 0.1 m/d does not result in leakage, and the reservoir’s water level remains unchanged. Without accounting for the silt layer’s thickness at the reservoir’s bottom, when the permeability coefficient of the stratum is 0.03 m/d and the fault’s permeability coefficient exceeds 0.048 m/d, a larger fault permeability coefficient results in a higher water influx rate into the tunnel, which in turn leads to a more significant decrease in the reservoir’s water level. When the permeability coefficient of the surrounding rock at the non-fault location is 0.03 m/d and the fault permeability coefficient is 0.048 m/d, the water level of the reservoir decreases by 2.86 m after the tunnel gushes and the groundwater system reaches a steady state. When the permeability coefficient of the surrounding rock at the fault increases to 0.06 m/d and 0.1 m/d, while maintaining the surrounding rock’s permeability at the non-fault location unchanged, the reservoir’s water level decreases by 1.25 times and 2.08 times the original water level, respectively. At steady state, the water level decreases by 4.08 m and 7.44 m, which are 1.43 times and 2.6 times the original value, respectively, after the tunnel water influx.
As shown in Table 6, in this case, when the permeability coefficient of the stratum at the non-fault is 0.03 m/d, the permeability coefficient of the fault is 0.1 m/d, which only causes the water level of the reservoir to drop by 0.01 m. It can be seen that the silt at the bottom of the lake plays a key role in the prevention of seepage in the reservoir. When the permeability coefficient of the stratum at the non-fault is less than 0.03 m/d and the permeability coefficient of the fault is not greater than 0.1 m/d, the reservoir level is not affected by the tunnel water surge in the case of fault connection. Therefore, even if the fault runs through the bottom of the lake to form a hydraulic connection channel with the tunnel, when the permeability coefficient of the strata and the fault is relatively small, the hydraulic connection between the tunnel and the reservoir is very small. Tunnel water influx is first caused by the surrounding strata water loss, when the surrounding strata experience the loss of water to a certain extent, before affecting the reservoir water body.

5. Conclusions

In this paper, a three-dimensional grid model is established to study the hydraulic connection between the tunnel and reservoir in the section of the tunnel passing beneath the reservoir. The study analyzes the relationship between tunnel water influx and factors such as the permeability coefficient of the stratum, rainfall recharge, fault permeability, aquifer thickness, and the silt at the bottom of the reservoir. Additionally, the paper discusses the quantitative relationship between tunnel water influx and the water level of the reservoir. The following conclusions are drawn:
(1)
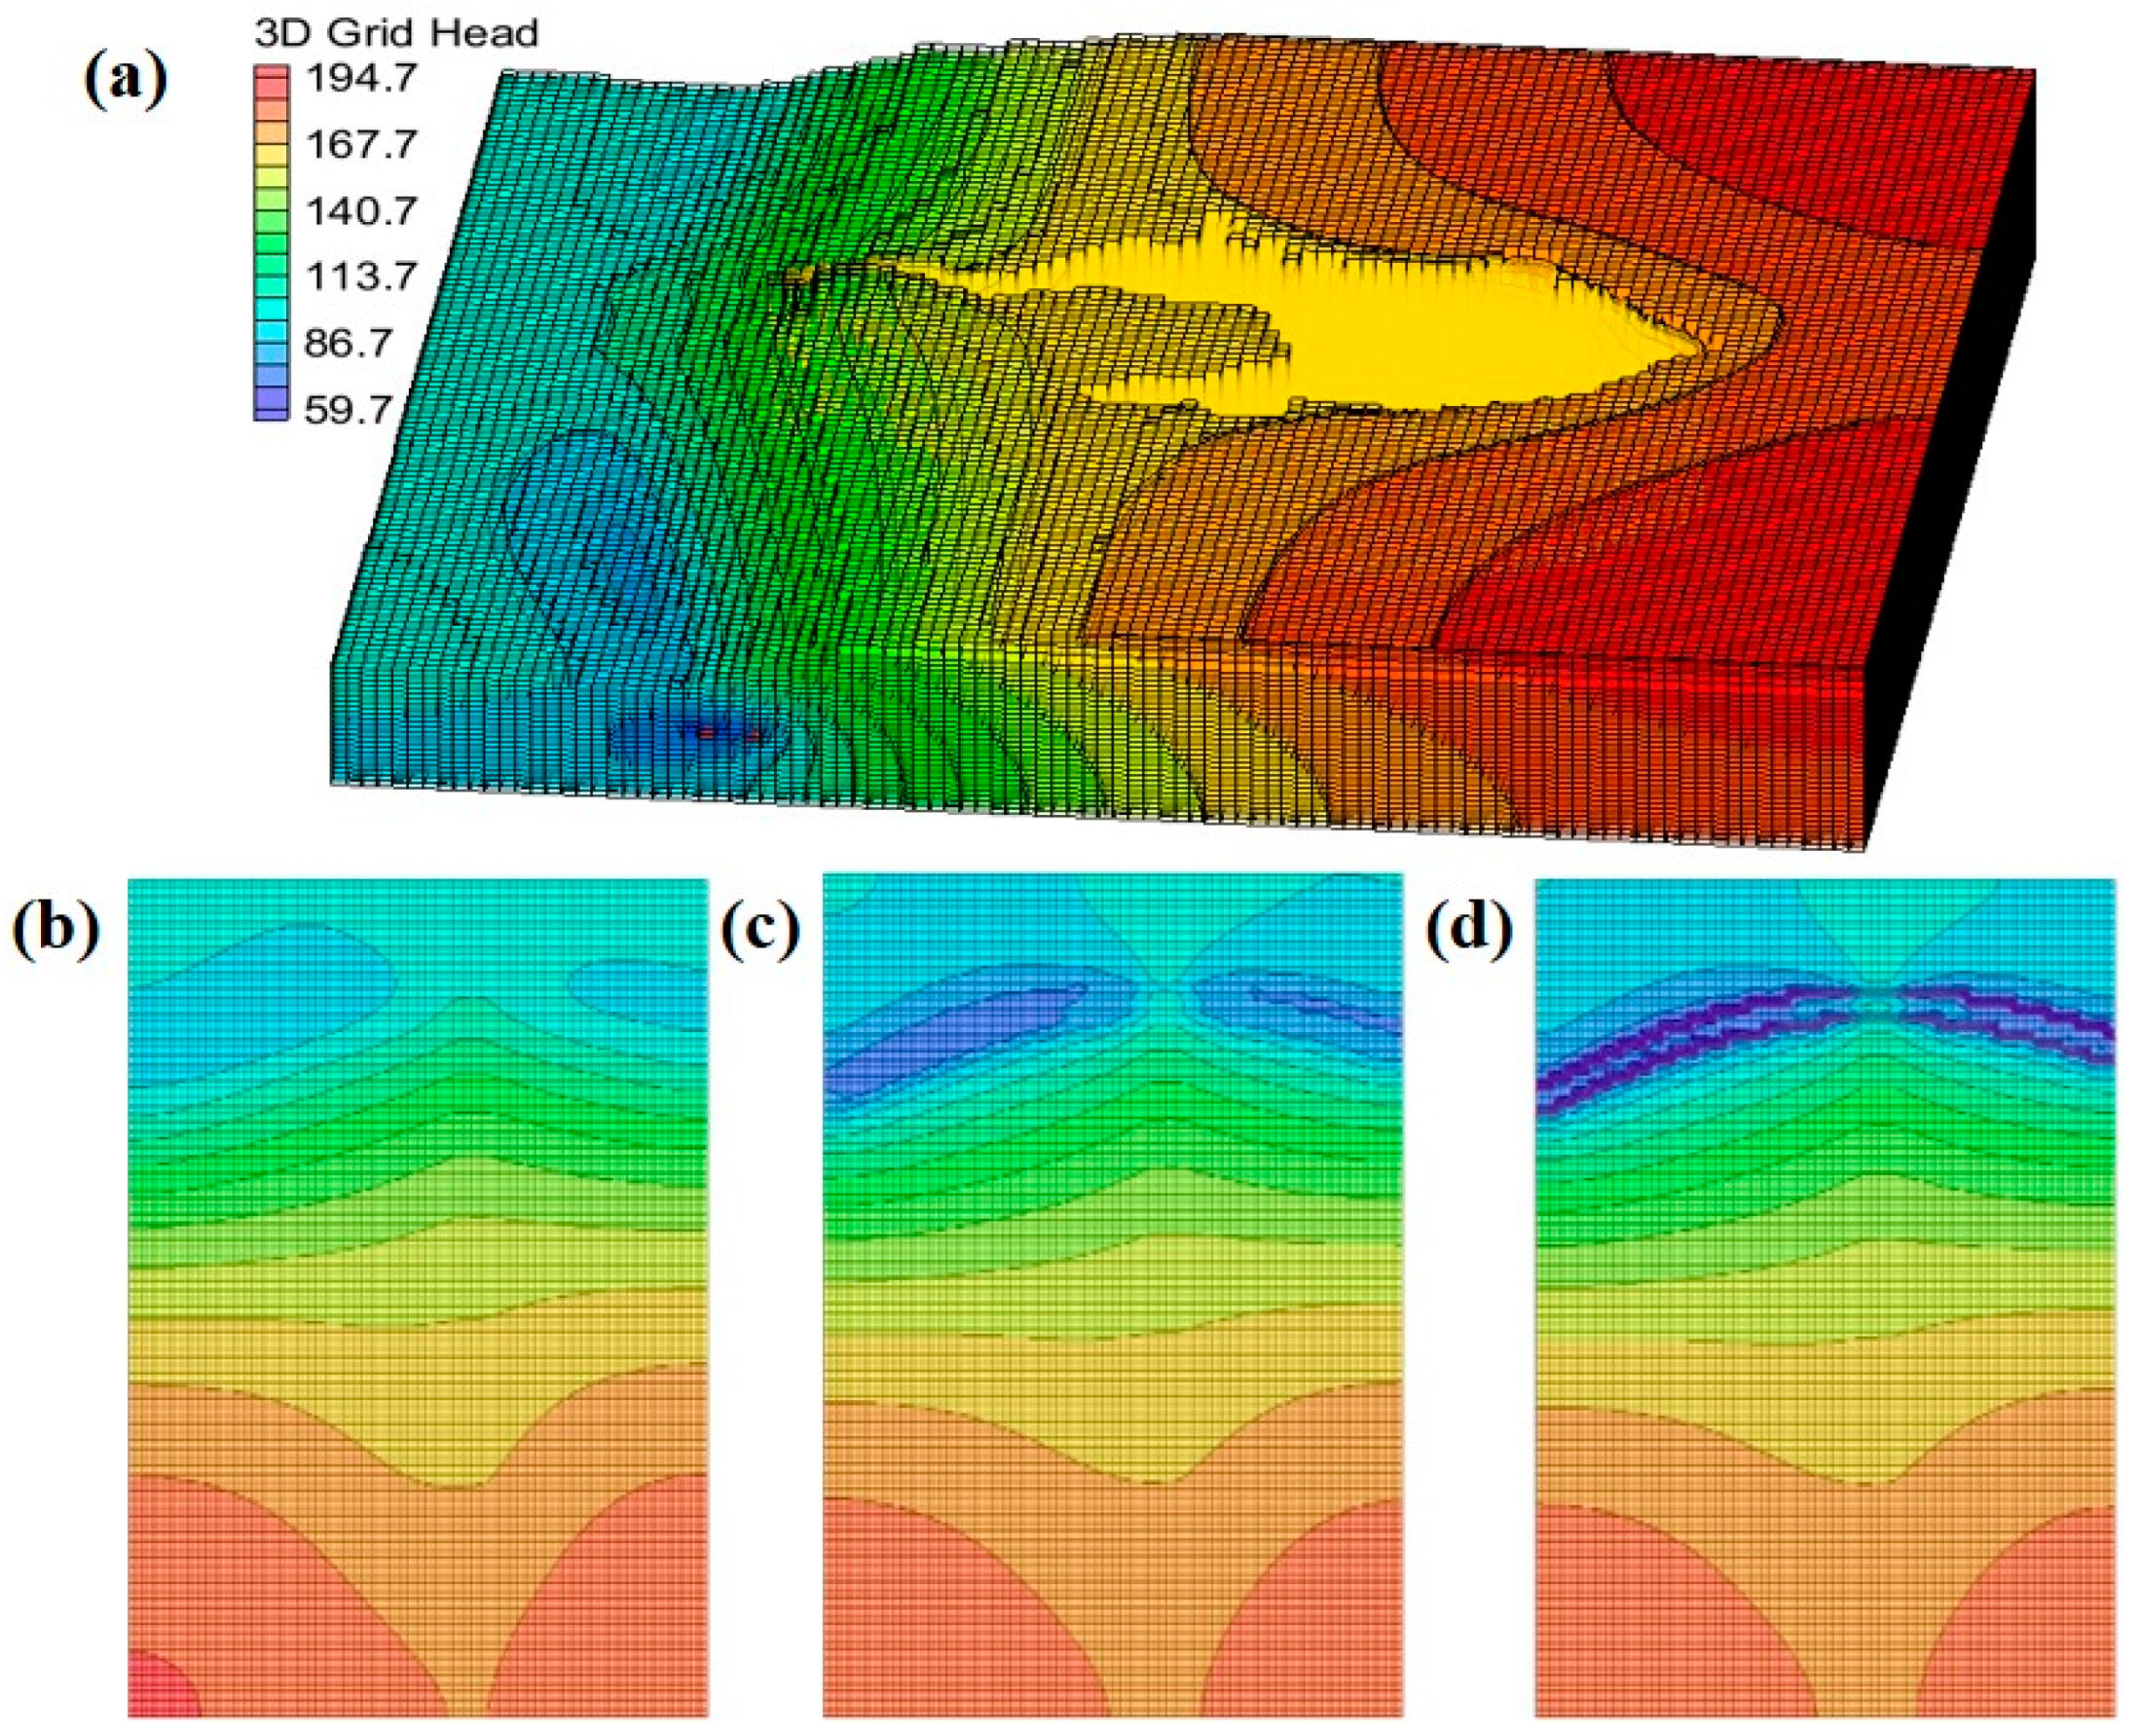
All results primarily depend on the characteristics of the fault defined for the study. The presence of faults creates an effective hydraulic pathway between the tunnel and the reservoir, thereby enhancing the hydraulic connection between them. The groundwater head resulting from the tunnel surge is distributed along the center of the tunnel axis in the form of a ditch, with the head gradually decreasing in a band along the reservoir’s edge towards the tunnel axis. The existence of faults alters the seepage field of the water, leading to a higher head at the fault locations compared to non-faulted areas.
(2)
An increase in the permeability coefficient of the fault leads to a corresponding increase in the water inflow into the tunnel at the fault. When the water inflow from the tunnel causes a decrease in the reservoir’s water level, the water level of the reservoir decreases as the permeability coefficient of the stratum increases. The silt at the bottom of the reservoir effectively mitigates the water level drop caused by the water influx from the tunnel, significantly weakening the hydraulic connection between the reservoir and the tunnel.
(3)
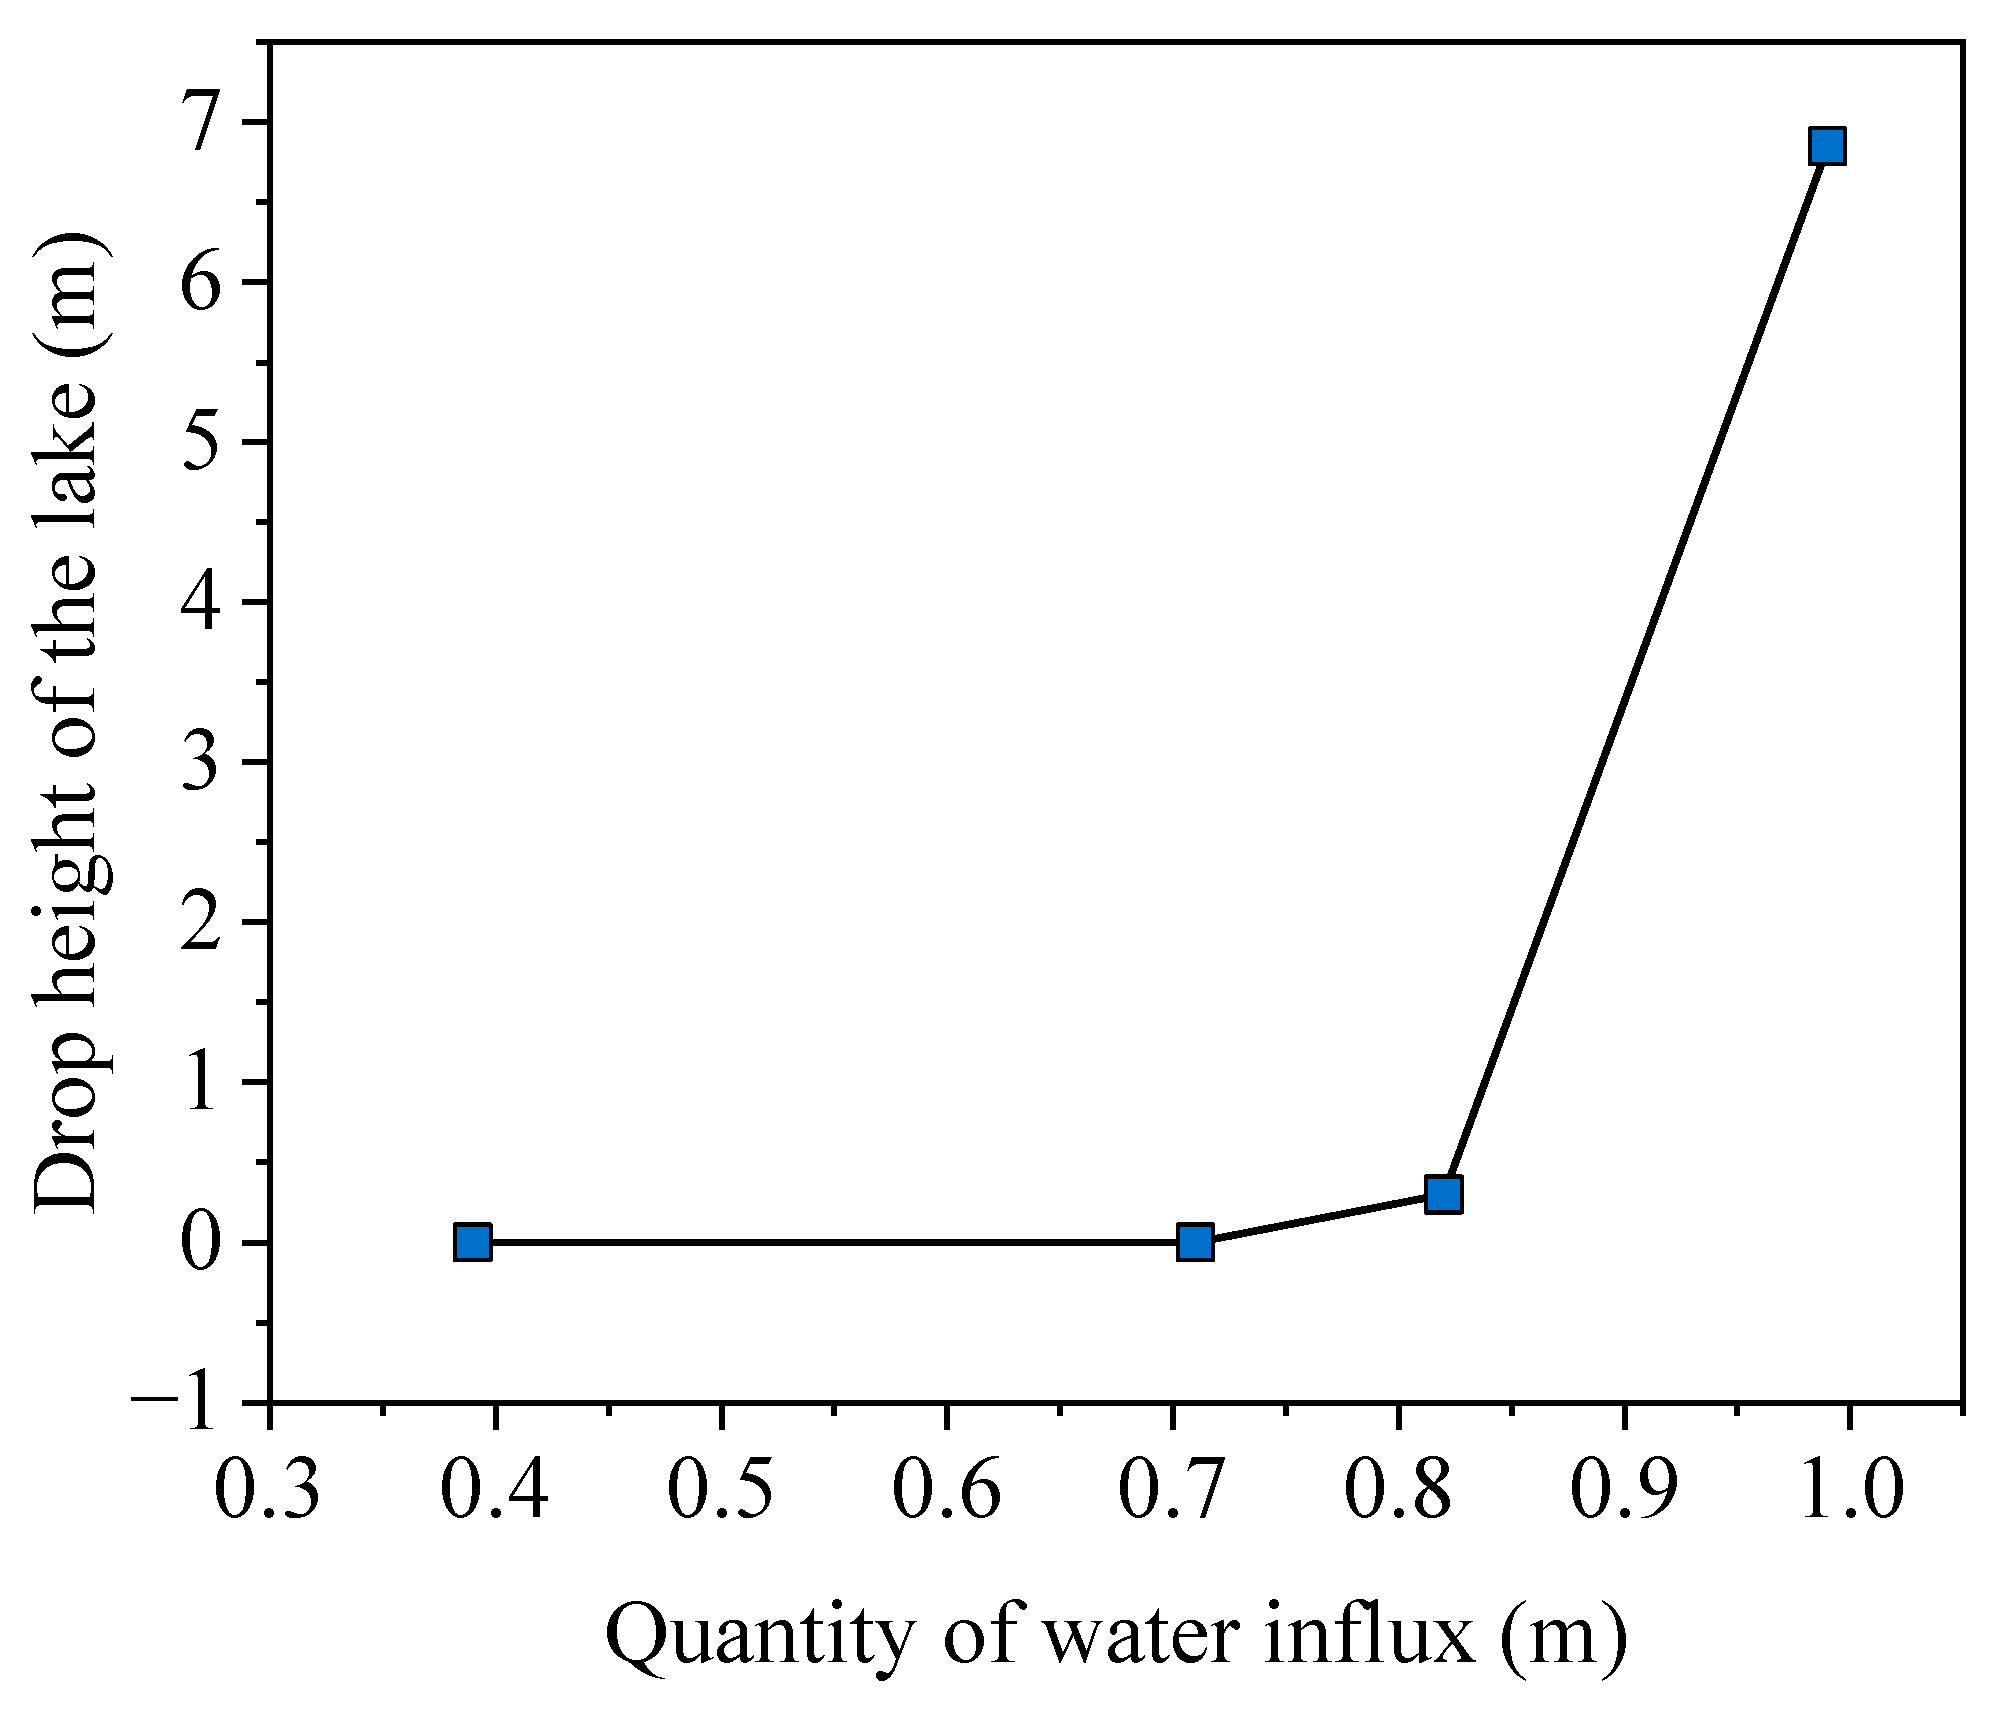
Considering the silt layer at the bottom of the reservoir, when the daily water influx per unit length of the tunnel is less than 0.4 m3/d, there is no noticeable effect on the reservoir’s water level. When the daily water influx exceeds 0.7 m3/d, the water level decreases rapidly as the influx increases. When the daily water influx approaches 1 m3/d, the reservoir water level decreases by approximately 7 m.
(4)
The presence of a silt layer at the bottom of the reservoir reduces the impact of tunnel water influx on the reservoir. Even if the fault extends through the bottom of the reservoir and forms a hydraulic connection with the tunnel, when the permeability coefficients of both the stratum and the fault are relatively low, the hydraulic connection between the tunnel and the reservoir remains minimal.
This study presents a predictive method for assessing the decline in reservoir water levels caused by tunnel surges. The research findings will help prevent the reservoir’s water level from decreasing due to water surges and seepage from the tunnels. In the future, researchers can monitor tunnel leakage and water influx under various geological and groundwater conditions and establish a database to track tunnel-related disasters. Additionally, experimental models can be developed to test tunnel leakage and surge data in extreme environments. These efforts will aid in mitigating water level declines in reservoirs caused by water surges and tunnel seepage.

Author Contributions

Conceptualization, L.Z. and G.Z.; Methodology, T.C. and Z.Y. (Zhou Ya); Software, T.C.; Validation, L.Z. and G.Z.; Formal analysis, Z.Y. (Zhou Ya) and Z.Y. (Zihao Yu); Investigation, L.Z. and Z.Y. (Zihao Yu); Resources, Z.Y. (Zhou Ya) and G.Z.; Data curation, Z.Y. (Zihao Yu); Writing—original draft, T.C. and Z.Y. (Zhou Ya); Writing—review & editing, T.C., L.Z. and G.Z.; Visualization, T.C.; Supervision, L.Z. and G.Z. All authors have read and agreed to the published version of the manuscript.

Funding

This research received no external funding.

Data Availability Statement

Data are contained within the article.

Conflicts of Interest

Authors Tao Chen and Liyuan Zhao were employed by the company CCCC Second Harbour Engineering Company Ltd. Author Zhou Ya was employed by the China State Construction Engineering Corporation Ltd. The remaining authors declare that the research was conducted in the absence of any commercial or financial relationships that could be construed as a potential conflict of interest.

References

  1. Zhao, Y.; Li, P. A Statistical analysis of China’s traffic tunnel development data. Engineering 2018, 4, 3–5. [Google Scholar] [CrossRef]
  2. Jiang, S. Quality and technical countermeasures in highway tunnel engineering. Mod. Tunn. Technol. 2017, 54, 1–12. [Google Scholar]
  3. Wang, X.; Zhao, Y. Comment on construction of railway tunnels in China by statistical data. Mod. Tunn. Technol. 2006, 43, 7–17. [Google Scholar]
  4. Shi, Z.; Xu, J.; Xie, X.; Zeng, H.; Xu, W.; Niu, G.; Xiao, Z. Disaster mechanism analysis for segments floating of large-diameter shield tunnel construction in the water-rich strata: A case study. Eng. Fail. Anal. 2024, 157, 107953. [Google Scholar] [CrossRef]
  5. Song, Z.; Jing, P.; Nie, L.; Mei, Z.; Jia, S.; Li, Z. Comprehensive identification and assessment of clastic rock and water-bearing breccia for water and mud inrush in tunnel: A case study. Tunn. Undergr. Space Technol. 2025, 155, 106156. [Google Scholar] [CrossRef]
  6. Gu, Y.; Wang, C.; Liu, Y.; Zhou, R. An ontology-based multi-hazard coupling accidents simulation and deduction system for underground utility tunnel—A case study of earthquake-induced disaster chain. Reliab. Eng. Syst. Saf. 2025, 253, 110559. [Google Scholar]
  7. Yu, Z.; Zhang, G.; Li, C.; Cao, Z. Numerical investigation on work performance of the anti-freezing drainage system of tunnel utilizing TPCT. Appl. Therm. Eng. 2024, 253, 123849. [Google Scholar] [CrossRef]
  8. Zhao, C.; Mahmoudi, E.; Luo, M.; Jiang, M.; Lin, P. Unfavorable geology recognition in front of shallow tunnel face using machine learning. Comput. Geotech. 2023, 157, 105313. [Google Scholar]
  9. Qin, Y.; Shang, C.; Li, X.; Lai, J.; Shi, X.; Liu, T. Failure mechanism and countermeasures of rainfall-induced collapsed shallow loess tunnels under bad terrain: A case study. Eng. Fail. Anal. 2023, 152, 107477. [Google Scholar] [CrossRef]
  10. Zhang, D.; Fang, Q.; Lou, H. Grouting techniques for the unfavorable geological conditions of Xiang’an subsea tunnel in China. J. Rock Mech. Geotech. Eng. 2014, 6, 438–446. [Google Scholar]
  11. Fu, H.; Hu, K.; Wu, Y.; Yu, Y.; Liu, W. Seepage field and drainage system in the connection part of underwater tunnel based on conformal mapping method. Tunn. Undergr. Space Technol. 2024, 154, 106146. [Google Scholar]
  12. Wang, C.; Zhang, D.; Tan, D.; Ye, J.; Wang, X.; Ren, F.; Li, Q. Investigation on seepage evolution property of surrounding rock under the tunneling and water surge. Tunn. Undergr. Space Technol. 2024, 153, 105970. [Google Scholar] [CrossRef]
  13. Terzaghi, K.T. Theoretical Soil Mechanics; Wiley: Hoboken, NJ, USA, 1943. [Google Scholar]
  14. Biot Maurice, A. General Theory of Three-Dimensional Consolidation. J. Appl. Phys. 1941, 12, 155–164. [Google Scholar]
  15. Witherspoon, P.A.; Tsang, Y.W.; Long, J.C.; Noorishad, J. New approaches to problems of fluid flow in fractured-rock masses. In Proceedings of the 22nd U.S. Symposium on Rock Mechanics (USRMS), Cambridge, MA, USA, 29 June–2 July 1981. [Google Scholar]
  16. Zhuo, J. Interfacial Element Method for Mechanical Problems in Discontinuous Media; Science Press: Beijing, China, 2000. [Google Scholar]
  17. Huyakorn, P.S.; Lester, B.H.; Faust, C.R. Finite element techniques for modeling groundwater flow in fractured aquifers. Water Resour. Res. 1983, 19, 1019–1035. [Google Scholar]
  18. Huang, M.; Ling, C.; Deng, F.; Li, H.; Fu, Z. Simulation of the self-potential response during the water inrush of tunnel beneath surface water: A case study of Shijingshan tunnel in Zhuhai. Prog. Geophys. 2024, 39, 1275–1284. [Google Scholar]
  19. Chen, D. Analysis and integrated mitigation of water and mud inrushing hazard in Anshi Tunnel excavation. Soil Eng. Found. 2021, 35, 323–328. [Google Scholar]
  20. Yang, B. Treatment Techniques for Karst Disaster of Maluqing Tunnel on Yichang-Wanzhou Railway. Chin. J. Undergr. Space Eng. 2011, 7, 581–586. [Google Scholar]
  21. Li, Z.; Xiao, J.; Wan, J.; Cheng, J.; Feng, H.; Zhan, H.; Yuan, S.; Huang, K. A dynamic modeling approach to predict water inflow during tunnel excavation in relatively uniform rock masses. Tunn. Undergr. Space Technol. 2024, 146, 105668. [Google Scholar] [CrossRef]
  22. Mahmoodzadeh, A.; Ghafourian, H.; Mohammed, A.H.; Rezaei, N.; Ibrahim, H.H.; Rashidi, S. Predicting tunnel water inflow using a machine learning-based solution to improve tunnel construction safety. Transp. Geotech. 2023, 40, 100978. [Google Scholar] [CrossRef]
  23. Mahmoodzadeh, A.; Mohammadi, M.; Noori KM, G.; Khishe, M.; Ibrahim, H.H.; Ali HF, H.; Abdulhamid, S.N. Presenting the best prediction model of water inflow into drill and blast tunnels among several machine learning techniques. Autom. Constr. 2021, 127, 103719. [Google Scholar]
  24. Liu, H.B.; Zhou, J.Q.; Li, C.; Tan, J.; Hou, D. Semi-empirical models for predicting stable water inflow and influence radius of a tunnel considering non-Darcian effect. J. Hydrol. 2023, 621, 129574. [Google Scholar]
  25. Shi, S.; Guo, W.; Li, S.; Xie, X.; Li, X.; Zhao, R.; Xue Lu, J. Prediction of tunnel water inflow based on stochastic deterministic three-dimensional fracture network. Tunn. Undergr. Space Technol. 2023, 135, 104997. [Google Scholar]
  26. Dall’Alba, V.; Neven, A.; de Rooij, R.; Filipponi, M.; Renard, P. Probabilistic estimation of tunnel inflow from a karstic conduit network. Eng. Geol. 2023, 312, 106950. [Google Scholar]
  27. Li, L.; Chen, H.; Li, J.; Sun, D.A. A semi-analytical solution to steady-state groundwater inflow into a circular tunnel considering anisotropic permeability. Tunn. Undergr. Space Technol. 2021, 116, 104115. [Google Scholar]
Figure 1. MODFLOW grid model.
Water 17 01068 g001
Figure 2. Cloud map of groundwater head distribution due to tunnel surge: (a) 3D waterhead distribution; (b) 50 m below the surface; (c) above the tunnel; (d) deeply buried area of the tunnel.
Water 17 01068 g002
Figure 3. Variation in the quantity of water influx with various permeability coefficients of the rock.
Water 17 01068 g003
Figure 4. Variation in the (a) quantity of water influx and (b) rainwater infiltration capacity with various quantities of rainfall.
Water 17 01068 g004
Figure 5. Variation in the quantity of water influx with various silt thicknesses.
Water 17 01068 g005
Figure 6. Variation in the quantity of water influx with various permeability coefficients of the fault.
Water 17 01068 g006
Figure 7. Variation in the quantity of water influx with various aquifer thicknesses.
Water 17 01068 g007
Figure 8. Cloud map of head distribution due to tunnel water influx: (a) permeability coefficients of 0.048 m/d, considering silt; (b) permeability coefficients of 0.048 m/d, without considering silt; (c) permeability coefficients of 0.038 m/d, considering silt; (d) permeability coefficients of 0.038 m/d, without considering silt; (e) permeability coefficients of 0.03 m/d, considering silt; (f) permeability coefficients of 0.03 m/d, without considering silt; (g) permeability coefficients of 0.013 m/d, considering silt; (h) permeability coefficients of 0.013 m/d, without considering silt.
Water 17 01068 g008
Figure 9. Variation in the drop height of the lake with various permeability coefficients.
Water 17 01068 g009
Figure 10. Variation in the drop height of the lake with various quantities of water influx.
Water 17 01068 g010
Table 1. Calculation parameters in the numerical model.
ParameterUnitValue
Waterhead height of the water tablem164
Maximum waterhead height of the reservoirm164
Average annual rainfallmm1188.4
Surface rainfall infiltration factor10.25
Rainfall rechargemm/d0.814
Permeability coefficient of weathered granitem/d0.048
Initial storage levelm151–164
Permeability coefficient of the silt layermm/d0.25
Thickness of silt layermAbout 0.5
Table 2. Comparison of simulated and tested values.
ParameterUnitValue
Theoretical valuem3/d0.72
Not considering siltm3/d0.88
Considering siltm3/d0.69
Table 3. Factors in parametric research.
FactorsUnitValue
Permeability coefficient of surrounding rockm/d0.005, 0.013, 0.02, 0.03, 0.038, 0.048
Quantity of rainfall rechargemm0.0282, 0.109, 0.209, 1.1884
Thickness of silt on the bottom of the lakem0.003, 0.249, 0.499, 0.75, 1, 1.492
Permeability coefficient of the faultm/d0.05, 0.07, 0.1, 0.5, 1
Thickness of aquiferm25, 47, 67, 87, 107, 127, 147
Table 4. The magnitude of tunnel water inflow at different rainfall levels.
Rainfall PeriodQuantity of Rainfall Recharge (m)Rainwater Infiltration Capacity (m/d)Daily Water Inflow (m3/d)
Consider SiltWithout Considering Silt
Dry season (Dec.)0.02820.0002270.2860.198
Maximum value0.1090.0272516.1664.652
Wet season (Aug.)0.2090.0016851.0780.53
Annual average1.18840.0008140.5640.392
Table 5. Relationship between faults and water levels without considering silt effects.
Permeability Coefficients of Unfaulted Strata (m/d)Permeability Coefficients of Faulted Strata (m/d)Drop Height of the Lake (m)
0.0130.0480
0.060
0.10
0.030.0482.86
0.064.08
0.17.44
Table 6. Relationship between faults and water levels considering silt effects.
Faulted permeability coefficient (m/d)0.0480.060.1
Drop height of the lake (m)000.01
Disclaimer/Publisher’s Note: The statements, opinions and data contained in all publications are solely those of the individual author(s) and contributor(s) and not of MDPI and/or the editor(s). MDPI and/or the editor(s) disclaim responsibility for any injury to people or property resulting from any ideas, methods, instructions or products referred to in the content.

