Abstract
In recent years, heavy rainfall-induced flood incidents have occurred frequently in subway stations worldwide. Flooding in complex underground facilities, such as subway stations, can result in significant casualties and property damage. Therefore, it is crucial to determine flood risk management levels within subway stations. This study proposes a comprehensive flood management-level evaluation method based on spatial network importance, spatial functional importance, and flood risk, focusing on the relationship between the complex spatial structure of subway stations and flood risk. The research integrates complex network theory and hydrodynamic simulation techniques to construct a spatial network model within subway stations, assessing the importance index of each subspace in the network. Simultaneously, the spatial functional importance index is calculated through quantitative analysis of different subspace functions. Additionally, the Volume of Fluid (VOF) model is used to simulate flood distribution, obtaining the flood risk index for each subspace. By applying the entropy weight method for comprehensive analysis, the flood risk management levels of various areas within the subway station are determined. The results indicate that among all evaluation indicators, the importance of the subway network is assigned the highest weight, accounting for 50%. Specifically, the spatial network importance of the S6 station hall, S11 station hall, and the connecting corridors between S1–S6 and S11–S6 exceeds 0.48, with these areas constituting 75% of the total subway station space. This highlights their central role in crowd flow and spatial connectivity. The study found that areas with a flood risk management level of five occupy 11.43% of the total space, indicating that prioritizing the management and flood prevention measures in critical areas is essential for enhancing the subway station’s resilience. This study provides both theoretical support and practical references for the risk management of subway station spaces.
1. Introduction
With the continuous advancement of urbanization, the development and utilization of underground spaces have become an integral part of modern urban construction. Urban transportation infrastructure, particularly subway systems, serves not only as a hub for public transit but also as a critical node connecting aboveground and underground spaces, managing a significant portion of urban transport tasks. However, the intensification of climate change and the increasing frequency of extreme weather events have posed heightened risks of urban flooding [1,2]. Subway stations, often situated below ground level, are relatively weak in terms of their drainage and flood prevention capabilities, making them particularly vulnerable to flood disasters. Once flooding occurs, it can lead to a series of accidents, disrupting the normal operation of the transportation network and potentially causing significant economic losses and casualties [3,4]. Therefore, the management of flood risks within the underground spaces of subway stations has become a significant research direction.
In recent years, researchers have begun to focus on the assessment and mitigation strategies for flood risks, particularly within urban subway systems. Jiao et al. [5], through methods such as ordered binary comparison and cloud modeling, proposed a structured resilience assessment approach, which is relevant for evaluating the flood risk of subway systems globally. The lessons learned from catastrophic flood events, such as the heavy rainfall disaster in Zhengzhou, have prompted scholars to advocate for the use of interdisciplinary approaches in managing flood risk within subway systems. Junfeng et al. [6] conducted an analysis of the Zhengzhou event and emphasized the need for a systemic perspective, taking into account the interaction between natural and technological factors. Moreover, the construction activities of subway stations may increase the flood risks in surrounding areas.
The resilience of subway systems to flood disasters has also been a key focus of research. Xu et al. [7] indicated that factors such as population density and passenger flow significantly affect the resilience of subway systems during flood events. Vulnerable groups, especially children and the elderly, are particularly impacted by flood; thus, targeted intervention measures are necessary to enhance the system’s resilience. The structural integrity of subway stations also plays a crucial role in their ability to withstand floods. Wang et al. [8] emphasized the importance of waterproofing measures in the design of subway stations, especially considering that many stations are located below groundwater level. The vulnerability analysis of subway station structures highlights the necessity of continuously assessing the resilience of structures to various environmental stresses, including flooding [9]. Such analysis is crucial for developing maintenance and repair strategies that enhance the lifespan and safety of subway infrastructure.
Various modeling techniques have been used in assessing flood risk in subway stations. For example, Liu et al. [10] used the Pressure-State-Response (PSR) cloud model to assess the risks associated with heavy rainfall-induced flood disasters in urban subway stations. This model takes into account multiple components of the disaster system, including environmental factors and their potential impact on infrastructure. Lyu [11,12] integrated the Storm Water Management Model (SWMM) with Geographic Information Systems (GIS) and incorporated statistical methods to assess flood risks, demonstrating the effectiveness of technology in flood risk evaluation. Ju et al. [13] employed a projection pursuit model optimized by the whale optimization algorithm, providing a comprehensive risk assessment framework to evaluate the flood risk at the Changzhou subway station in China. In a study by Yu et al. [14], an optimal combination weighting method, combining both subjective and objective weights, was used to establish a fuzzy comprehensive evaluation model specifically designed to assess the flood risk during the construction and operation phases of urban subway stations. Wang, Liu, Shi, Zhang, and Liu [8] proposed an improved trapezoidal fuzzy analytic hierarchy process (FAHP) to assess flood risks, which helps to determine the priority of mitigation measures based on the specific vulnerabilities of different subway stations.
In addition to risk assessment, intelligent monitoring systems can be used for proactive flood management. Li et al. [15] described the development of an intelligent monitoring system based on geographic information technology, which uses real-time data to manage subway operations during flood events in subway stations. Dong et al. [16] emphasized the importance of monitoring and early warning mechanisms, noting that quick decision-making and evacuation procedures can significantly reduce casualties during flood events. The integration of advanced technologies, such as intelligent sensing and data analysis, is crucial for creating resilient subway systems capable of withstanding extreme weather events.
However, current research on flood risks in subway stations mostly focuses on the assessment of single factors or macro subway network systems, lacking a targeted risk management framework for specific subway stations. Based on this, the aim of this study is to propose a novel flood risk management method for subway stations by integrating spatial, functional, and risk management indicators. This method not only evaluates the flood risk of subway stations from different dimensions but also provides scientific risk management strategies for practical engineering, thereby enhancing the flood resistance of subway stations and ensuring the safety and sustainable development of urban transportation.
2. Materials and Methods
2.1. Study Area and Datasets
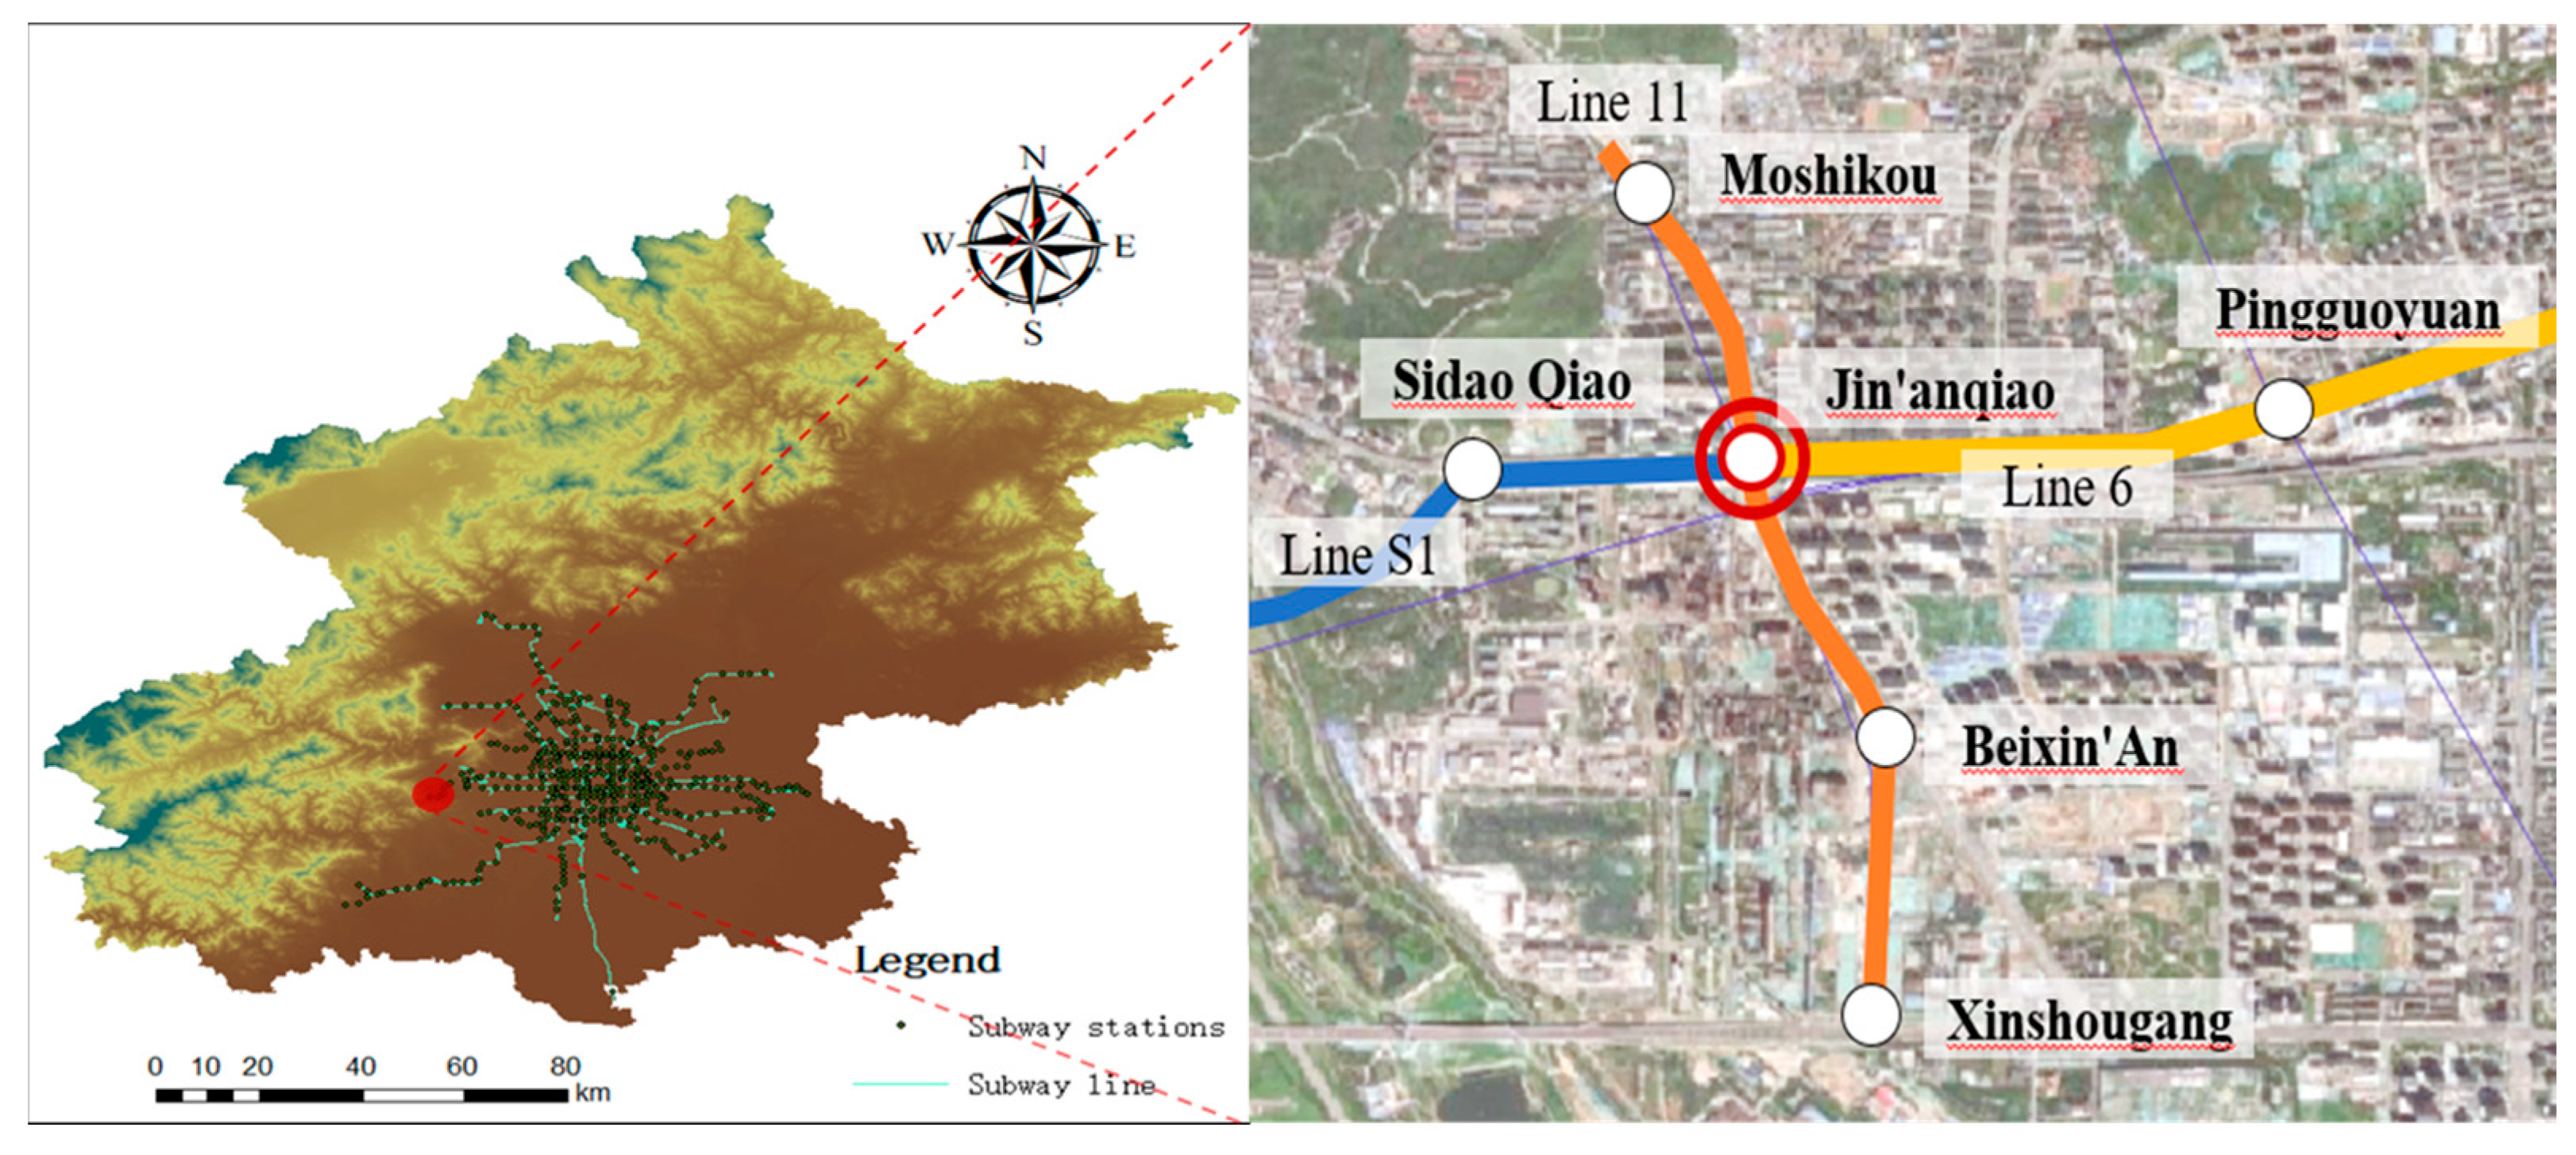
Beijing is characterized by intense precipitation and abrupt rainfall events during the flood season, with short-duration, high-intensity rainfall exhibiting significant spatiotemporal heterogeneity. This leads to severe localized flooding, rendering low-lying areas and underground infrastructure particularly vulnerable to inundation risks. This study focuses on the underground sections of the Jin’anqiao subway station in Beijing, which is located in the Shijingshan District. The station is a transfer hub for Beijing Subway Line 6, Line 11, and Line S1. As one of the key rail transit hubs, it handles large volumes of passenger flow, and the surrounding area is low-lying, making it prone to water accumulation. In July 2021, the station experienced a severe flooding incident, forcing a temporary suspension of subway services. The location information of the subway station is shown in Figure 1.

Figure 1.
Sketch of the study area.
2.2. Geometric Subway Construction
Using the SketchUp application on a mobile device, a 3D survey of the Jin’anqiao subway station was conducted to obtain key data within the station.
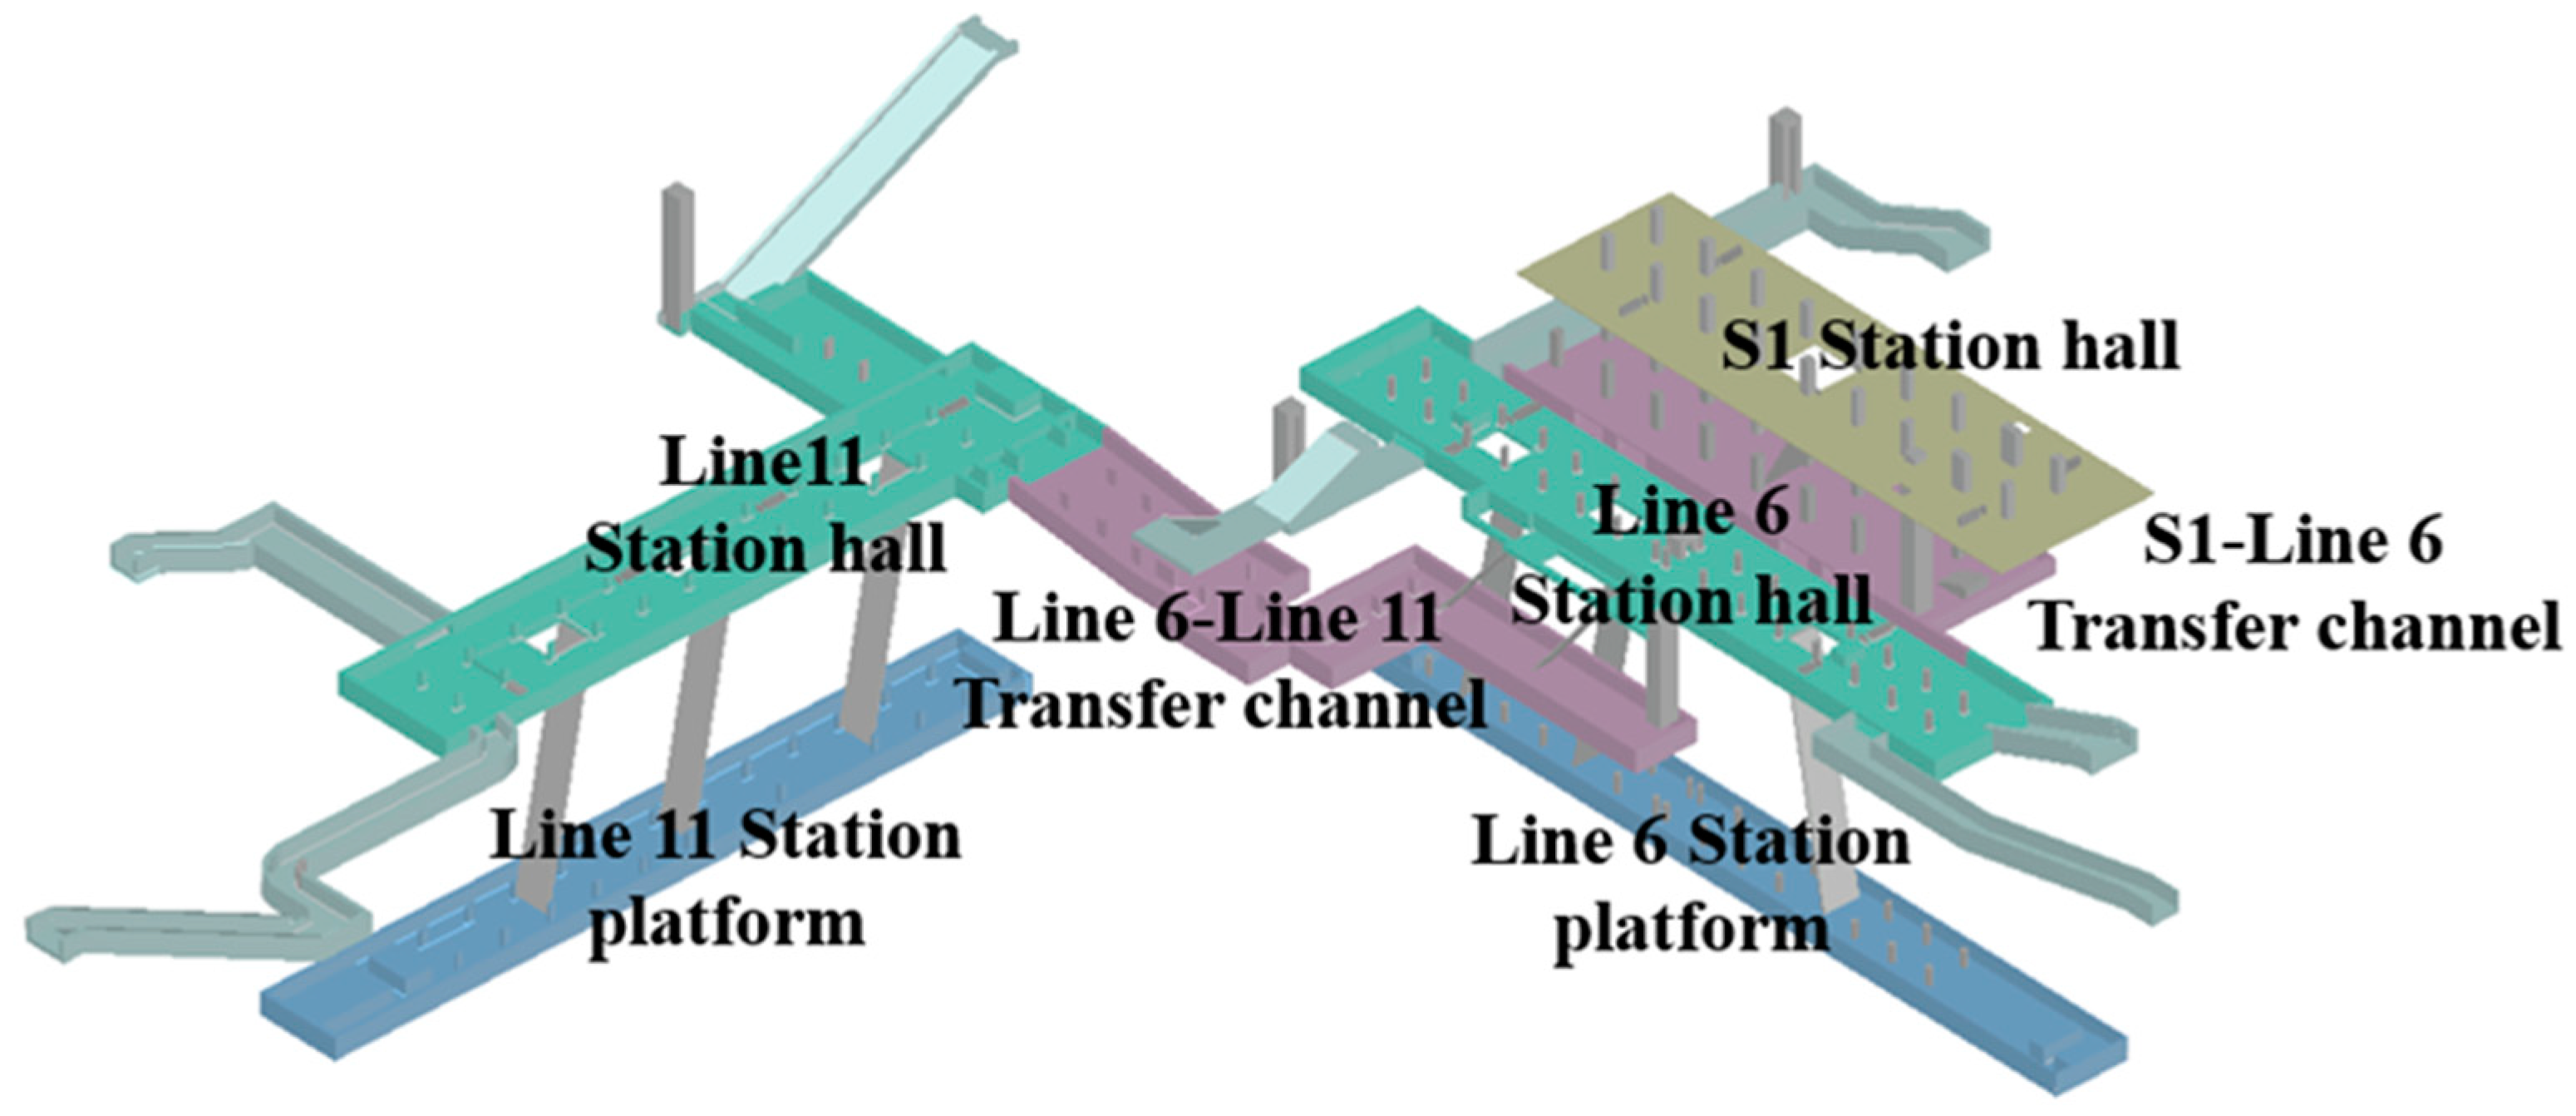
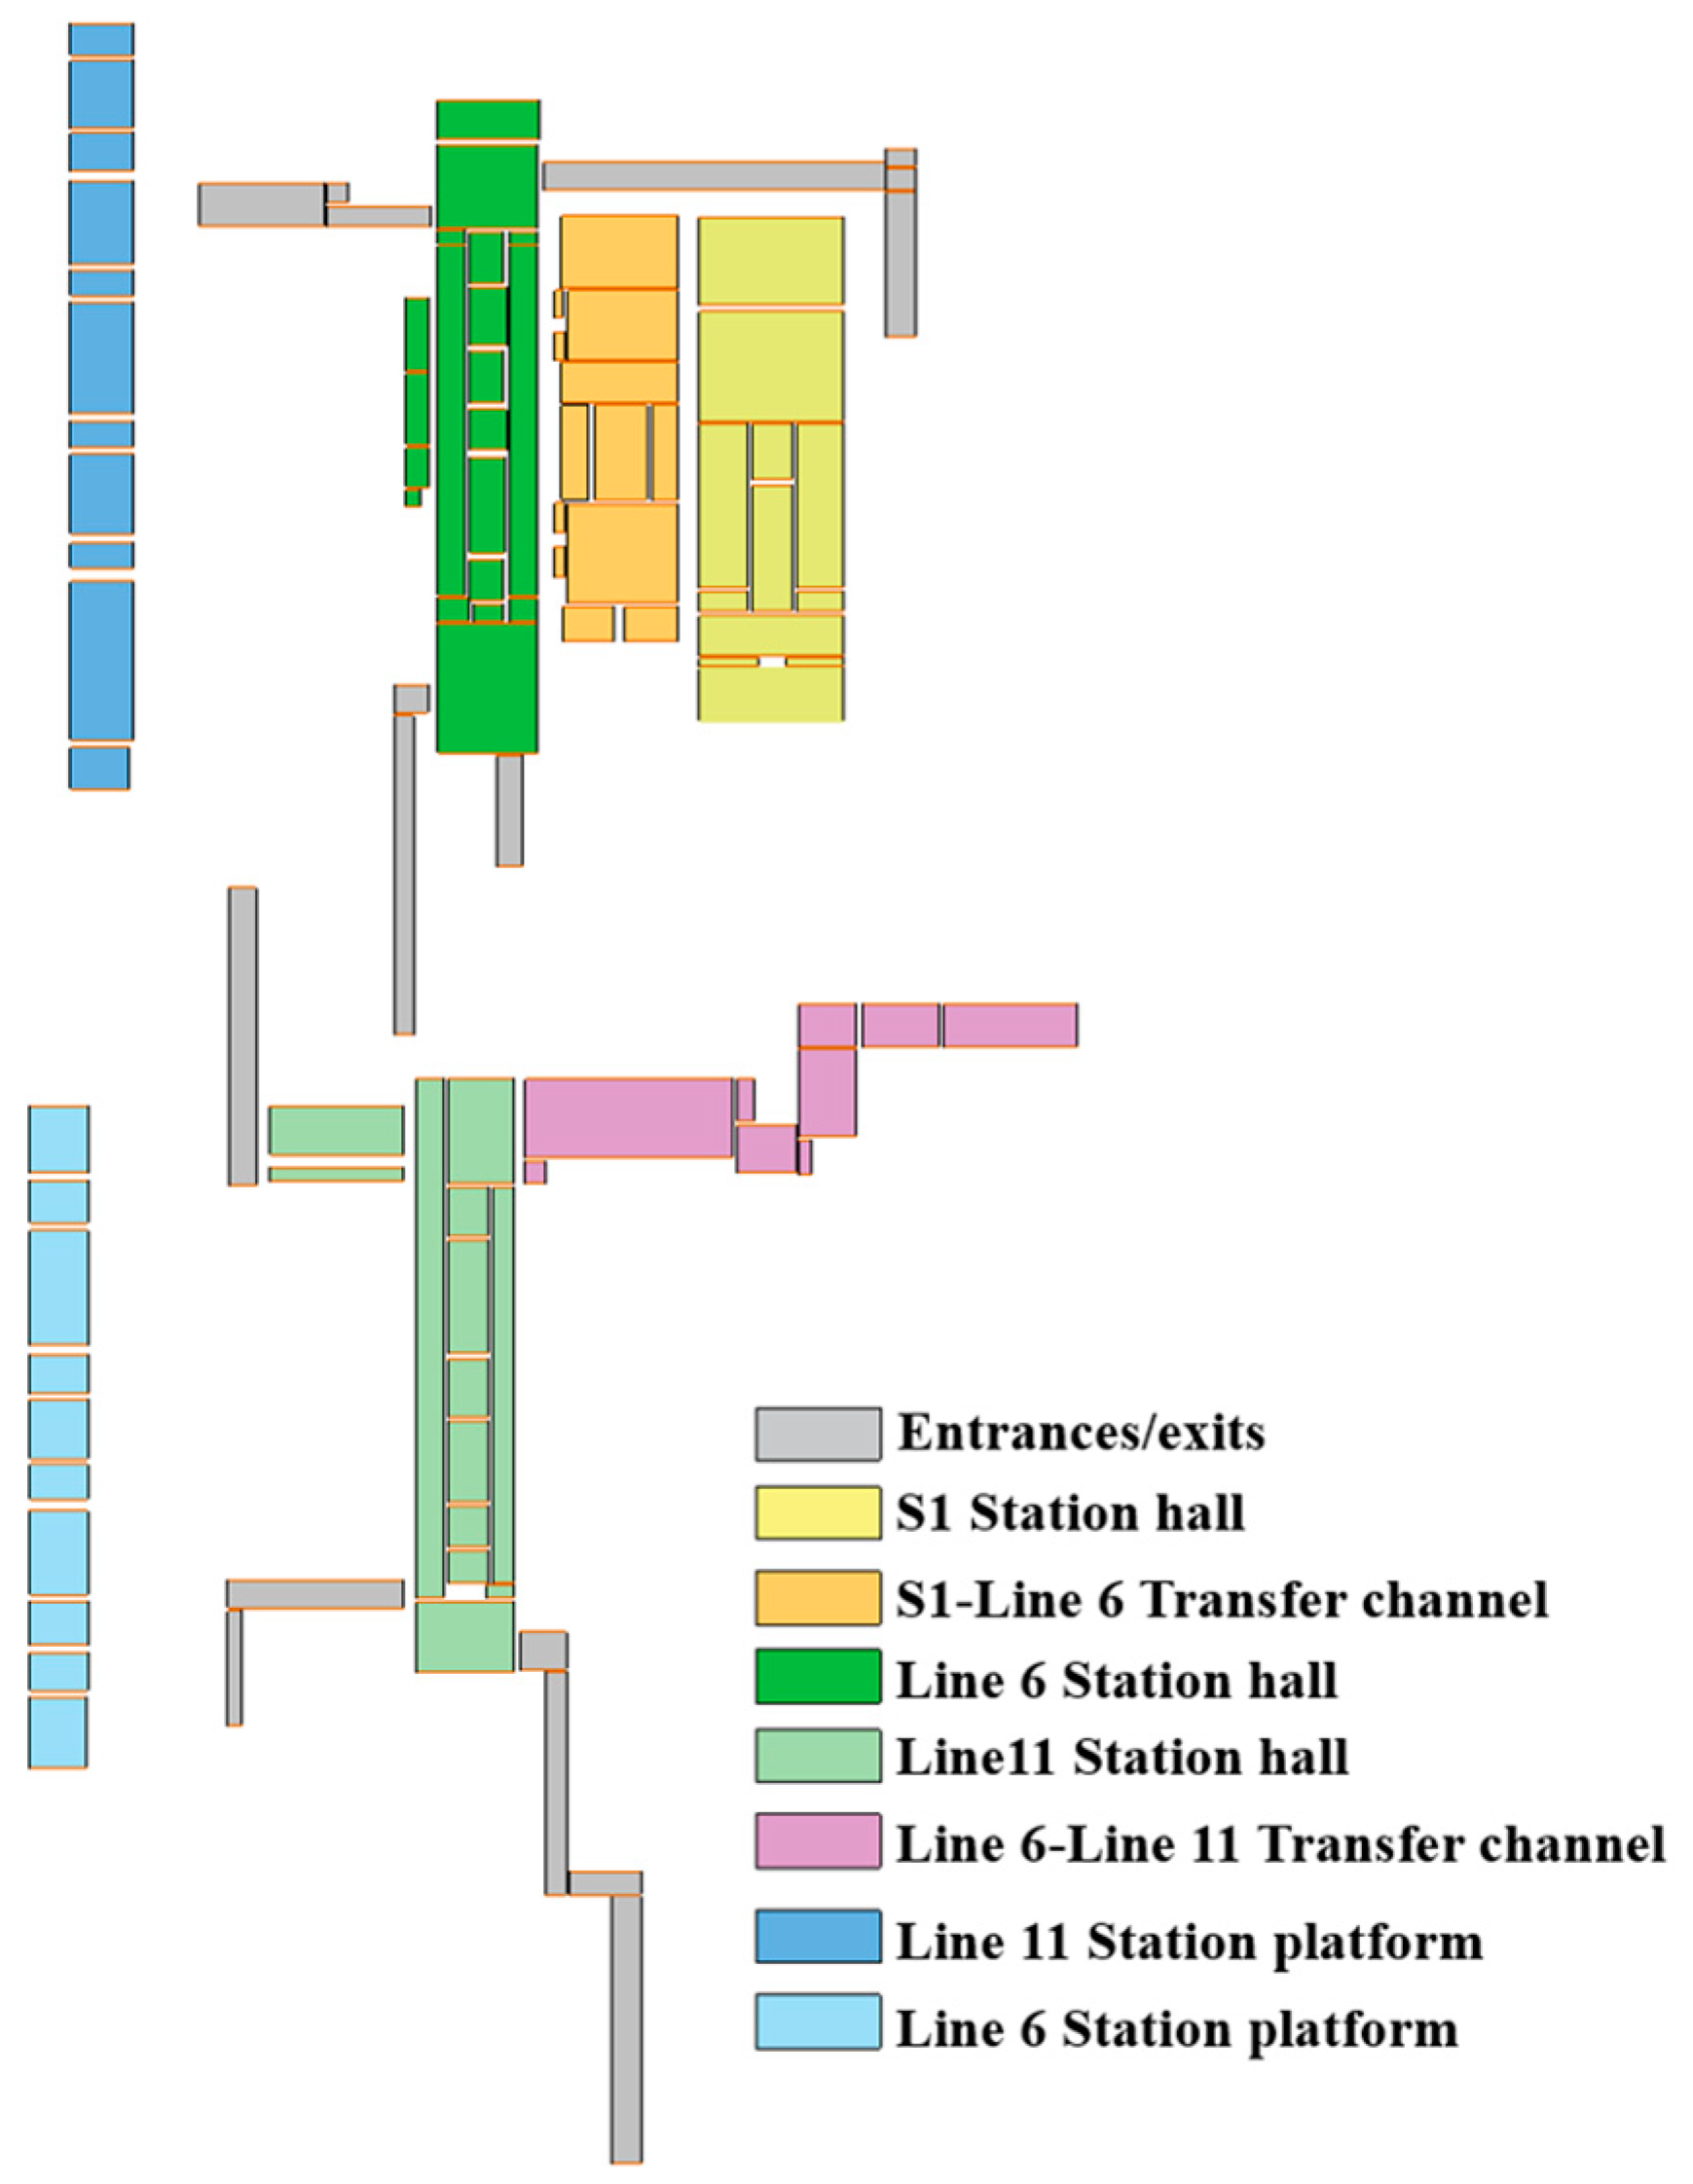
A 3D geometric model of the Jin’anqiao Subway Station was established using geometric modeling software(AutoCAD 2016). During the modeling process, the main public space structures and equipment were retained, including the S1 station hall level, Line 6 station hall level, Line 6 station platform level, Line 11 station hall level, Line 11 station platform level, entrance and exit passages, transfer channels, elevators, and ticket gates. In the Line 6 and Line 11 station platforms, a retaining wall is set between the subway tracks and pedestrians to block water from entering the subway tracks. Therefore, when building the 3D model, the station platforms were defined by the retaining wall as a boundary. Figure 2 shows the distribution of functions on each floor of the Jin’anqiao subway station.

Figure 2.
Functional diagram of each floor in Jin’anqiao subway station.
2.3. Establishment of Risk Management Indicator System
The underground space flood risk management level indicator system was constructed through the following three core dimensions to assess the importance, potential impact, and vulnerability of each space in the underground environment:
Spatial Network Importance: This indicator helps determine which nodes in the subway station play a critical role in passenger flow and safety operations, which is crucial for ensuring effective evacuation and emergency response during flood events.
Spatial Functional Importance: By evaluating the functional importance of each space, it identifies which areas are more critical in daily operations and emergency situations, aiding in prioritizing resource allocation and risk prevention.
Flood Accumulation Risk Indicators: This directly measures the level of flood threat faced by each space, including predicted water accumulation depth and duration. It forms the basis for developing effective flood control measures and emergency plans.
In this study, the internal space division of the subway station is based on the theory of spatial accessibility [17], and a quantitative analysis framework for the subway station spatial structure is constructed. Spatial accessibility, as the core indicator describing the convenience of passage between locations in an urban spatial system, is transformed into an operable spatial structure analysis method through the use of space syntax. By constructing a space syntax graph, the building space is decomposed into convex spatial units that are visibility-accessible, and parameters such as integration and choice are used to reveal the coupling mechanism between spatial configuration and behavior patterns. The flood risk management-level system in subway stations is shown in Figure 3.
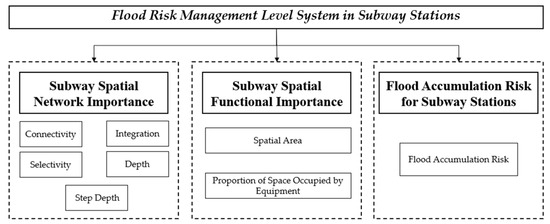
Figure 3.
Flood risk management-level system in subway stations.
The DepthmapX-0.8.0 software is used for spatial topology modeling of the target subway station. Figure 4 shows the results of the subdivision of internal spaces in the subway station. Following the zoning principles of space syntax, the subway station is divided into units, ultimately forming a benchmark model with 105 spatial units. For facilities within the space, a differentiated processing strategy is applied: facilities with a projection area smaller than 0.8 m2 and no significant impact on major flow lines (such as ticket machines, structural columns, etc.) are included in the adjacent units, while critical flow control points, such as turnstiles and elevators, are designated as independent spatial units to ensure the model retains spatial topology features and accurately reflects the actual hindrance effect of facilities on people’s movement.

Figure 4.
Subdivision of internal spaces in the subway station.
2.3.1. Subway Spatial Network Importance Indicators
In subway stations, spatial network importance reflects the criticality of different areas in terms of pedestrian movement and evacuation. By quantifying the importance of spatial networks, key areas can be identified, providing a basis for optimizing spatial layouts, disaster prevention, and resource allocation.
This study considers six indicators for the importance of spaces within the subway station: connectivity, integration, step depth, selectivity, and depth.
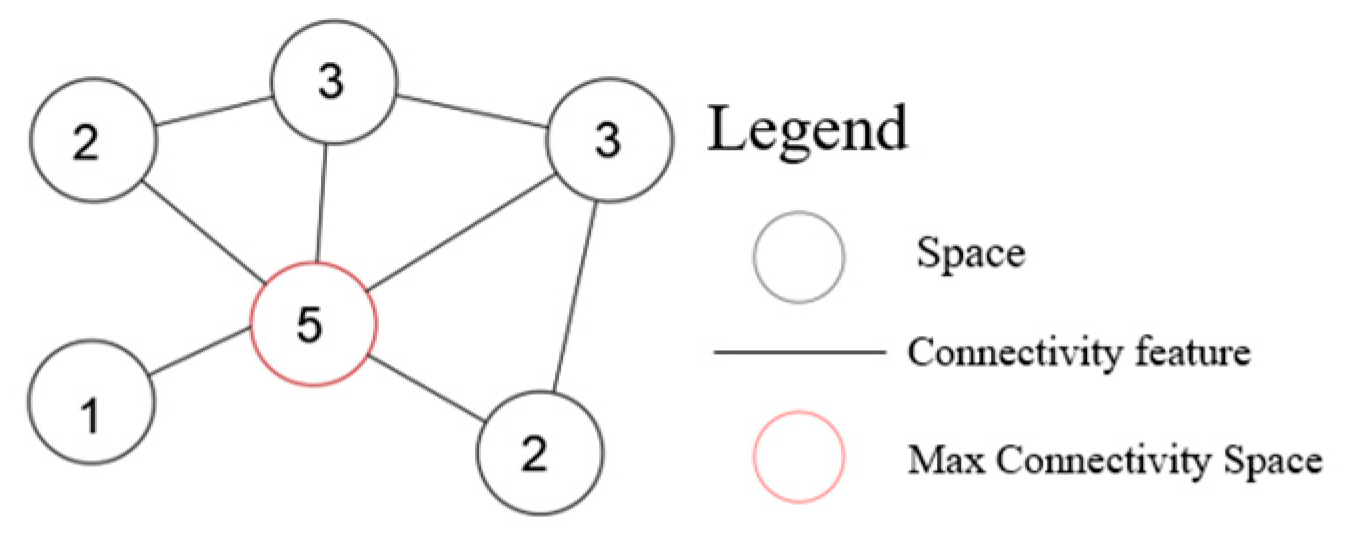
(1) Connectivity
This measures the number of direct connections between a space and its surrounding spaces. Spaces with higher connectivity are typically more accessible and attract more pedestrian movement. Figure 5 is the Spatial Connectivity Schematic Diagram, where the red areas represent the spaces with the highest connectivity in the spatial network.
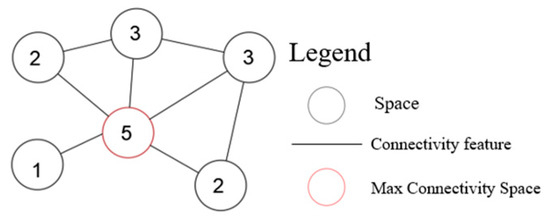
Figure 5.
Spatial connectivity schematic diagram.
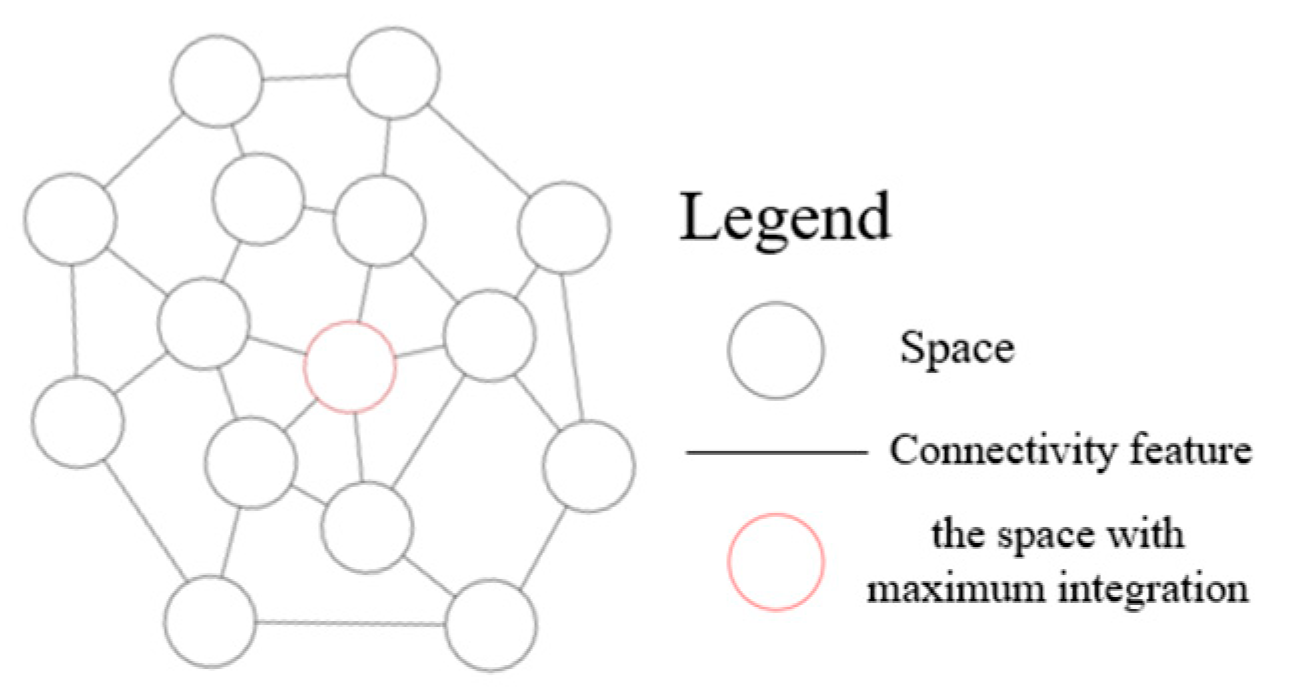
(2) Integration
Integration represents the centrality of a space within the entire system. It is related to pedestrian flow concentration and accessibility. Therefore, the higher the integration of a space, the stronger its ability to attract pedestrian aggregation. Figure 6 is the Spatial Integration Schematic Diagram, where the red areas represent the spaces with the highest integration in the spatial network.
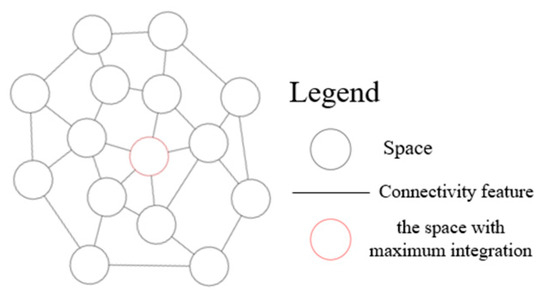
Figure 6.
Spatial integration schematic diagram.
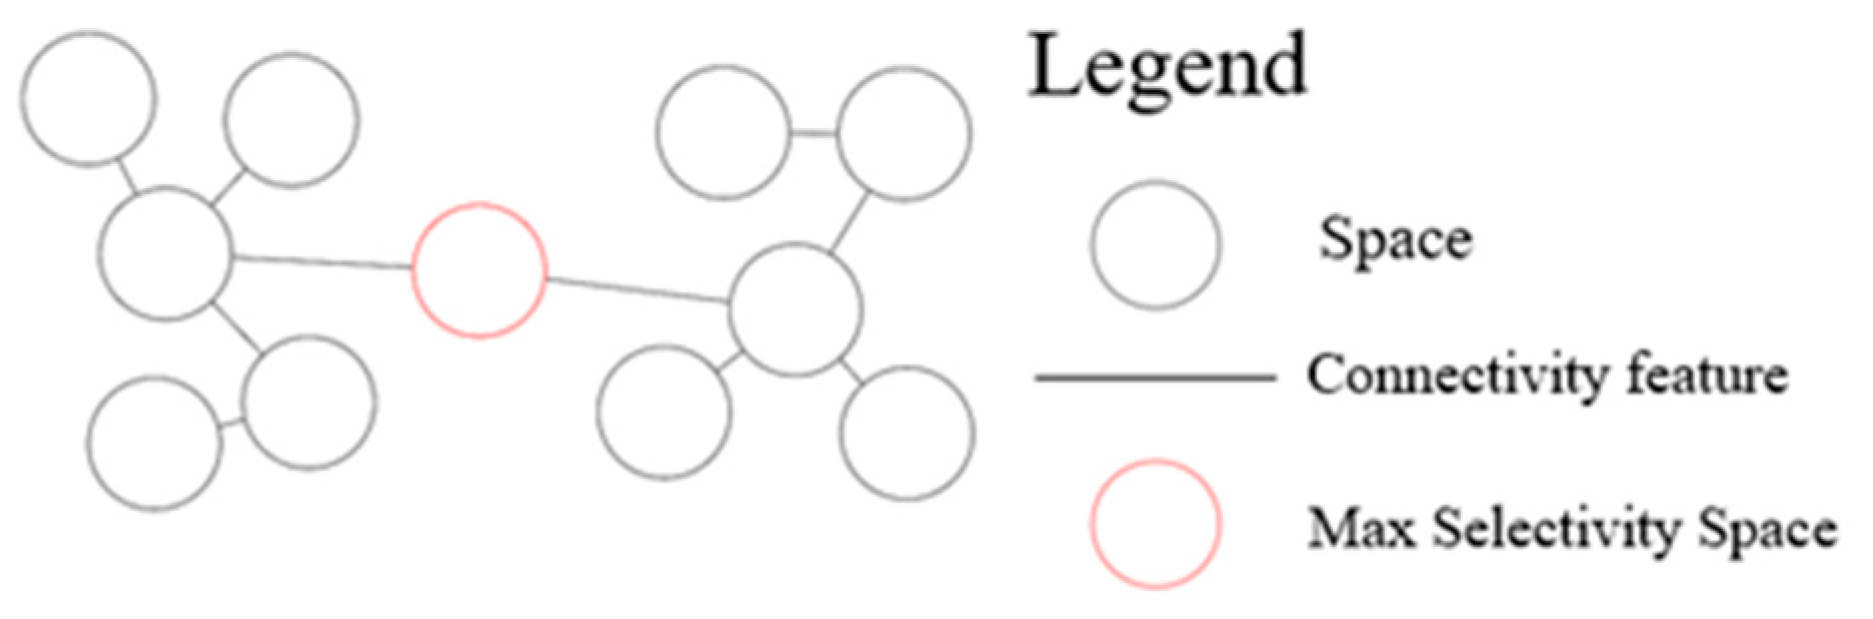
(3) Selectivity
Selectivity refers to the frequency with which a particular element is used as the shortest topological path between two nodes in the spatial system. Compared to integration, selectivity focuses more on the accessibility of the space. It examines the advantages of a space unit when serving as the shortest travel path, reflecting the probability of pedestrians passing through that space. Figure 7 is the Spatial Selectivity Schematic Diagram, where the red areas represent the spaces with the highest selectivity in the spatial network.

Figure 7.
Spatial selectivity schematic diagram.
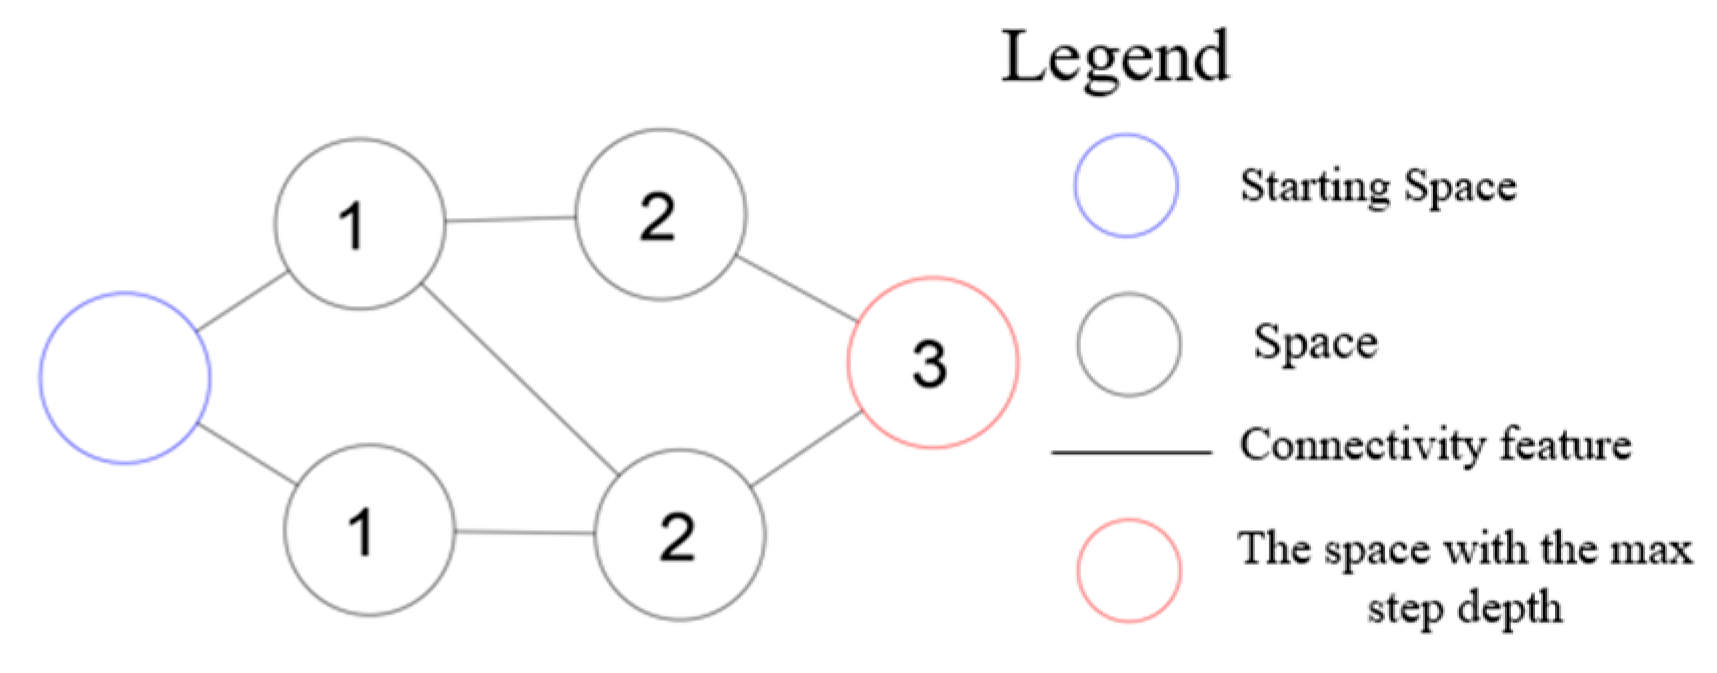
(4) Depth
Depth refers to the distance from a space to its neighboring nodes, which is the number of steps from one node to other nodes within a specific radius or “depth”. Local depth is primarily used to analyze the local accessibility of a space, examining the local structure and function of specific spaces. Based on the actual conditions of this study, the local depth radius is set to 5, and spaces with lower local depth are more open.
(5) Step Depth
Step depth is the sum of distances from the starting space to all other spaces, indicating the overall complexity of the system from a specific space. In this study, the entrances and exits to the surface are considered as the starting spaces. Spaces with higher step depth are farther from the surface exits. Figure 8 is the Spatial Step Depth Schematic Diagram, where the red areas represent the spaces with the highest step depth in the spatial network.
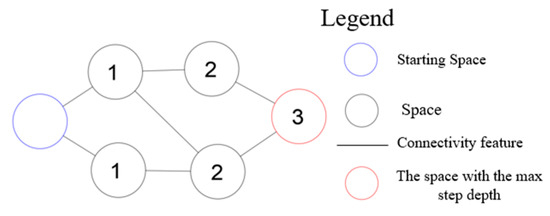
Figure 8.
Spatial step depth schematic diagram.
2.3.2. Subway Spatial Functional Importance Indicators
When assessing the importance of spaces within a subway station, functionality is a key indicator in addition to the relationships between spaces. The functionality indicator helps measure the practical value and operational efficiency of each space. This study uses two indicators to represent the functional significance of spaces:
(1) Spatial Area
Generally, the larger the space, the more it can accommodate facilities, equipment, or human activities. Therefore, larger spaces are often used in high-traffic areas, such as station halls and waiting areas. The spatial area is used to determine the capacity and usage potential of a space.
(2) Proportion of Space Occupied by Equipment
This measures the proportion of functional facilities or equipment within each space, reflecting the functional density of the space. The projected area refers to the ratio of the actual occupied area by equipment (such as turnstiles, ticket vending machines, elevators, etc.) to the total area of the space. When the proportion of the equipment’s projected area is high, it indicates that the space has a strong functional purpose, often being equipment-intensive, and thus holds high functional value.
2.3.3. Flood Accumulation Risk Indicators for Subway Stations
In the previous study on the flood risk at the entrances of Jin’anqiao subway station, a two-dimensional hydrological and hydraulic model was used to simulate the surrounding area of the station. The simulation results indicated that during a 20-year return period event with a rainfall duration of 180 min, the water depth at various subway entrances rose rapidly and exceeded the step height [18]. Therefore, this study uses the 20-year return period and 180-min rainfall duration scenario as the flood simulation conditions for the metro station. The difference between the measured water accumulation depth at each subway entrance under this rainfall scenario and the corresponding stair height (effective inflow depth) is used as the initial condition for the water accumulation depth at the inflow boundaries in the VOF model. The specific parameter values are shown in Table 1.

Table 1.
Water accumulation depth at subway entrances/exits under a 20-year rainfall event.
Furthermore, based on observed flood events at Jin’anqiao Station, water intrusion only occurred at specific entrances of Line S1 and Line 6 where the accumulated water depth exceeded the step height. To ensure simulation accuracy, elevated sections of Line S1 (located above ground level) and Line 11 (protected by terrain elevation and drainage slopes) were excluded from the flood intrusion model.
This study focuses on the flood propagation patterns within a subway station under extreme scenarios (such as drainage system failure and rainfall exceeding design standards), without considering the impact of the drainage system at this stage.
The simulation analysis of flood distribution within subway stations helps identify relevant risk indicators. In this study, the Volume of Fluid (VOF) method is used to simulate flood intrusion at Line 6 subway station. The VOF method is commonly employed in free-surface tracking numerical simulations. It solves a set of momentum and continuity equations to model the movement of multiple fluids, tracking the volume each fluid occupies to determine the behavior of the free surface. Due to its high accuracy, stability, and flexible meshing capabilities, the VOF model has been widely applied in studies of open-channel flow and related areas.
For the gas-liquid two-phase flow model in this study, the core concept of the VOF model is that the sum of the volume fractions of water and air (α) in each cell is always Equation (1):
where αw is the volume fraction of the liquid phase, and αw is the volume fraction of the air phase.
If αw = 1, it indicates that the cell is completely filled with water; if αw = 0, the cell is completely filled with air; when 0 < αw <1, the cell contains both water and air, meaning the cell must include a free liquid surface. Taking water in the liquid phase as an example, the governing equation for its volume fraction is:
where t is time; ui and xi are the velocity components and coordinate components, respectively. In this study, the contour surface with a volume fraction of 0.5 is considered as the free surface of the water flow.
In this study, the focus was on an interchange station, where the impact of complex structures, such as columns, was taken into account. Given the complexity of the water flow and the curved nature of the flow lines, the turbulence is modeled using the Renormalization Group k-ε (RNG k-ε) model. The equation for the k-ε model is as follows:
where, ρ is fluid density, k is turbulent kinetic energy, ε is the turbulent dissipation rate, µeff is effective viscosity coefficient, µeff = µ + µt, µt = ρCµk2/ε, where µ is the dynamic viscosity coefficient, µt is the turbulent viscosity coefficient, Cµ is the viscosity constant; G is the turbulent kinetic energy generation term caused by the average velocity gradient, , and αk and αε are the inverse effective Prandtl numbers of turbulent kinetic energy and turbulent dissipation rate, respectively. The values of the above constants are Cµ = 0.0845, C1ε = 1.42, C2ε = 1.68, αk = αε = 1.393, β = 0.012, and η0 = 4.38.
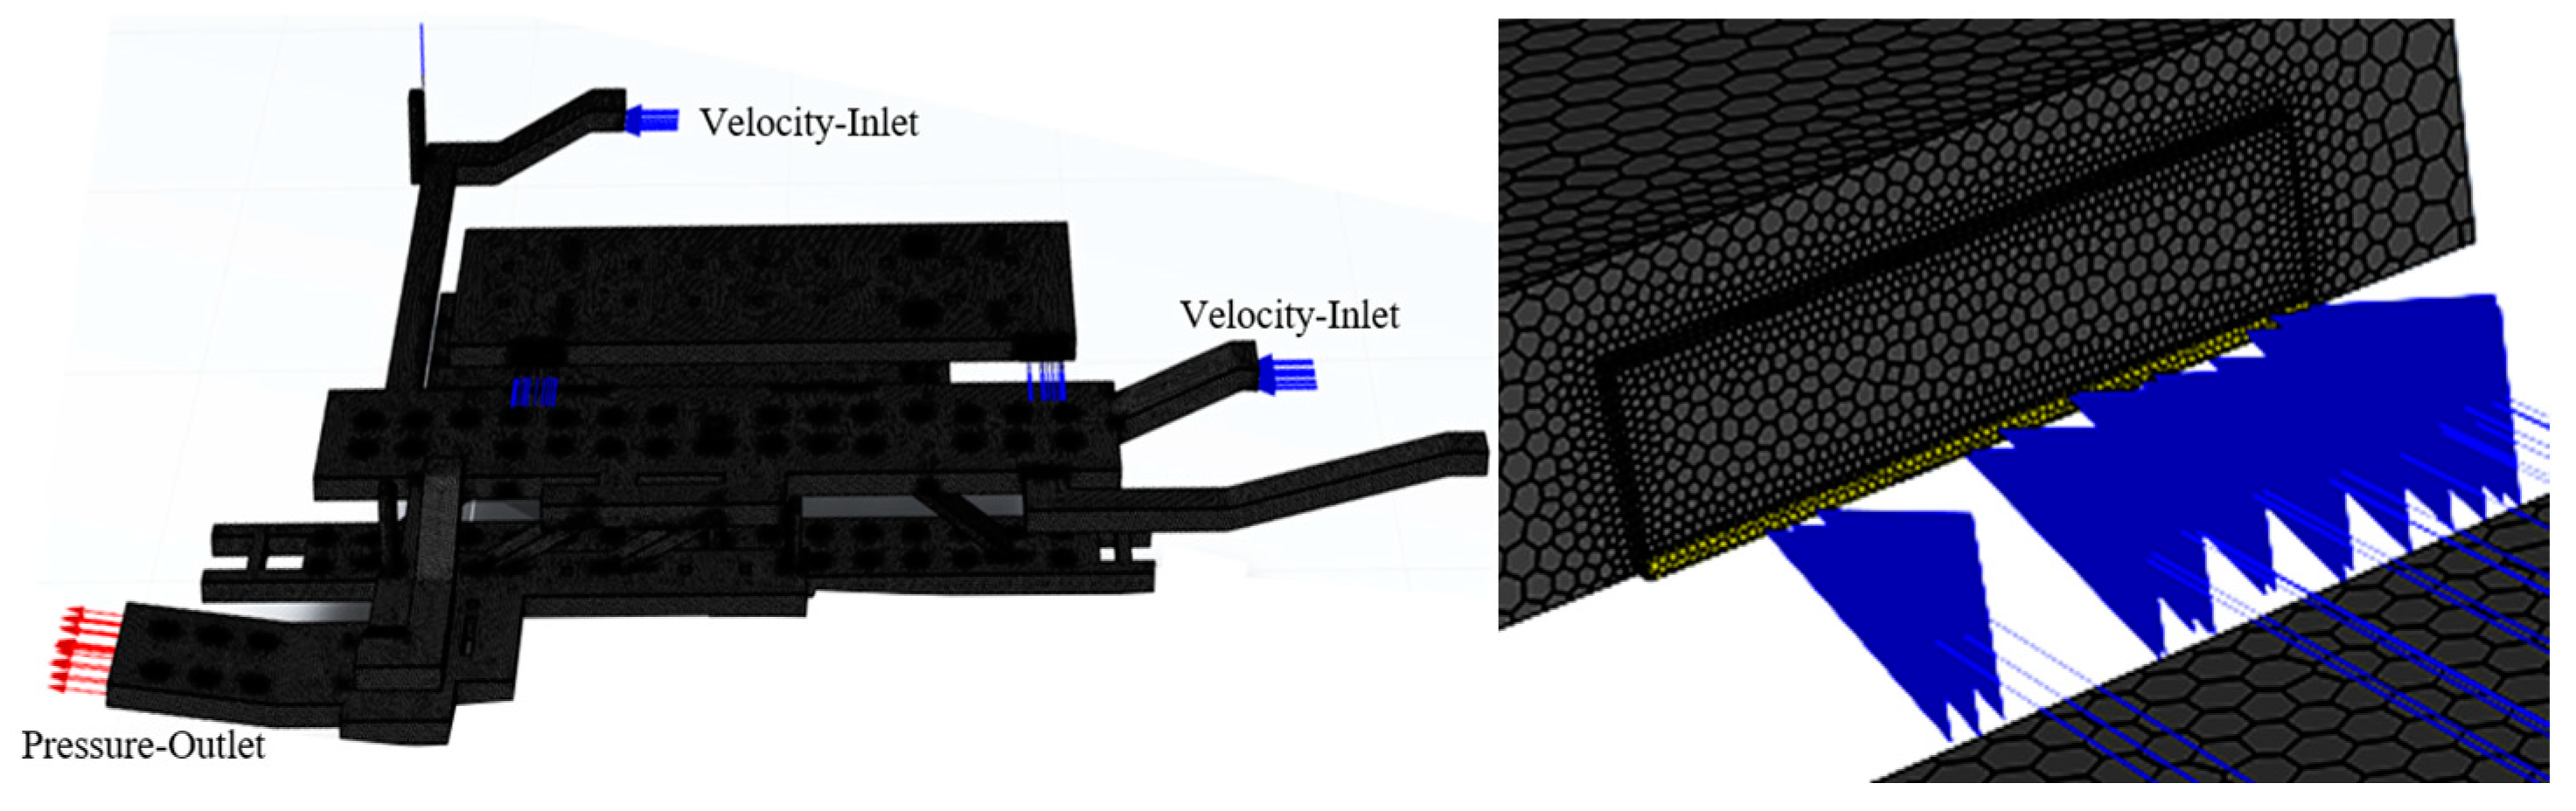
The Poly-Hexcore mesh generation method is used for grid division (Figure 9). The Poly-Hexcore mesh consists of layered polyhedral meshes, pure polyhedral meshes, and hexahedral meshes. The mesh surface typically forms a honeycomb pattern, with high regularity of the individual cells and good connectivity between the cells. For complex model meshing, the Poly-Hexcore method is more efficient in terms of both mesh generation and convergence speed compared to the traditional tetrahedral unstructured mesh generation method.
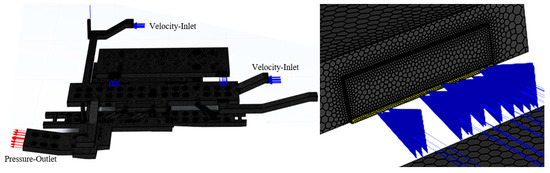
Figure 9.
Meshing diagram of the target study station.
The floodwater levels at all entrances, accessible elevators, and emergency safety channels under a 20-year flood condition are determined based on the flooding scenario of the subway station [18], which helps set the height of the model’s water entry points. The relationship between the intrusion flow rate and the surface water height is given by Ishigaki et al. [19] who conducted flood intrusion tests using a full-scale stair model:
where, q is the flood intrusion flow rate per unit width, in m2/s, and h is the water depth above the entrance ground level, in meters. Based on Equation (3), the boundary condition for the water flow velocity is set, where a constant inflow velocity controls the flood flow rate and mass entering the subway station.
The upper boundary of the air intake is set as a gas-phase pressure boundary to ensure that the air pressure at the internal and external interfaces of the model is at standard atmospheric pressure. A pressure outlet boundary is applied at the Line 6-Line 11 transfer channel.
Using VOF simulation, the flood distribution after 2 h of flood intrusion was analyzed, revealing an average water depth of 0.46 m. Considering that human behavior and risk levels vary with water depth, the risk levels are categorized as follows based on water depth intervals [20]: low risk for water depth below the ankle (<10 cm), low-moderate risk for water depth between the ankle and knee (10 cm–40 cm), moderate risk for water depth between the knee and waist (40 cm–90 cm), and high risk for water depth above the waist (>90 cm). These classifications are used to determine the flood risk levels of different spaces within the subway station.
2.4. Weight Determination
The TOPSIS method is used to analyze and calculate the weights of various indicators within the subway station. The concept of entropy originates from thermodynamics, where the greater the amount of information an indicator contains, the smaller its information entropy value, and the larger its determined weight. The entropy weight method is a commonly used objective weighting method, which calculates the weight of each indicator by establishing an original data evaluation matrix. Compared to subjective weighting methods, the entropy weight method is more objective and precise. In the weight calculation, the system entropy is first determined. Additionally, to reduce the influence of different indicator values, a normalization process is applied to unify the data:
where e is the entropy value of the j indicator, and is the information entropy coefficient.
The processed data are then used for entropy weight analysis.
Among these, connectivity, integration, selectivity, step depth, spatial area, and the equipment-to-space ratio are positive indicators, while depth (R = 5) is a negative indicator. Table 2 and Table 3 show the results of the Weight of Spatial Network Importance and the Weight of Spatial Functional Importance, respectively.
Table 2.
Weight of spatial network importance.
Table 3.
Weight of spatial functional importance.
The TOPSIS method is applied once again to calculate the weights of the network importance index, spatial functionality, and flood risk index. To mitigate the impact of varying values between the indicators on data analysis, the initial statistical data are range normalized. All three indicators are considered positive indicators. The analysis results are shown in Table 4.
Table 4.
Weight of indicator.
3. Results and Discussion
3.1. Subway Spatial Network Importance Results
(1) Results of Spatial Importance Indicators
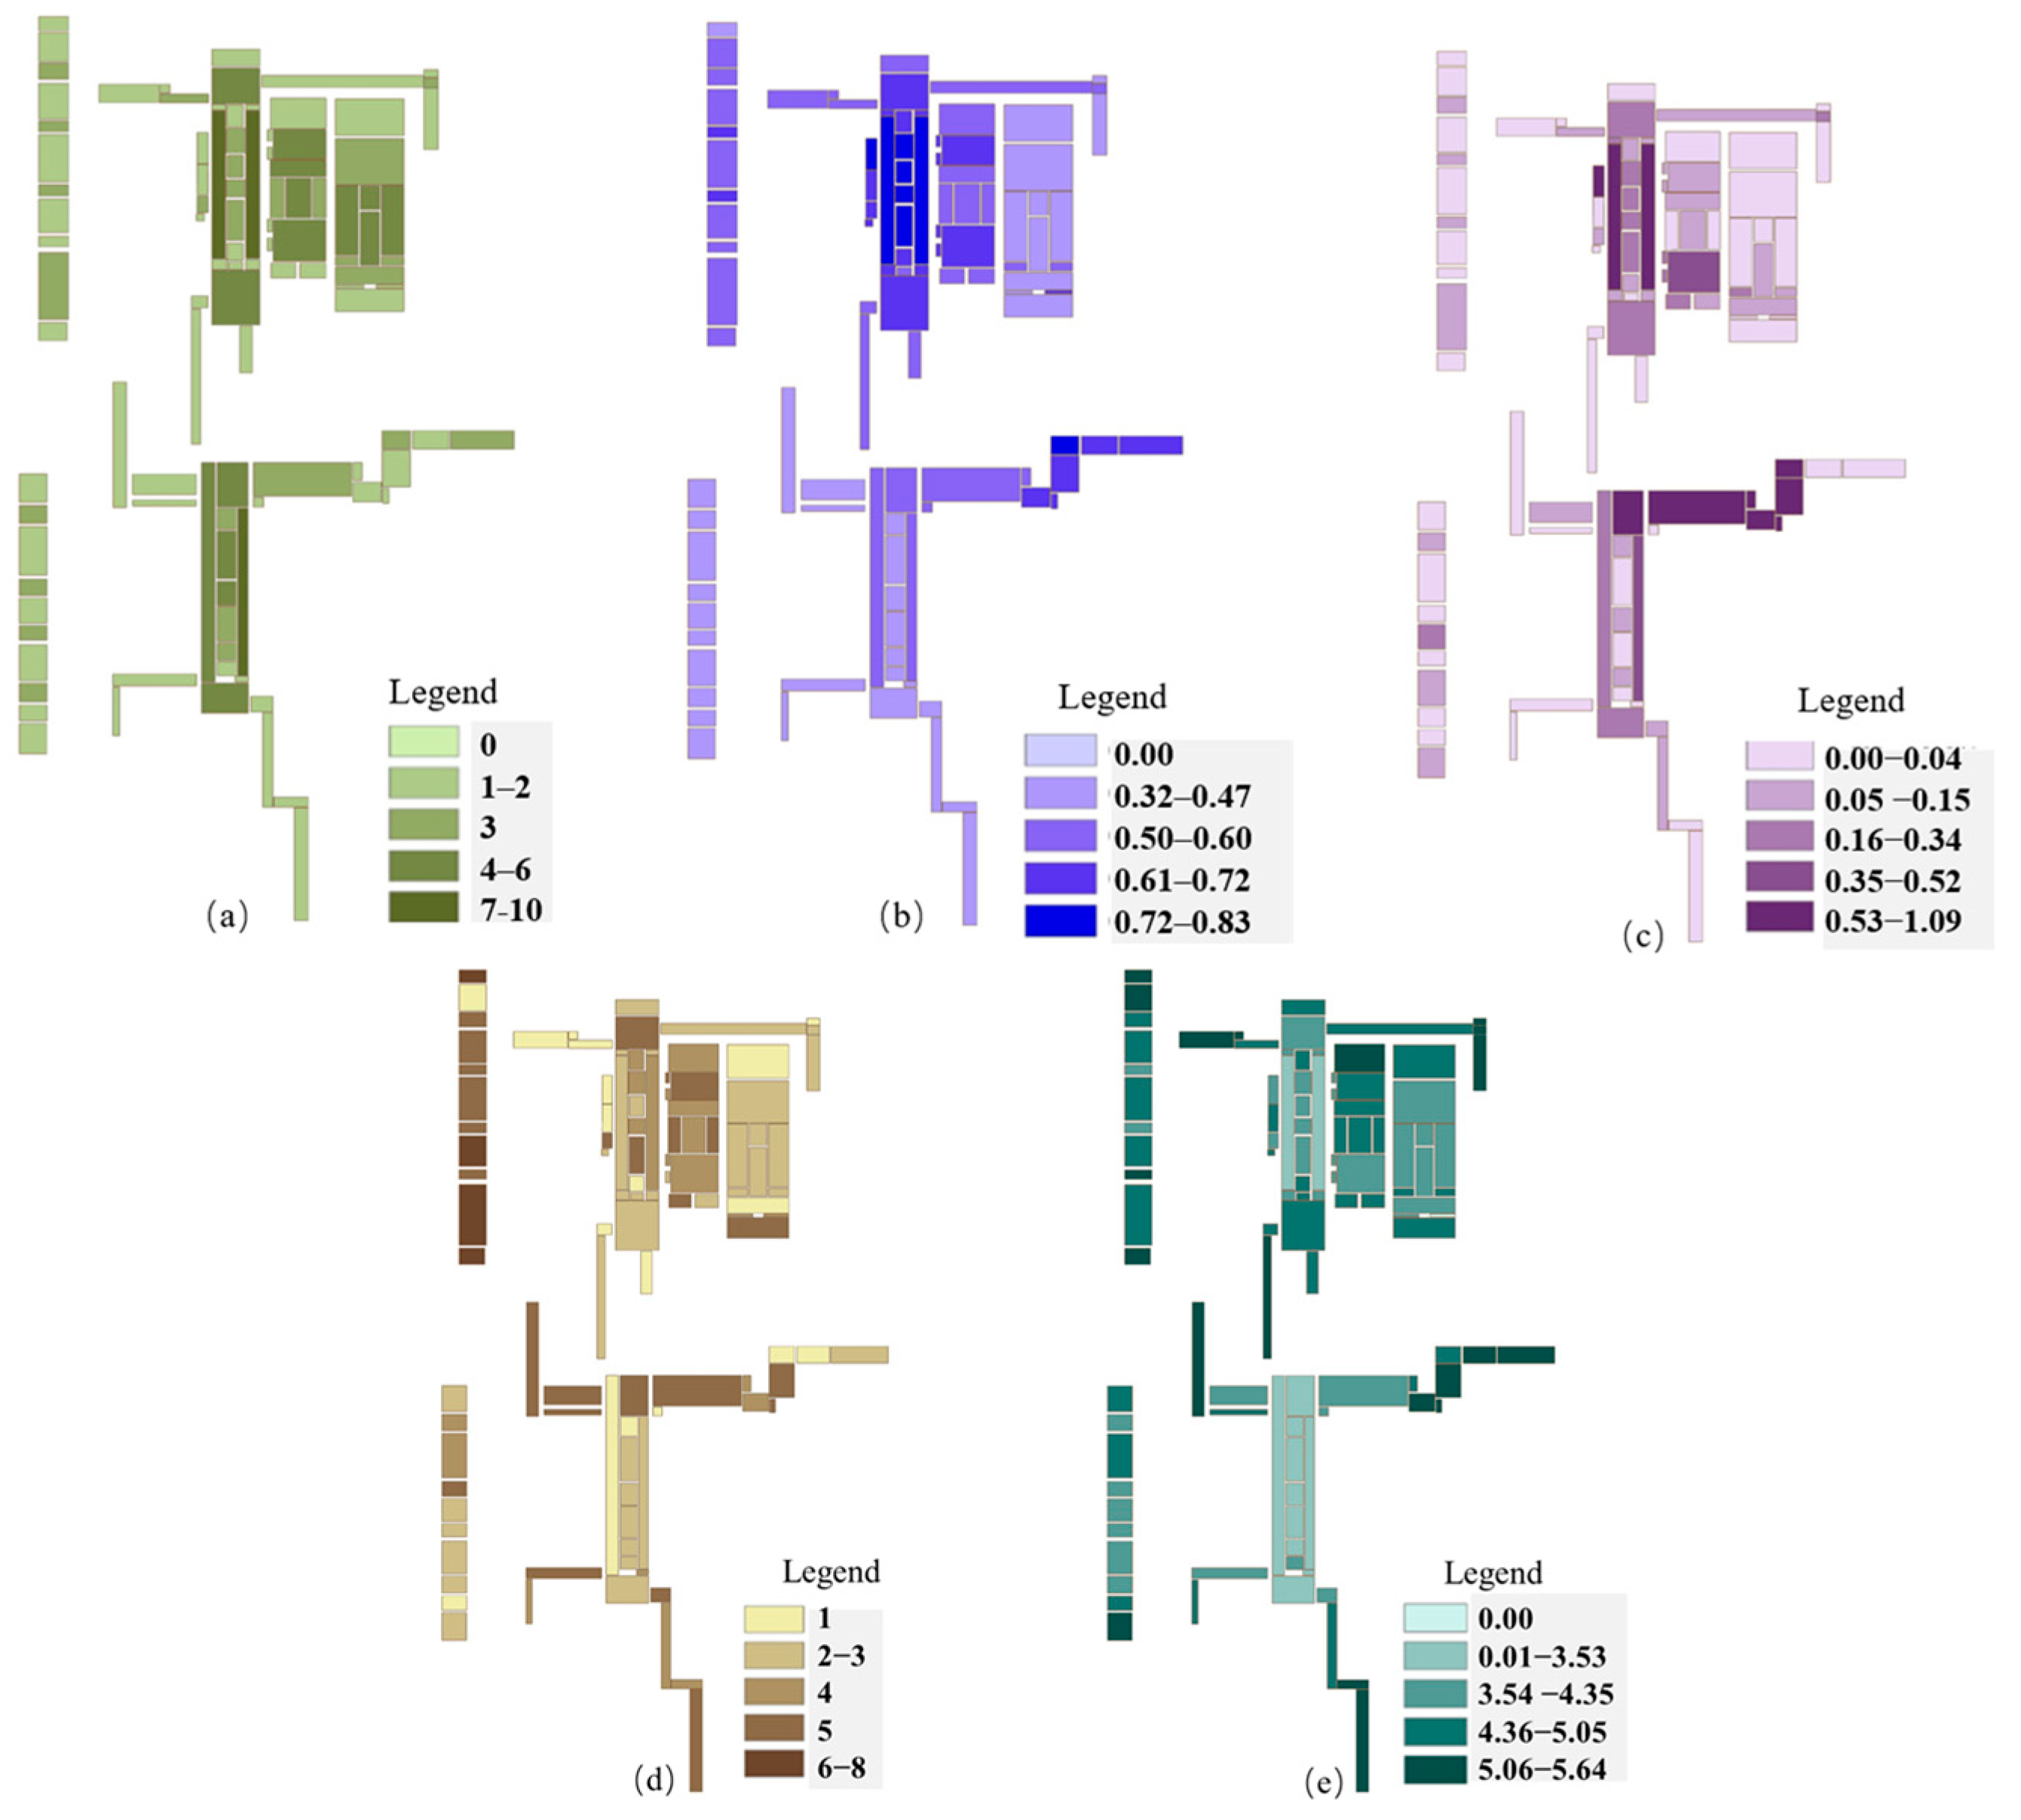
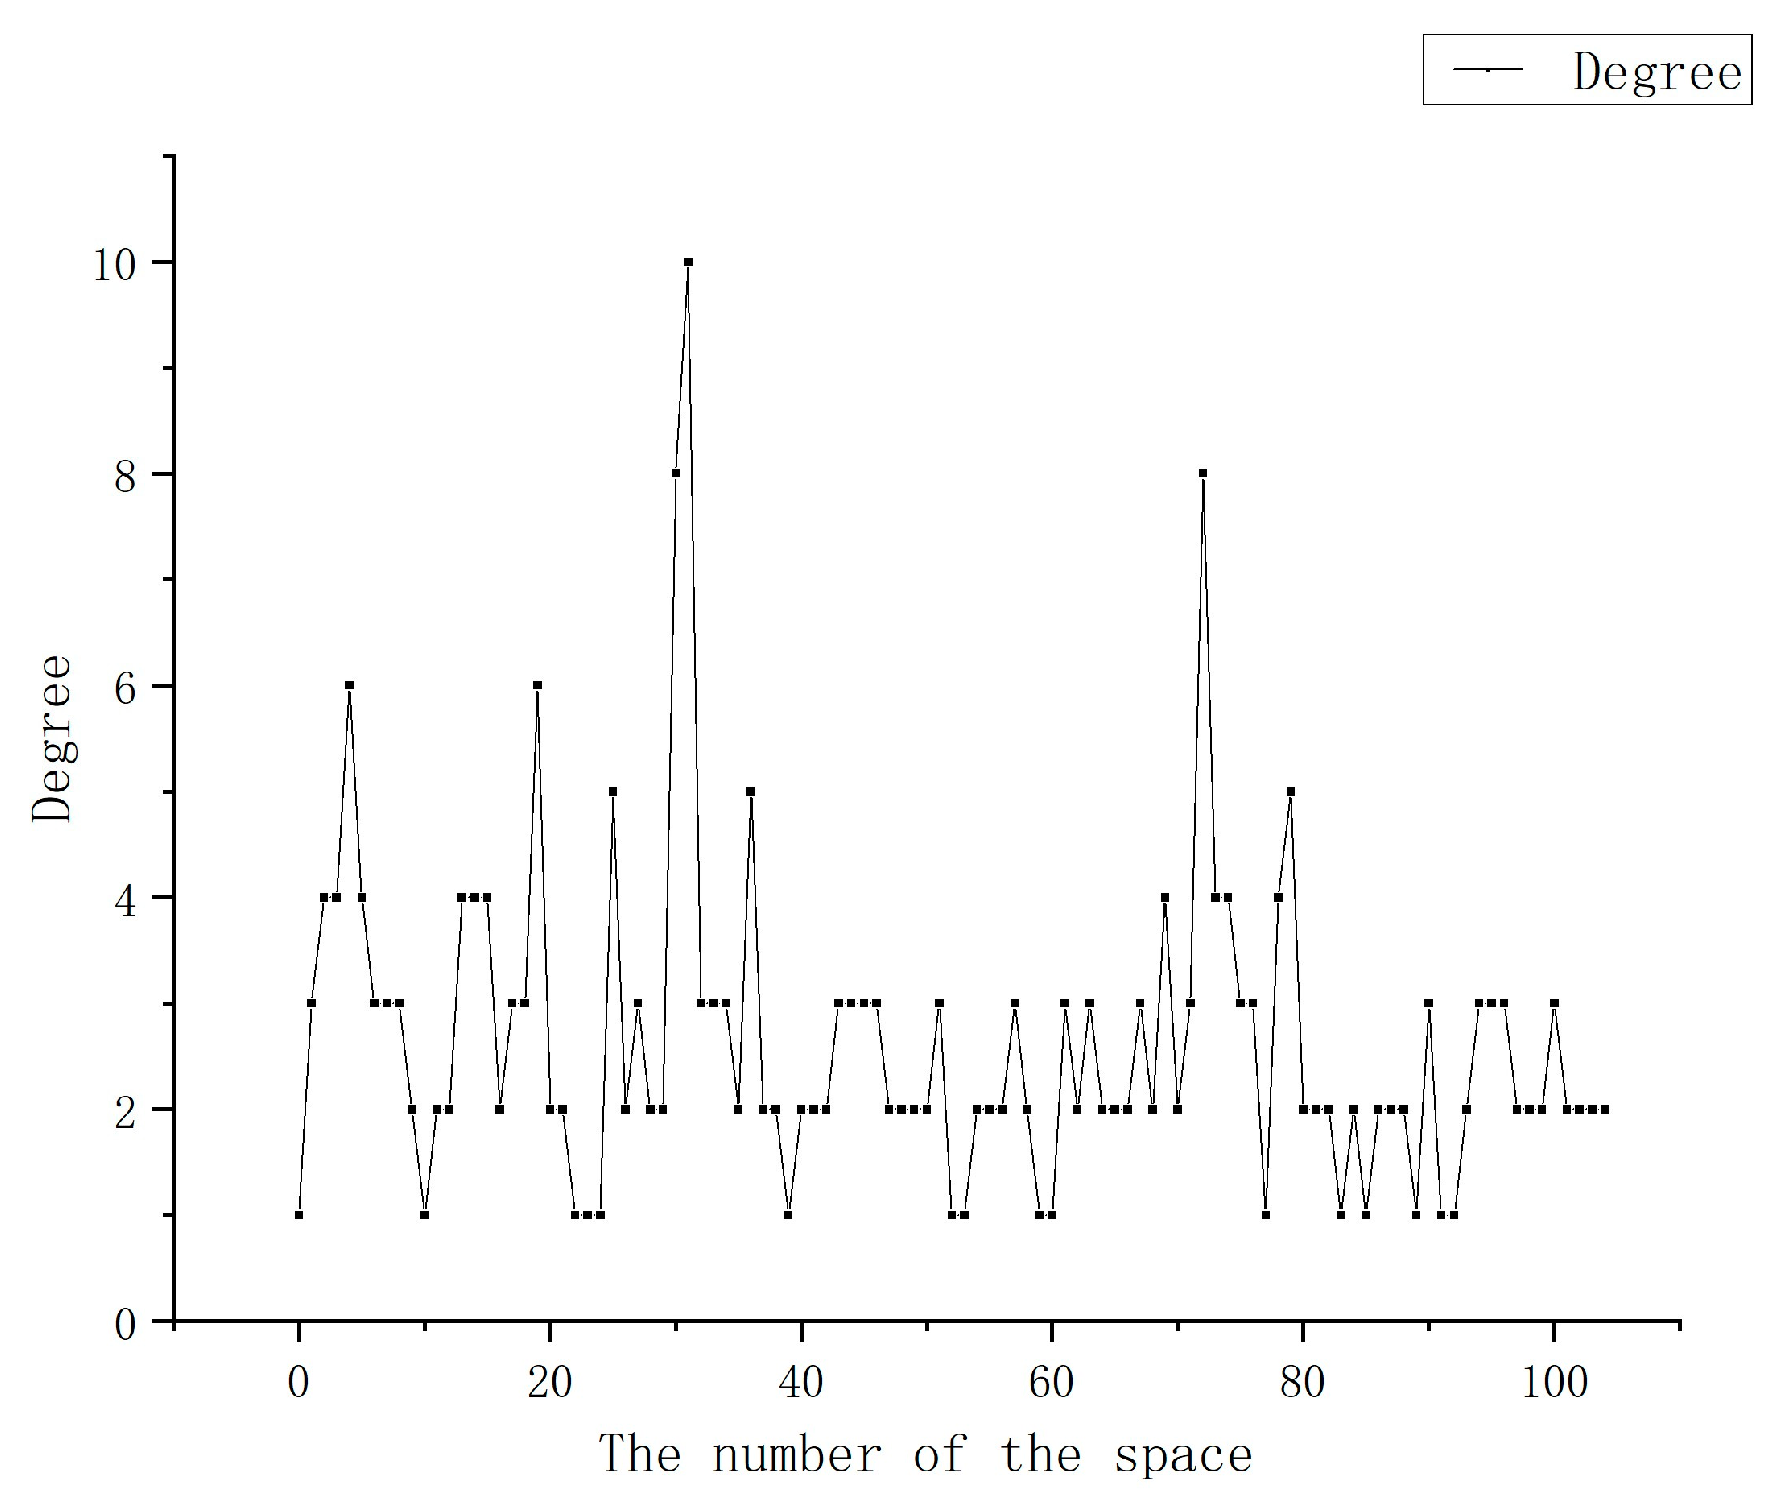
The distribution characteristics of spatial network importance indicators are shown in Figure 10. From the degree distribution map of the internal spaces of the subway station (Figure 11), it is evident that the spatial network of Jin’anqiao Subway Station exhibits distinct heterogeneity. Most spatial nodes have low degrees, with only a few nodes having high degree values. This indicates that the spatial network of Jin’anqiao Subway Station is a typical scale-free network. The cumulative probability fitting results for the spatial network of Jin’anqiao Subway Station (Figure 12) show that it follows a power-law distribution of the form p(k) =1.072 k−1.138, where the power-law exponent is 1.138. This indicates that the spatial network of Jin’anqiao Subway Station has significant scale-free characteristics, reflecting both non-uniformity and network heterogeneity. The network exhibits a cumulative advantage effect, where a small number of key nodes, with higher degree values, occupy core positions in the network and serve as the major connectivity hubs within the space.

Figure 10.
Spatial Importance Indicator. (a) Connectivity (b) Integration (c) Selectivity (d) Step Depth (e) Depth R5.
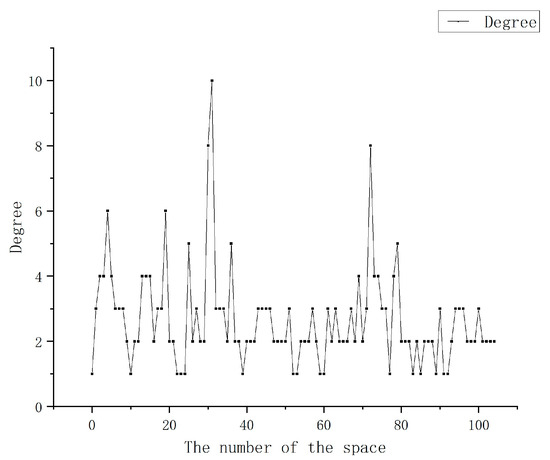
Figure 11.
Spatial degree distribution within the subway station.
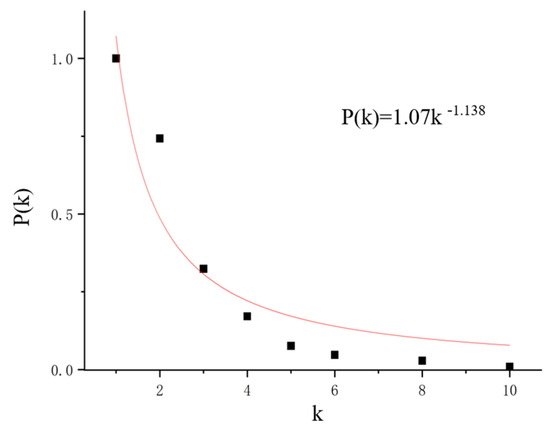
Figure 12.
Cumulative degree probability fitting diagram.
The statistical results show that 32% of the spatial nodes have a degree greater than 2. The node with the highest degree appears in the Line 6 station platform, with a degree of 10, making it the most connected space in the network of Jin’anqiao Station. Additionally, the overall average degree of the Line 6 station platform reaches 3.7, which is the highest average degree among the functional areas of Jin’anqiao Subway Station, reflecting the significant position of this space within the subway station’s spatial network structure.
Table 5 shows the top five spaces in terms of integration and selectivity indicators. Based on the rankings of integration and selectivity indicators, the Line 6 station hall is the most central functional area within the subway station. In particular, space node 30 ranks first in both integration (0.836) and selectivity (1.090), indicating its strong accessibility and path control within the overall network. This space serves as a major hub for the convergence and dispersion of pedestrian flow. Additionally, other spatial nodes in the Line 6 station hall also have high integration, highlighting the importance of this area within the spatial network. It is crucial to further optimize the design and management of this area to enhance its capacity and safety.
Table 5.
Top five spaces in terms of integration and selectivity indicators.
Meanwhile, several spatial nodes in the Line 6–Line 11 transfer channel exhibit high selectivity, indicating that this transfer channel plays a key role as an important passage connecting different functional areas. It occupies a significant position in the pedestrian path network and requires special attention to the passage capacity and safety management to ensure the stability and efficiency of the network’s operation.
(2) Comprehensive Analysis Results of Subway Station Spatial Network
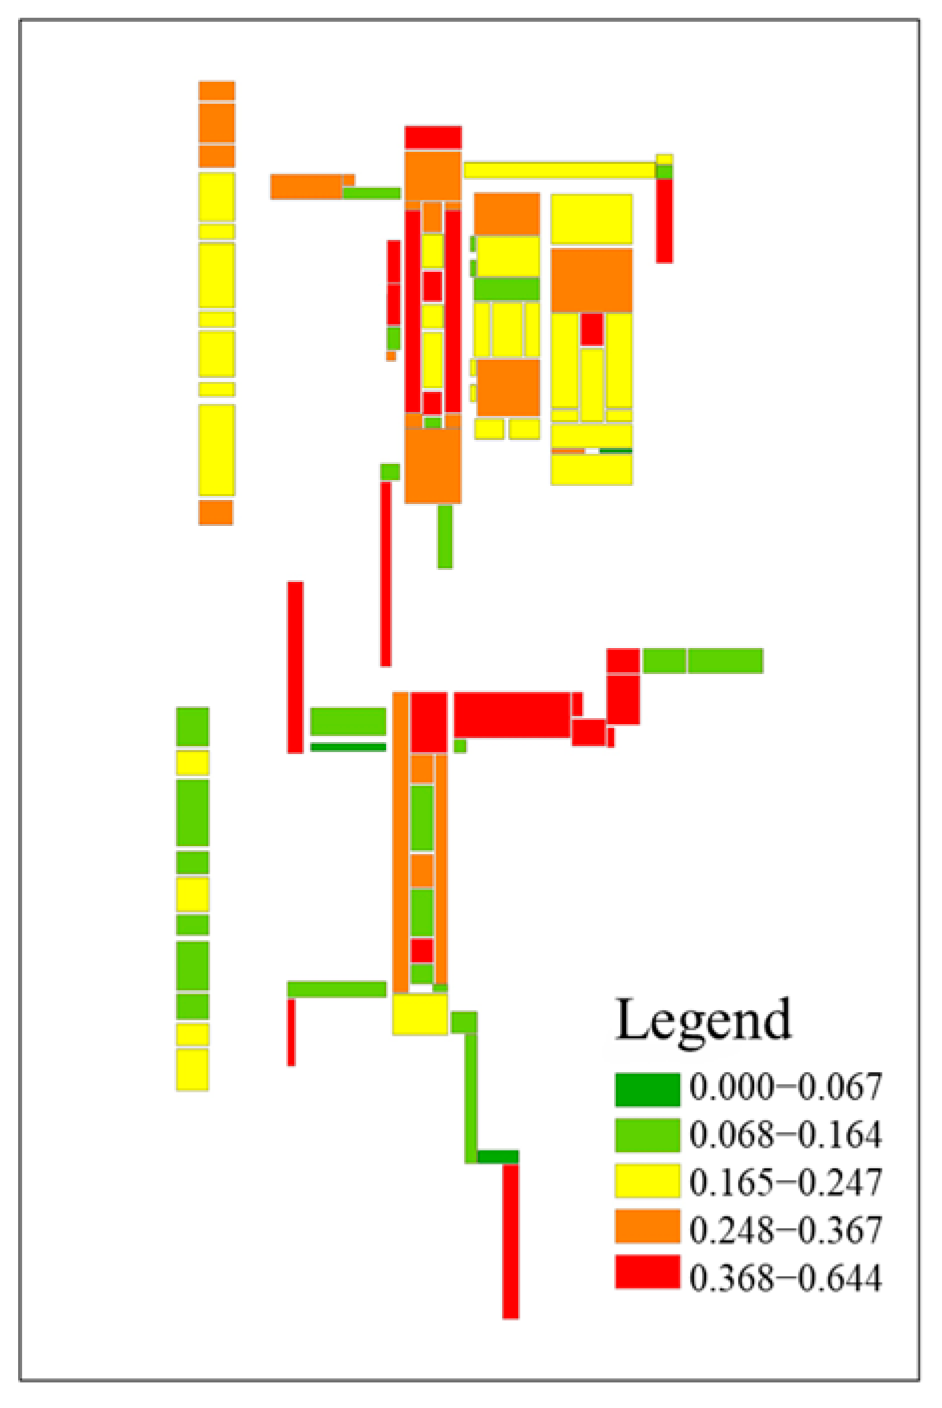
From the spatial network importance distribution map(Figure 13), the Jin’anqiao Subway Station exhibits a clear “core-periphery” structure, with the Line 6 station hall, Line 11 station hall, and the S1-Line 6 and Line 11-Line 6 transfer channels being the most critical hub areas in the network. These three regions account for 75% of the total space where the spatial network importance exceeds 0.48, highlighting their highest importance and central role in pedestrian flow distribution and spatial connectivity. This aligns with previous studies on subway passenger exposure distribution [21,22]. In contrast, the station platforms and entrance/exit edge spaces have relatively lower spatial network importance. It is recommended to prioritize the enhancement of safety management and spatial optimization in core areas to ensure the stability and efficiency of network operation.
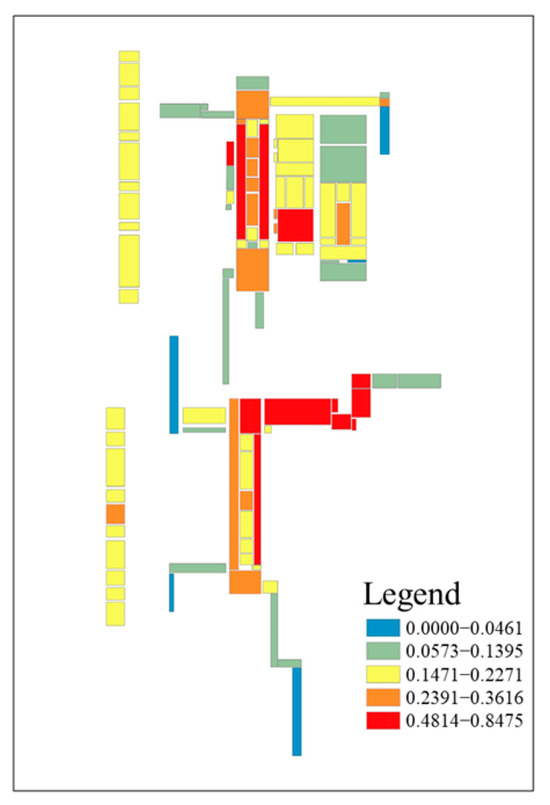
Figure 13.
Spatial Network Importance.
3.2. Subway Spatial Functional Importance Results
The spatial functional importance results (Figure 14) show that the areas with higher functional importance in Jin’anqiao Subway Station are mainly concentrated around certain station halls and entrances/exits. The high importance of these areas is primarily attributed to the spaces where elevators are located. As these areas are independent zones and are almost entirely occupied by the equipment’s projected area, their functional scores are significantly higher than those of other areas. Elevator spaces play a critical role in facilitating vertical pedestrian flow within the subway station, and their high functional importance reflects the station’s heavy reliance on vertical transportation.

Figure 14.
Spatial Functional Importance.
Additionally, areas with moderate functionality are mainly found within certain parts of the station hall, which are relatively large in size but have a lower proportion of equipment. These spaces are mainly used for passenger waiting and short stays. Low-functionality areas are located in the station platforms, which contribute less to the overall operation of the network.
Overall, the distribution of functional importance within the subway station is closely related to space usage and equipment configuration, while also having a significant impact on the distribution of passenger flow. This aligns with the findings of previous research [23]. Therefore, core functional areas require a focus on ensuring equipment operational efficiency and space maintenance, while medium- and low-functional areas can be optimized through design improvements to enhance usage efficiency, ultimately improving the overall operation and service quality of the subway station.
3.3. Flood Accumulation Risk Results for Subway Stations
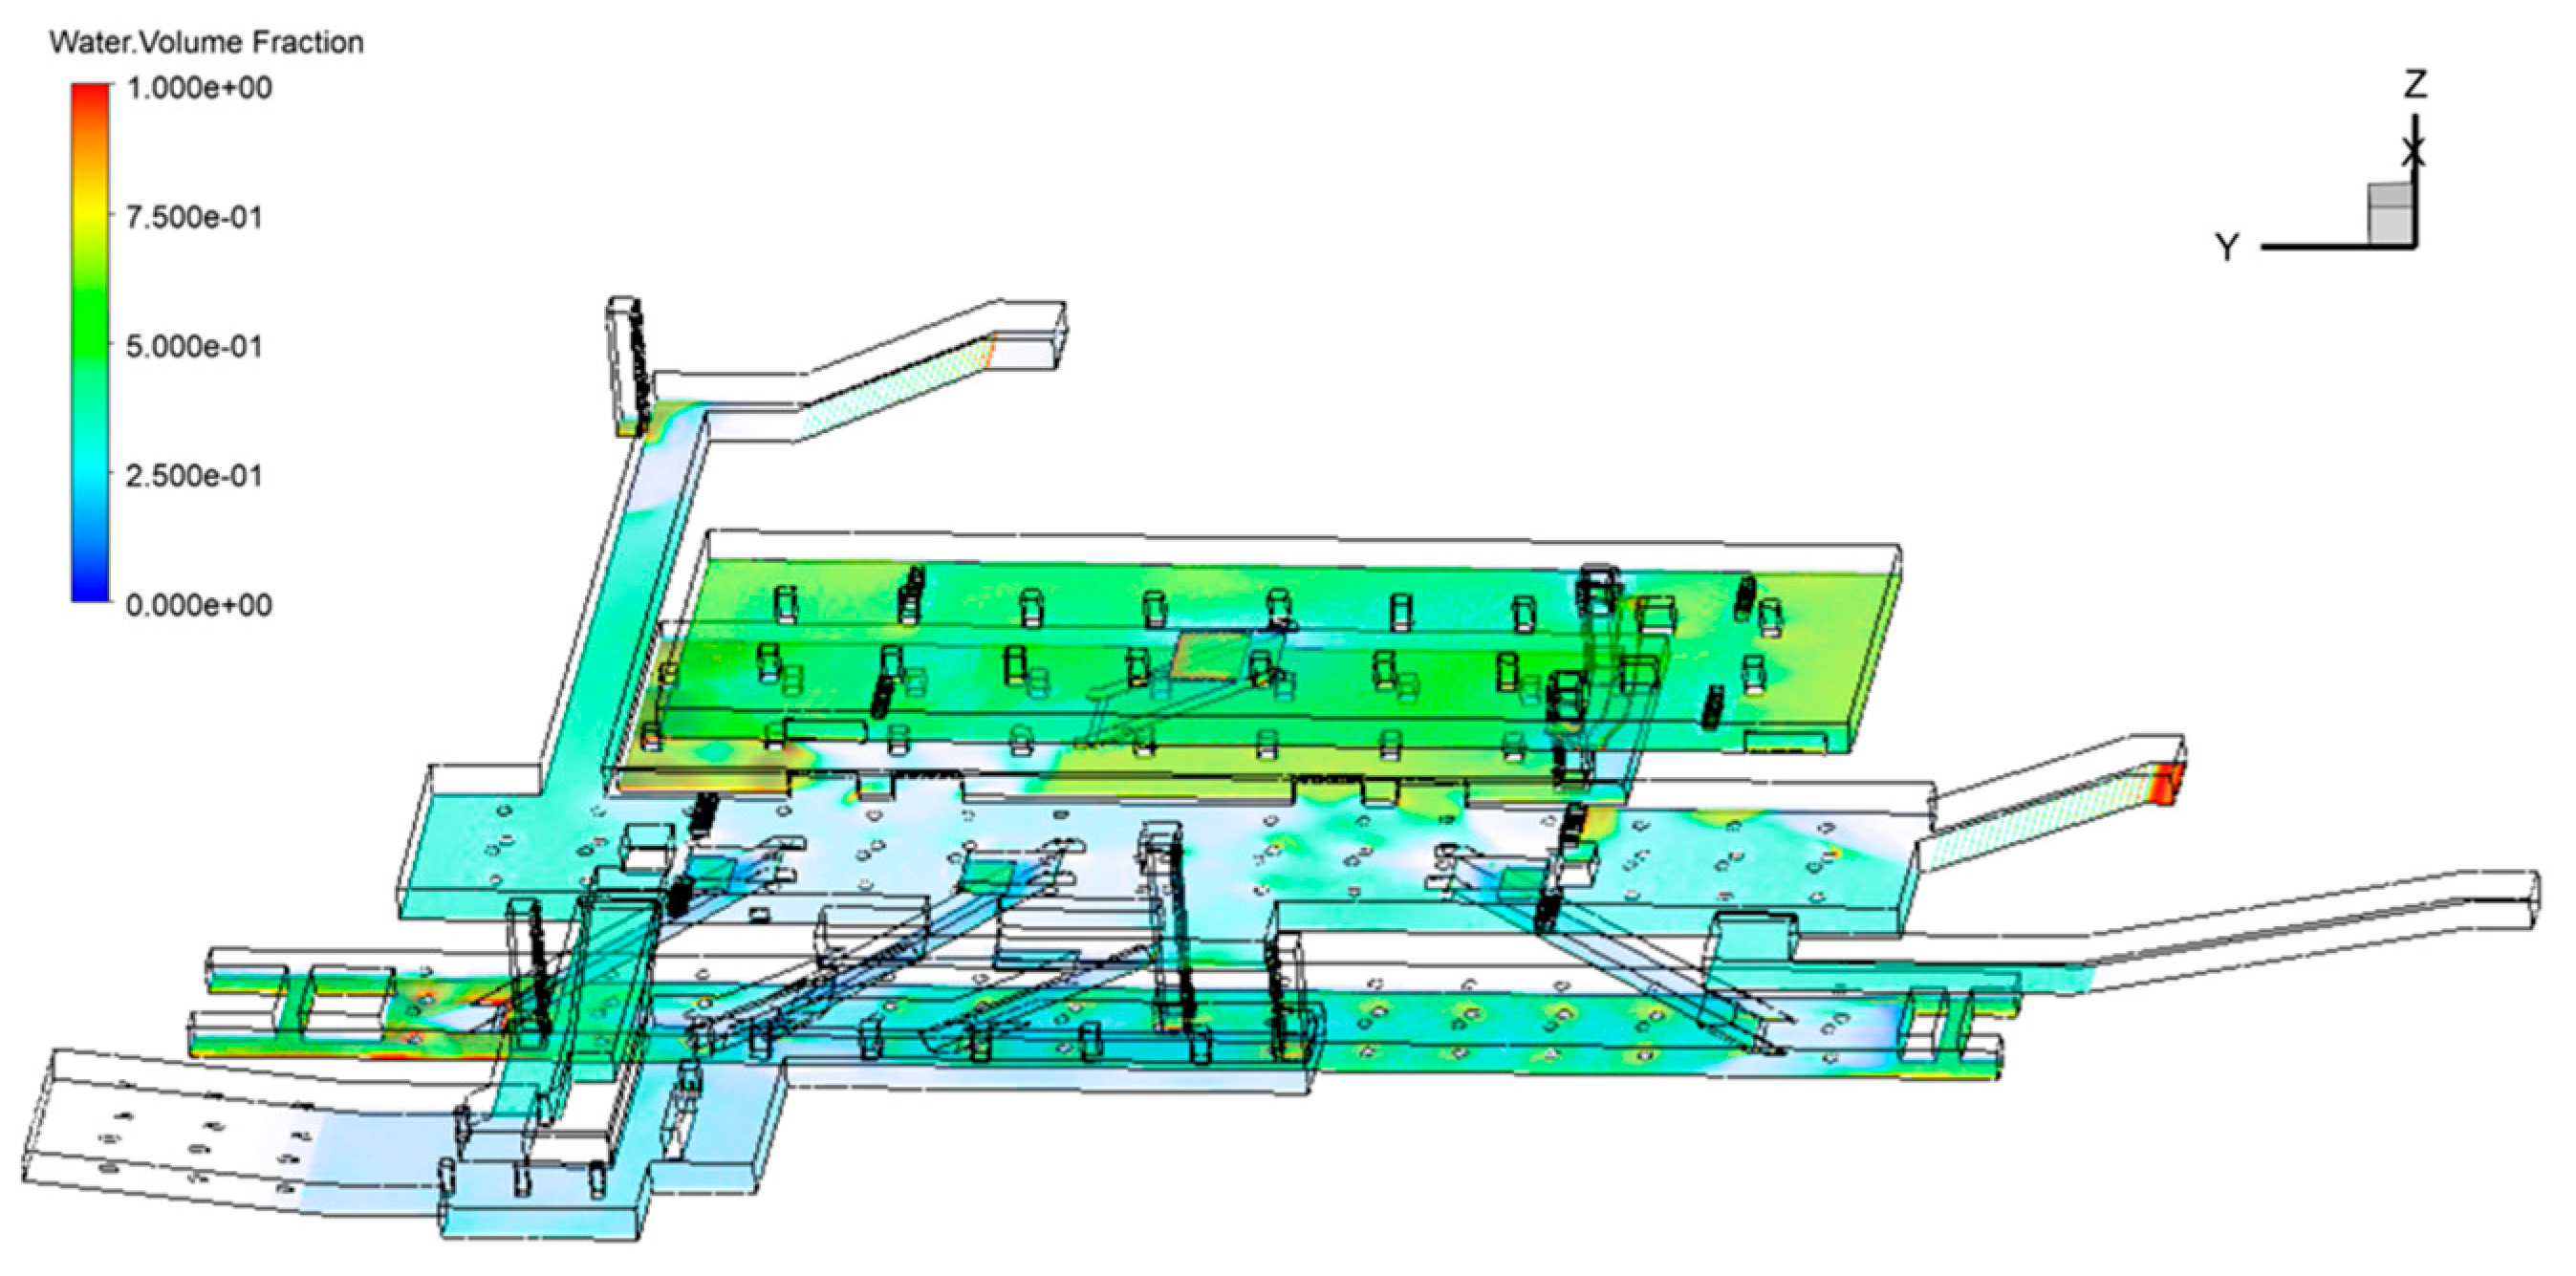
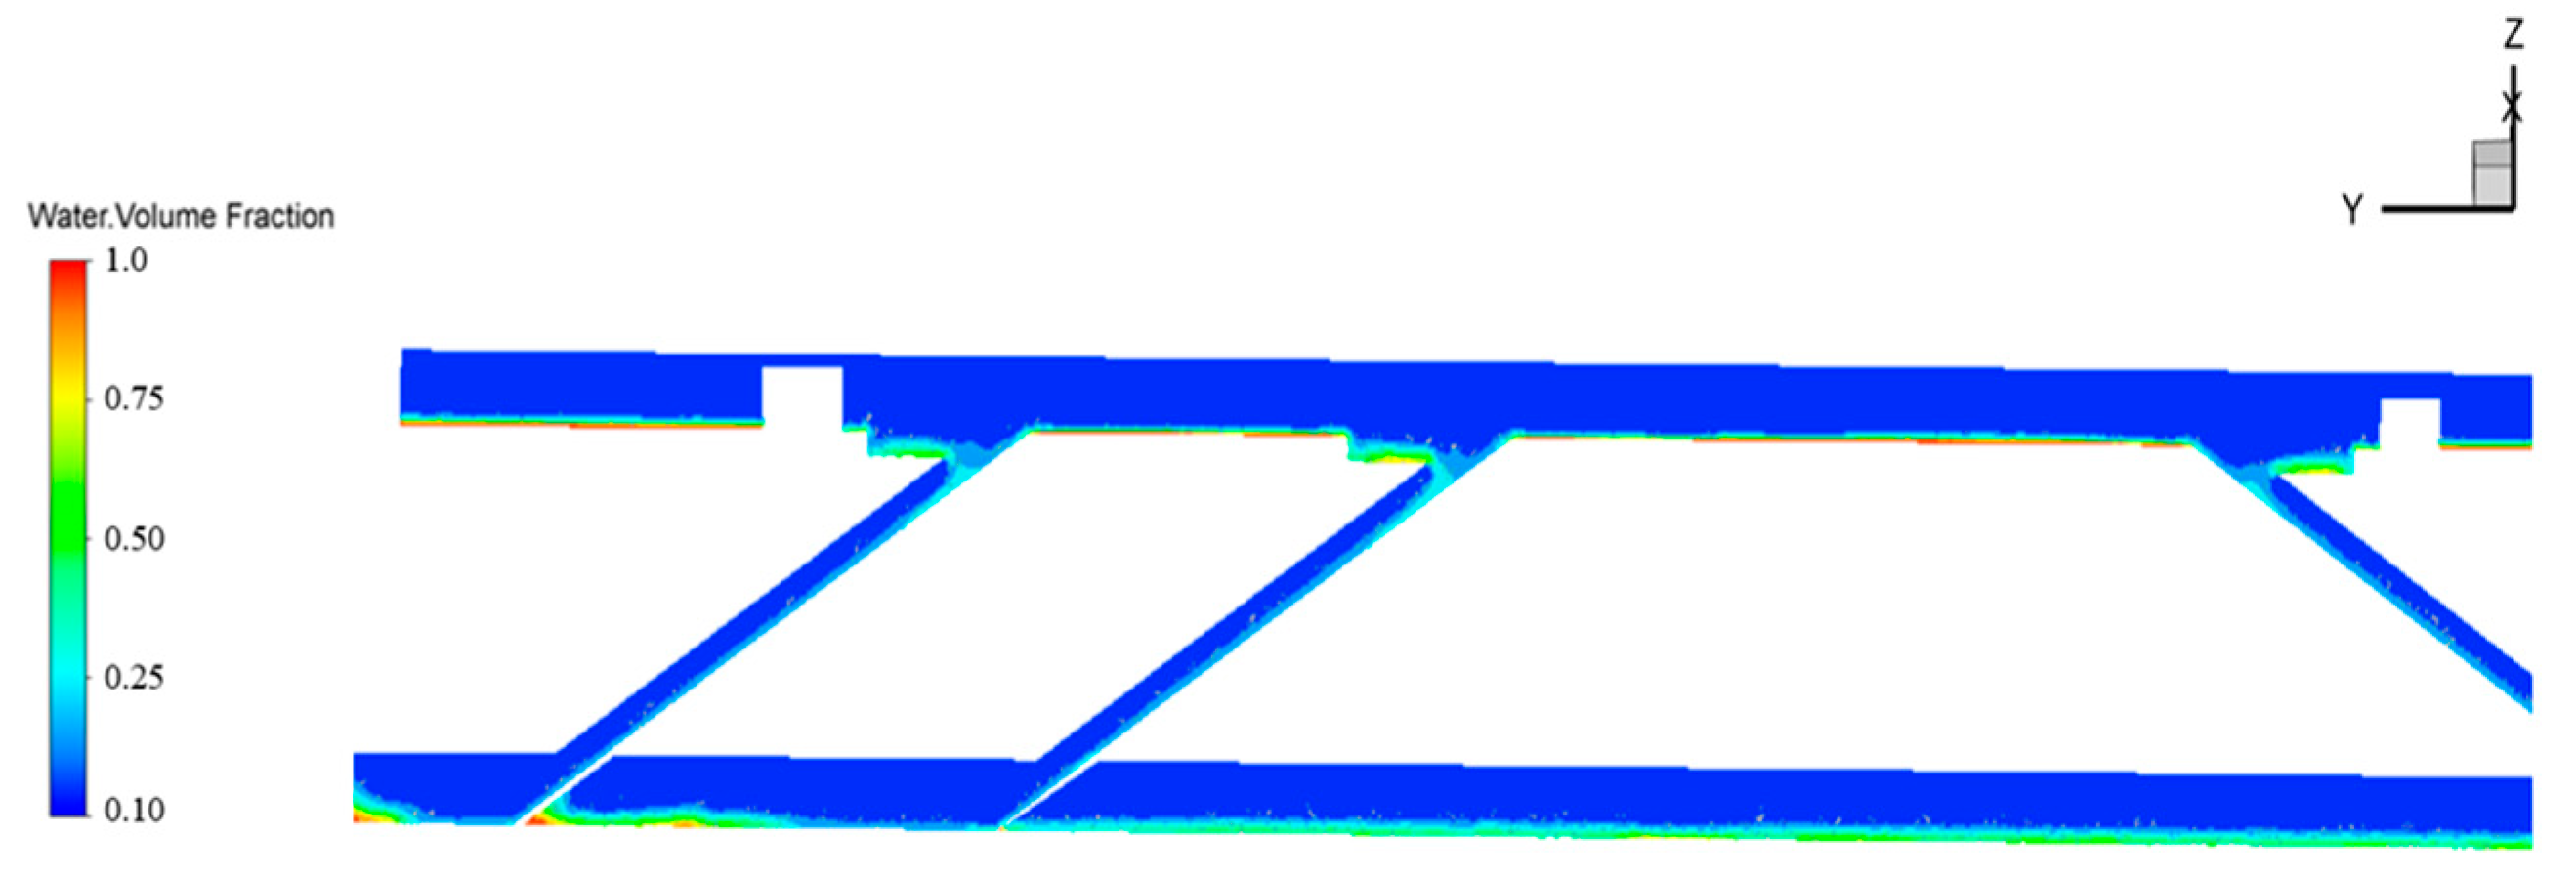
The VOF simulation(Figure 15) results show that the average water depth at Line 6 is 0.45 m. The distribution of water exhibits significant spatial variation, with water accumulation mainly concentrated in the Line 11-Line 6 transfer channel and the Line 6 platform area. The average water depths in these regions are 0.49 m and 0.64 m, indicating that these areas are prone to water accumulation during flood events. Due to the vertical distribution of the subway, spaces on the same level also exhibit varying water distribution, with more accumulation near elevator shafts, junctions of corridors, and lower-lying areas. As shown in the Figure 16, the deepest water accumulation occurs on the west side of the S1-Line 6 transfer channel, with a depth of 1.13 m.
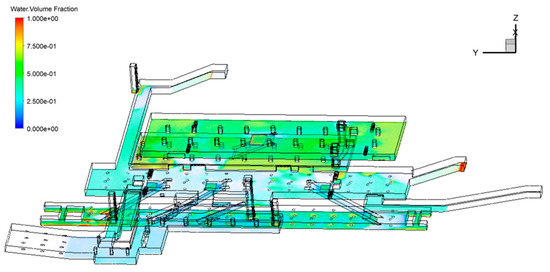
Figure 15.
Flood inundated area of the subway station. (Contour of water volume fraction).
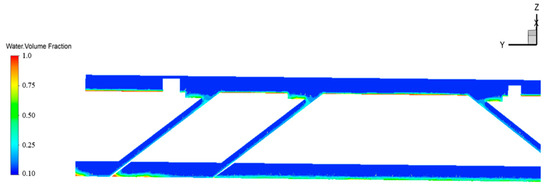
Figure 16.
Flood results of the Line 6 station hall and station platform.
Figure 17 shows the results of the flood accumulation risk. Based on the spatial heterogeneity of flood risk within the subway station, different areas exhibit significant risk level variations due to differences in structural characteristics and functional positioning. The overall flood risk is higher for Line S1 and Line 6, while Line 11 shows a relatively lower risk. Specifically, the concourse level of Line S1, which serves as the main transfer channel and a high passenger flow area, is predominantly concentrated in medium- to high-risk zones. This is likely because the concourse level, as a hub connecting subway entrances/exits and transfer channels, is more susceptible to direct flooding from external sources. Simulation data indicate that under a 20-year rainfall scenario, the average water accumulation depth in this area reaches 0.43 m. On the other hand, the station platform of Line 6 exhibits a high overall risk, with particularly prominent risks in localized areas such as the ends of passageways. Due to the layout of escalators, which creates a water flow guiding effect, more runoff accumulates at the ends of the passages, resulting in a peak water depth of 0.9 m. Based on these simulation results, it is recommended to enhance drainage design in key areas, especially at the ends of passageways, and optimize waterproofing facilities to improve the safety and resilience of the subway station under extreme rainfall conditions.

Figure 17.
Flood accumulation risk results.
Previous studies [24] typically focus on analyzing the process of water intrusion in subway stations over short periods, with results showing that water tends to accumulate in the concourse level during the intrusion process. This is due to the fact that it takes a longer time for water to flow down to the platform level, causing a more noticeable accumulation in the concourse in a shorter time. In contrast, this study emphasizes the analysis of the impact of long-duration flooding intrusion on the distribution within the subway station, aiming to reveal the final distribution of water accumulation in different functional areas of the subway station.
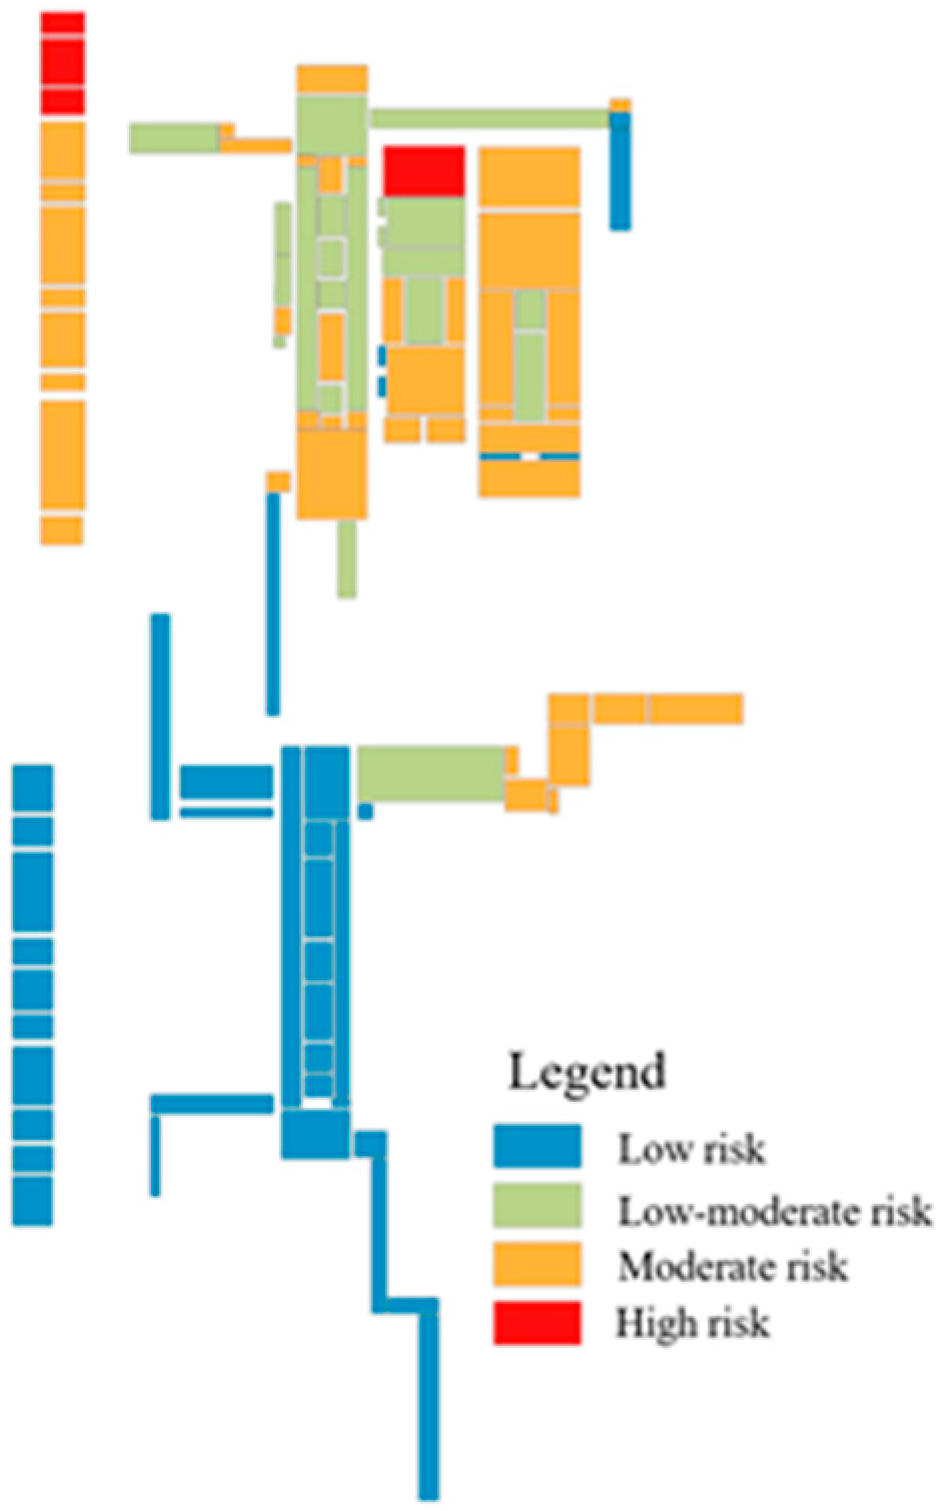
3.4. Flood Management Level Results for Subway Spaces
Table 6 shows the proportion of each result in the Flood Risk Management Level. The natural breaks method is used to categorize the flooding risk management levels into five distinct levels.
Table 6.
Flood risk management level.
Figure 18 shows the distribution results of the Flood Risk Management Levels. The space with the highest flooding risk management index is located in the S6–S11 transfer channel, with a flooding risk index of 0.64, significantly higher than the second-highest index of 0.48 in the S6 station concourse. This is primarily due to its high spatial importance index of 0.65, as it is situated at the junction of two lines, serving as a critical hub in the passenger flow network. Additionally, its spatial functionality index of 0.68 reflects a high density of facilities, mainly supporting vertical transportation and passenger flow distribution. VOF simulation results further reveal that under a 180-min rainfall scenario, the water accumulation depth reaches 0.37 m, indicating a relatively high flooding risk. As a result, this space plays a vital role in ensuring the normal operation of the subway station.
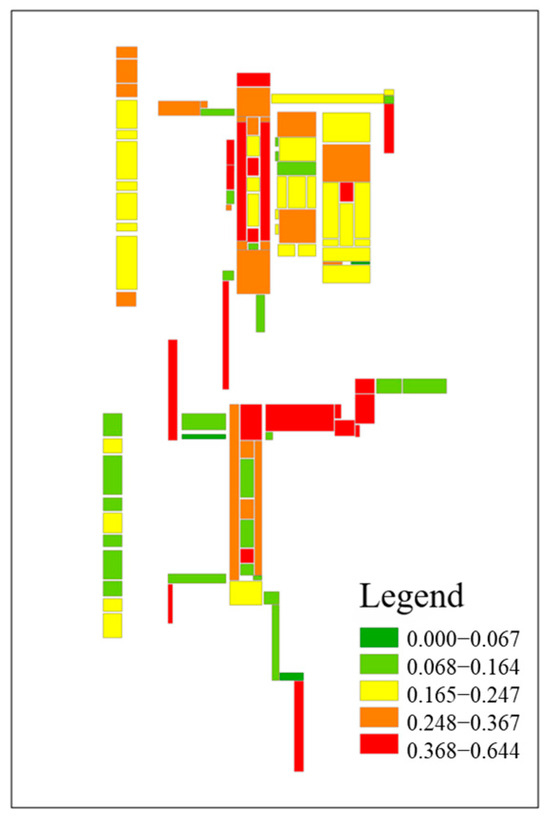
Figure 18.
Flood Risk Management Levels.
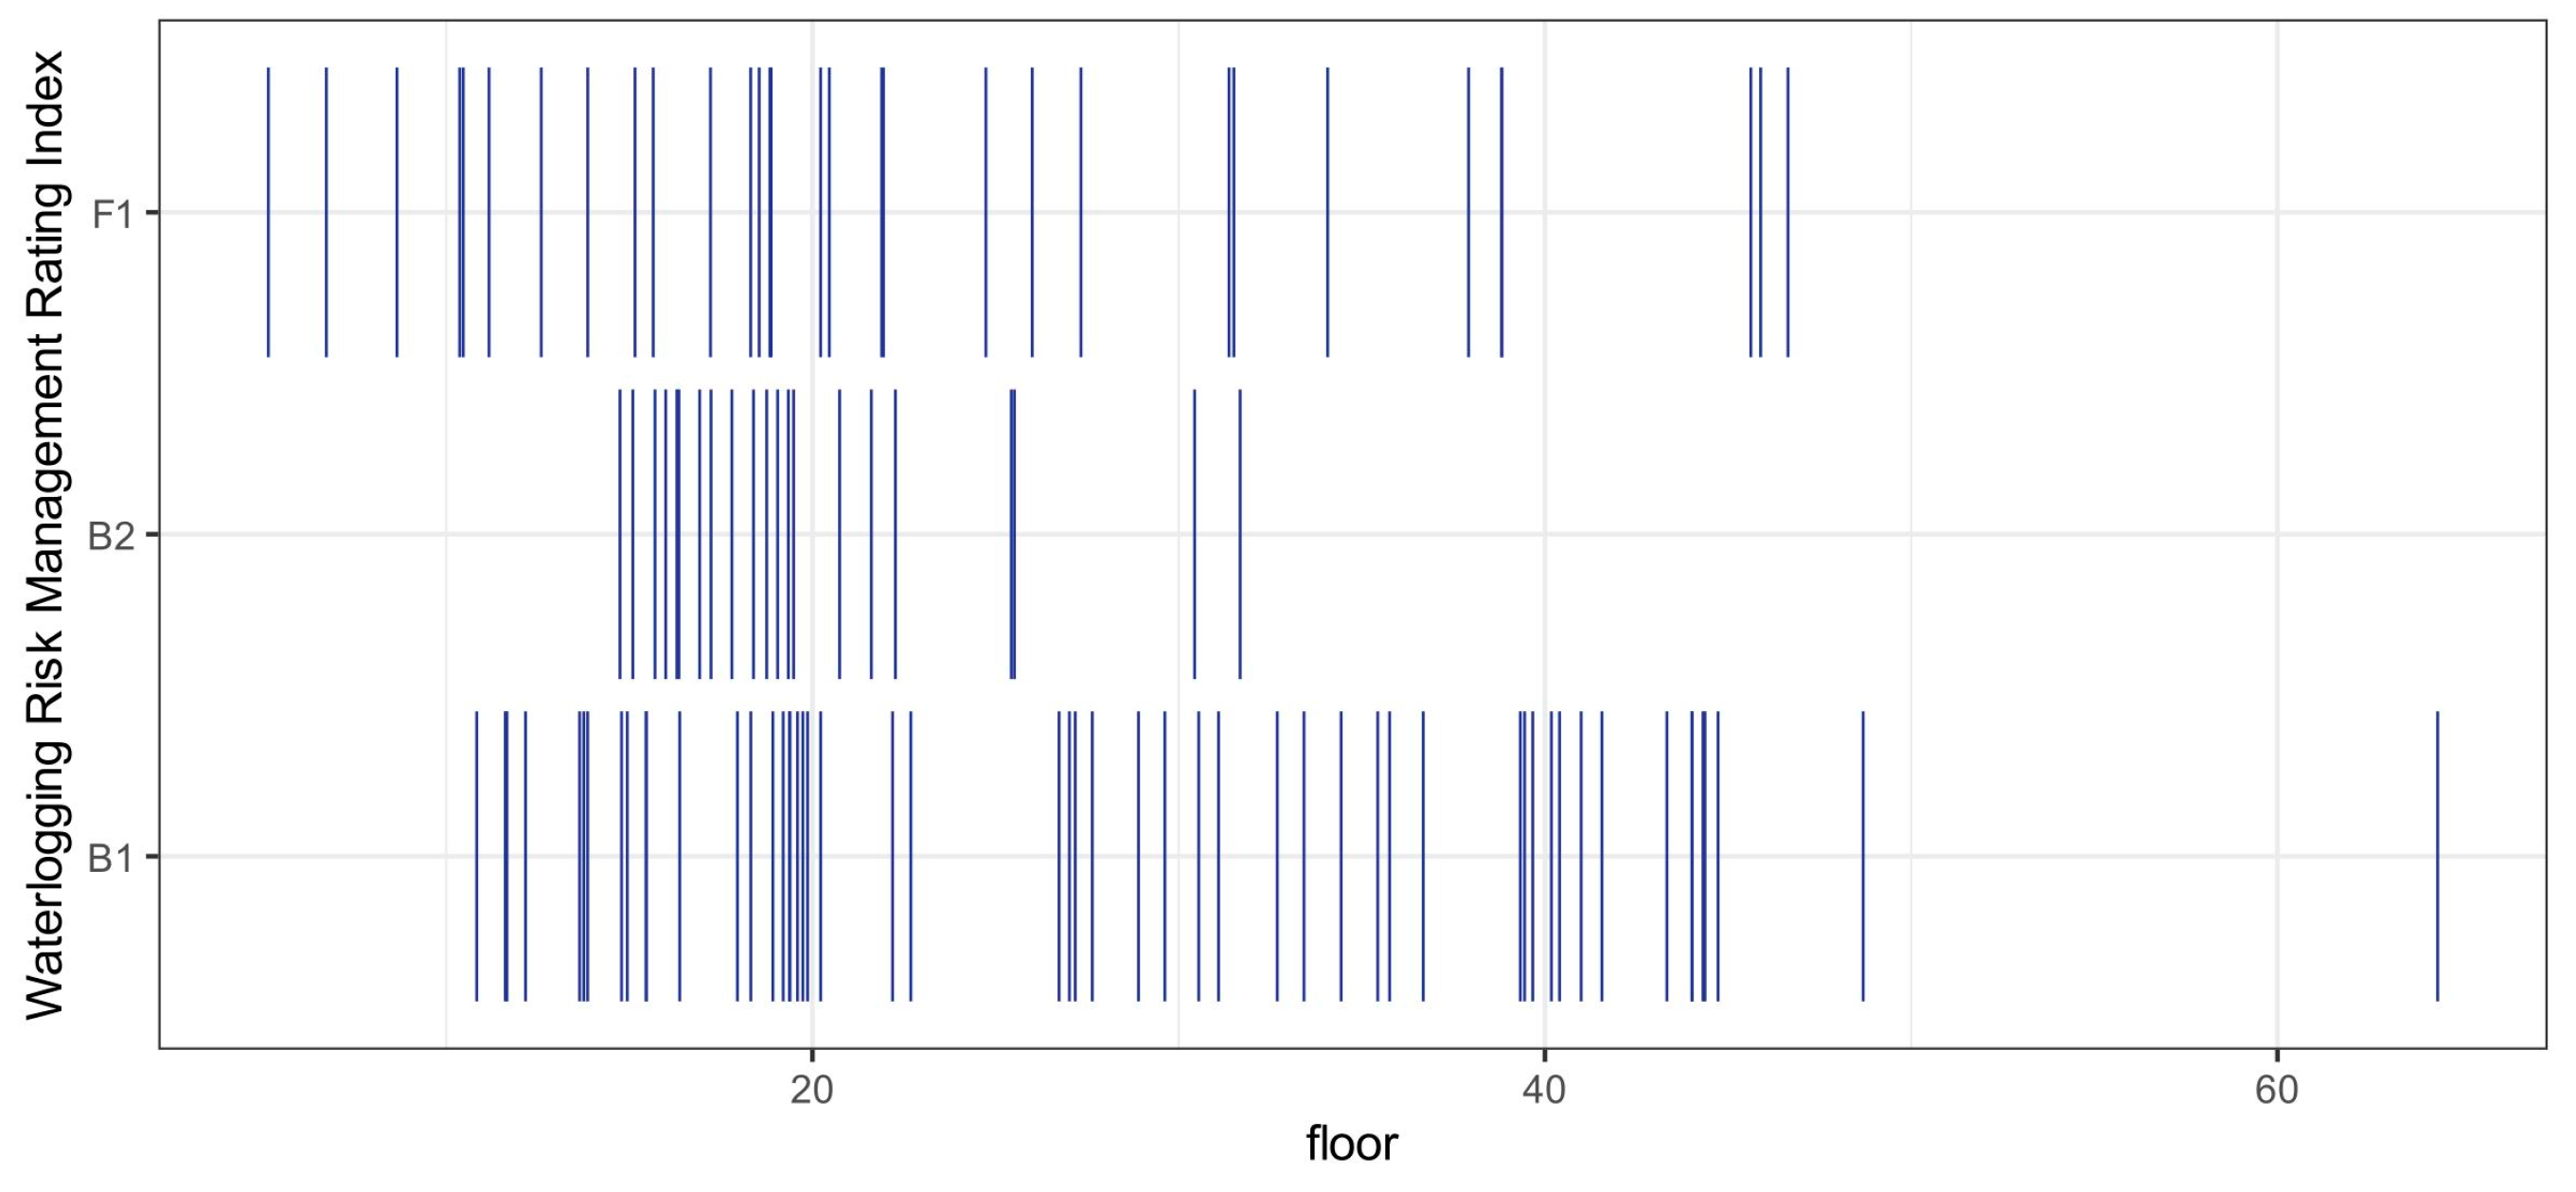
(1) Analysis of flood risk management across different subway floors
Jin’anqiao subway station has four floors, including two above ground and two underground. Since the second above-ground floor is less affected by flood, this study focuses on the analysis of the flood risk management levels for the ground floor, the first underground floor, and the second underground floor. The first floor contains 31 spaces, the first underground floor contains 53 spaces, and the second underground floor contains 21 spaces. There are differences in the spatial distribution of flood risk management indices across different floors, as shown in Figure 19 The risk management level distribution on the F1 floor (ground floor) is relatively uniform, with higher-risk areas primarily at the entrances and exits, where the average flood risk management index is 0.231. The risk management level distribution on the B1 floor (first underground floor) is higher, with higher-risk areas more concentrated, and the average flood risk management index is 0.283. On the B2 floor (second underground floor), the risk management level is mostly at middle to low levels, but there are still a few higher-risk areas, and the average flood risk management index is 0.199.
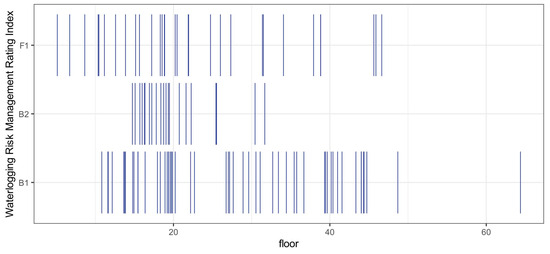
Figure 19.
Distribution of Flood Risk Management Levels on Different Floors.
Figure 20 shows the distribution characteristics of different subway station floors across the three indicators. The data points on the F1 floor (ground floor) are concentrated in areas with higher functionality, reflecting the floor’s main role in evacuation, transportation, and service functions. The points on the B1 floor (first underground floor) are more scattered, with some spaces having higher network importance. The distribution of points indicates that this floor serves as a hub connecting the ground and underground, providing crucial traffic transfer functions for passengers. Some spaces have higher functionality due to the presence of equipment such as turnstiles and ticket machines. The point distribution on the B2 floor (second underground floor) is more balanced, with higher flood risk and relatively weaker network importance.
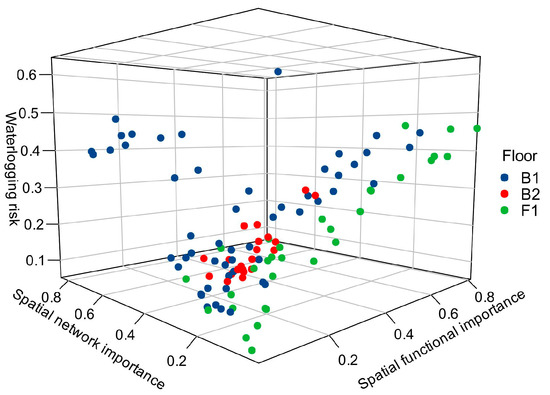
Figure 20.
Distribution of Flood Risk Management Indicators on Different Floor Spaces.
(2) Analysis of flood risk management levels in different functional areas of the subway
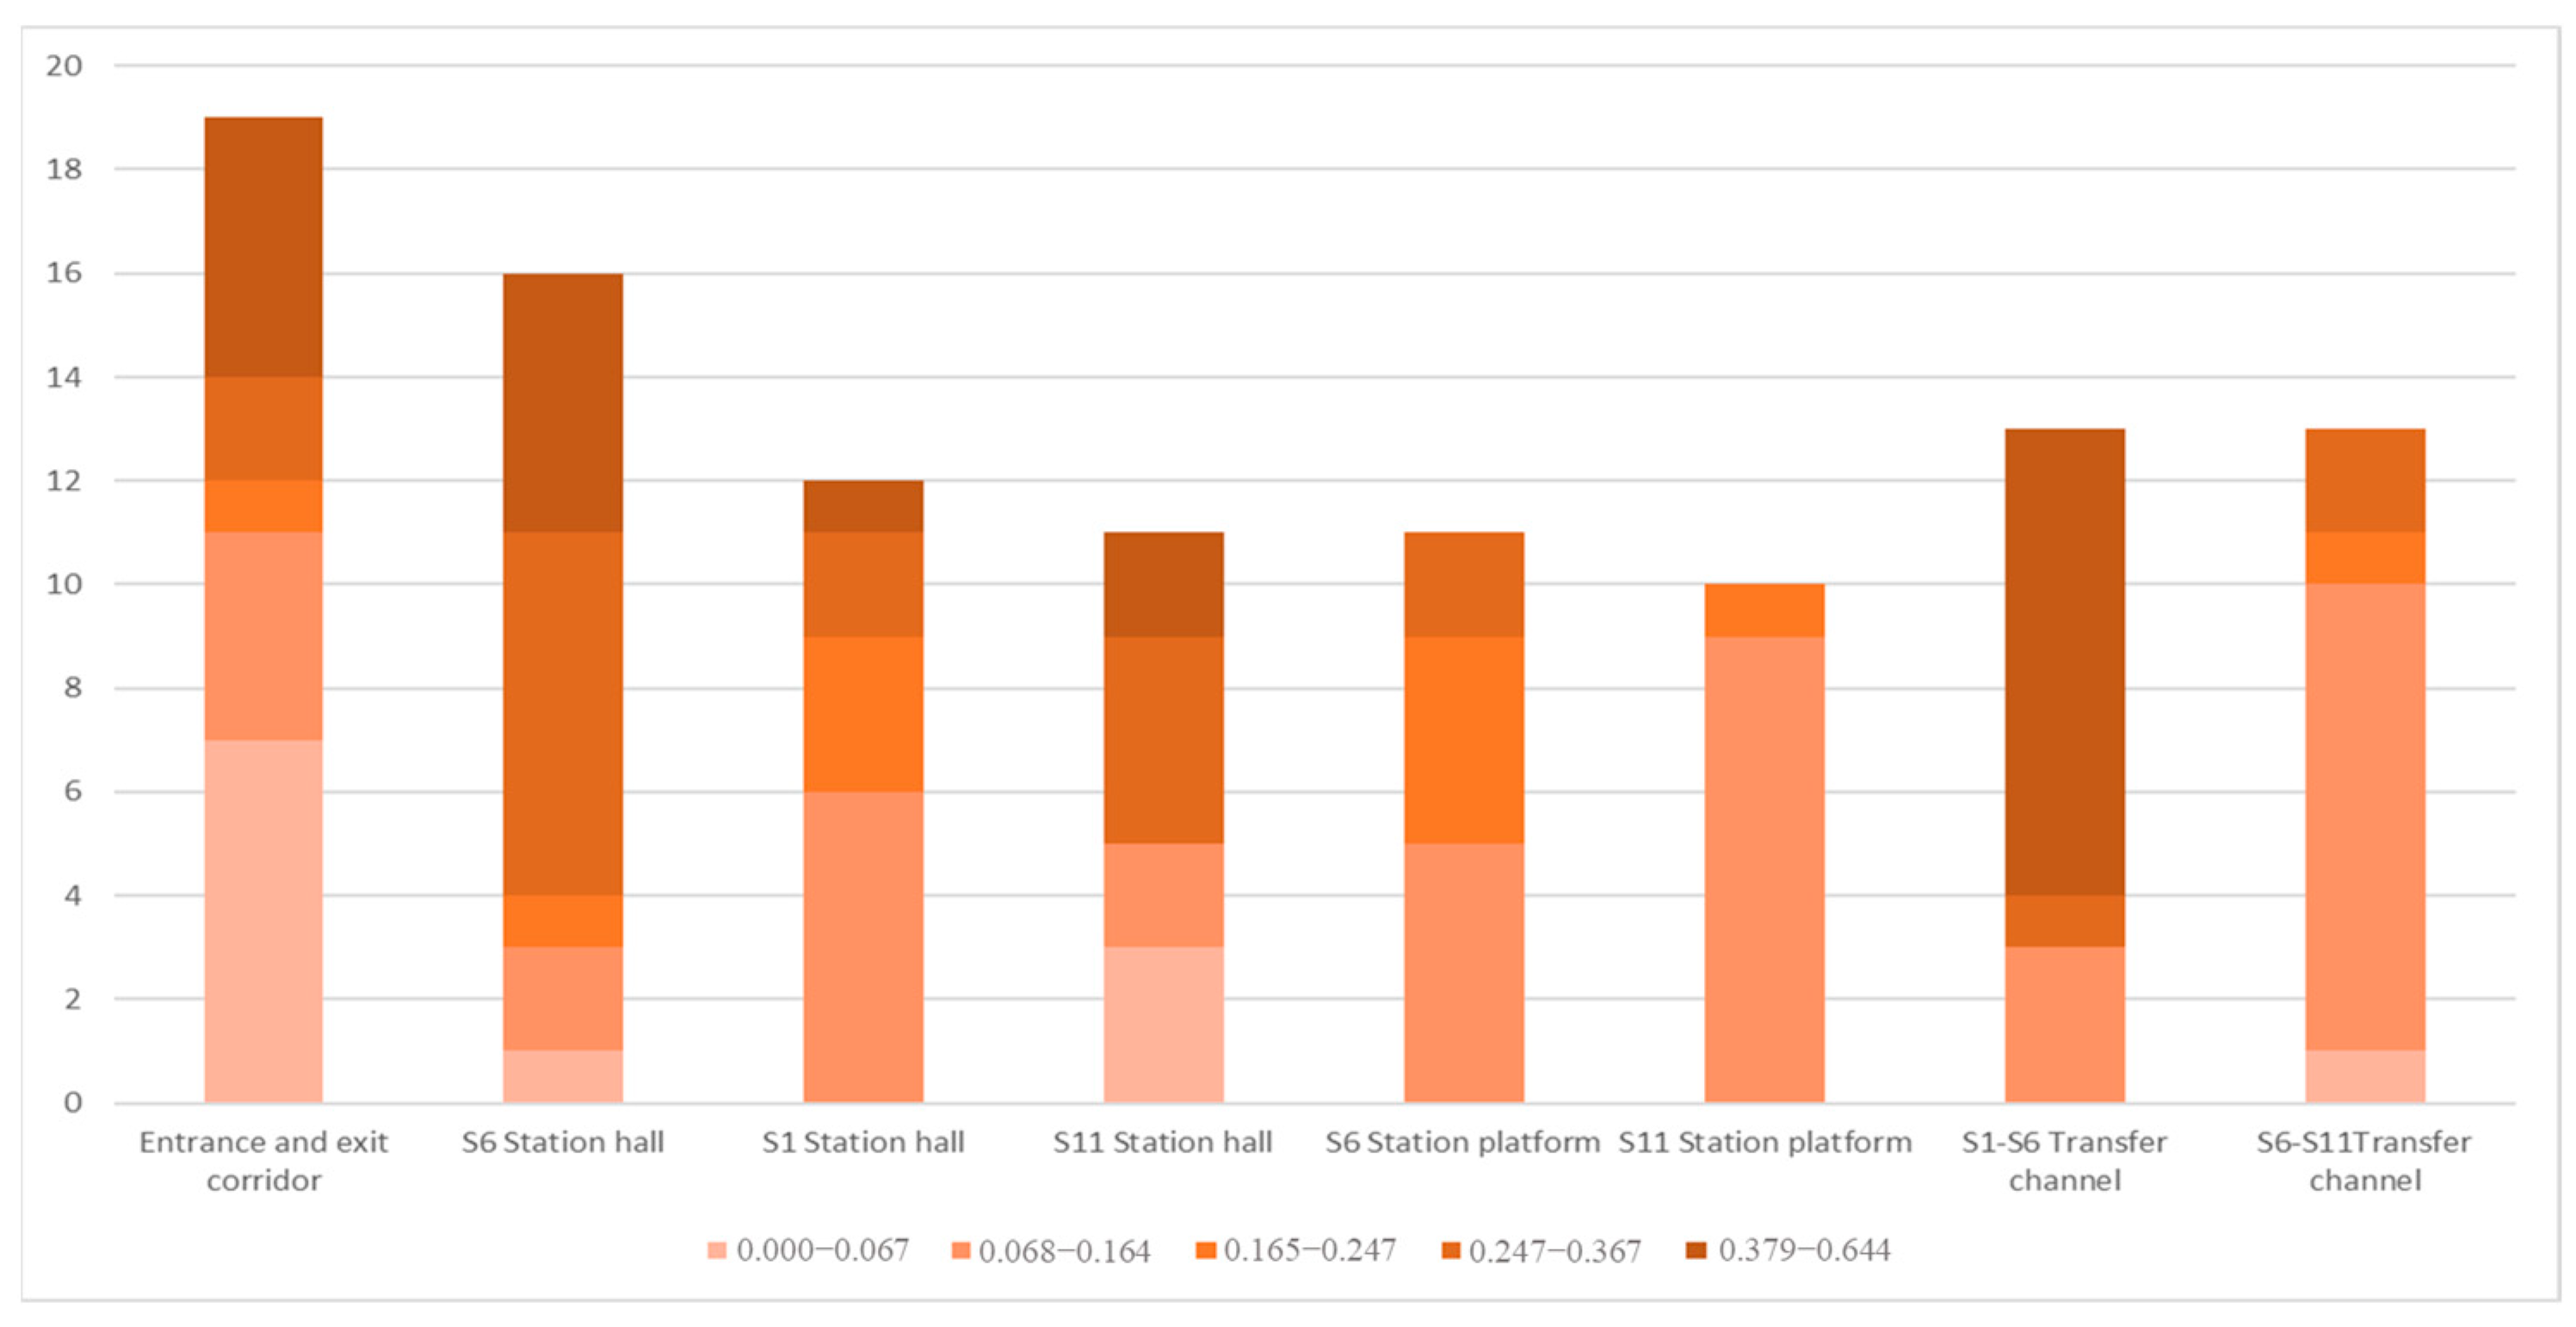
The Jin’anqiao subway station can be divided into eight functional areas: the S1 concourse level, the Line 6 concourse level, the Line 6 platform level, the Line 11 concourse level, the Line 11 platform level, the entrance and exit passage, the Line 6-Line 11 transfer channel, and the S1-Line 6 transfer channel. Figure 21 shows the distribution of flood risk management levels different functional zones.

Figure 21.
Distribution of flood risk management levels on different functional zones.
For the entrance and exit transfer channels, the risk distribution is relatively even, but the proportion of high-risk areas is higher, indicating that this region contains spaces that need attention in flood management. This might be due to a significant proportion of elevators within the entrances and exits. Additionally, as these areas connect the surface to the underground, they are under considerable flood pressure and are potential high-risk zones.
Station platform levels: The risk distribution on the Line 6 station platform is mainly at medium to high levels, with a significant proportion of high-risk areas. This reflects the complexity of the functions in this region and the high foot traffic, which creates greater pressure for flood management. Although the S1 station platform also has a significant proportion of medium- to high-risk areas, it is located on the surface, whereas the Line 6 station platform is on the underground level, leading to an overall risk level slightly lower than that of the Line 6 station platform.
The Line 11 station platform’s risk is mainly concentrated in medium to low levels, indicating a more stable flood management situation, though there are a few high-risk areas, suggesting that key areas still require optimization design to further reduce the potential impact of water accumulation.
Station platform levels (Line 6 station platform and Line 11 station platform): The overall risk level on the station platforms is relatively low, with fewer high-risk areas, indicating that these areas are relatively independent and the risk of flood is small. However, the risk distribution on the Line 6 station platform is more concentrated, requiring improvements in drainage capacity and monitoring optimization for its localized areas.
Transfer channel areas (S1-Line 6 transfer channel and Line 6-Line 11 transfer channel): The risk level in the transfer channel areas is generally higher, particularly in the S1-Line 6 transfer channel, where high-risk areas account for the largest proportion. This is closely related to the network importance of the transfer channel spaces, making them key focal points for flood management.
4. Conclusions
Due to the frequent occurrence of extreme rainfall events, subway stations face significant flood threats, posing a serious risk to the efficient operation of urban rail transit systems. This study focuses on the Jin’anqiao subway station in Beijing and proposes a spatial importance-based analysis method to assess the flood risk management level of subway stations. The main findings of the research are as follows:
(1) This study focuses on analyzing the network importance, functional importance, and flood risks within subway station spaces. The analysis of network importance reveals that major cross-passages and critical entry/exit points in the spatial network are high-risk areas during flood events. These findings suggest that other stations should prioritize highly connected regions in risk assessments, identify critical risk nodes through topological analysis, and optimize flood prevention facility configurations based on actual spatial layouts. Compared to other studies that mainly use single-factor models for risk assessment, this study provides a new research approach and perspective by considering the interplay between spatial layout and flood vulnerability.
(2) The analysis of functional importance indicates that major functional areas within the subway station play a crucial role in flood risk management. These areas not only accommodate a high volume of passenger flow but also rely on effective drainage capacity and emergency evacuation routes, which directly impact the efficiency and safety of flood response. Moreover, the excessive concentration of equipment and functional units may increase disaster vulnerability. Therefore, it is recommended that other subway stations adopt a decentralized layout strategy during the design phase, ensuring the spatial separation of critical equipment. Additionally, strengthening flood protection measures in these functional areas is essential for enhancing the overall resilience of subway stations.
(3) In the flood risk analysis, we used VOF (Volume of Fluid) simulation to analyze the water accumulation depth and distribution under a 20-year event scenario. The results show that spatial importance and functionality are highly correlated with flood risk, with high-risk areas typically concentrated in regions with strong connectivity and significant functional importance.
(4) A method based on complex network theory was proposed, which comprehensively considers the importance of the subway space network, functional importance, and flood risk to determine the flood risk management level of subway stations. The analysis shows that there are 22 primary flood risk management stations in Beijing. High-risk areas are mainly concentrated in certain station halls, entrances/exits, and transfer channels. These findings emphasize the importance of prioritizing the management of key areas and also highlight the need for the establishment of comprehensive emergency plans and resource allocation mechanisms to improve the subway station’s disaster prevention capability under extreme weather conditions. Despite these advancements, limitations exist in terms of model generalization to other metro stations with different layouts. Future research could extend this methodology to a broader range of urban subway systems, testing the applicability of the proposed framework in areas with varying infrastructure and flood-prone characteristics.
Author Contributions
Y.L.: conceptualization, methodology, formal analysis, writing—original draft. X.X.: methodology, data curation, formal analysis. Y.G. and Z.L.: methodology, writing—review and editing. S.H.: data curation, formal analysis. X.D.: conceptualization, methodology. All authors have read and agreed to the published version of the manuscript.
Funding
This research was funded by the National Key R&D Program of China (Grand No. 2022YFC3800500) and the Project of Construction and Support for High-Level Innovative Teams of Beijing Municipal Institutions (BPHR20220108).
Data Availability Statement
The data presented in this study are available on request from the corresponding author.
Conflicts of Interest
Yan Li, Xinxin Xu, Shaoxuan Hou, Xin Dang, Zhuolun Li, Yongwei Gong have no relevant financial or non-financial interests to disclose.
References
- Tabari, H. Climate change impact on flood and extreme precipitation increases with water availability. Sci. Rep. 2020, 10, 13768. [Google Scholar] [CrossRef]
- Gonzva, M.; Barroca, B.; Gautier, P.-É.; Diab, Y. Modeling disruptions causing domino effects in urban guided transport systems faced by flood hazards. Nat. Hazards 2016, 86, 183–201. [Google Scholar] [CrossRef]
- Li, M.; Kwan, M.-P.; Yin, J.; Yu, D.; Wang, J. The potential effect of a 100-year pluvial flood event on metro accessibility and ridership: A case study of central Shanghai, China. Appl. Geogr. 2018, 100, 21–29. [Google Scholar] [CrossRef]
- Ruettger, K.; Lenz, W. (P2-40) Patient Allocation to Hospitals During Mass-Casualty Incidents. Prehosp. Disaster Med. 2011, 26, s148–s149. [Google Scholar] [CrossRef]
- Jiao, L.; Zhu, Y.; Huo, X.; Wu, Y.; Zhang, Y. Resilience assessment of metro stations against rainstorm disaster based on cloud model: A case study in Chongqing, China. Nat. Hazards 2023, 116, 2311–2337. [Google Scholar] [CrossRef]
- Junfeng, C.; Le, W.; Yiqi, Z.; Fucai, H.; Maohua, Z. Lessons and improvements: Subway waterlogging catastrophe in Zhengzhou, China. Tunn. Undergr. Space Technol. 2024, 144, 105541. [Google Scholar] [CrossRef]
- Xu, F.; Fang, D.; Chen, B.; Wang, H. Resilience assessment of subway system to waterlogging disaster. Sustain. Cities Soc. 2024, 113, 105710. [Google Scholar] [CrossRef]
- Wang, G.; Liu, L.; Shi, P.; Zhang, G.; Liu, J. Flood Risk Assessment of Metro System Using Improved Trapezoidal Fuzzy AHP: A Case Study of Guangzhou. Remote Sens. 2021, 13, 5154. [Google Scholar] [CrossRef]
- Liu, T.; Chen, Z.; Yuan, Y.; Shao, X. Fragility analysis of a subway station structure by incremental dynamic analysis. Adv. Struct. Eng. 2016, 20, 1111–1124. [Google Scholar] [CrossRef]
- Liu, J.; Zheng, W.; Li, H.; Chen, J. Evaluation of Flooding Disaster Risks for Subway Stations Based on the PSR Cloud Model. Sustainability 2023, 15, 15552. [Google Scholar] [CrossRef]
- Lyu, H.-M.; Shen, S.-L.; Yang, J.; Yin, Z.-Y. Inundation analysis of metro systems with the storm water management model incorporated into a geographical information system: A case study in Shanghai. Hydrol. Earth Syst. Sci. 2019, 23, 4293–4307. [Google Scholar] [CrossRef]
- Lyu, H.-M.; Shen, S.-L.; Zhou, A.; Yang, J. Perspectives for flood risk assessment and management for mega-city metro system. Tunn. Undergr. Space Technol. 2019, 84, 31–44. [Google Scholar] [CrossRef]
- Ju, W.; Wu, J.; Cao, H.; Kang, Q.; Syed Salman Ali, S.; Xing, Z. Flood risk assessment of subway stations based on projection pursuit model optimized by whale algorithm: A case study of Changzhou, China. Int. J. Disaster Risk Reduct. 2023, 98, 104068. [Google Scholar] [CrossRef]
- Yu, H.; Liang, C.; Li, P.; Niu, K.; Du, F.; Shao, J.; Liu, Y.; Tang, Y. Evaluation of Waterlogging Risk in an Urban Subway Station. Adv. Civ. Eng. 2019, 2019, 5393171. [Google Scholar] [CrossRef]
- Li, L.; Yu, M.; Ma, H.; Meng, L.; Cui, Z. Development and Application of Flood Control and Waterlogging Prevention Intelligent Monitoring System Based on Subway “One Map”. ISPRS Ann. Photogramm. Remote Sens. Spat. Inf. Sci. 2022, X-3/W1-2022, 93–98. [Google Scholar] [CrossRef]
- Dong, W.; Huang, H.; Zhong, M.; Wang, H.; Hua, F. Monitoring and early warning mechanism of flood invasion into subway tunnels based on the experimental study of flooding patterns. J. Intell. Constr. 2024, 2, 1–16. [Google Scholar] [CrossRef]
- Hansen, W.G. How Accessibility Shapes Land Use. J. Am. Inst. Plan. 1959, 25, 73–76. [Google Scholar] [CrossRef]
- Xu, X.; Li, Z.; Wang, M.; Wang, H.; Gong, Y. Research on the Method of Determining Rainfall Thresholds for Waterlogging Risk in Subway Stations. Water 2024, 16, 1596. [Google Scholar] [CrossRef]
- Ishigaki, T.; Toda, K.; Baba, Y.; Inoue, K.; Nakagawa, H. Experimental Study on Evacuation from Underground Space by Using Real Size Models. Proceedings of Hydraulic Engineering. Proc. Hydraul. Eng. 2006, 50, 583–588. [Google Scholar] [CrossRef]
- Quagliarini, E.; Romano, G.; Bernardini, G. Investigating pedestrian behavioral patterns under different floodwater conditions: A video analysis on real flood evacuations. Saf. Sci. 2023, 161, 106083. [Google Scholar] [CrossRef]
- Kim, J.Y.; Kim, Y.O. Analysis of Pedestrian Behaviors in Subway Station Using Agent-Based Model: Case of Gangnam Station, Seoul, Korea. Buildings 2023, 13, 537. [Google Scholar] [CrossRef]
- Lu, Y.; Deng, Y.; Sun, S. Design for safety in metro station evacuation: A study of fire emergency evacuation behavior and simulation. Eng. Constr. Archit. Manag. 2023, 31, 3479–3507. [Google Scholar] [CrossRef]
- Hu, M. A high-fidelity three-dimensional simulation method for evaluating passenger flow organization and facility layout at metro stations. Simulation 2017, 93, 841–851. [Google Scholar] [CrossRef]
- Lin, Z.; Hu, S.; Zhou, T.; Zhong, Y.; Zhu, Y.; Shi, L.; Lin, H. Numerical Simulation of Flood Intrusion Process under Malfunction of Flood Retaining Facilities in Complex Subway Stations. Buildings 2022, 12, 853. [Google Scholar] [CrossRef]


Disclaimer/Publisher’s Note: The statements, opinions and data contained in all publications are solely those of the individual author(s) and contributor(s) and not of MDPI and/or the editor(s). MDPI and/or the editor(s) disclaim responsibility for any injury to people or property resulting from any ideas, methods, instructions or products referred to in the content. |
© 2025 by the authors. Licensee MDPI, Basel, Switzerland. This article is an open access article distributed under the terms and conditions of the Creative Commons Attribution (CC BY) license (https://creativecommons.org/licenses/by/4.0/).