
Response of Riverbed Shaping to a Flood Event in the Reach from Alar to Xinquman in the Mainstream of the Tarim River


Abstract
1. Introduction
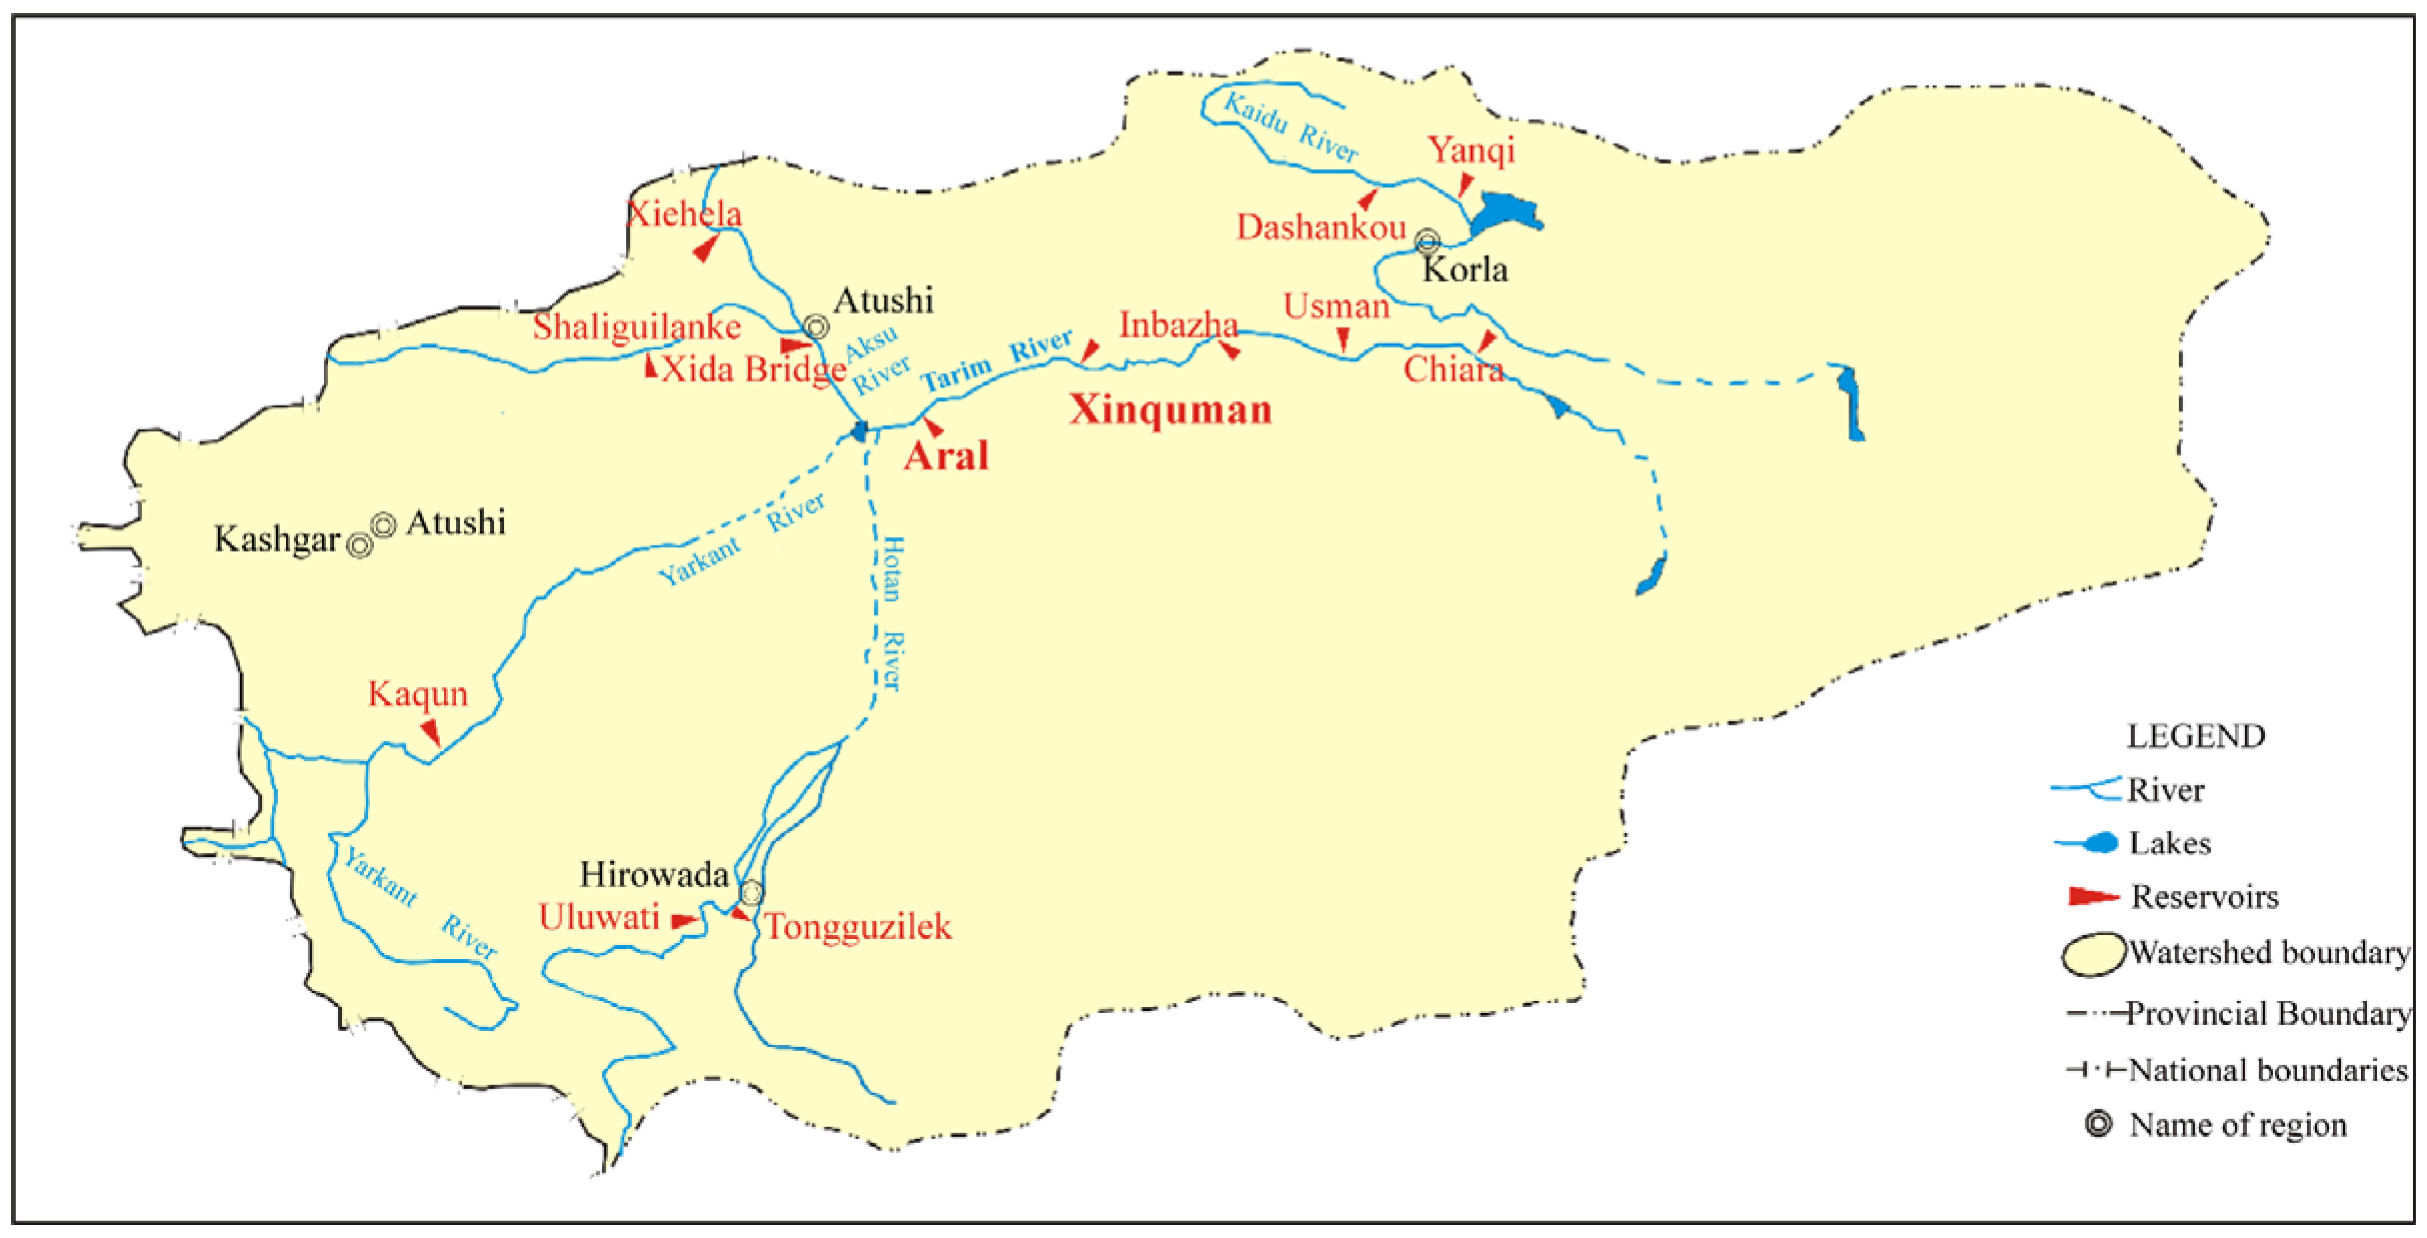
2. Study Area and Data
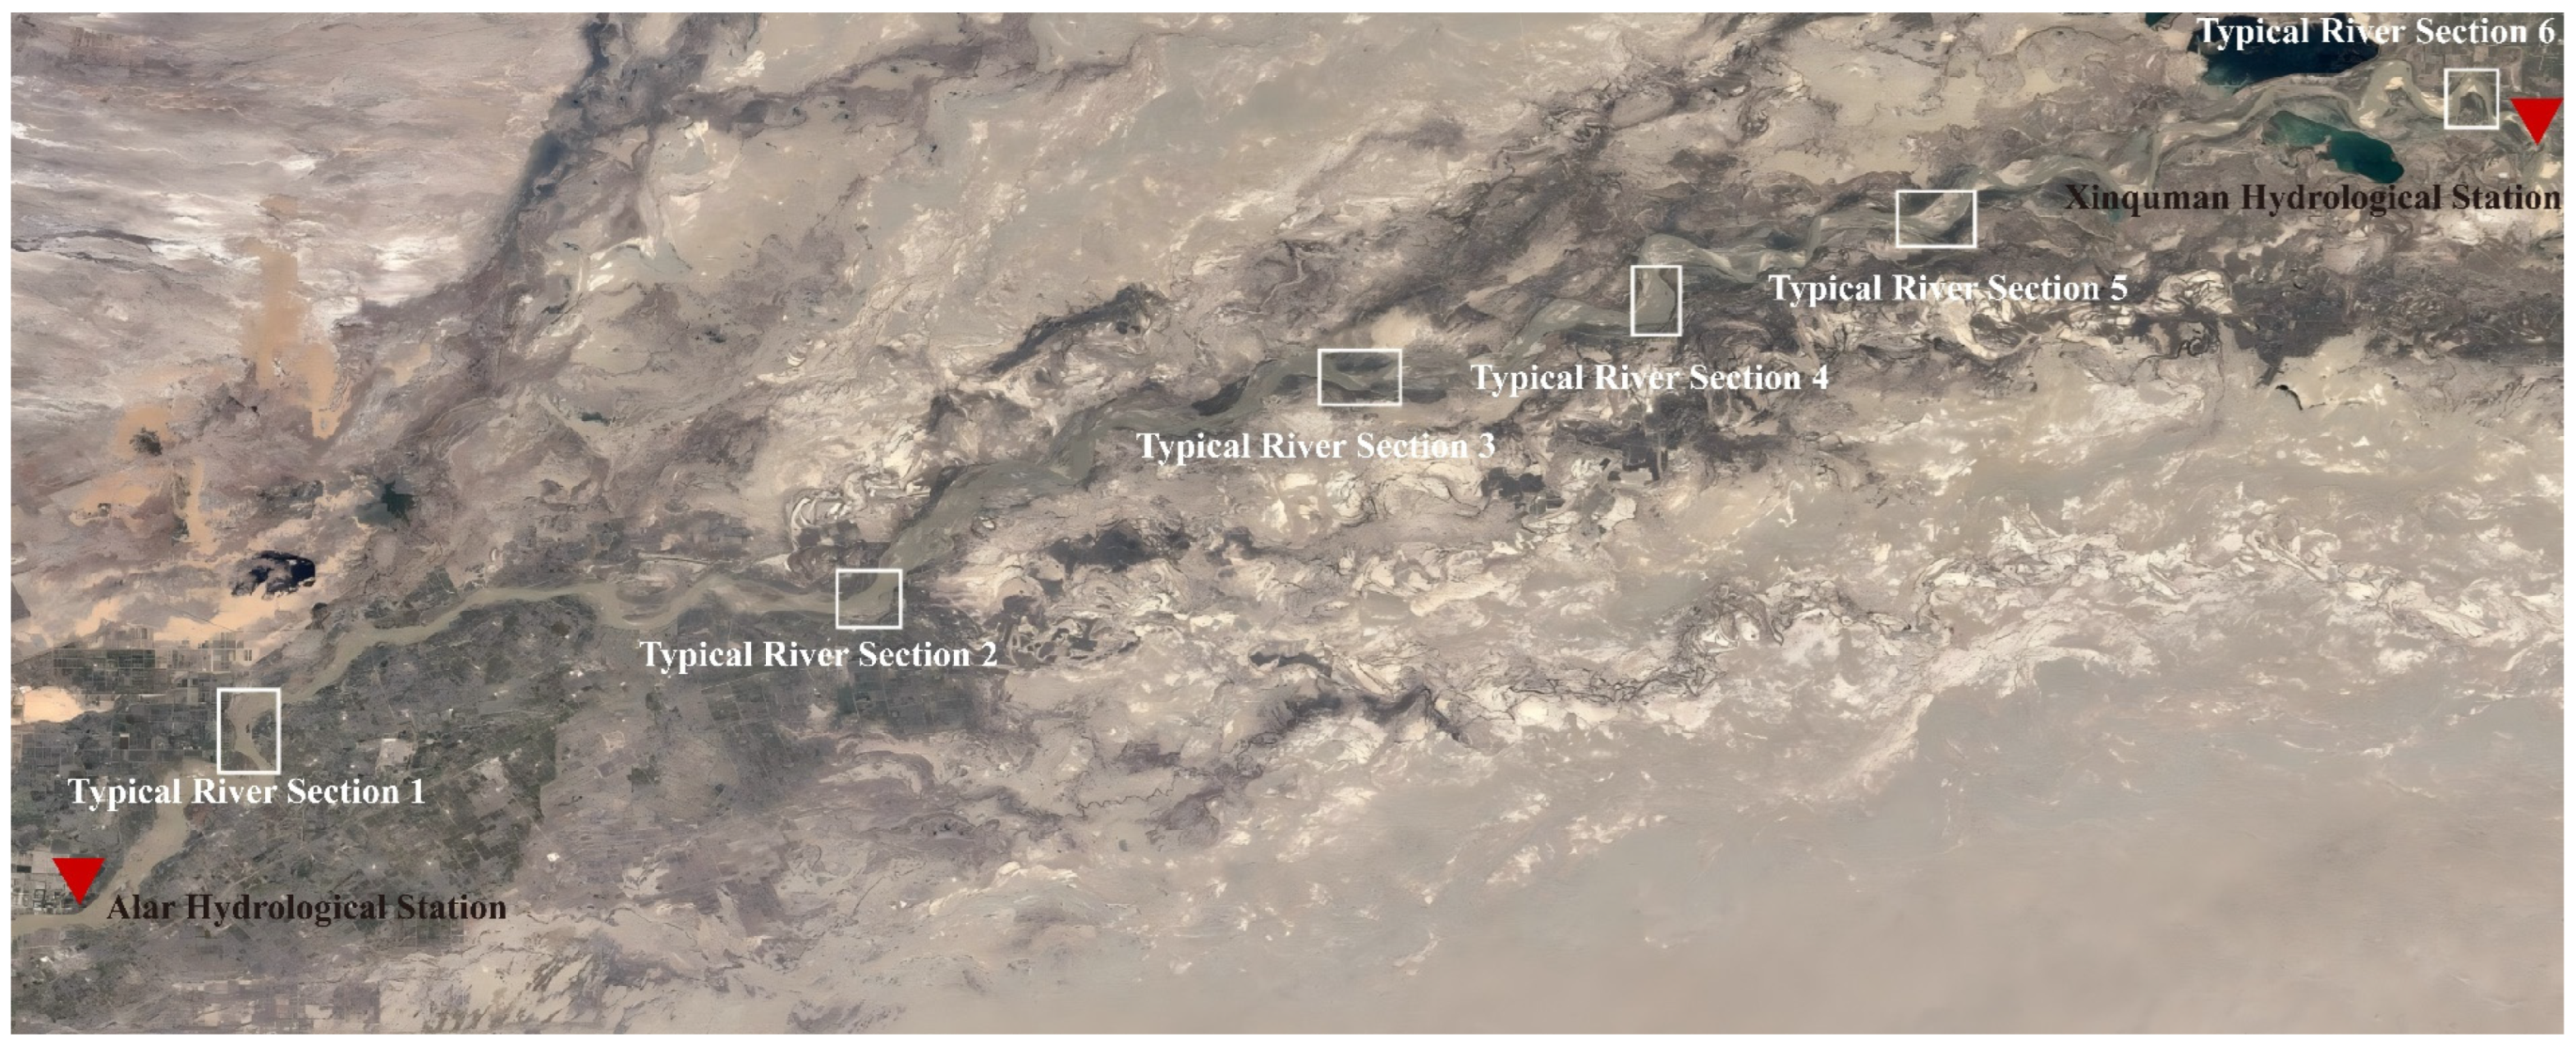
2.1. Selection of Typical River Sections
2.2. Selection of Different Flood Event
2.3. Model Selection
3. Methodologies
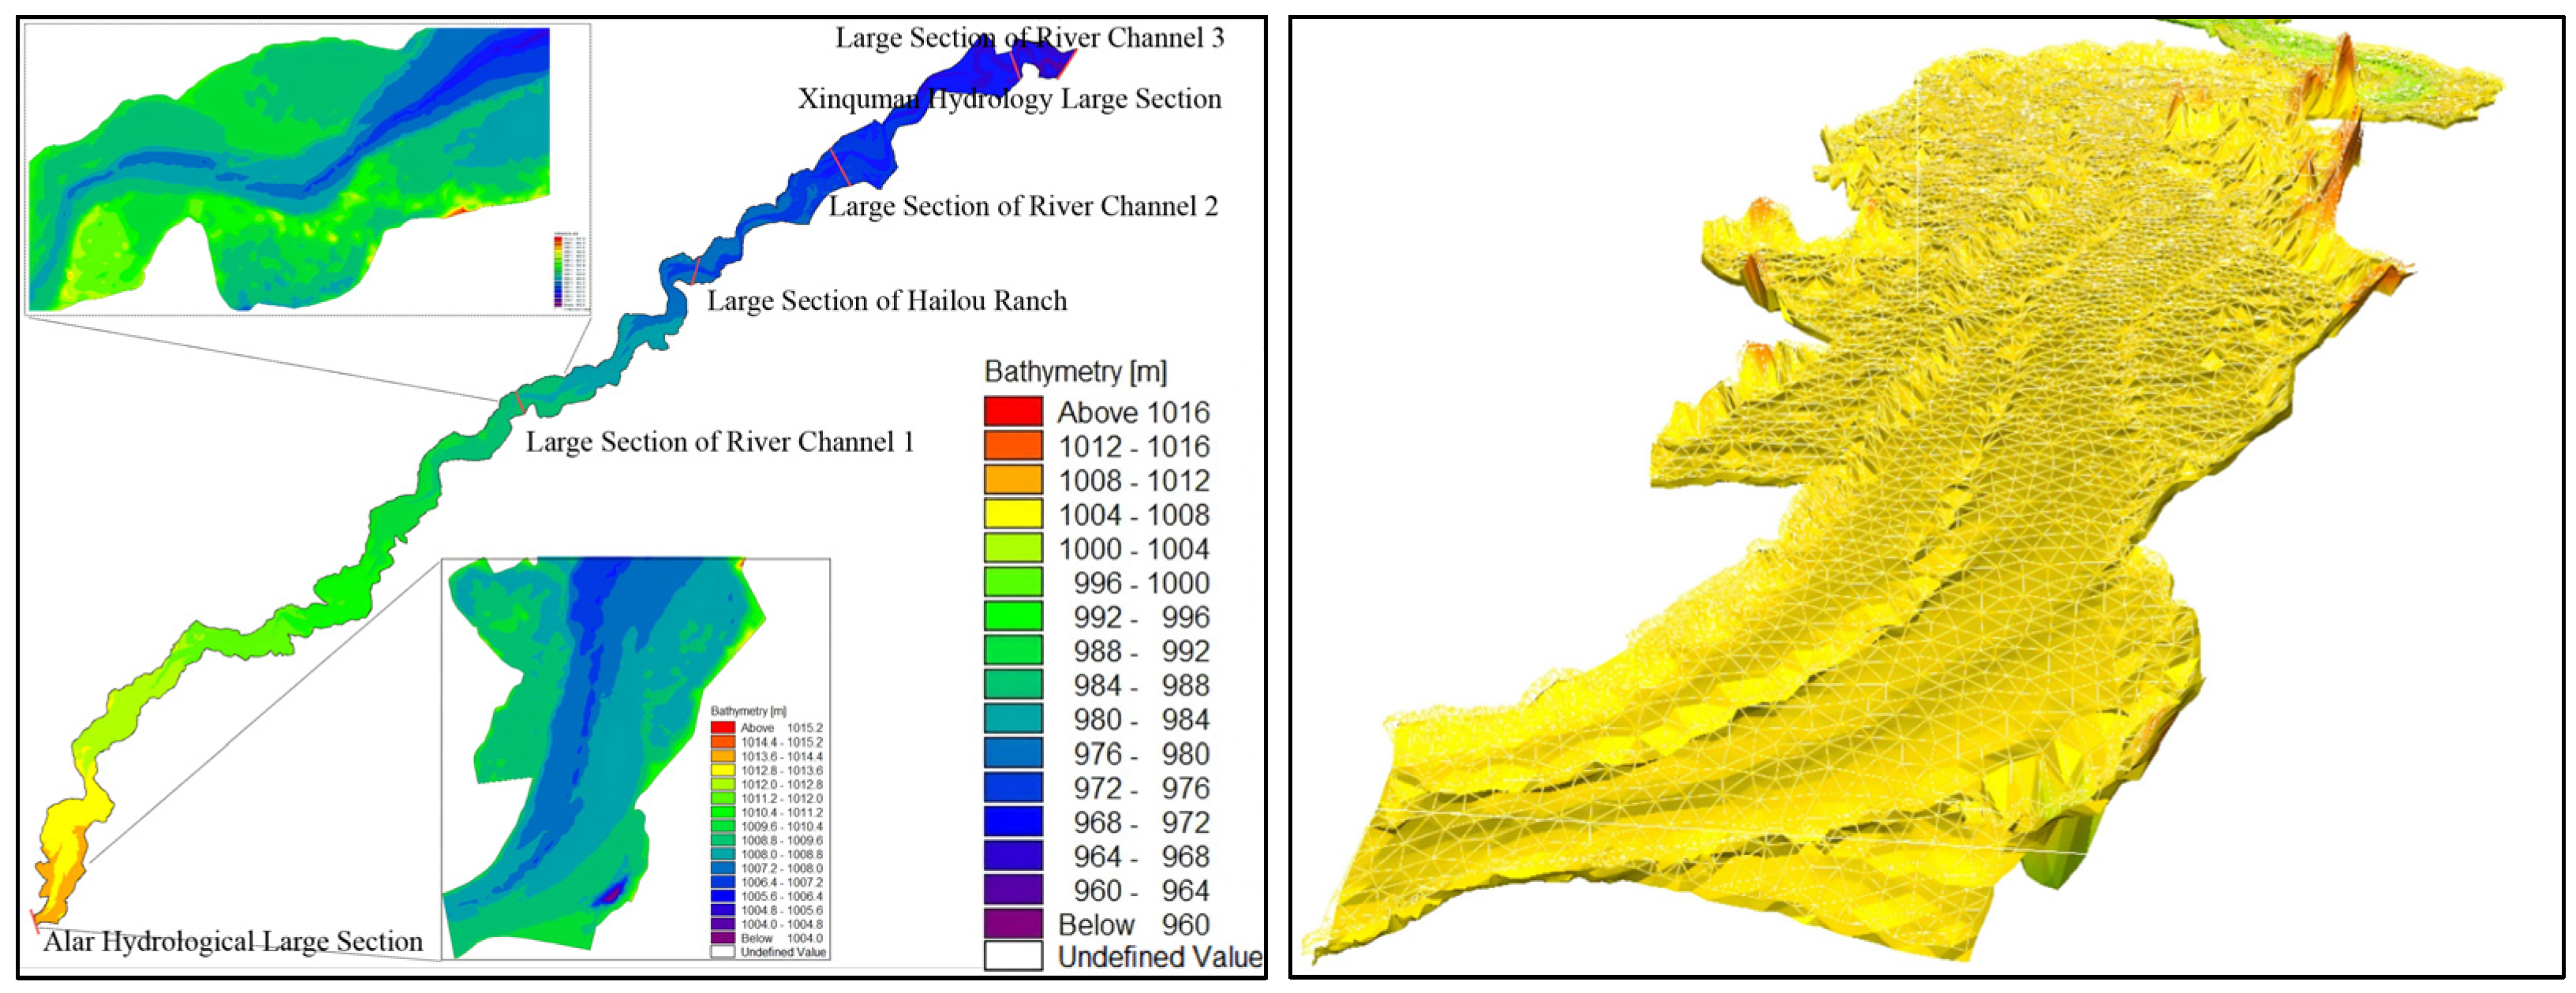
3.1. DEM Construction
3.2. Model Settings
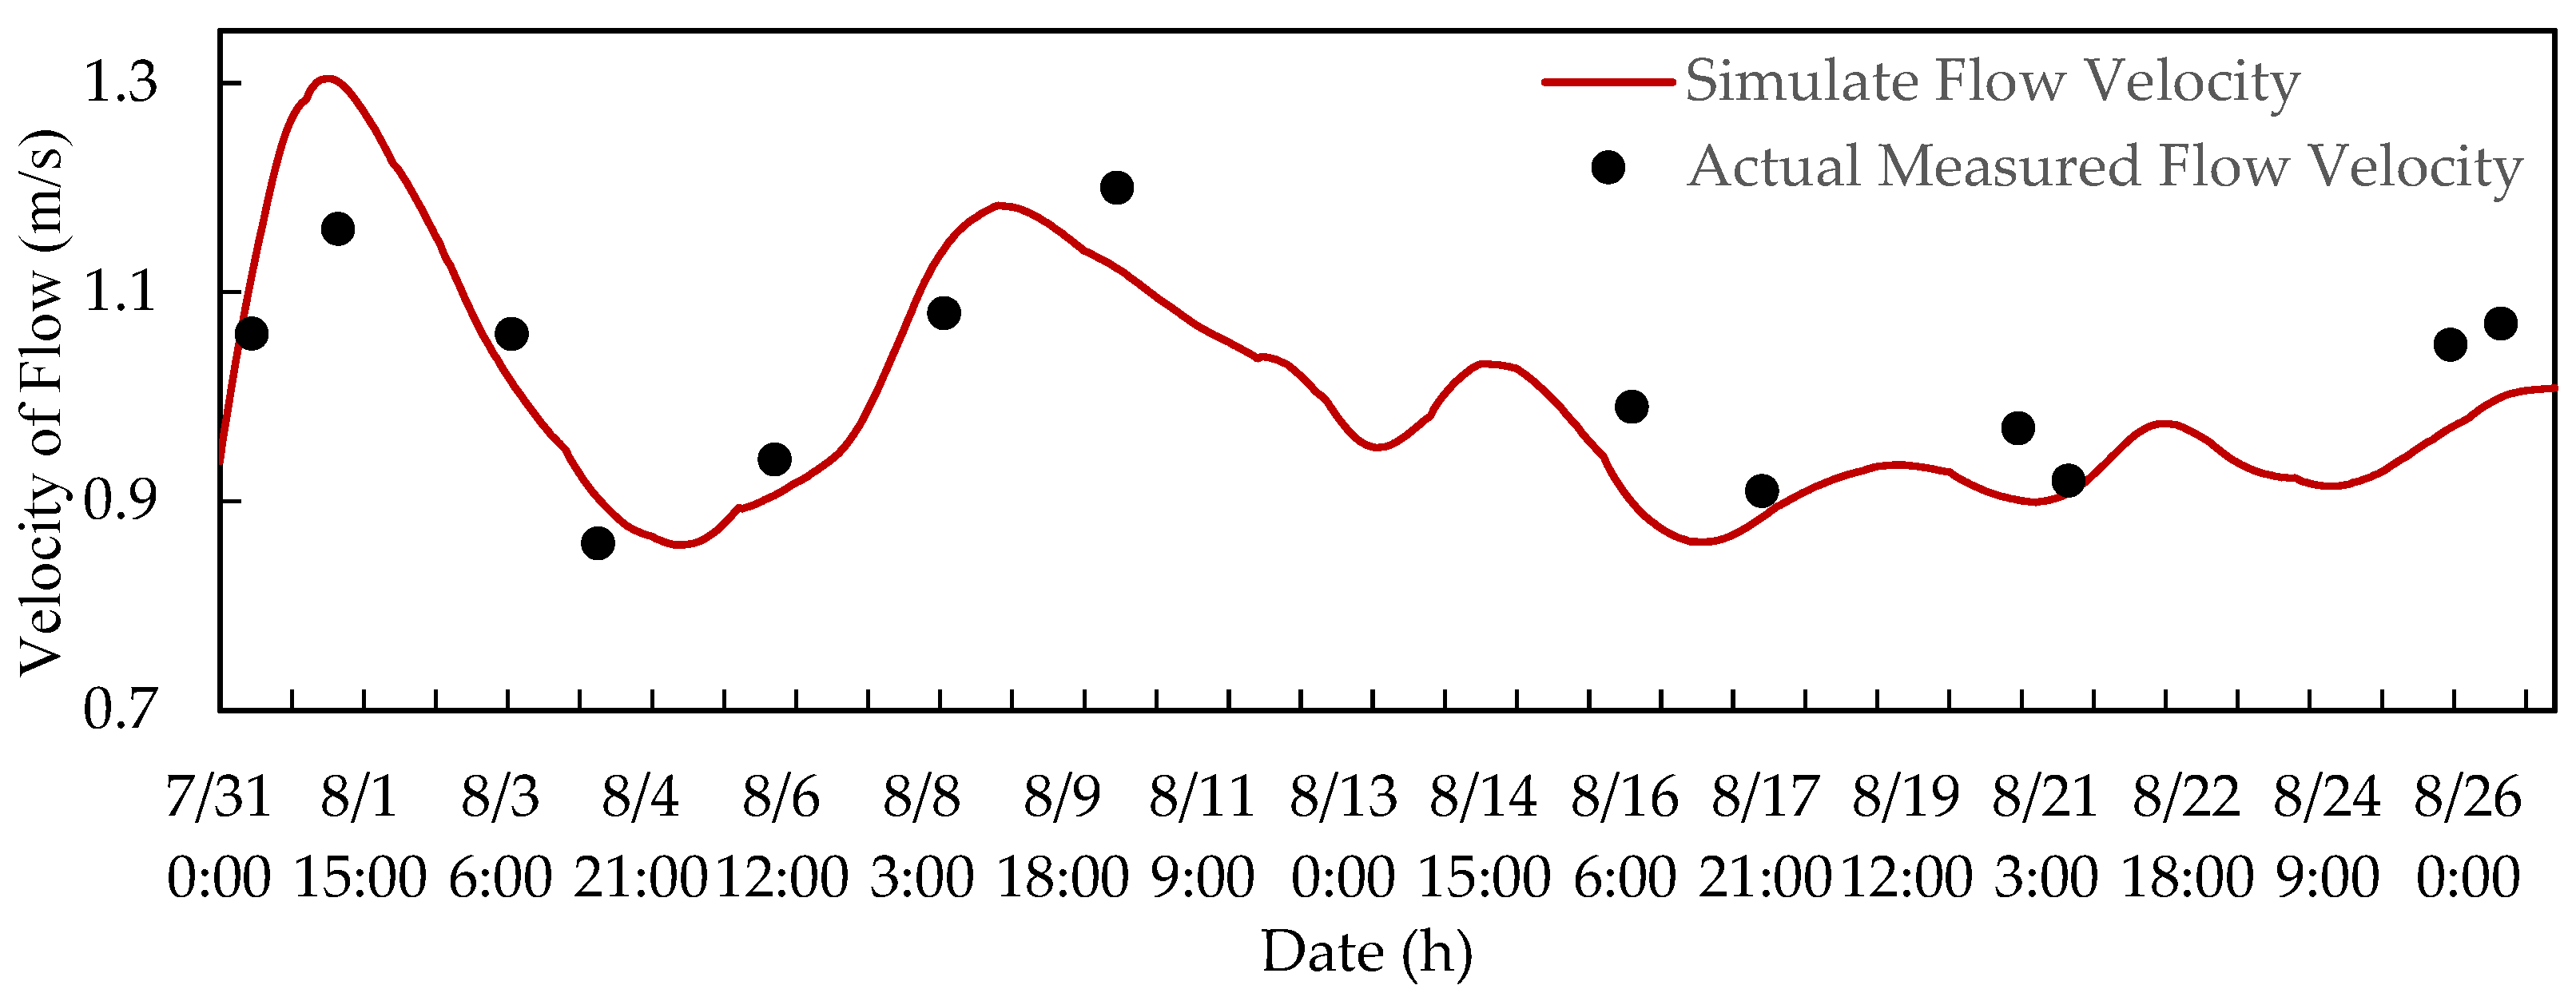
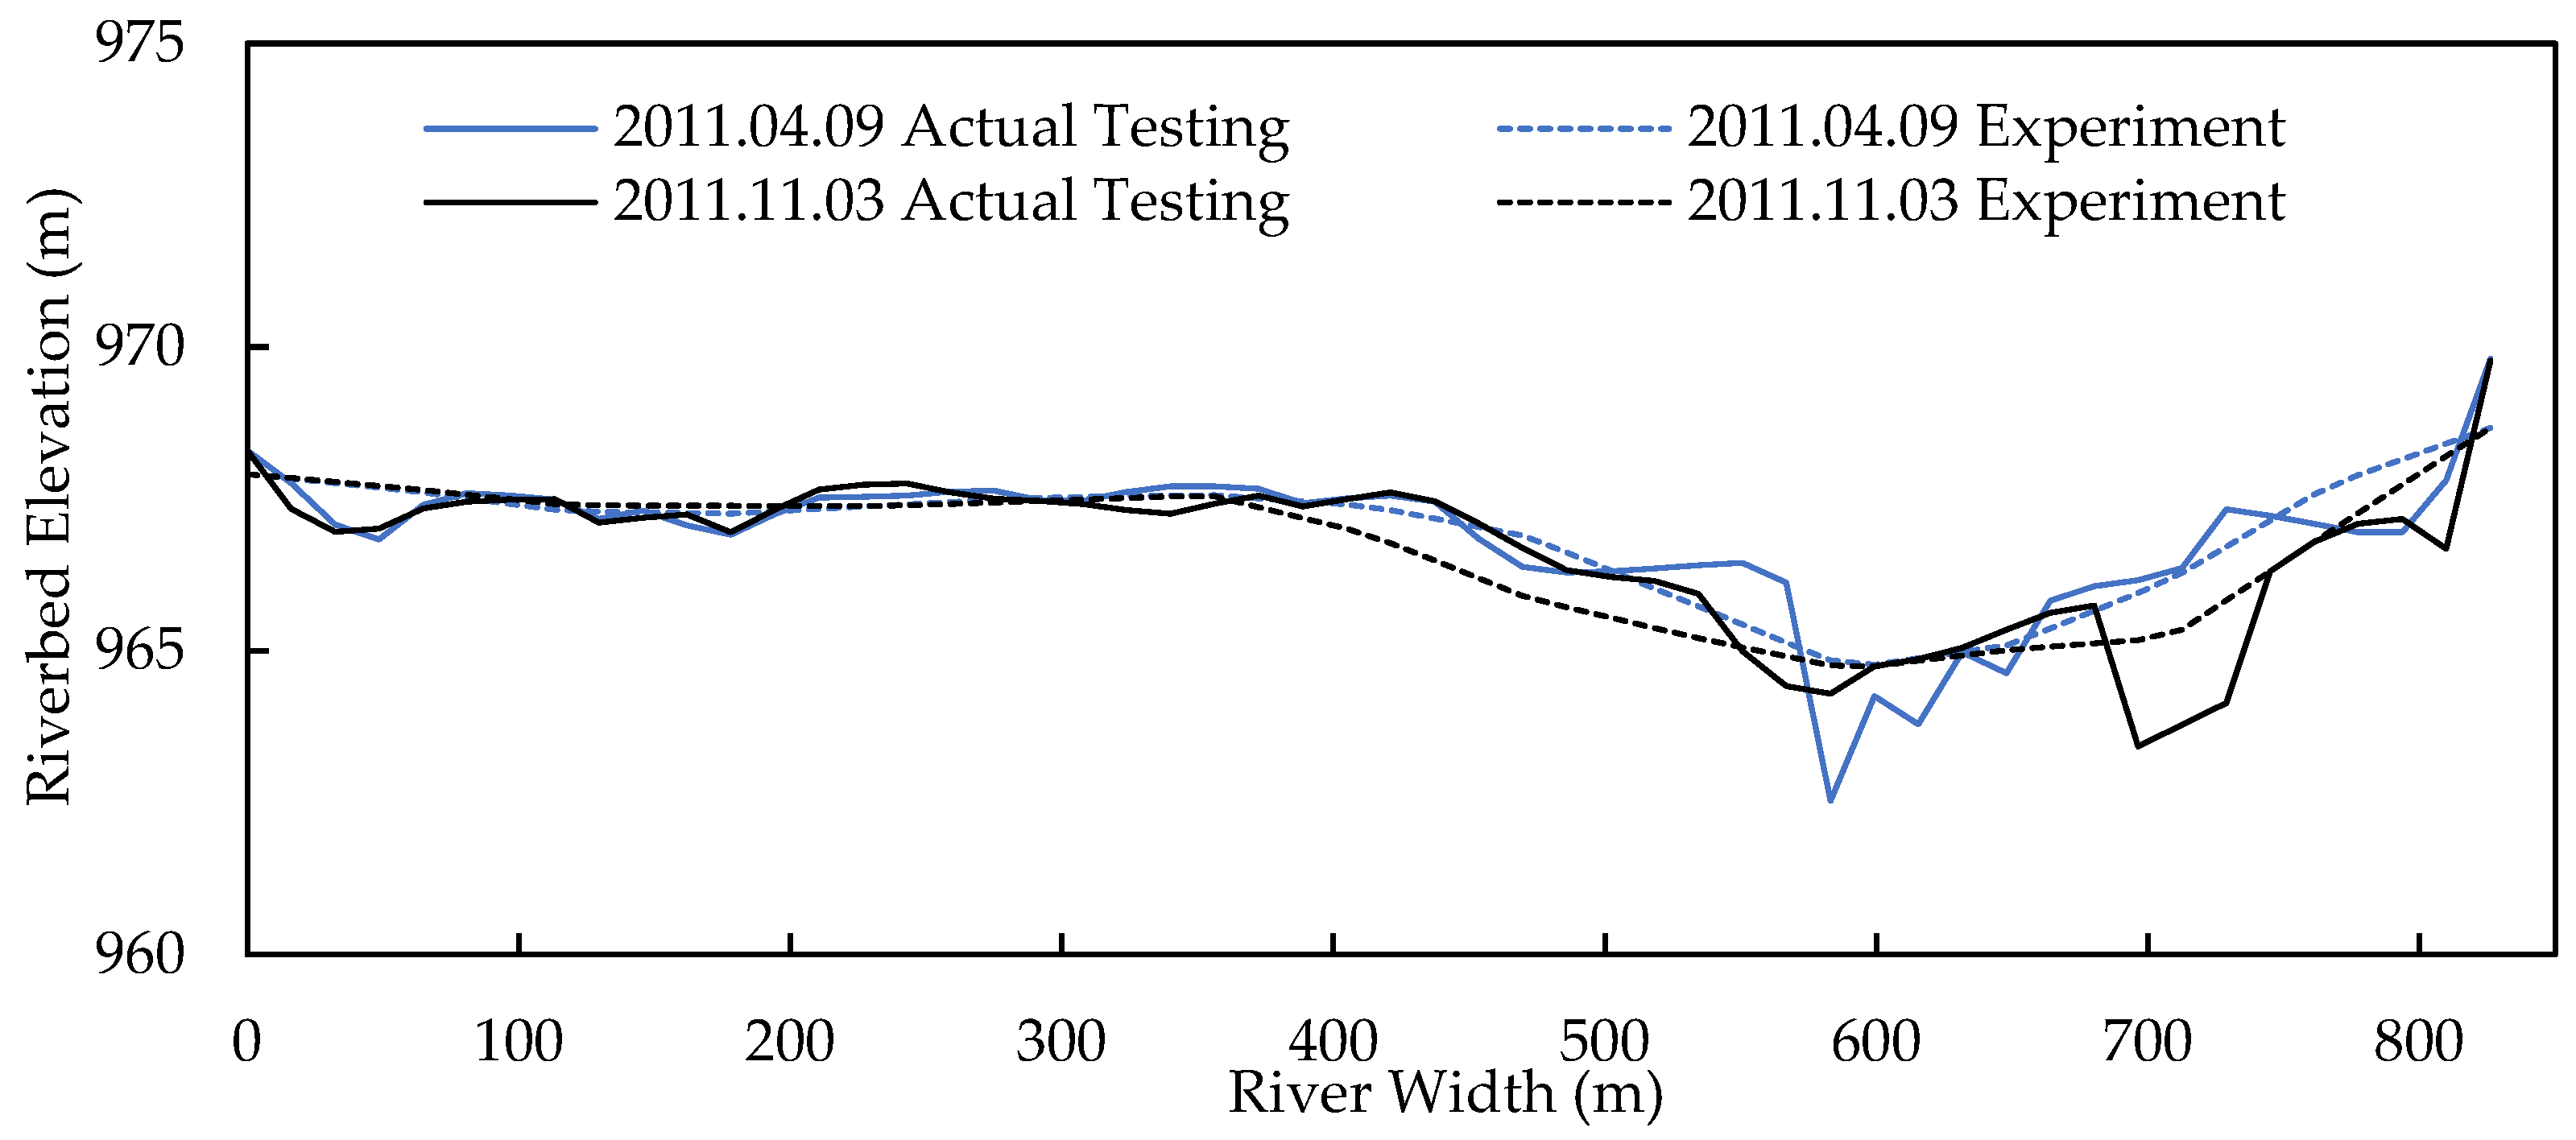
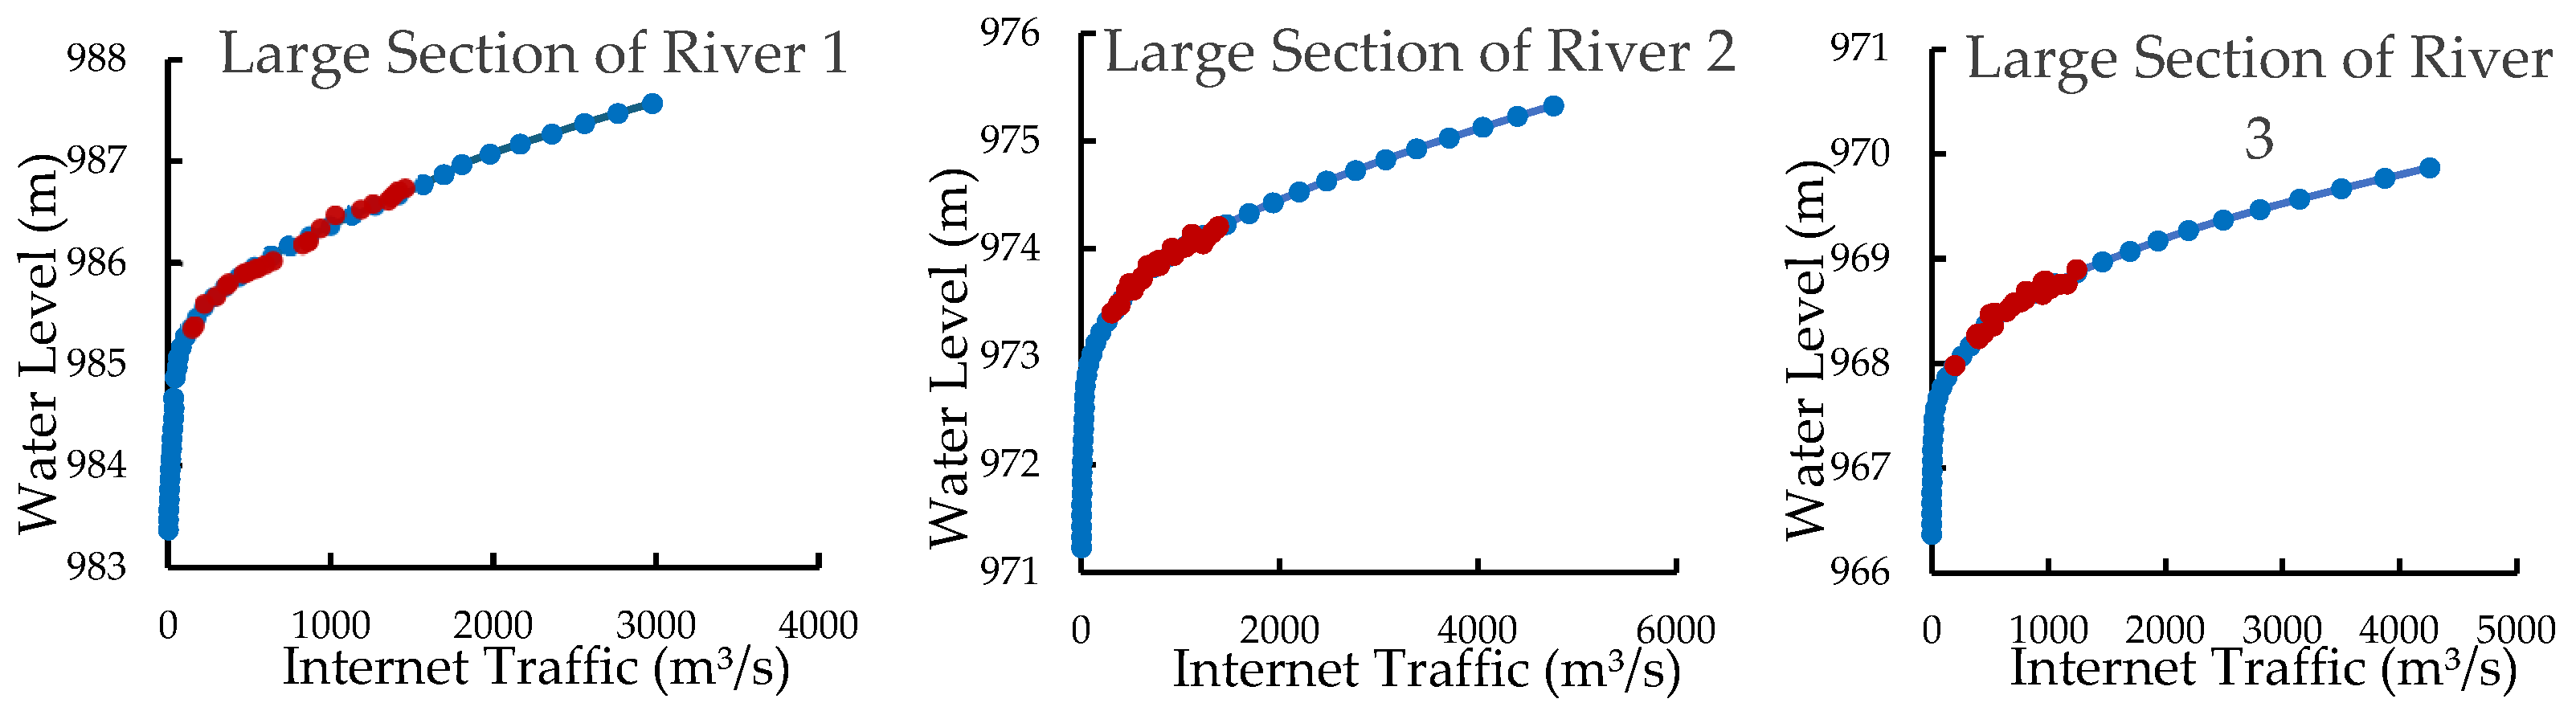
3.3. Model Test
4. Results and Discussion
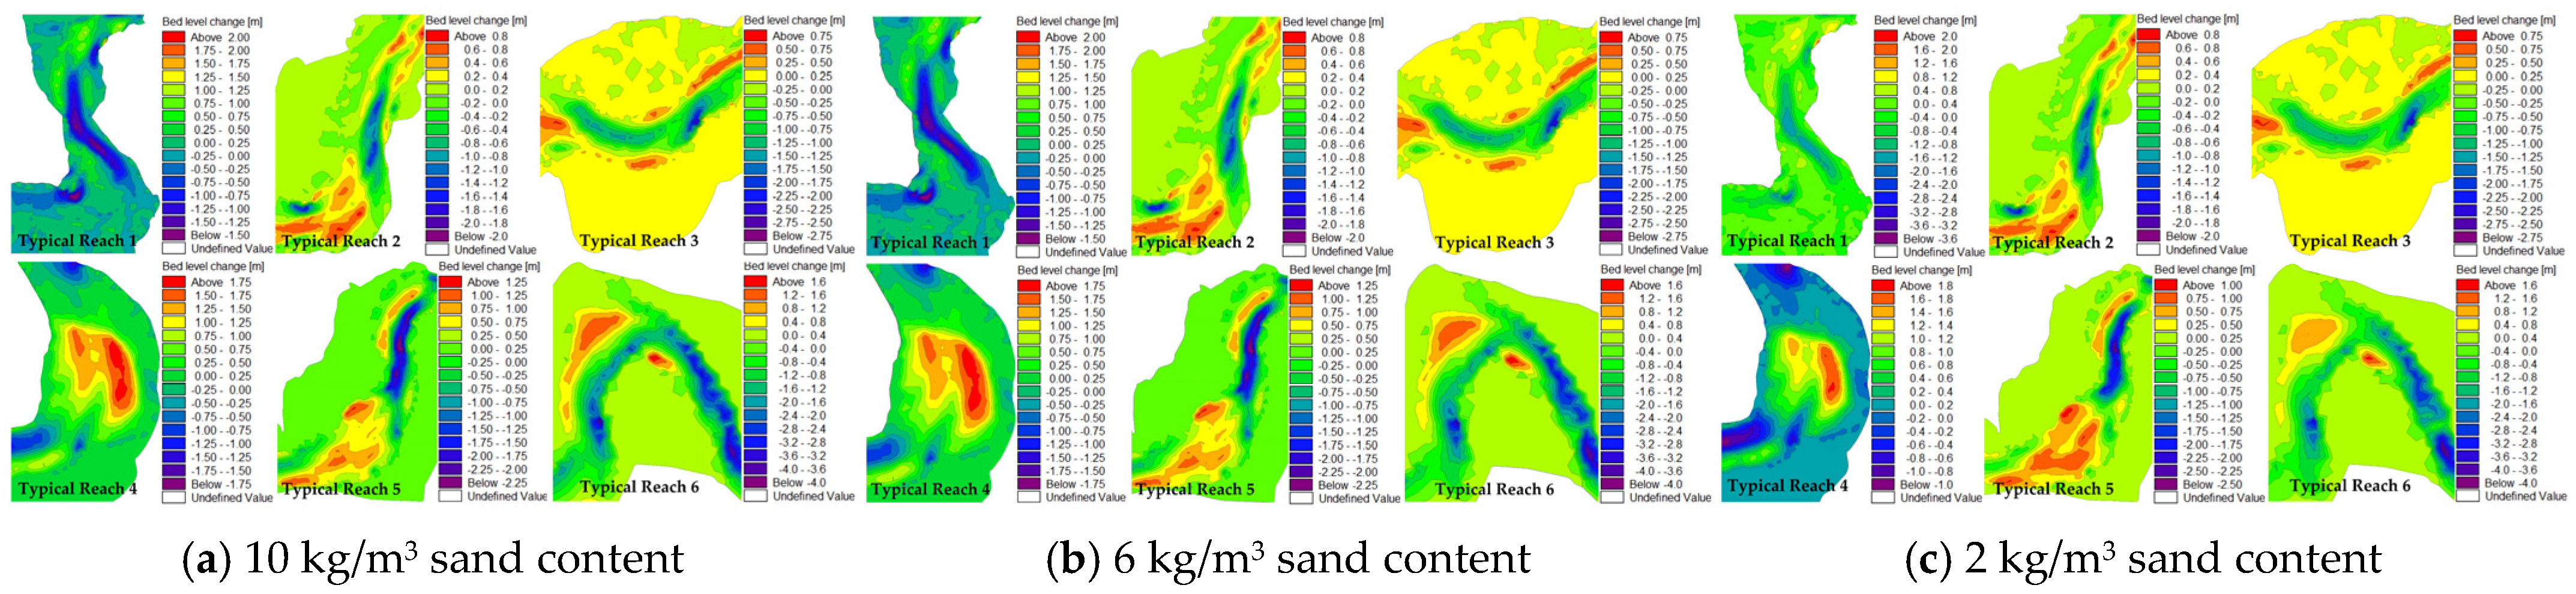
4.1. Channel Formation in Response to a Flood Event with Different Sediment Loads
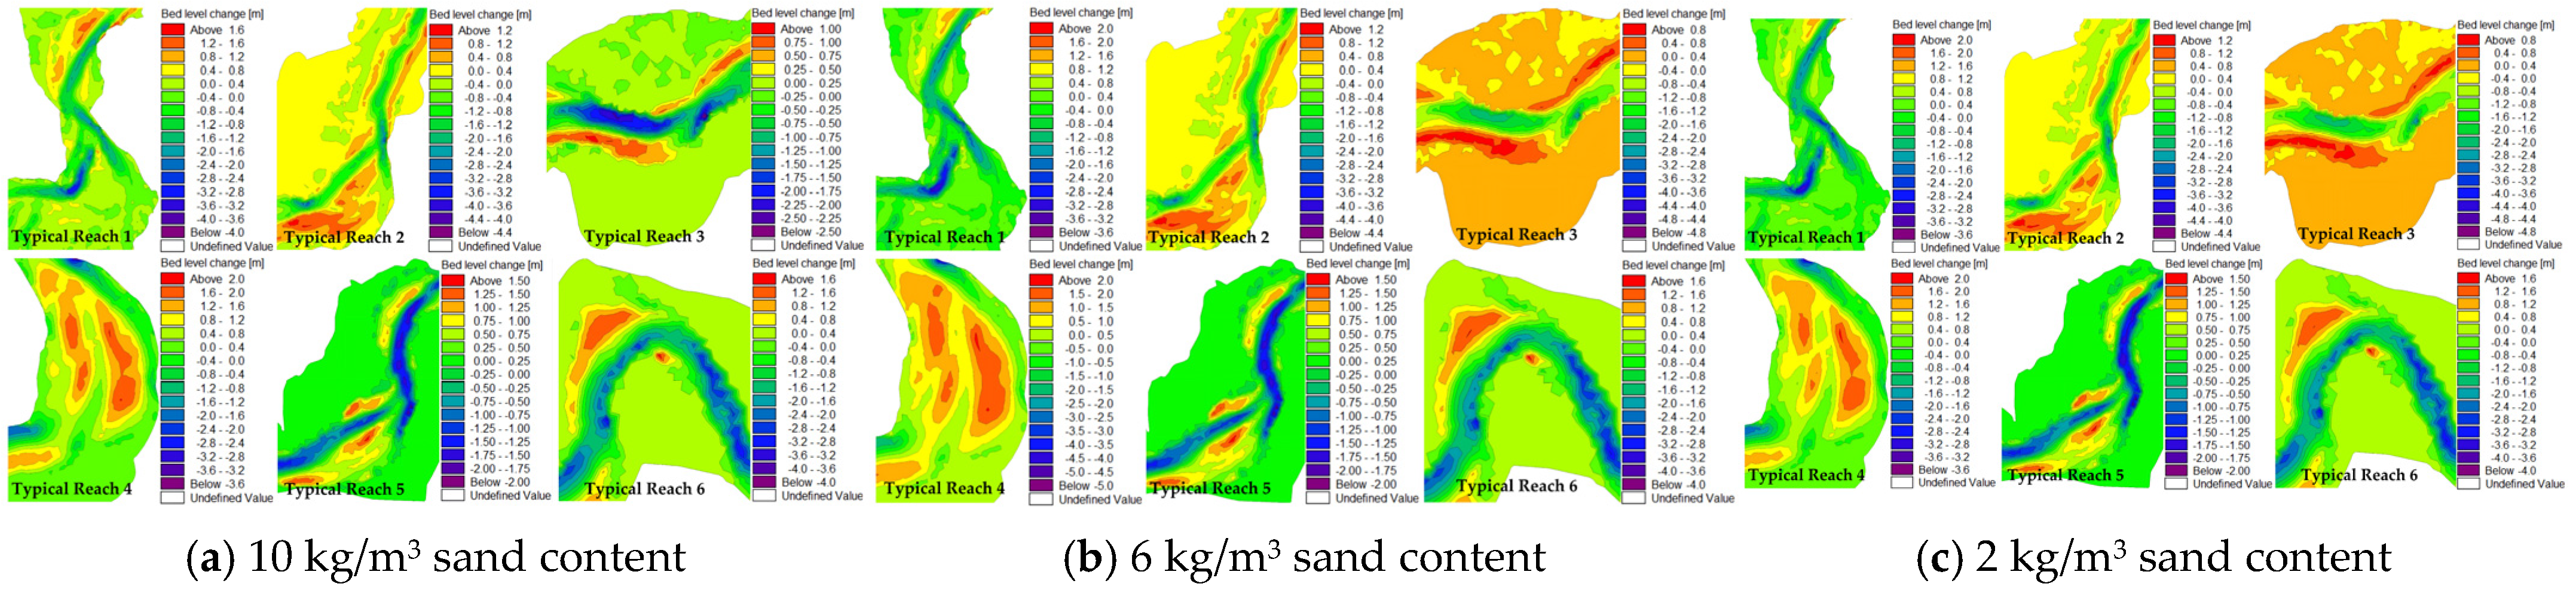
4.2. Channel Morphology Responded to Flood Events with Different Flood Volumes
4.2.1. Pre-Flood Stage: Positive Correlation Between Siltation Intensity and Flood Volume
4.2.2. Post-Peak Stage: Differential Cumulative Sedimentation Effect
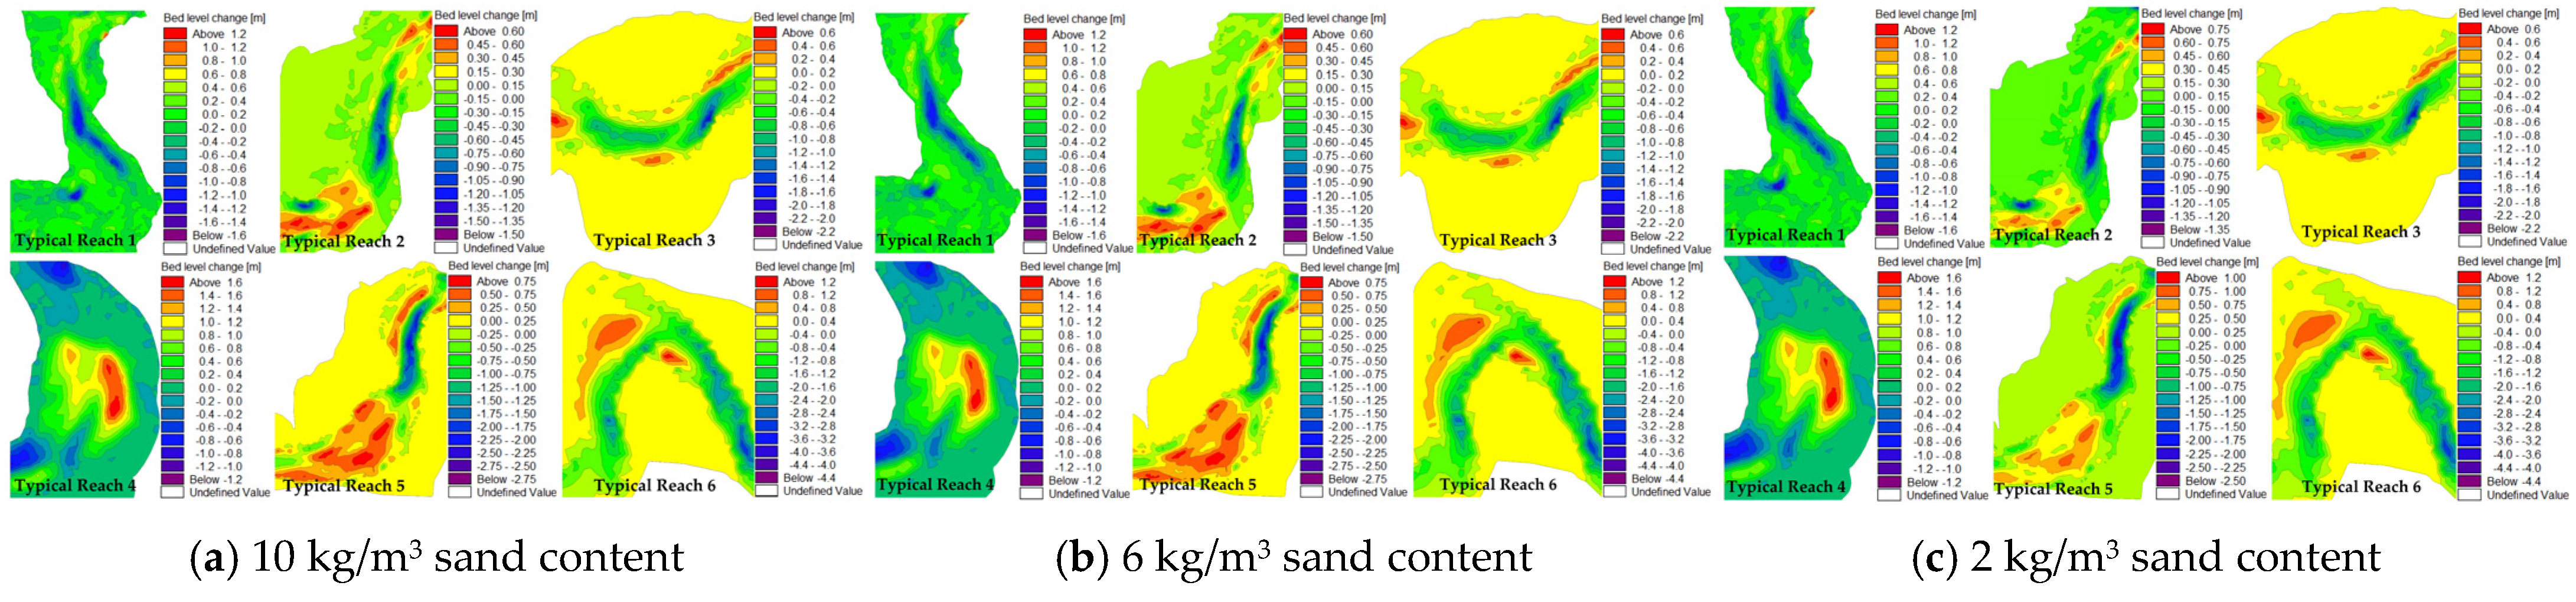
4.3. Riverbed Shaping Response to Flood Events with Different Peak Flows
4.3.1. Pre-Crash Stage: Impact of Water Flow Strength
4.3.2. Post-Flood Stage: Differences in Flushing Effects
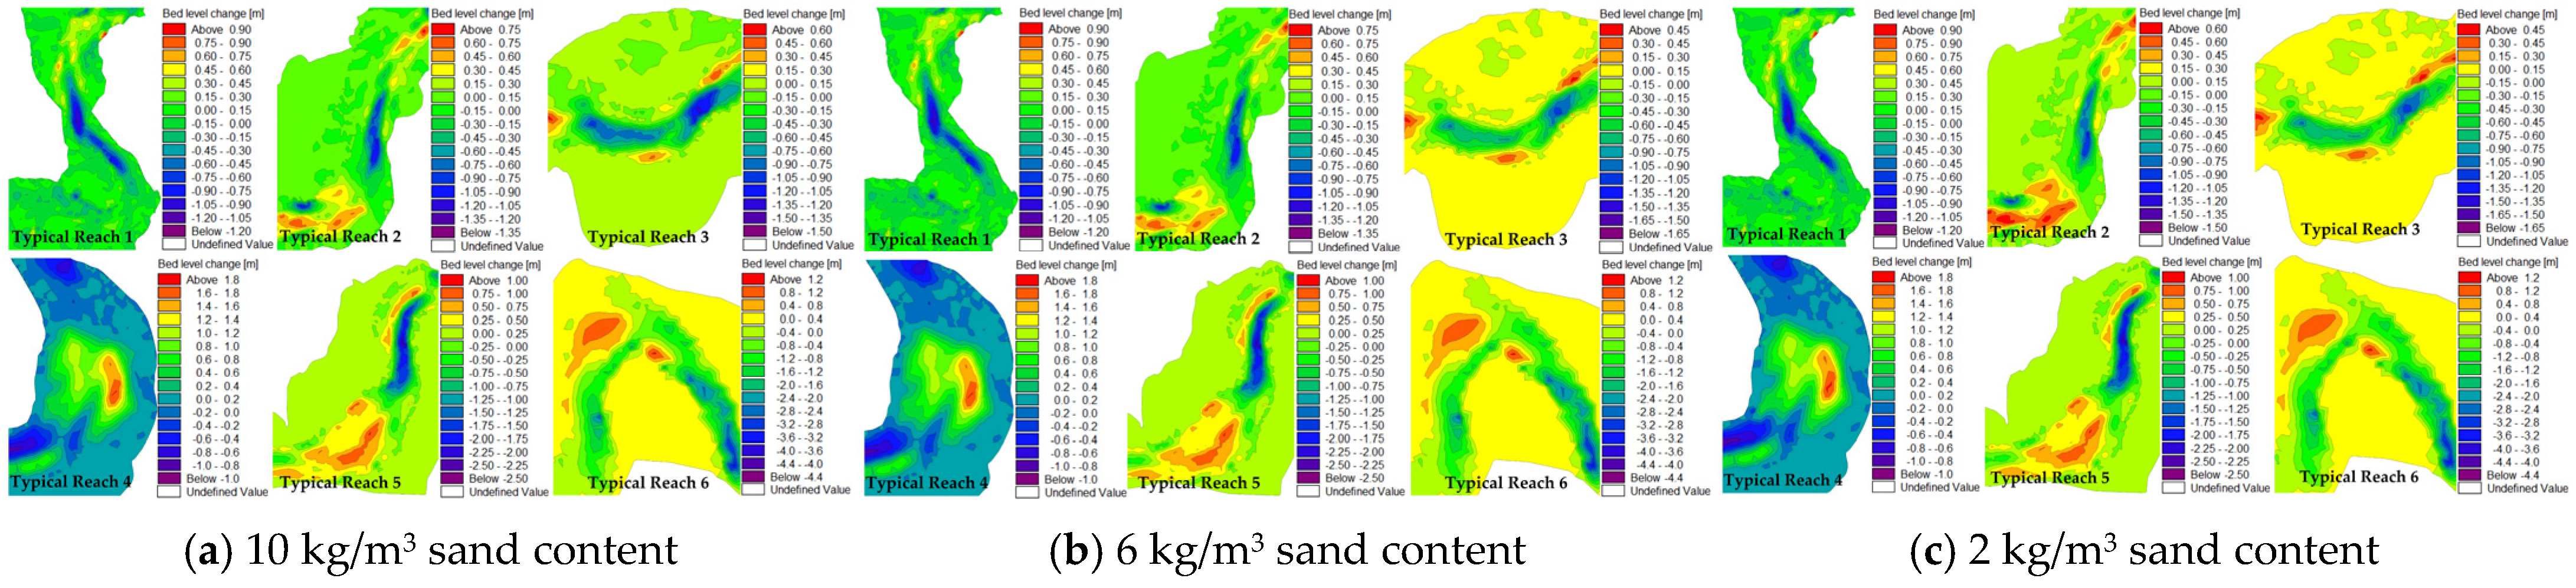
4.4. Optimization of the Water and Sediment Transport Capacity of Rivers
5. Conclusions
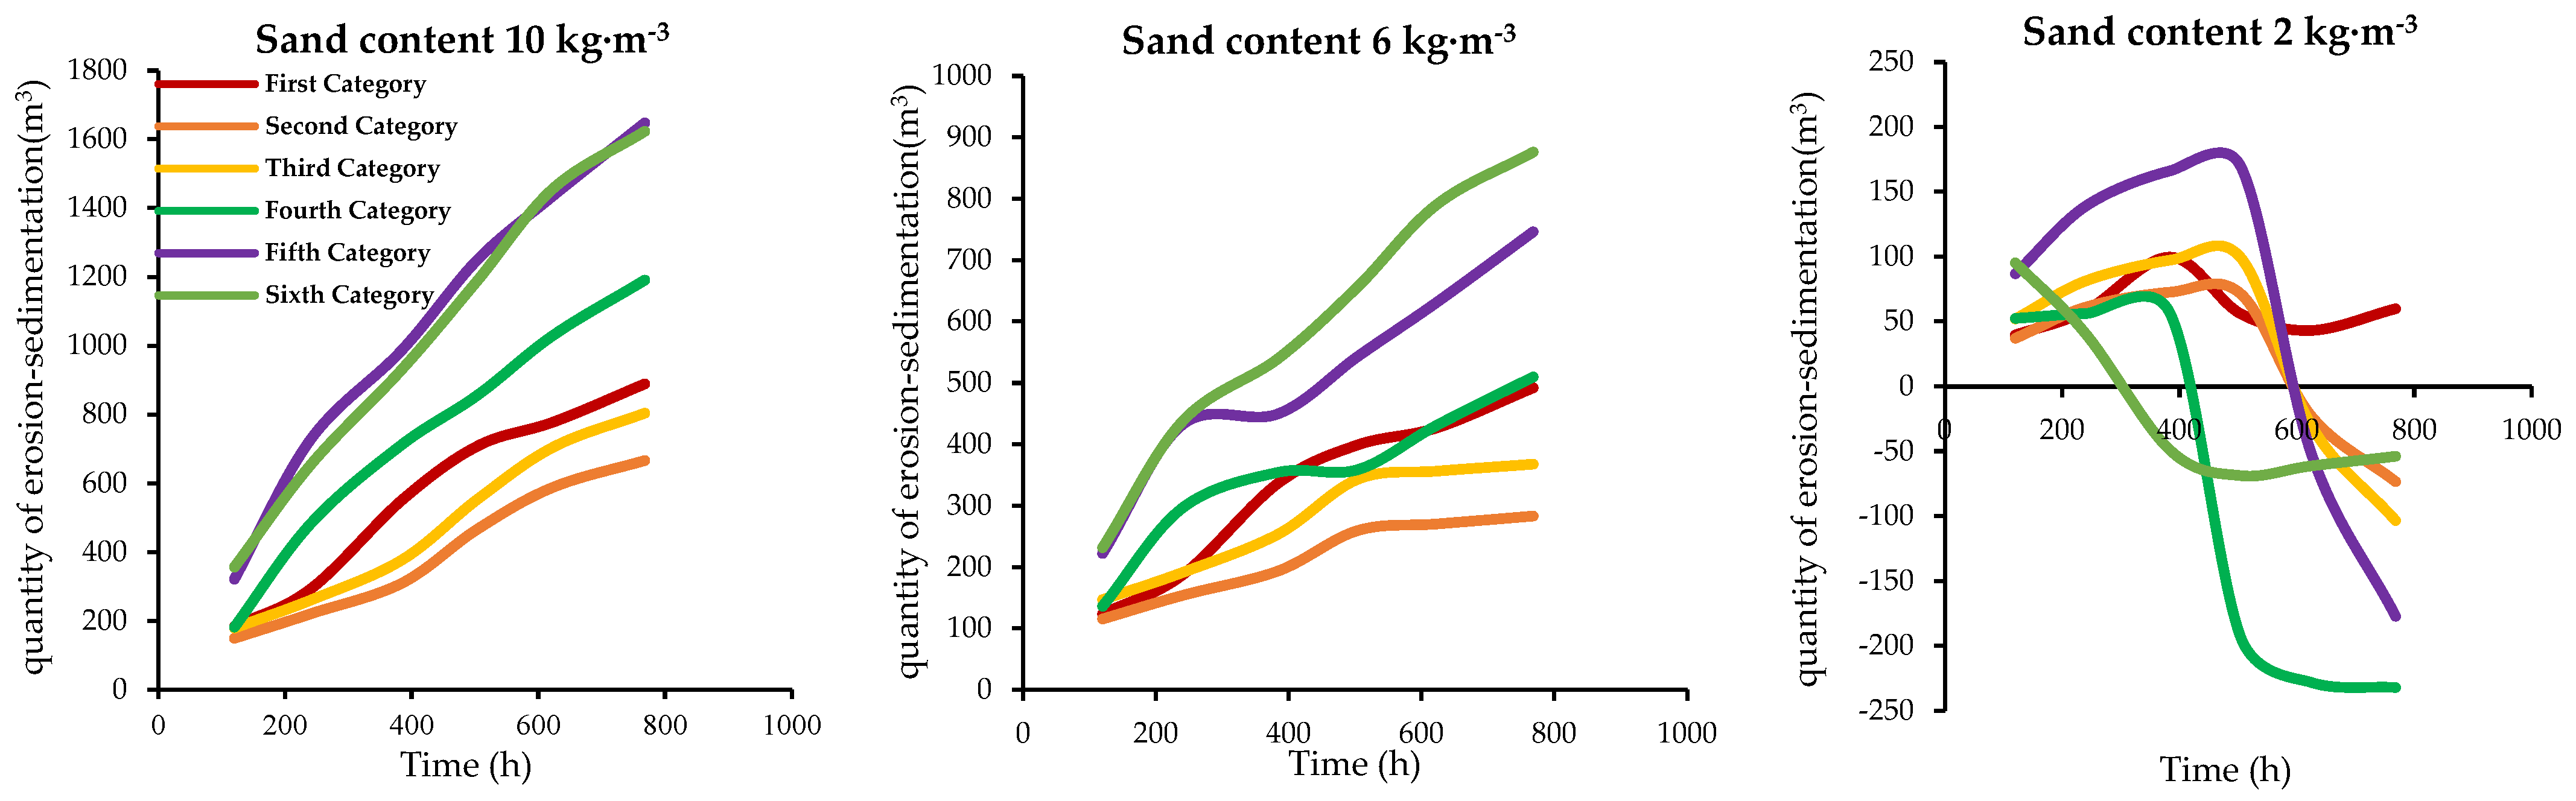
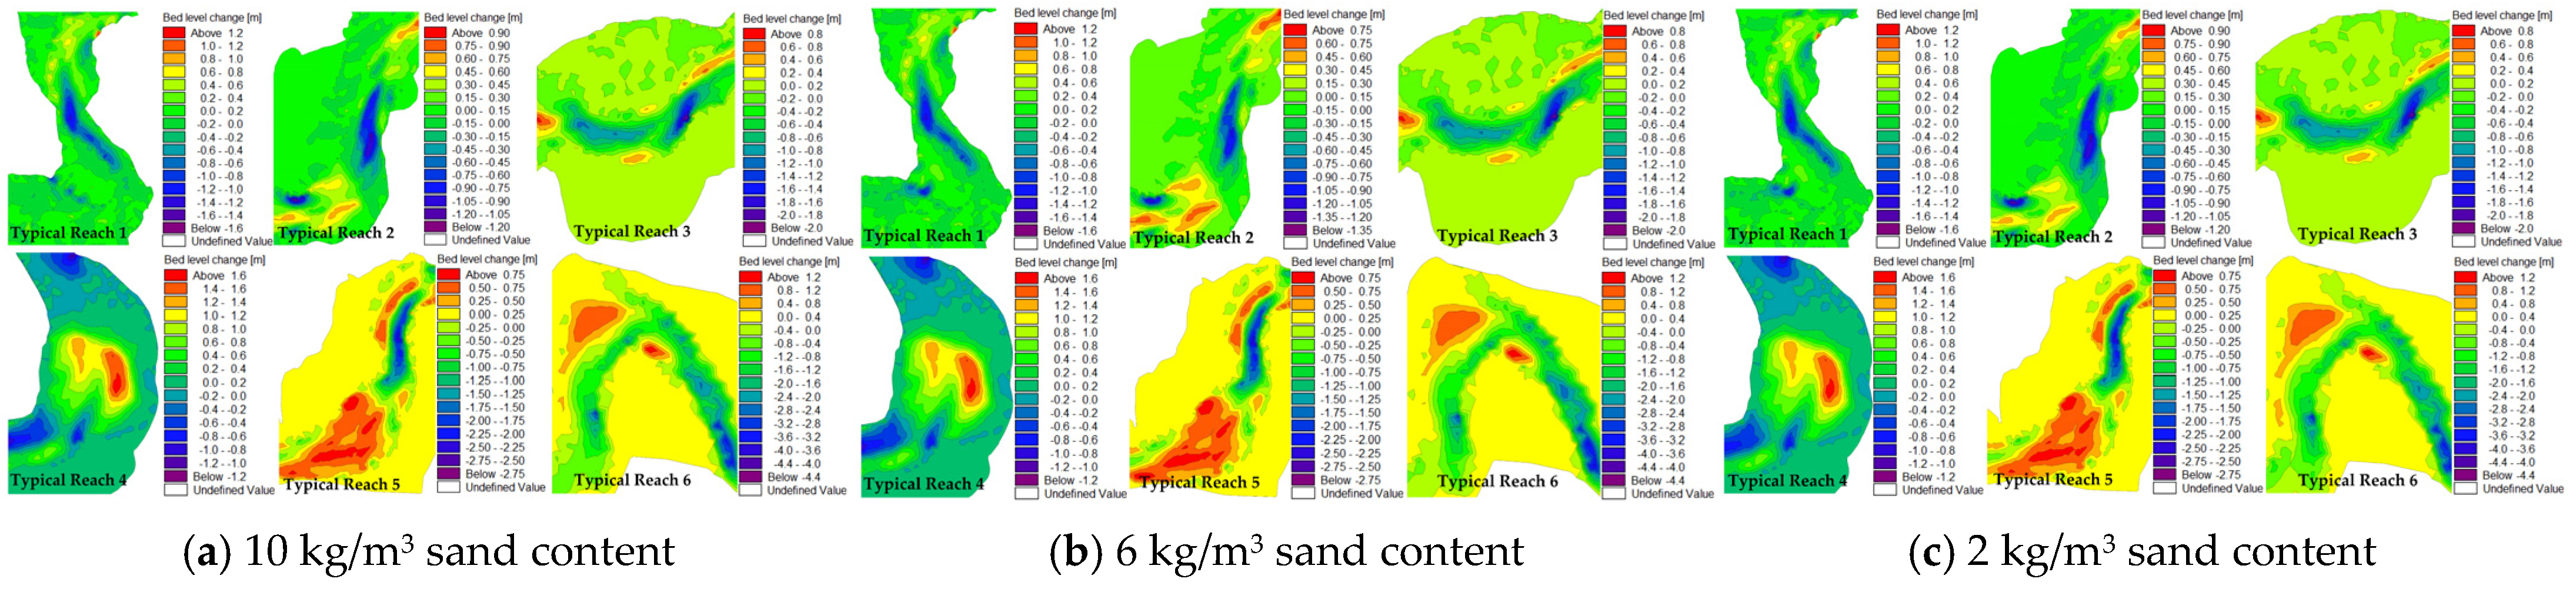
- 1.
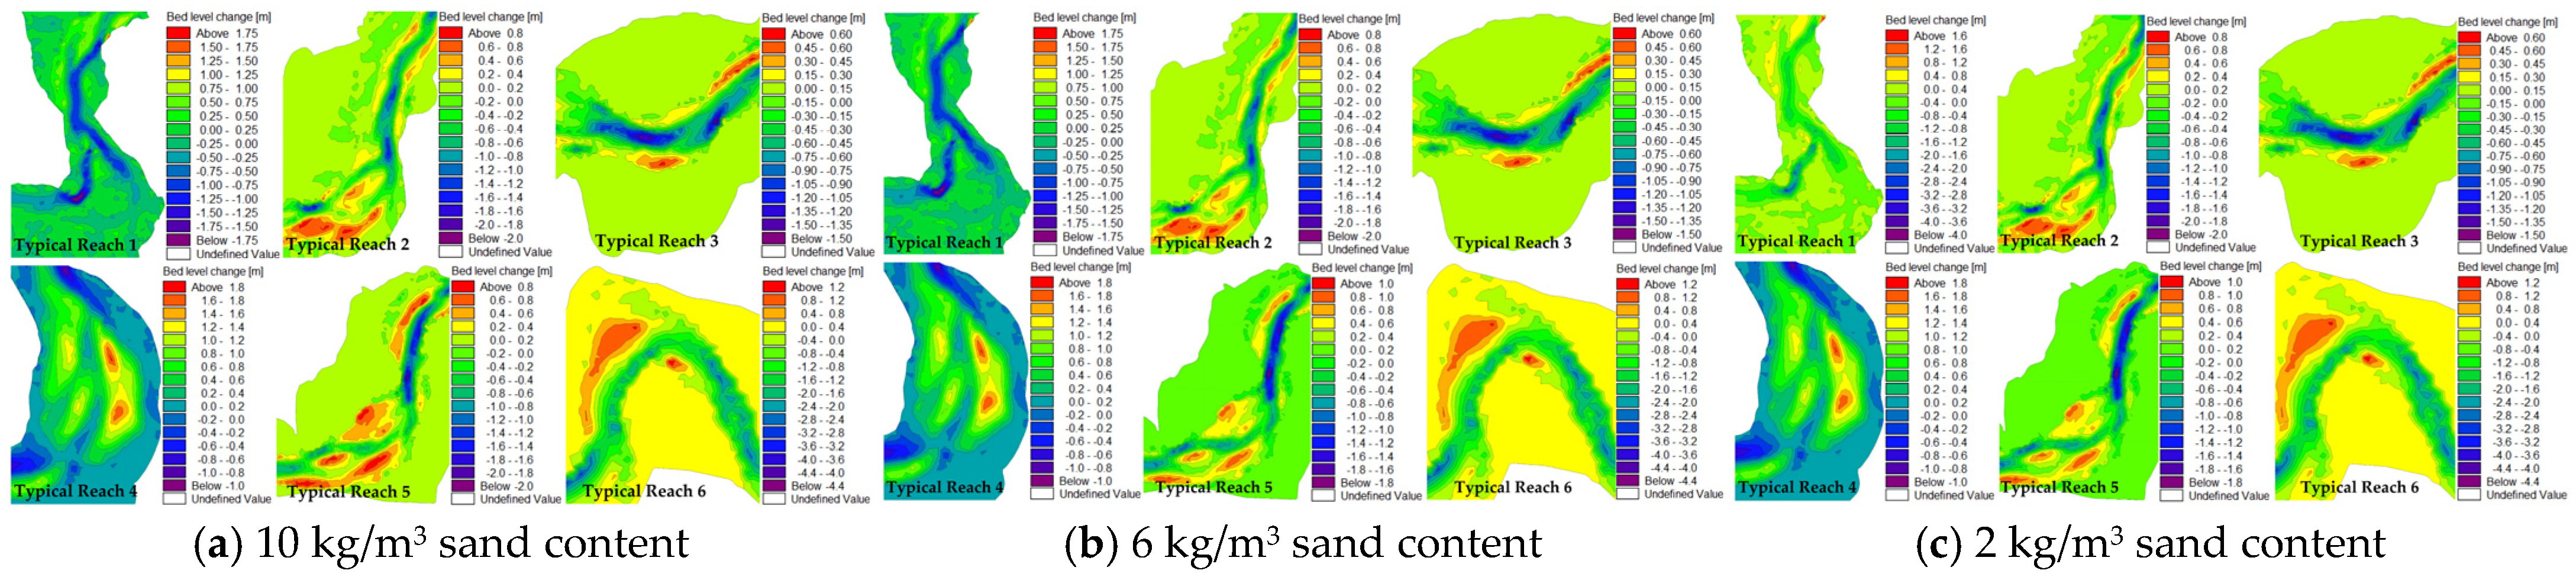
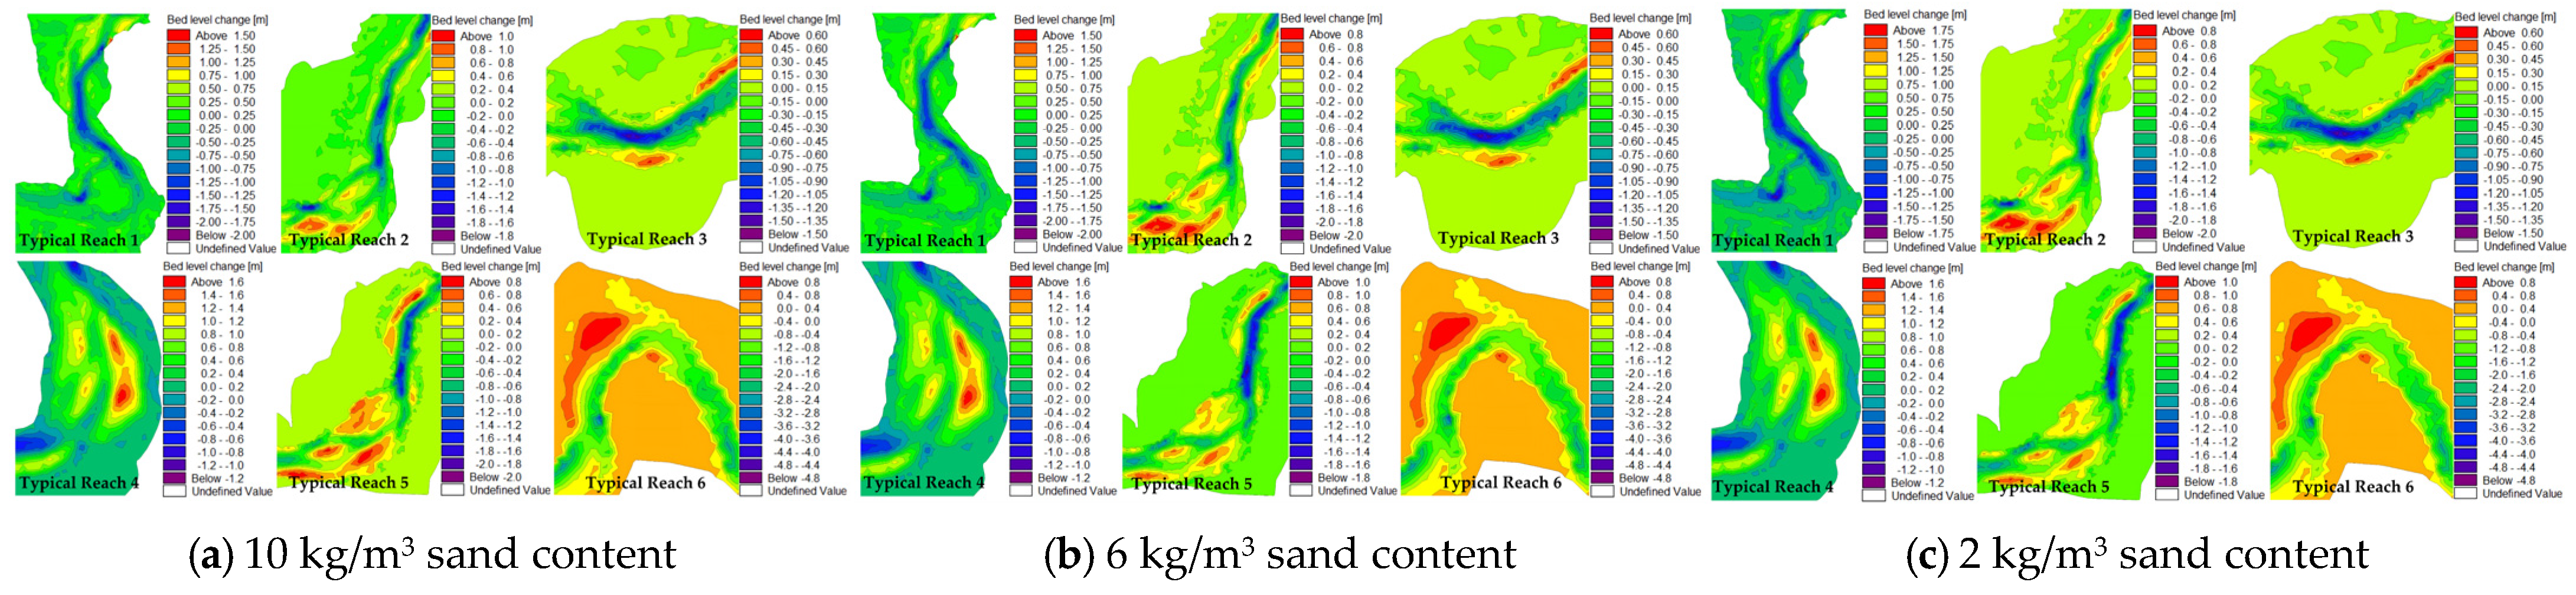
- Changes directly influenced the distribution of erosion and deposition in the riverbed in sediment load, which is a pivotal factor in shaping the riverbed during floods. Under conditions of high sediment load (10 kg/m3), the scouring capacity of the main channel was suppressed, leading to substantial deposition within the floodplain area. Under moderate sediment load conditions (6 kg/m3), the characteristics of bed erosion and deposition differed across various flood events. In contrast, under low sediment load conditions (2 kg/m3), the scouring effect on the main channel of the riverbed was significantly increased, and the riverbed continued to exhibit scouring characteristics even after the flood peak. Conversely, as the sediment load increased, the magnitude of sedimentation in the floodplain also rose. Under equivalent sediment load conditions, the magnitude of flood flow directly influenced the extent of sedimentation in the floodplain.
- 2.
- The role of flood volume and peak flow in shaping the riverbed varied significantly at different flood stages. Through rigorous analysis, it has been determined that during the pre-peak phase of a flood, an elevated flood volume, attributable to its extended duration and substantial cumulative flow, can substantially augment the scouring capacity of the primary channel. This, in turn, fosters the adjustment and reconstruction of the riverbed in depth. In the post-peak phase, the average daily flow rate of the fourth type of flood event was 1060 m3/s, and the corresponding bed-forming flow rate was 1100 m3/s, which had the most significant scouring effect under low-sediment load conditions. By combining high peak flow with a flow that approximates bed-forming conditions after the peak, the central channel’s morphology can be more effectively shaped, enhancing the river’s efficiency in water and sediment transport.
- 3.
- A multifaceted interaction between water and sediment conditions, flood volume, peak flow, and river channel morphology determined the riverbed shaping process. Moderate water and sediment conditions, coupled with an optimal balance of flood volume and peak flow, can achieve a dynamic equilibrium in riverbed morphology. The results indicate that the morphological and sediment transport comprehensive coefficient, denoted by Φ, of the fourth type of flood event was the most substantial among the six types of flood event, and this flow level exhibited superior flood transport capacity. This finding is significant for optimizing water and sediment transport in the Tarim River mainstream from Alar to the Xinquman River section. It provides a reliable basis for flood regulation and management.
- 4.
- Through a comparative analysis of existing research, we believe that the pattern discovered in this study is not only applicable to the Tarim River but may also be applicable to other similar wandering river systems. For instance, Sun, D.P. et al. [56] conducted an in-depth exploration of the scour and deposition patterns in the wandering reaches of the lower Yellow River during flood events. Their findings revealed that it is not the floods with the highest discharge that have the greatest scouring effect, but rather the interaction between riverbed morphology and flood discharge that predominantly governs the processes of erosion and deposition. This aligns with the findings of our study, where the erosion and deposition patterns in the wandering reaches of the lower Yellow River also support the principle of “large floods travel straight, small floods meander, large floods scour, small floods deposit.” Given the similarities in geomorphological characteristics and river types between the study reach and the lower Yellow River, both being wandering reaches, we speculate that the pattern discovered in this study possesses strong universality and can be applied to other similar wandering river systems. Future research may further validate the applicability of this pattern in different wandering rivers and investigate its performance under various hydrological conditions and geological backgrounds.
Author Contributions
Funding
Data Availability Statement
Conflicts of Interest
References
- Dottori, F.; Szewczyk, W.; Ciscar, J.C.; Zhao, F.; Alfieri, L.; Hirabayashi, Y.; Bianchi, A.; Mongelli, I.; Frieler, K.; Betts, R.A.; et al. Increased human and economic losses from river flooding with anthropogenic warming. Nat. Clim. Change 2018, 9, 781–786. [Google Scholar] [CrossRef]
- Hirabayashi, Y.; Mahendran, R.; Koirala, S.; Konoshima, L.; Yamazaki, D.; Watanabe, S.; Kim, H.; Kanae, S. Global flood risk under climate change. Nat. Clim. Change 2013, 3, 816–821. [Google Scholar]
- UN Office for Disaster Risk Reduction. The Human Cost of Disasters: An Overview of the Last 20 Years (2000–2019); UNDRR: Geneva, Switzerland, 2020. [Google Scholar]
- Fang, G.H.; Li, Z.; Yang, J.; Chen, Y.N.; Duan, W.L.; Charles, A.; Wang, Y.Q. Changes in flooding in the alpine catchments of the Tarim River Basin, Central Asia. J. Flood Risk Manag. 2022, 16, e12869. [Google Scholar]
- Li, L. Study on Flood Loss Assessment and Disaster Reduction Strategies in the Middle and Lower Reaches of the Yellow River in Henan Province. Master’s Thesis, Henan University of Technology, Zhengzhou, China, 20 June 2019. [Google Scholar]
- Paul, A.; Biswas, M. Changes in river bed terrain and its impact on flood propagation—A case study of River Jayanti, West Bengal, India. Geomat. Nat. Hazards Risk 2019, 10, 1928–1947. [Google Scholar]
- Sato, H. Model experiments on hydraulic properties around multiple piers with reproduced 3D geometries. Sci. Rep. 2022, 12, 19938. [Google Scholar]
- Mondal, M.; Patel, P.P. Examining the utility of river restoration approaches for flood mitigation and channel stability enhancement: A recent review. Environ. Earth Sci. 2018, 77, 195. [Google Scholar]
- Guo, Q.C.; Zhao, Z.; Huang, L.M.; Deng, A.J. Regularity of sediment transport and sedimentation during floods in the lower Yellow River, China. Int. J. Sediment Res. 2020, 35, 97–104. [Google Scholar]
- Li, J.; Xia, J.Q.; Zhou, M.; Deng, S.S.; Wang, Z.H. Channel geometry adjustments in response to hyper concentrated floods in a braided reach of the Lower Yellow River. Prog. Phys. Geogr. Earth Environ. 2018, 42, 352–368. [Google Scholar] [CrossRef]
- Sun, Z.Y.; Wang, W.J.; Li, Y.; Zhang, M.W.; Shang, H.X.; Zhang, F.X. Can the narrowing of the Lower Yellow River by regulation result in non-siltation and even channel scouring? J. Geogr. Sci. 2016, 26, 1337–1348. [Google Scholar] [CrossRef]
- Li, J.H.; Zhang, M.W.; Jiang, E.H.; Li, P.; Wang, A.X.; Wang, Y.F.; Jian, S.Q. Influence of Floodplain Flooding on Channel Siltation Adjustment under the Effect of Vegetation on a Meandering Riverine Beach. Water 2021, 13, 1402. [Google Scholar] [CrossRef]
- Hu, Y.; Qin, T.L.; Dong, G.Q.; Chen, X.F.; Ruan, H.W.; Zhang, Q.B.; Wang, L.; Wang, M.J. Flood Modeling in a Composite System Consisting of River Channels, Flood Storage Areas, Floodplain Areas, Polder Areas, and Flood-Control-Protected Areas. Water 2024, 16, 825. [Google Scholar] [CrossRef]
- Ye, L.; Zeng, F.J.; Jin, S.F.; Gu, X.F.; Guo, J. Analysis of Flood Conveyance Capacity of Small and Medium-Sized River and Flood Managements. Res. Sq. 2022, 116, 447–467. [Google Scholar] [CrossRef]
- Yuan, X.M.; Cao, L.G.; Jia, S.J.; Tian, F.C. Coupled modeling of bed deformation and stability analysis on a typical vulnerable zone on the Ningxia reach of the Yellow River. J. Flood Risk Manag. 2021, 14, e12704. [Google Scholar] [CrossRef]
- Lo, W.C.; Su, H.; Shih, D.S. Integrating multiple downscaling simulations with continuous In-situ monitoring to assess riverbed scouring. J. Hydrol. 2022, 610, 127841. [Google Scholar] [CrossRef]
- Cheng, Y.F.; Xia, J.Q.; Zhou, M.R.; Wang, Z.H. Coupled two-dimensional model for heavily sediment-laden floods and channel deformation in a braided reach of the Lower Yellow River. Appl. Math. Model. 2024, 131, 423–437. [Google Scholar] [CrossRef]
- Neal, J.; Hawker, L.; Savage, J.; Durand, M.; Bates, P.; Sampson, C. Estimating River Channel Bathymetry in Large Scale Flood Inundation Models. Water Resour. Res. 2021, 57, e2020WR028301. [Google Scholar] [CrossRef]
- Gu, X.H.; Zhang, Q.; Singh, V.P.; Chen, Y.D.; Shi, P. Temporal clustering of floods and impacts of climate indices in the Tarim River basin, China. Glob. Planet. Change 2016, 12, 12–24. [Google Scholar] [CrossRef]
- Gu, X.H.; Zhang, Q.; Vijay, P.; Singh; Liu, L. Nonstationarity in the occurrence rate of floods in the Tarim River basin, China, and related impacts of climate indices. Glob. Planet. Change 2016, 142, 1–13. [Google Scholar] [CrossRef]
- Wang, Y.; Zhang, S.; Zhen, H.; Chang, X.; Shataer, R.; Li, Z. Spatiotemporal evolution characteristics in ecosystem service values based on land use/cover change in the Tarim River Basin, China. Sustainability 2020, 12, 7759. [Google Scholar] [CrossRef]
- Zhang, Q.; Xu, C.Y.; Tao, H.; Jiang, T.; Chen, Y.D. Climate changes and their impacts on water resources in the arid regions: A case study of the Tarim River basin, China. Stoch. Environ. Res. Risk Assess. 2010, 24, 349–358. [Google Scholar] [CrossRef]
- Jiang, F.Q.; Hu, R.J.; Wang, Y.J.; Huang, Y.Y.; Wang, S.D. Response of extreme flood events to potential climate change from warm–dry to warm–wet in Xinjiang. J. Nat. Disasters 2003, 12, 141–146. [Google Scholar]
- Sun, D.P.; Zhang, X.L.; Wang, P.T.; Liu, M.X.; Dong, M.J. Study on the characteristics of erosion and deposition in the wandering reaches of the lower reaches of the Yellow River based on the flooding process. Zhejiang Hydrotech. 2014, 42, 30–37. [Google Scholar]
- Li, Z.W.; Yu, G.A.; Brierley, G.J.; Wang, Z.Y.; Jia, Y.H. Migration and cutoff of meanders in the hyperarid environment of the middle Tarim River, northwestern China. Geomorphology 2017, 1, 116–124. [Google Scholar] [CrossRef]
- Yuan, J.W.; Zong, Q.L.; Feng, B. Characteristics and influencing factors of channel morphology adjustment of the Tarim River. Adv. Sci. Technol. Water Resour. Hydropower 2019, 39, 24–32. [Google Scholar]
- Guo, A.Y.; Li, Z.W.; He, Q.H.; Yao, W.W. Effect of riparian vegetation roots on development of meander bends in Tarim River, Northwest China. In Proceedings of the E3S Web of Conferences, Lyon-Villeurbanne, France, 5–8 September 2018; Volume 40, p. 02029. [Google Scholar]
- Wang, Y.G.; Hu, C.H.; Zhou, W.H. Characteristics of riverbed evolution in the mainstream of the Tarim River. J. Hydraul. Eng. 2003, 12, 27–33. [Google Scholar]
- Wu, X.D.; Luo, M.; Meng, F.H. Analysis of the evolution law and causes of the “four sources” flood in the Tarim River. Arid. Land Geogr. 2024, 47, 15–27. [Google Scholar]
- Xu, L.J. Analysis of sediment characteristics in the Tarim River and prediction of river flow changes. Shaanxi Water Conserv. 2024, 4, 181–183. [Google Scholar]
- Zheng, G. Analysis of flood water loss in the upper reaches of the Tarim River. People’s Yellow River 2024, 46, 23–25. [Google Scholar]
- Tair, E. Analysis of flood control and resource utilization in the mainstream of the Tarim River. Northeast. Water Resour. Hydropower 2024, 42, 50–52. [Google Scholar]
- Fatma, S. Evaluate the numerical models performance in the Nile River. ISH J. Hydraul. Eng. 2024, 30, 696–704. [Google Scholar]
- Pandey, A.; Mishra, S.K.; Kansal, M.L. Hydrological Extremes. Water Scienceand Technology Library 97; Springer: Berlin/Heidelberg, Germany, 2020; pp. 289–306. [Google Scholar]
- Sara, A.; Morteza, E.; Mahsa, K.; Behrooz, M.; Mahdi, G. Simulation of floods under the influence of effective factors in hydraulic and hydrological models using HEC-RAS and MIKE 21. Res. Sq. 2024, 47, 515–527. [Google Scholar]
- De Jayathunga, S.G.S.S.; Samarasekara, R.S.M. A Review of Numerical Simulation Advances and The Role in Evaluating Erosion Control and Shoreline Management. In Proceedings of the International Conference on Simulation & Modelling, Nugegoda, Sri Lanka, 4–7 June 2024. [Google Scholar]
- Parna, P.M.; Colin, D.R.; Jonathan, S. Hydrodynamic Simulation of an Irregularly Meandering Gravel-Bed River: Comparison of MIKE 21 FM and Delft3D Flow models. In Proceedings of the E3S Web of Conferences, Lyon-Villeurbanne, France, 5–8 September 2018; Volume 40, p. 02004. [Google Scholar]
- Fadlillah, L.N.; Widyastuti, M.; Marfai, M.A. Comparison of tidal model using mike21 and delft3d-flow in part of Java Sea, Indonesia. In Proceedings of the IOP Conference Series: Earth and Environmental Science, Bristol, UK, 23–24 June 2020; Volume 45, p. 012067. [Google Scholar]
- Alen, S.; Linkon, B.; Sudip, B.; Balbhadra, T.; Neekita, J.; Ajay, K.; Ritu, G. Coupling HEC-RAS and HEC-HMS in Precipitation Runoff Modelling and Evaluating Flood Plain Inundation Map. In Proceedings of the World Environmental and Water Resources Congress 2020, Henderson, Nevada, 17–21 May 2020; Environmental and Water Resources Institute of ASCE: Reston, VA, USA, 2020; pp. 240–251. [Google Scholar]
- Luo, Q.C.; Liu, L.H.; Wang, Y.M. Research Progress on Application of MIKE 21 Hydrodynamic Model. Adv. Environ. Prot. 2020, 10, 510–515. [Google Scholar]
- Peter, L.G.; Tera, M.G. LiDAR point cloud and ICESat-2 evaluation of 1-second global digital elevation models: Copernicus wins. Trans. GIS 2021, 25, 2245–2261. [Google Scholar]
- Jose, L.B.B.; Michele, M.; Carolina, G. The Global Water Body Layer from TanDEM-X Interferometric SAR Data. Remote Sens. 2021, 13, 5069. [Google Scholar] [CrossRef]
- Michael, M.; Simon, J.; Karin, R. Vertical accuracy assessment of freely available global DEMs (FABDEM, Copernicus DEM, NASADEM, AW3D30, and SRTM) in flood-prone environments. Int. J. Digit. Earth 2024, 17, 2308734. [Google Scholar]
- Ministry of Water Resources of the People’s Republic of China. Hydrological Yearbook of the People’s Republic of China: Volume 10 Hydrological Data of Inland Rivers and Lakes; Ministry of Water Resources of the People’s Republic of China: Beijing, China, 2011. [Google Scholar]
- Ministry of Communications of the People’s Republic of China. JTS/T 231-4-2018 Technical Code for Simulating Water Flow and Sedimentation in Inland Waterway and Port; People’s Communications Press: Beijing, China, 2018. [Google Scholar]
- Zheng, G.Y.; Zhang, Y.; Yang, P.; Li, Q.H.; Chen, Z.; Zhao, G.Q.; Gao, J.F.; Ma, G.Z.; Wu, Z.; He, F.; et al. Feasibility Study Report on Flood Control Project of Shaya Section of the Main Stream of Tarim River in Xinjiang Uygur Autonomous Region; China Industry Wuda Design Group Co., Ltd.: Wuhan, China, 2022. [Google Scholar]
- Guo, Q.C.; Wang, X.P.; Zhou, J.; Zhang, Y.J.; Lu, Q.; Qi, W.; Deng, A.J.; Lu, W.; Ge, F.Y.; Liu, F. Study on the Law of Water and Sediment Movement after Recent Management of the Tarim River Mainstream; China Water Resources and Hydropower Press: Beijing, Chian, 2016. [Google Scholar]
- Li, X.P.; Tian, Y.; Zhang, C.P.; Wang, F.Y. Research on the index and sand transport capacity of the lower reaches of the Yellow River. Sediment Res. 2024, 49, 34–41. [Google Scholar]
- Bi, N.S.; Sun, Z.Q.; Wang, H.J.; Wu, X.; Fan, Y.Y.; Xu, C.L.; Yang, Z.S. Response of Channel Scouring and Deposition to the Regulation of Large Reservoirs: A Case Study of the Lower Reaches of the Yellow River. J. Hydrol. 2019, 568, 972–984. [Google Scholar] [CrossRef]
- Yuan, X.M.; Tiana, F.C.; Wanga, X.J.; Liu, Y.C.; Chen, M.T. Small-scale sediment scouring and siltation laws in the evolution trends of fluvial facies in the Ningxia Plain Reaches of the Yellow River (NPRYR). Quat. Int. 2018, 476, 14–25. [Google Scholar]
- Sun, D.P.; Wang, Q.X.; Wang, P.T. Determination of bed-forming discharge in the lower reaches of the Yellow River based on the water-sediment relationship coefficient method. J. Hydraul. Eng. 2013, 32, 150–155. [Google Scholar]
- Li, X.J.; Xia, J.Q.; Li, J.; Zhang, X.L. The flat beach channel morphology adjustment law during continuous sedimentation and scouring in the wandering reach of the lower reaches of the Yellow River. J. Sichuan Univ. 2015, 47, 97–104. [Google Scholar]
- Zhang, X.L.; Zhang, Y.K.; Sun, D.P. Two-dimensional numerical simulation of flooding at the beach-channel interface in a typical reach of the lower reaches of the Yellow River. Water Resour. Hydropower Eng. 2013, 44, 120–124. [Google Scholar]
- Leo, C.; Rijn, V. Unified View of Sediment Transport by Currents and Waves. II: Suspended Transport. J. Hydraul. Eng. 2007, 133, 668–689. [Google Scholar]
- Feng, Z.; Sun, Z.Y.; Peng, H.; Shang, H.X.; Bai, L. Research on the impact of the coming sand coefficient on the erosion and deposition of the river. People’s Yellow River 2019, 41, 44–48. [Google Scholar]
- Sun, D.P.; Liu, M.X.; Zhang, X.L.; Sun, Y. Response of bed adjustment of alluvial rivers to flood sediment process case study of the wandering reach of the Yellow River. Adv. Water Sci. 2014, 25, 668–676. [Google Scholar]


| Flood Event | Occurrence Time | Peak Flow (m3/s) | Flood Volume (m3) | Sediment Concentration (kg/m3) |
|---|---|---|---|---|
| The first type | 4 August 2001–4 September 2001 | 1250 | 20,000 | 2, 6, 10 |
| The second type | 13 July 2001–13 August 2001 | 1420 | 20,000 | 2, 6, 10 |
| The third type | 27 July 2005–27 August 2005 | 1490 | 27,000 | 2, 6, 10 |
| The fourth type | 20 July 2006–20 August 2006 | 1810 | 31,000 | 2, 6, 10 |
| The fifth type | 19 July 2010–19 August 2010 | 1870 | 37,000 | 2, 6, 10 |
| The sixth type | 4 August 2022–4 September 2022 | 1820 | 37,000 | 2, 6, 10 |
| Flood Event | Total Flow Before Peak Stage (m3) | Total Flow After Peak Stag (m3) | Average Daily Flow Before Peak Stage (m3/s) | Average Daily Flow After Peak Stage (m3/s) |
|---|---|---|---|---|
| The fourth type | 7300 | 21,000 | 730 | 1083 |
| The fifth type | 14,400 | 21,000 | 1030 | 1235 |
| Flood Event | Total Flow Before Peak Stage (m3) | Total Flow After Peak Stag (m3) | Average Daily Flow Before Peak Stage (m3/s) | Average Daily Flow After Peak Stage (m3/s) |
|---|---|---|---|---|
| The first type | 8773 | 9867 | 585 | 617 |
| The second type | 7698 | 11,000 | 513 | 666 |
Disclaimer/Publisher’s Note: The statements, opinions and data contained in all publications are solely those of the individual author(s) and contributor(s) and not of MDPI and/or the editor(s). MDPI and/or the editor(s) disclaim responsibility for any injury to people or property resulting from any ideas, methods, instructions or products referred to in the content. |
© 2025 by the authors. Licensee MDPI, Basel, Switzerland. This article is an open access article distributed under the terms and conditions of the Creative Commons Attribution (CC BY) license (https://creativecommons.org/licenses/by/4.0/).
Share and Cite
Zhao, M.; Li, Y.; Li, L.; Dai, W. Response of Riverbed Shaping to a Flood Event in the Reach from Alar to Xinquman in the Mainstream of the Tarim River. Water 2025, 17, 1092. https://doi.org/10.3390/w17071092
Zhao M, Li Y, Li L, Dai W. Response of Riverbed Shaping to a Flood Event in the Reach from Alar to Xinquman in the Mainstream of the Tarim River. Water. 2025; 17(7):1092. https://doi.org/10.3390/w17071092
Chicago/Turabian StyleZhao, Mingcheng, Yujian Li, Lin Li, and Wenhong Dai. 2025. "Response of Riverbed Shaping to a Flood Event in the Reach from Alar to Xinquman in the Mainstream of the Tarim River" Water 17, no. 7: 1092. https://doi.org/10.3390/w17071092
APA StyleZhao, M., Li, Y., Li, L., & Dai, W. (2025). Response of Riverbed Shaping to a Flood Event in the Reach from Alar to Xinquman in the Mainstream of the Tarim River. Water, 17(7), 1092. https://doi.org/10.3390/w17071092