Article

Hydrological Effects of Bioretention Facilities in an Environment with a High Groundwater Table and Their Impacts on Groundwater

1
Key Laboratory of Urban Stormwater System and Water Environment, Ministry of Education, Beijing University of Civil Engineering and Architecture, Beijing 100044, China
2
Collaborative Innovation Center of Energy Conservation & Emission Reduction and Sustainable Urban-Rural Development in Beijing, Beijing 100044, China
*
Author to whom correspondence should be addressed.
Water 2025, 17(7), 1096; https://doi.org/10.3390/w17071096
Submission received: 6 March 2025 / Revised: 31 March 2025 / Accepted: 4 April 2025 / Published: 6 April 2025
(This article belongs to the Special Issue Urban Water Management: Challenges and Prospects)

Abstract

:
With urbanization accelerating, low-impact development (LID) facilities, particularly bioretention facilities, play a crucial role in urban water management. However, rising groundwater tables present challenges for their application in high-water-table areas. This study experimentally evaluated the impact of shallow groundwater tables on the hydrological performance of bioretention facilities. The experiment was designed to evaluate the effects of different groundwater table levels, soil media types, runoff ratios, and rainfall characteristics on hydrological responses. It also examined their impact on drainage pipe design and groundwater recharge. Results showed that as the groundwater table rose from 0.2 m to 0.5 m, the drainage pipe discharge increased (Facility #1: 52%→76%, Facility #3: 31%→58%) while the groundwater recharge decreased (Facility #1: 44%→17%, Facility #3: 63%→39%). This indicates that a higher groundwater table intensifies the diversion effect of the drainage pipe, increasing the proportion of stormwater discharged while reducing the proportion infiltrating to recharge the groundwater. Under moderate to heavy rainfall, sandy loam reduced the drainage time by 41–43% and increased the groundwater recharge by up to 80%. Without drainage pipes, sandy loam enhanced the recharge rates (α = 0.87), and #3 exhibited superior infiltration. Rainfall intensity and interval significantly influenced the hydrological performance.

1. Introduction

Groundwater constitutes a fundamental component of the global hydrological cycle [1], serving as an essential resource for sustaining socioeconomic and agricultural development, securing the residential water supply, and preserving ecological equilibrium [2]. In recent years, rapid socioeconomic development has exacerbated environmental geological challenges, including groundwater depletion and land subsidence, in various regions [3,4,5]. The strategic enhancement of non-conventional water resource utilization has become a pivotal approach to addressing water supply–demand imbalances and mitigating environmental geological concerns. Notably, urban stormwater, distinguished by its relatively high water quality, has garnered increasing attention as a preferred source for collection and reuse [6].
However, the rapid acceleration of global urbanization has resulted in the extensive expansion of impervious surfaces (e.g., concrete, asphalt), profoundly transforming the natural hydrological regime. These alterations have precipitated a cascade of ecological and environmental repercussions including exacerbated urban flooding, diminished rainwater infiltration, and progressive groundwater depletion [7,8,9]. These challenges present a formidable impediment to the sustainable development of urban environments. In response to these pressing challenges, China has vigorously advanced the “sponge city” initiative, facilitating the extensive deployment of low-impact development strategies. These initiatives are designed to holistically enhance urban water ecology, water quality, water resource sustainability, and water security through integrated stormwater management approaches [10,11].
Common low impact development (LID) practices include permeable pavements, which allow stormwater to infiltrate through porous surfaces; green roofs, which capture precipitation and reduce runoff volumes; and infiltration trenches, which facilitate subsurface drainage. Each LID technique has distinct advantages and limitations. For instance, permeable pavements are effective in traffic areas but require regular maintenance to prevent clogging. As a common LID technology, bioretention facilities have gained widespread adoption in urban stormwater management in recent years [12]. These systems emulate the hydrological dynamics of natural ecosystems, leveraging the synergistic interactions between soil, vegetation, and microbial communities to retain, filter, and facilitate the infiltration of stormwater, thereby mitigating surface runoff and augmenting groundwater recharge [13]. Beyond their efficacy in stormwater pollutant removal, bioretention facilities contribute to urban microclimate regulation, foster ecological habitats, and yield substantial environmental and societal benefits [14,15,16].
However, in recent years, the extensive deployment of LID facilities, coupled with escalating urban space constraints, has led to their growing adoption in high-groundwater-level regions, introducing novel challenges [17]. In such regions, elevated groundwater tables may lead to an excessively shallow interface between the groundwater and the bottom of the bioretention facilities, potentially impairing their hydrological performance and ecological functionality [18,19]. In the planning of sponge cities within high-groundwater environments, it is imperative to evaluate not only the runoff regulation capacity of LID facilities, but also their broader implications for groundwater dynamics [20]. Notably, when sponge facilities are employed to enhance groundwater recharge as a means of mitigating surface runoff, the consequent rise in the groundwater table may profoundly alter their hydrological functionality [21]. The hydrological performance of bioretention facilities is governed by a multitude of interacting factors; however, prior research has predominantly concentrated on surface-level influences, often neglecting the critical role of groundwater. A rising groundwater table may not only curtail the residence time of stormwater within LID facilities, thereby limiting its interaction with filtration media and impairing treatment efficacy, but also induce prolonged water stagnation, escalate maintenance costs, jeopardize structural integrity, and heighten the risk of groundwater contamination [22].
While extensive research has been conducted on the effectiveness of bioretention facilities in managing surface water, studies addressing their hydrological responses and environmental implications in high-groundwater-level regions remain limited [23]. Consequently, the optimization of LID facility design in shallow groundwater environments has emerged as a pressing research priority [24]. Zhang et al. proposed incorporating low-permeability media soil into bioretention facilities to achieve an optimal balance between runoff regulation and groundwater conservation [25]. Locatelli et al. established empirical guidelines for determining the optimal vertical separation between infiltration trench bases and the groundwater table across diverse soil conditions [26,27]. Nevertheless, these recommendations are largely empirical, and their applicability and effectiveness across varied hydrological and environmental settings remain inadequately investigated.
However, these recommendations appear to be experience-based suggestions, and their feasibility and effectiveness in different contexts have not been thoroughly examined. This study sought to bridge this research gap by employing experimental approaches to assess the hydrological performance of bioretention facilities in shallow groundwater settings and their potential influence on groundwater. The findings will offer a scientific foundation for optimizing the design and application of LID facilities in high-groundwater-level regions, thereby advancing the sustainable implementation of sponge city strategies across diverse hydrological contexts.

2. Materials and Methods

2.1. Experimental Devices and Materials

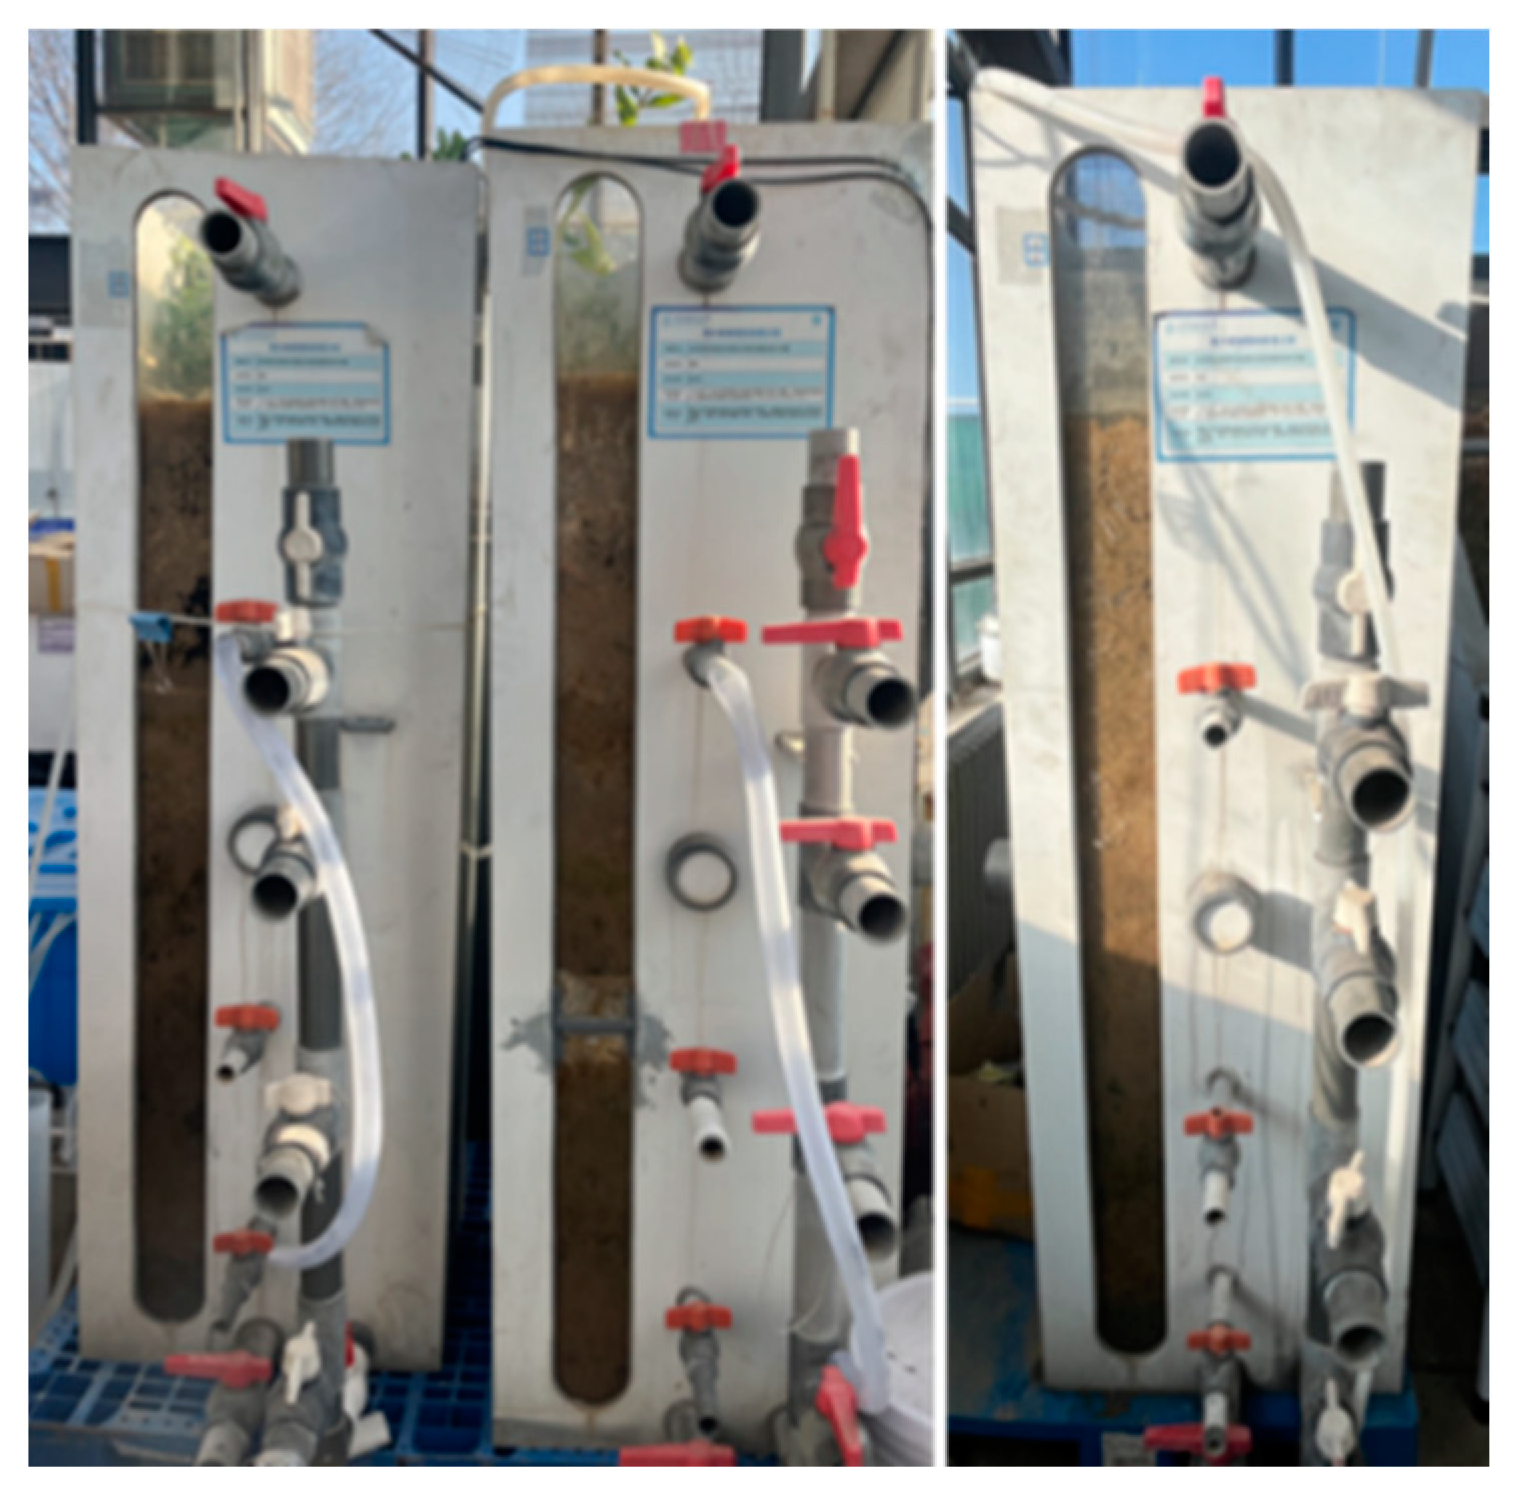
2.1.1. Experimental Device

As illustrated in the Figure 1, three experimental setups (#1, #2, and #3) were constructed, each consisting of a rectangular soil column with dimensions of 500 mm × 500 mm × 1600 mm. An auxiliary column was hydraulically connected to the base of the main column to regulate the groundwater tables, allowing for the laboratory simulation of bioretention facilities under shallow groundwater conditions.
Groundwater table regulation: The groundwater tables in the soil columns were controlled at 0.2 m, 0.3 m, and 0.5 m, corresponding to interface distances of 0.8 m, 0.7 m, and 0.5 m between the bottom of the bioretention facility and the shallow groundwater table (IDGW), to simulate the bioretention facilities in the shallow groundwater environment commonly found in cities with a high groundwater level. A constant-head groundwater system was simulated in the laboratory, where infiltrated rainfall contributing to groundwater recharge was drained through an adjacent column.

2.1.2. Experimental Materials

As shown in Figure 2, the soil columns were structured into distinct functional layers. The 0–1000 mm section constituted the soil layer, where column #1 contained sandy loam, while column # 3was filled with loam. The 1000–1050 mm section served as the drainage layer, incorporating a cross-arranged drainage pipe system embedded in gravel with a particle size of approximately 10 mm. By controlling the drainpipe valve (open/closed), we investigated its regulatory effects on the hydrological performance. The 1050–1300 mm section functioned as the bioretention substrate layer, consisting of a modified soil blend of sand, loam, perlite, and vermiculite in an 8:4:2:1 ratio. Hylotelephium erythrostictum (Miq.) H. Ohba (herbaceous) was planted at a density of 40 plants per square meter. The 1300–1450 mm section served as the storage layer, regulating water retention and outflow within the bioretention facilities. Overflow will occur when the height exceeds 1450 mm. In column #2, the entire 0–1300 mm section was filled with loam.
The experimental soils comprised sandy loam, loam, and modified soil. Fundamental soil parameters (Table 1)—including bulk density, saturated volumetric water content, and saturated hydraulic conductivity—were determined prior to the experiment.

2.2. Experimental Design

2.2.1. Simulated Rainfall

Twelve artificial water distribution experiments were conducted (Table 2) considering factors such as the interface distance between the shallow groundwater table and the facility bottom (groundwater table), soil and substrate media, runoff coefficient, storage height, rainfall duration, return period, rainfall interval, and urban stormwater characteristics in high-groundwater-level regions. The experiments aimed to investigate the interactions between bioretention facilities and shallow groundwater under varying hydrological conditions.
Artificial rainfall simulations were conducted at intensities of 4.44 mm/h, 15.26 mm/h, and 41.37 mm/h, representing light, moderate, and heavy rainfall, respectively. These values were derived from 20 years of historical rainfall intensity data for a high-groundwater-level region. Statistical analysis of rainfall data from the past 20 years indicated that the average dry period between rainfall events from April to October was 6.2 days. Consequently, a 7-day rainfall interval was adopted. To further account for experimental variability, rainfall intervals of 7 and 14 days were selected. The study examined the performance of bioretention facilities with and without a drainage pipe, providing insights into the optimal drainage configurations for various urban settings. Schematic diagram of the simulation rainfall experiment process is shown in Figure 3.
In accordance with the Technical Guidelines for Sponge City Construction—Low-Impact Development Rainwater System Construction (Trial), (MOHURD, 2014), our study aligned with China’s national standards for stormwater management and bioretention system design. Bioretention facilities typically occupy 5–10% of the total catchment area. In this experiment, a bioretention facility was designed to cover 10% of the catchment area. The experimental setup simulated an urban roadway, with an impermeable pavement runoff coefficient typically ranging from 0.85 to 0.95. A coefficient of 0.9 was adopted, indicating that the total water volume reaching the soil column was nine times the rainfall input.
In our experiment, each hydrological condition (different groundwater levels and rainfall intensities) was tested in triplicate to ensure the reliability of the results.

2.2.2. Monitoring of Parameters

The influent flow rate was regulated by a peristaltic pump (WT600-2J-A), whereas the overflow was manually quantified using the volumetric method. Before the experiment, the stability of the flow rate was verified by the method of timed measurement to ensure that the error of the rainfall intensity was less than ±3%. The visual reading error of the manual volume measurement (overflow graduated cylinder) was ±0.01 L. The outflow from the drainage pipes and the groundwater recharge resulting from rainwater infiltration were measured using a tipping-bucket rain gauge (HOBO RG3-M) and a calibrated water tank. Prior to the experiment, a standard graduated cylinder was used to calibrate the volume of the tipping-bucket rain gauge, with the calibration error being less than ±2%.
Two soil temperature and moisture sensors were positioned at depths of 700 mm and 1100 mm in each soil column. Soil moisture variations were recorded in real-time using multilayer TDR (time-domain reflectometry) soil moisture sensors with a measurement accuracy of 0–100% (±2%).
Instrument calibration was carried out before the experiment to ensure the accuracy of the data. However, potential measurement uncertainties should be acknowledged. Sensor drift, environmental interference, and soil heterogeneity may introduce errors in the groundwater level and moisture content measurements. To minimize these uncertainties, repeated measurements were conducted at each observation point, and data from different sensors were cross-validated.

2.3. Analytical Method

The groundwater recharge coefficient (α) was determined using Equation (1):
α = F g / V
where α represents the groundwater recharge coefficient (%), Fg refers to the volume of infiltrated stormwater that contributes to groundwater recharge (i.e., bottom leakage) in the bioretention facility (L), and V denotes the total stormwater runoff from the catchment area (L). Experimental data were processed and analyzed using Microsoft Excel 2019, and visualizations were created with Origin 2018.

3. Results and Discussion

3.1. Synergistic Effect of Facility Structure and Medium Soil

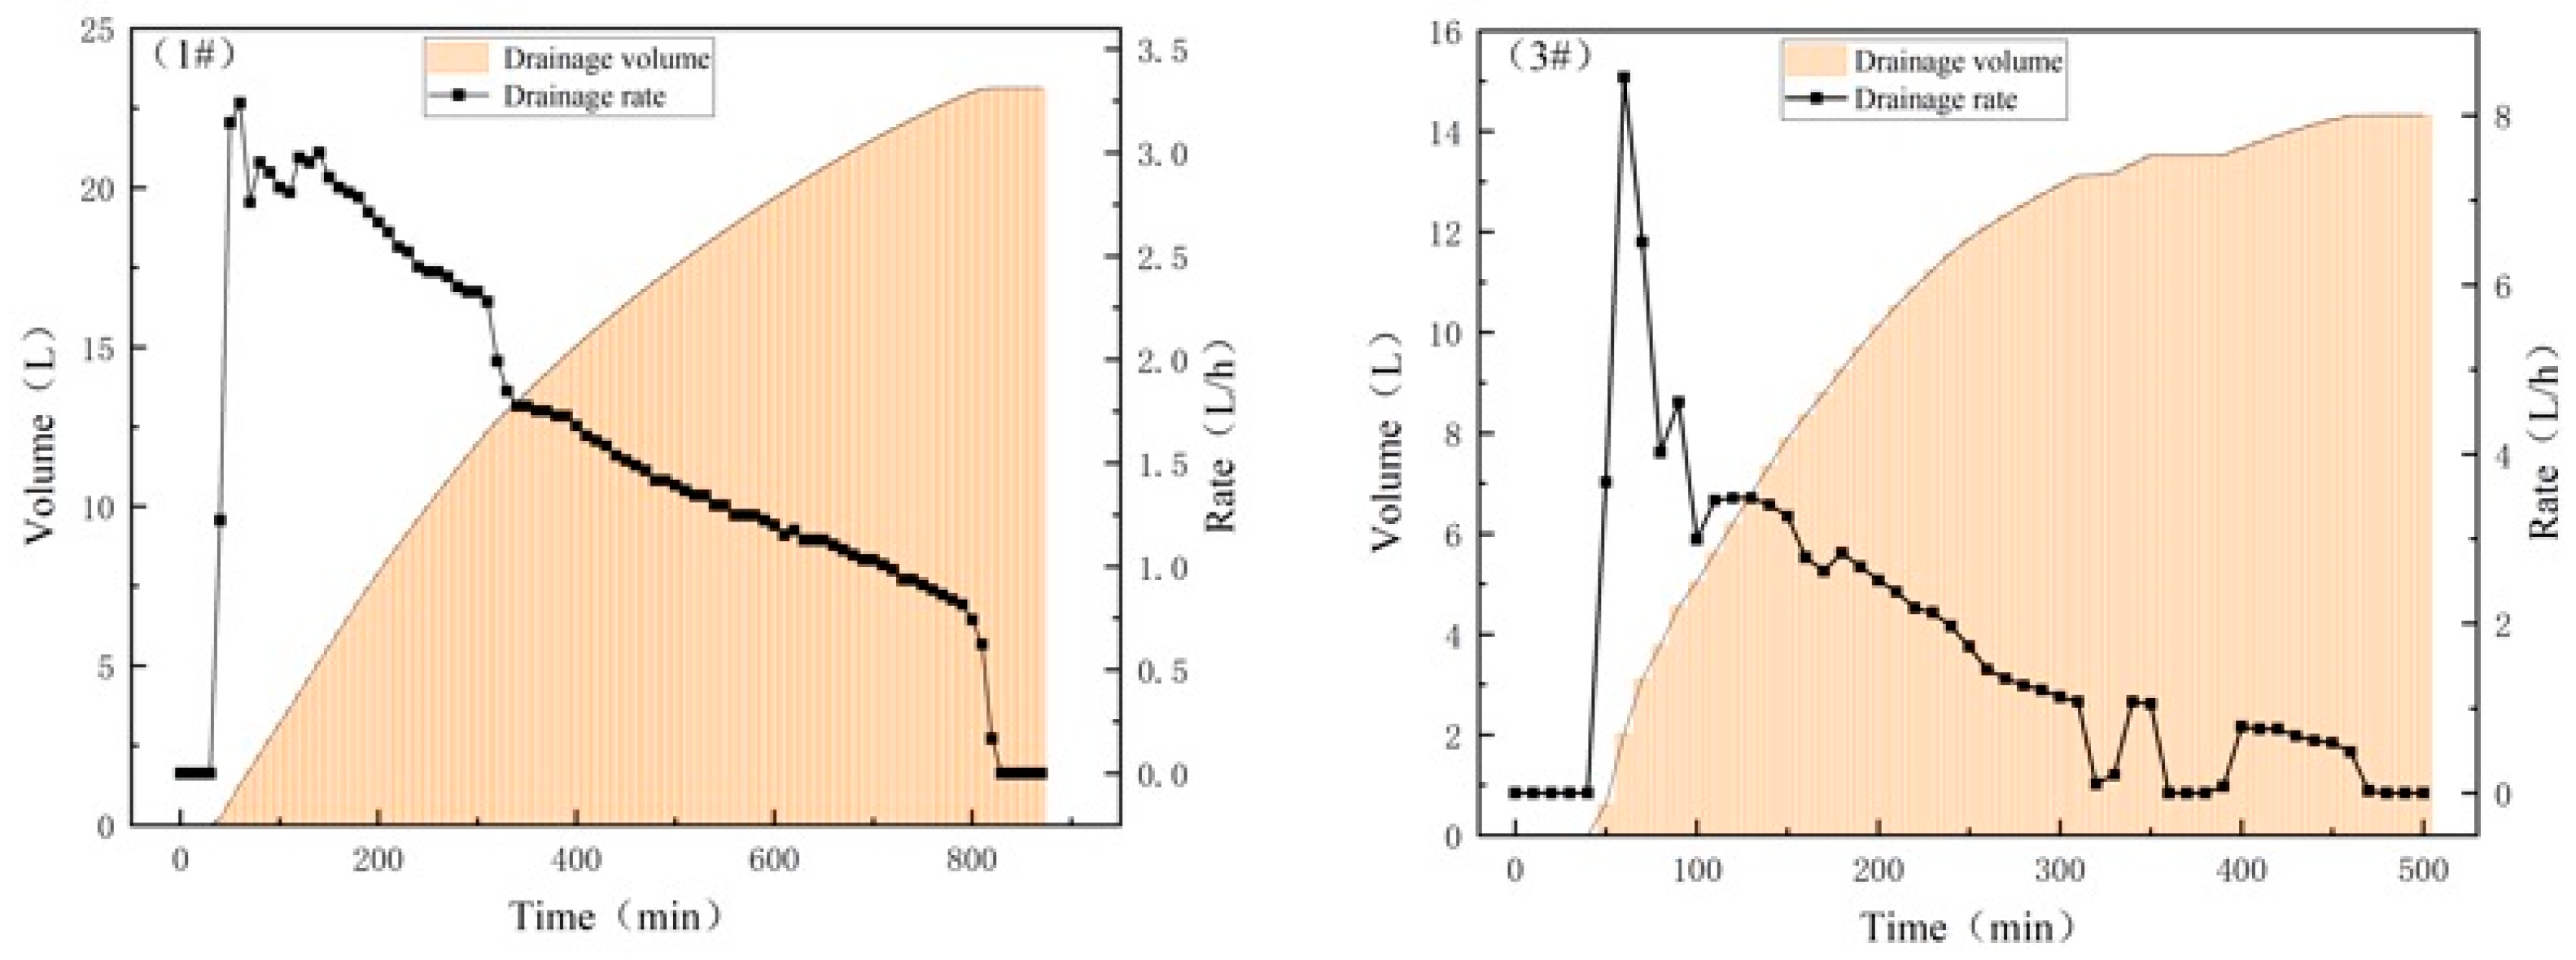
3.1.1. Influence of Drain Pipe Design on Hydrological Performance of the Facility and Groundwater Recharge

This analysis focused on #1 and #3, both equipped with a drainage layer, to investigate the regulatory role of drainage pipe design. #2 lacked a drainage layer and was therefore excluded from this comparison.
(1) Under heavy rainfall conditions (41.37 mm/h)
Under heavy rainfall conditions (41.37 mm/h), overflow occurred, generating surface runoff. The total inflow volume was 92.48 L, with overflow volumes of 46.5 L and 38 L for #1 and #3, respectively. As shown in Figure 4 and Table 3, the drainage layer of Facility #1 required 830 min to fully drain, with a total discharged volume of 23.13 L. The groundwater recharge rate exhibited a “rise-then-fall” pattern, peaking at 3.14 L/h at the 55th minute after inflow initiation. This indicates a significant retention effect at the bottom of the loam layer, which hinders rapid percolation and causes part of the water to be discharged through the drainage pipe. The installation of a drainage pipe reduced the groundwater recharge of #1 by 54% (from 45.63 L to 20.98 L). Of the stormwater entering the facility, 50% was discharged through the drainage pipe, while 46% infiltrated to recharge the groundwater. The remaining portion likely evaporated or was retained in the soil. The groundwater recharge coefficient (α) decreased from 0.49 to 0.23, whereas the surface runoff reduction rate remained nearly unchanged.
As shown in Figure 4 and Table 3, the drainage layer of Facility #3 required 490 min to fully drain, with a total discharged volume of 14.32 L. The outflow rate peaked at 8.45 L/h at the 64th minute after inflow initiation, then rapidly declined to 4.65 L/h. The high permeability of sandy loam facilitated greater infiltration into the soil layer, directly enhancing groundwater recharge. Consequently, the drainage volume was reduced, and the drainage duration was shortened. The installation of a drainage pipe reduced the groundwater recharge of #3 by 18% (from 46.29 L to 37.81 L). Of the stormwater entering the facility, 26% was discharged through the drainage pipe, while 69% infiltrated to recharge the groundwater. The groundwater recharge coefficient (α) decreased from 0.5 to 0.4, whereas the runoff reduction rate increased from 57% to 59%.
(2) Under moderate rainfall conditions (15.26 mm/h)
Under moderate rainfall conditions (15.26 mm/h), no overflow occurred, and no surface runoff was generated. The total inflow volume was 34.3 L. As shown in Figure 5 and Table 3, the drainage layer of Facility #1 required 530 min to fully drain, with a total discharged volume of 17.7 L. The installation of a drainage pipe reduced the groundwater recharge of #1 by 48% (from 28.72 L to 15.1 L). Of the stormwater entering the facility, 52% was discharged through the drainage pipe, while 44% infiltrated to recharge the groundwater. The remaining portion likely evaporated or was retained in the soil. The groundwater recharge coefficient (α) decreased from 0.84 to 0.44.
As shown in Figure 5 and Table 3, the drainage layer of Facility #3 required 300 min to fully drain, with a total discharged volume of 10.5 L. The installation of a drainage pipe reduced the groundwater recharge of #3 by 28% (from 29.95 L to 21.7 L). Of the stormwater entering the facility, 31% was discharged through the drainage pipe, while 63% infiltrated to recharge the groundwater. The remaining portion likely evaporated or was retained in the soil. The groundwater recharge coefficient (α) decreased from 0.87 to 0.63.
Both #1 and #3 featured a bioretention facility in the upper layer, while their lower soil layers differed, with #1 composed of loam and #3 composed of sandy loam. Under both moderate and heavy rainfall conditions, the soil type in the lower layer influenced the drainage duration and the outflow volume from the drainage pipe. Compared with loam, sandy loam reduced the drainage duration by approximately 41–43%, decreased the drainage pipe outflow by 38–40%, and increased the groundwater recharge by 44–80%. This result is consistent with the conclusions by Zhang et al. regarding the enhancement in groundwater recharge through permeable media [28], and further quantifies the regulatory role of drainage pipe design. This difference is likely attributed not only to the high permeability of sandy loam (K = 10.84 mm/h), which effectively reduces the drainage pipe outflow and enhances groundwater recharge efficiency [19], but also to the “capillary retention effect” induced by the low hydraulic conductivity of loam (K = 1.86 mm/h) [29].
When a drainage pipe was installed, a decrease in rainfall intensity from heavy to moderate resulted in a reduction in drainage duration for both facilities, with Facility #1 and Facility #3 exhibiting decreases of 36% and 38%, respectively. However, the distribution of stormwater within the facility—whether discharged through the drainage pipe or infiltrated to recharge groundwater—was not significantly affected. This phenomenon was attributed to overflow during heavy rainfall, which limited the difference in infiltrated stormwater volume compared with moderate rainfall conditions.
Under heavy rainfall conditions, the installation of a drainage pipe reduced the groundwater recharge in #1 by 54% (from 45.63 L to 20.98 L), whereas in #3, the reduction was only 18% (from 46.29 L to 37.81 L). Under moderate rainfall conditions, the drainage pipe installation led to a 48% decrease in groundwater recharge in #1 (from 28.72 L to 15.1 L) and a 28% decrease in #3 (from 29.95 L to 21.7 L). These findings suggest that the permeability advantage of sandy loam can partially offset the diversion effect of the drainage pipe.
The low hydraulic conductivity of loam (K = 1.86 mm/h) resulted in stormwater runoff being preferentially discharged through the drainage pipe (accounting for 50–52%), whereas the high permeability of sandy loam allowed a greater proportion of stormwater (63–69%) to infiltrate directly. This is consistent with Darcy’s law, which describes the positive correlation between the permeability rate and hydraulic gradient, thereby validating the design principle that highly permeable media enhance the groundwater recharge efficiency [30].

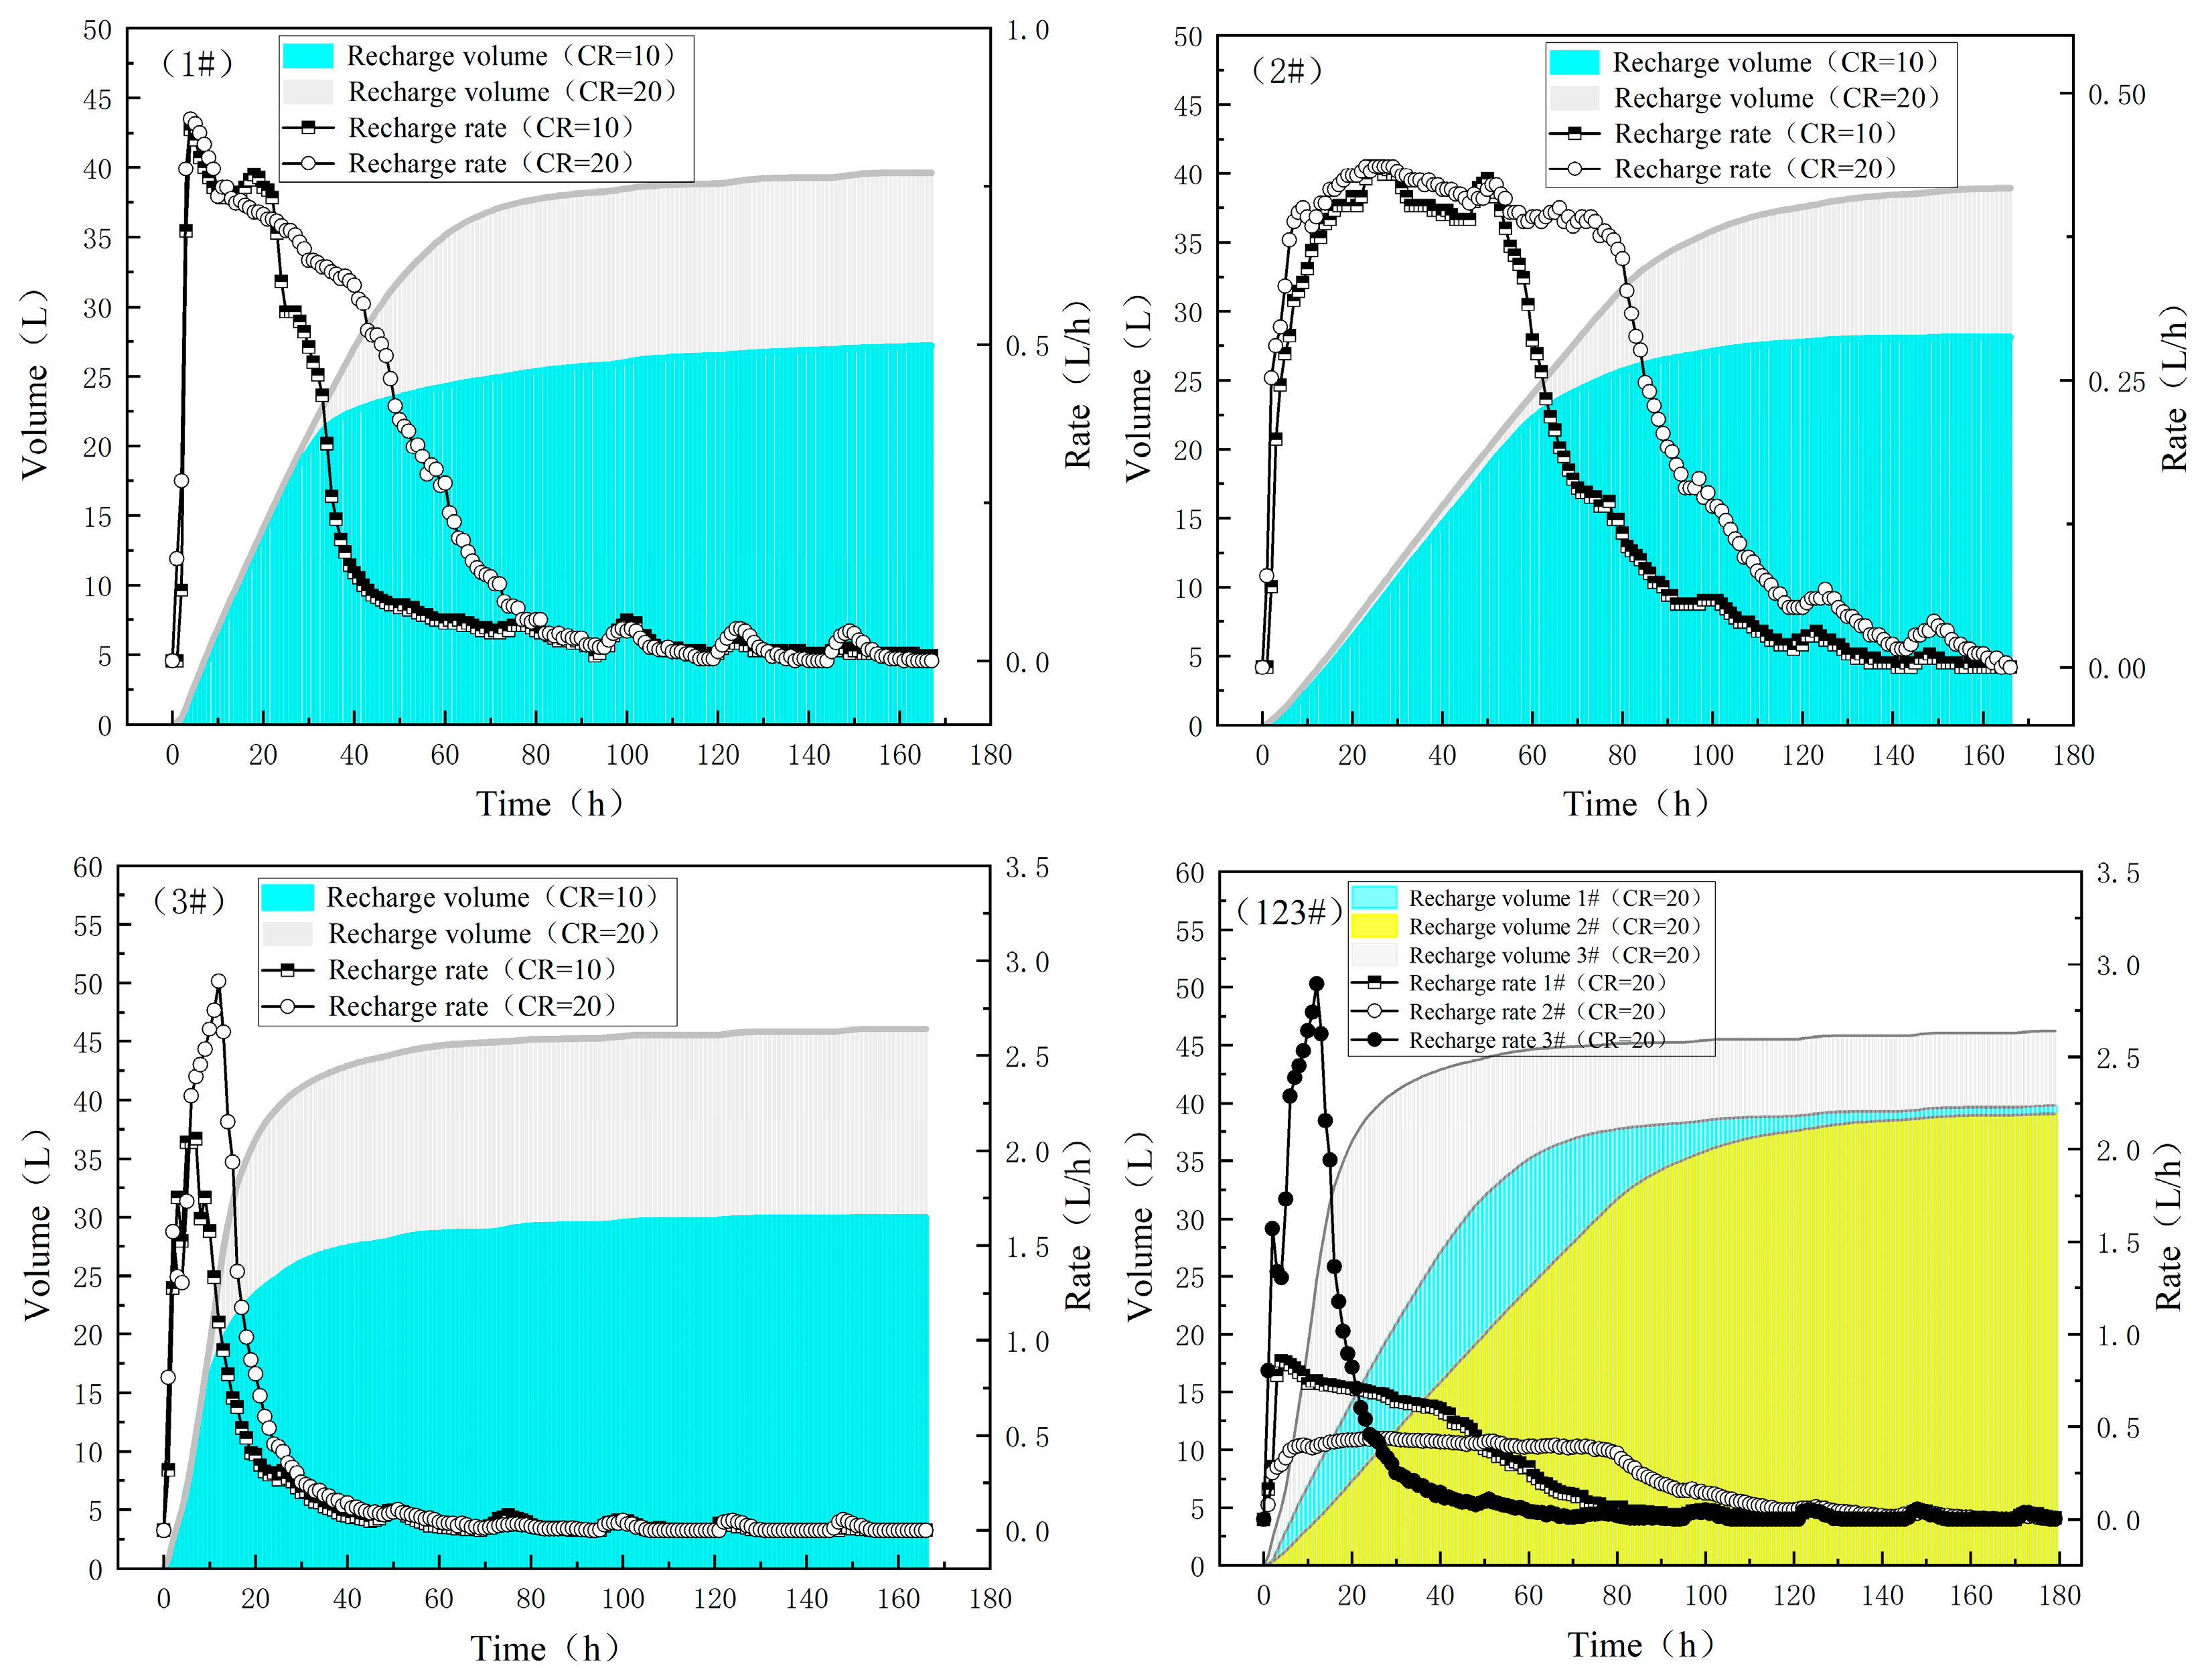
3.1.2. Influence of the Confluence Ratio on the Hydrological Performance of the Facility and Groundwater Recharge

As shown in Figure 6 and Table 4, when the groundwater table was set at 0.2 m (IDGW = 0.8 m) and the runoff ratio was adjusted from 10:1 to 20:1, the groundwater recharge in #1 increased by 40%, whereas the recharge coefficient decreased from 0.84 to 0.58, with no significant change in the peak recharge rate. Similarly, the groundwater recharge in #2 increased by 39%, while the recharge coefficient declined from 0.82 to 0.57, with no notable variation in peak recharge rate. In #3, the groundwater recharge increased by 55%, and although the recharge coefficient decreased from 0.87 to 0.68, the time to reach the peak recharge was delayed compared with a 10:1 runoff ratio. However, the peak recharge rate increased by 45%, confirming the responsiveness of highly permeable media to rapid infiltration and drainage demands [31]. High-runoff-ratio facilities require rapid drainage; thus, a higher peak recharge rate (as observed in #3) is an effective strategy for adapting to elevated runoff ratios. In contrast, loam exhibits greater water storage capacity but slower drainage, which may cause the facility to remain near saturation for extended periods.
Low-permeability media (e.g., loam) exhibit a limited capacity to regulate peak outflow rates, with runoff ratio variations having a minimal impact on the peak rates. An increased runoff ratio primarily enhances the total recharge by extending the drainage duration, making it more suitable for low-runoff-ratio conditions. However, under high-runoff-ratio conditions, prolonged saturation may occur, potentially compromising the facility’s water purification function.
High-permeability media (e.g., amended soil and sandy loam) respond rapidly to increased runoff ratios, significantly enhancing the drainage rates and reducing water retention time within the facility. These media are better suited for high-runoff-ratio conditions, effectively mitigating the pressure induced by elevated runoff through rapid drainage, thereby minimizing facility saturation duration. Due to their higher peak outflow rates, they are particularly suitable for scenarios with high confluence ratios and short rainfall intervals.

3.2. Coupled Influence of Rainfall Characteristics and the Dynamics of the Groundwater Table

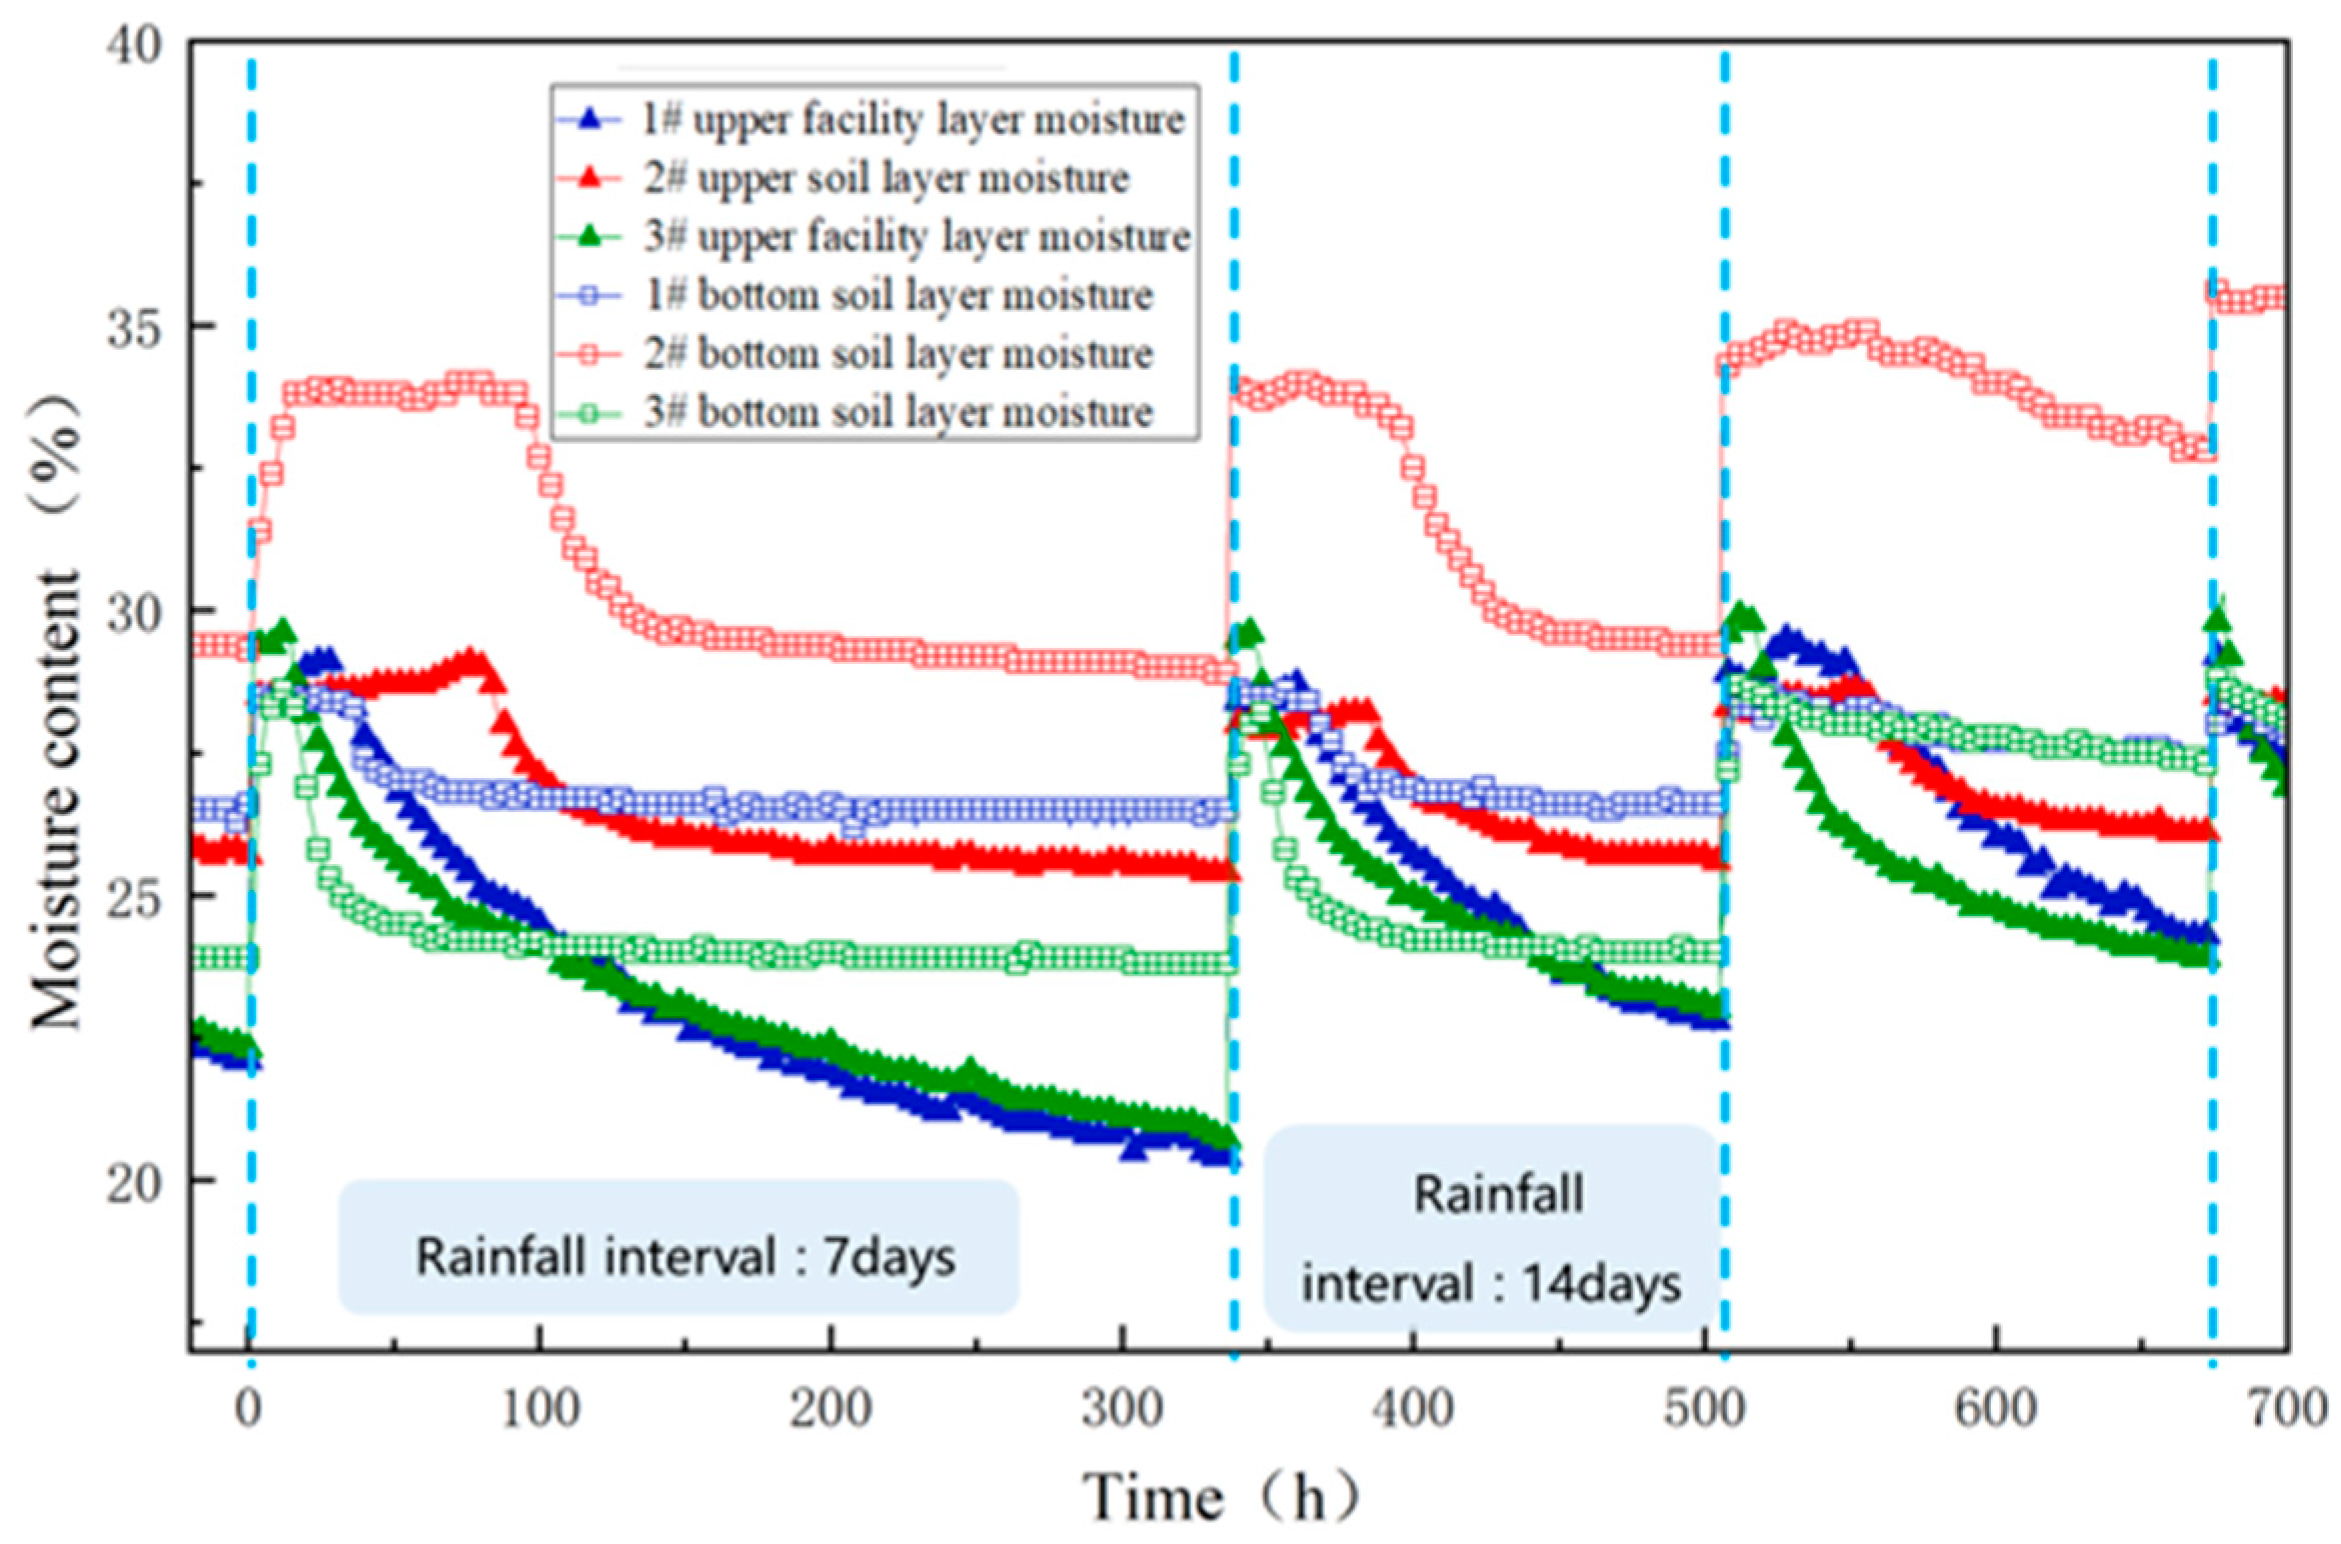
3.2.1. Response of Soil Moisture to Rainfall Interval

The impact of rainfall intervals on the hydrological performance of bioretention facilities under high groundwater table conditions is highly dependent on the substrate permeability. As shown in Figure 7 and Table 5, under moderate rainfall intensity (15.26 mm/h), the peak infiltration recharge rate of #1 (amended soil–loam combination) decreased by 14% as the rainfall interval extended from 7 to 14 days, while the recharge coefficient (α) declined from 0.84 to 0.79. This suggests that the low hydraulic conductivity of the loam layer (K = 1.86 mm/h) exacerbates the water retention effects during alternating wet–dry cycles [29]. In contrast, the peak infiltration recharge rate of #3 (amended soil–sandy loam combination) remained nearly unchanged under 7- and 14-day rainfall intervals due to the high permeability of sandy loam (K = 10.84 mm/h), while the recharge coefficient (α) remained stable (0.87→0.85).
When the rainfall interval was extended from 7 to 14 days, the initial infiltration rate in Facilities #1 and 2# increased significantly. A longer rainfall interval resulted in drier soil conditions and a higher air content within the soil pores, creating additional space for stormwater infiltration and reducing the resistance to percolation. Consequently, while the initial infiltration rate increased markedly, the total groundwater recharge decreased.
In contrast, rainfall intervals had a minimal impact on #3. Regardless of whether the interval was 7 or 14 days, its peak groundwater recharge rate, infiltration rate, and total recharge remained largely unchanged, with negligible differences in the groundwater recharge coefficient. This demonstrates the superior permeability of #3, which maintained a stable hydrological response regardless of the rainfall interval conditions.
A longer rainfall interval (7 to 14 days) increased the initial infiltration rate but reduced the peak recharge rate by 14%, leading to a decrease in the total groundwater recharge, particularly in loam-dominated systems. The amended soil–sandy loam system mitigated this effect, maintaining a stable performance across different intervals (7 and 14 days). These findings indicate that the impact of rainfall intervals on the hydrological performance of bioretention facilities under high groundwater table conditions is highly dependent on soil media permeability.
As shown in the figure, prior to rainfall initiation, the moisture content in the upper substrate layer of #1 and #3 was 20% when the rainfall interval was 14 days, approximately 2.5% lower than that observed under a 7-day interval. The soil moisture content in soil layer #2 as well as soil layers (lower layers) #1 and #3 showed no significant response to the pre-rainfall drought period. This indicates that under a groundwater table of 0.2 m (IDGW = 0.8 m), extending the rainfall interval from 7 to 14 days only affected the moisture content of the amended soil in the bioretention facility, reducing it by approximately 2.5%.
Soil moisture saturation and infiltration resistance: As shown in Figure 8, under short rainfall intervals, the moisture content in the amended soil remained high, with water occupying pore spaces and increasing resistance to stormwater infiltration. Consequently, the infiltration rate of stormwater decreased, reducing the groundwater recharge. In #3, due to its high permeability, the rainfall intervals had minimal impact, indicating that the amended soil–sandy loam system maintained a high recharge rate under both short (7-day) and long (14-day) rainfall intervals. This can be attributed to its well-developed pore structure and hydraulic conductivity, which effectively mitigate the infiltration resistance caused by soil moisture saturation.

3.2.2. Influence of Rainfall Intensity on the Hydrological Performance of the Facility and Groundwater Recharge

The rainfall intensity was set to 4.44 mm/h (light rain), 15.26 mm/h (moderate rain), and 41.37 mm/h (heavy rain).
As shown in Figure 9 and Table 5, for #1 and #2, the peak infiltration recharge rate showed no significant difference between rainfall intensities of 15.26 mm/h and 41.37 mm/h. However, under higher rainfall intensity, the duration of high recharge rates was prolonged. This is likely because the permeability of loam limited further increases in the recharge rates. However, under high-intensity rainfall, the experimental setup was able to sustain a higher recharge efficiency for an extended period. As rainfall intensity increased from 4.44 mm/h to 41.37 mm/h, the total recharge volume in #1 and #2 initially increased and then declined. Similarly, the recharge coefficient (α) exhibited an increasing-then-decreasing trend.
For #3, the peak recharge rate increased with rainfall intensity. Under heavy rainfall, the peak recharge rate was eight times that observed under light rainfall and 1.5 times that under moderate rainfall. However, the timing of the peak recharge rate remained largely unchanged. The high permeability of sandy loam enabled rapid drainage under high-intensity rainfall, preventing surface runoff accumulation and efficiently channeling rainwater into the subsurface. This mechanism maximized the advantages of high-permeability media by reducing the surface runoff and enhancing infiltration. At a rainfall intensity of 41.37 mm/h, the peak groundwater recharge rate continued to increase with the rainfall intensity. However, the recharge coefficient (α) for #3 decreased from 0.94 at 4.44 mm/h to 0.50 at 41.37 mm/h. This finding suggests that moderate rainfall intensity is favorable for groundwater recharge in bioretention facilities. In contrast, excessive rainfall intensity leads to increased surface runoff, ultimately reducing the groundwater recharge efficiency.

3.2.3. Influence of the Groundwater Table on the Hydrological Performance of the Facility and Groundwater Recharge

(1) When the facility is not equipped with a drain pipe
#1: The upper layer consisted of a bioretention facility with relatively high permeability, while the lower layer comprised loam with lower hydraulic conductivity.
As shown in Figure 10, at groundwater depths of 0.3 m and 0.5 m (corresponding to IDGW levels of 0.7 m and 0.5 m), the infiltration of stormwater through the bioretention facility to the groundwater occurred almost simultaneously. However, at 0.5 m, the short-term recharge rate was slightly higher. When the groundwater table was at 0.2 m, the recharge rate exhibited a higher peak, likely due to the capillary barrier effect imposed by the underlying loam, which restricted further percolation.
#2: The homogeneous loam exhibited a uniformly low hydraulic conductivity. As the groundwater table rose, the distance between the groundwater table and the facility bottom decreased, leading to a shorter travel time for stormwater to reach the saturated zone. Consequently, the peak recharge rate increased but was sustained for a shorter duration. When the groundwater table was lower, the peak recharge rate was not as high, however, the peak duration was prolonged.
#3: The substrate layer consisted of amended soil, while the soil layer was composed of sandy loam, both of which exhibited high permeability. At groundwater depths of 0.2, 0.3, and 0.5 m (corresponding to IDGW levels of 0.8, 0.7, and 0.5 m), stormwater infiltration through the bioretention facility exhibited nearly synchronous variations in the recharge rates, except for minor differences in peak values.
As the groundwater table rose from 0.2 m to 0.5 m, the recharge volume of #1, #2, and #3 increased, accompanied by a corresponding rise in the recharge coefficient (α). The recharge volume of #1 increased by approximately 5% (from 28.72 L to 30.33 L), while the recharge coefficient (α) rose from 0.84 to 0.88. Similarly, #2 exhibited a 5% increase in recharge volume (from 28.13 L to 29.55 L), with α rising from 0.82 to 0.86. #3 showed a slightly greater increase of 6% (from 29.95 L to 31.87 L), with α rising from 0.87 to 0.93. These findings are consistent with the conclusions of D’Aniello et al., who demonstrated that increasing the initial depth of the groundwater table relative to the facility bottom (IDGW) significantly enhanced the infiltration at the facility base [19]. In this study, the simulated stormwater inflow to the devices remained constant. As the IDGW increased, a portion of the infiltrated water was retained in the unsaturated zone, resulting in a slight reduction in recharge volume.
In #1, the upper layer of amended soil exhibited high permeability, whereas the lower loam layer had lower permeability, resulting in a pronounced capillary barrier effect. As the groundwater table rose, soil saturation became more evident, further intensifying the barrier effect. #2 consisted of homogeneous loam with an overall low infiltration rate. As the groundwater table rose, the soil saturation increased, leading to a reduction in pore storage capacity and a decline in stormwater percolation rates. Consequently, the buoyancy effect of groundwater became more pronounced. In #3 (amended soil + sandy loam), the infiltration rate remained relatively uniform, and variations in the groundwater table had minimal impact. The buoyancy effect refers to the upward movement of water in the soil pores, driven by reduced hydraulic gradients as the groundwater rises. High-permeability media partially offset the buoyancy through rapid vertical infiltration, whereas low-permeability loam experienced more severe buoyancy impacts. In systems without drainage pipes, buoyancy can contribute to prolonged saturation in the lower soil layers, reducing the infiltration efficiency. In systems with drainage pipes, buoyancy effects are mitigated by enhanced water removal, reducing prolonged saturation and improving system drainage.
(2) When the facility is equipped with a drain pipe
Under drainage pipe conditions, at a rainfall intensity of 15.26 mm/h and a groundwater table depth of 0.5 m (IDGW = 0.5 m). As shown in Figure 11 and Table 6, the drainage layer in Facility #1 emptied within 350 min. The drainage pipe discharged 26 L, while groundwater recharge accounted for 5.84 L. Of the stormwater entering the facility, 76% was expelled through the drainage pipe, whereas 17% infiltrated to recharge the groundwater. In Facility #3, the drainage layer emptied within 200 min. The drainage pipe discharged 19.9 L, while the groundwater recharge totaled 13.29 L. Of the stormwater entering the facility, 58% was discharged through the drainage pipe, whereas 39% infiltrated to recharge the groundwater.
Compared with conditions at a groundwater table of 0.2 m (IDGW = 0.8 m), 52% of the stormwater entering #1 was discharged through the drainage pipe, while 44% infiltrated to recharge the groundwater. In #3, 31% of the inflow was expelled through the drainage pipe, whereas 63% percolated into the subsurface. These results indicate that when a drainage pipe is installed, a shallower groundwater table—meaning a reduced distance between the facility bottom and the groundwater table—leads to a higher proportion of stormwater being discharged through the drainage pipe and a lower proportion infiltrating to recharge the groundwater. As the groundwater table rose from 0.2 m to 0.5 m (corresponding to a decrease in the IDGW from 0.8 m to 0.5 m), the proportion of stormwater discharged through the drainage pipe in #1 increased from 52% to 76%, while the proportion infiltrating to recharge the groundwater decreased from 44% to 17%. Similarly, in #3, the drainage discharge ratio rose from 31% to 58%, whereas the groundwater recharge decreased from 63% to 39%. These findings suggest that the rise in groundwater table had a more pronounced impact on drainage pipe discharge in #3, whereas it primarily influenced the infiltration-based groundwater recharge in #1. This phenomenon occurs because a shallower groundwater table results in higher soil moisture content, which suppresses the infiltration capacity of the bioretention facility. Consequently, a larger portion of stormwater is unable to percolate into the subsurface, instead contributing to drainage pipe discharge. This finding is consistent with previous studies. Zhang et al. demonstrated that a shallower groundwater table resulted in a higher proportion of surface runoff and drainage pipe discharge in the hydrological balance of permeable pavements. Their study showed that as the groundwater depth decreased from 2.0 m to 0.25 m, the proportion of drainage pipe discharge increased from 29.8% to 42.3% [28]. Furthermore, this finding aligned with the “groundwater interference effect on infiltration facilities” theory proposed by Locatelli et al. [26]. However, our study further revealed the moderating role of soil media, with sandy loam’s permeability alleviating the drainage pressure.
Table 5. The recharge coefficients of #1, #2, and #3 under different experimental conditions.
Experimental ConditionsInflow Volume/L#1 Recharge Volume/L#2 Recharge Volume/L#3 Recharge Volume/L#1 Recharge Coefficient α#2 Recharge Coefficient α#3 Recharge Coefficient α
Groundwater table/m0.234.3428.7228.1329.950.84 0.820.87
0.334.3429.4428.6830.530.86 0.840.89
0.534.3430.3329.5531.870.88 0.860.93
Drainage pipeSet up34.3415.1/21.70.44 /0.63
No34.3428.7228.1329.950.84 0.820.87
Confluence ratio1034.3428.7228.1329.950.84 0.820.87
2068.6840.139.0646.380.58 0.570.68
Rainfall interval/day734.3428.7228.1329.950.84 0.820.87
1434.3427.227.0429.40.79 0.790.86
Rainfall intensity/mm4.44108.98.679.410.89 0.870.94
15.2634.3428.7228.1329.950.84 0.820.87
41.3792.4845.6338.8646.30.49 0.420.50
Table 6. Information on the discharge of the drain pipe and groundwater recharge of #1 and #3 when there is a drain pipe installed and the groundwater table is at 0.5 m.
Groundwater Table
(m)
Device NumberRainfall Intensity (mm)Rainwater Volume Entering the Device (L)Drainage Volume of the Drain Pipe
(L)
Groundwater Recharge Volume (L)Ratio of the Drainage Volume to the Inflow (%)Ratio of the Recharge Volume to the Inflow (%)
0.5#115.2634.3265.8476%17%
#315.2634.319.913.2958%39%
0.2#115.2634.317.715.152%44%
#315.2634.310.521.731%63%

3.3. Influence of the Matrix and Soil Types on the Hydrological Performance of the Facility and Groundwater Recharge

At a groundwater table of 0.2 m, as shown in Figure 12, the recharge rate in #1 reached a local peak of 0.95 L/h at the 5th hour, with the peak duration lasting approximately 15 h, which was longer than that observed in #3. The total outflow was 28.72 L, second only to that of #3. The relatively high permeability resistance of the loam layer resulted in a more stable recharge rate and prolonged the residence time of stormwater within the soil.
#2 exhibited the lowest groundwater recharge efficiency. Under identical conditions, its outflow rate increased at the slowest pace, reaching the lowest peak value of 0.44 L/h among the three, with the longest peak duration. The total outflow was 28.13 L, the lowest among the three. This finding indicates that the homogeneous loam had a lower groundwater recharge rate and reduced the overall outflow.
#3 exhibited the highest groundwater recharge efficiency. At a groundwater table of 0.2 m, its groundwater recharge rate increased rapidly after the experiment commenced, peaking at 2.044 L/h at the 5th hour, followed by a sharp decline after approximately 3 h. Throughout the experiment, its total recharge volume reached 29.95 L, the highest among the three. This result suggests that sandy loam facilitates rapid stormwater infiltration, leading to the highest groundwater recharge volume and promoting the efficient concentration and infiltration of stormwater runoff.
The lower layers of both #1 and #2 consisted of in situ loam, while the upper layer of #1 contained a bioretention facility, whereas #2 had only loam. These results indicate that when the lower layer consists of loam, incorporating a bioretention facility in the upper layer enhances stormwater infiltration compared with maintaining in situ loam. This configuration leads to a higher groundwater recharge rate. The peak recharge rate in #1 was 116% higher than that in #2.
The upper layers of both #1 and #3 consisted of bioretention facilities, while the lower layer of #1 was composed of loam, and that of #3 consisted of sandy loam. These results indicate that when sandy loam, which has a higher permeability, is used as the underlying layer of a bioretention facility, it facilitates more rapid stormwater infiltration and groundwater recharge compared with loam. The peak recharge rate in #3 was 115% higher than that in #1.
Due to its high permeability, sandy loam enables the rapid percolation of stormwater through the soil layer, reducing residence time within the facility. This characteristic allows for a greater portion of stormwater to infiltrate directly into the subsurface, enhancing the groundwater recharge efficiency. As a result, sandy loam is well-suited for applications requiring rapid infiltration and high groundwater recharge efficiency.
The lower permeability of loam prolongs stormwater retention within the soil. This characteristic makes loam-based systems more suitable for applications requiring extended water retention such as reducing the surface runoff or sustaining vegetation within bioretention facilities.
Although this study did not explicitly simulate the long-term effects of colmatation, field studies suggest that the deposition of suspended solids and organic matter can lead to surface clogging, thereby reducing the permeability over time [32,33]. The implementation of sediment pretreatment measures and regular maintenance is essential for maintaining the hydrological efficiency of bioretention facilities in practical applications.

4. Conclusions

This study experimentally evaluated the hydrological performance of bioretention facilities in high-groundwater environments and their impact on groundwater recharge. The key findings are as follows:
(1) Bioretention facilities with sandy loam at the bottom exhibited superior infiltration, reducing the drainage duration by 41–43% and enhancing the groundwater recharge by up to 80% compared with loam-based bioretention facilities. The high permeability of sandy loam (K = 10.84 mm/h) mitigated the diversion effect of drainage pipes, enhancing the groundwater recharge efficiency.
(2) Prolonged rainfall intervals (14 days) intensified the wetting–drying cycles in loam, increasing the initial infiltration rates while reducing the total recharge. In contrast, sandy loam-based facilities exhibited a stable recharge performance across varying intervals. Moderate rainfall intensity (15.26 mm/h) optimized groundwater recharge efficiency, whereas excessive intensity (41.37 mm/h) led to increased surface runoff and reduced infiltration. Rising groundwater tables (0.2 m→0.5 m) intensified the drainage pipe discharge (52%→76% in loam, 31%→58% in sandy loam) while reducing the groundwater recharge, highlighting the necessity for adaptive drainage designs.
(3) The interaction between soil permeability and groundwater depth is critical for optimizing facility performance. Sandy loam-based systems exhibited a greater adaptability to fluctuating groundwater conditions, ensuring higher infiltration rates. Drainage pipe design should be carefully considered in high-groundwater environments, as shallower groundwater tables reduce the infiltration efficiency and promote excessive stormwater discharge.
This study investigated the hydrological characteristics of bioretention facilities in environments with high groundwater levels. The findings can be applied to regions with relatively high groundwater levels such as coastal cities as well as areas with significant groundwater fluctuations.
While this study examined the hydrological characteristics of bioretention facilities under controlled experimental conditions, it had certain limitations. The laboratory simulations did not account for long-term sediment accumulation, vegetation growth, or soil changes, lacked field validation, and did not consider cold climate factors. Future research should focus on long-term field monitoring, evaluating seasonal variations, and optimizing system designs for various climate conditions, ultimately contributing to improved urban stormwater management and groundwater sustainability.

Author Contributions

All authors contributed to the conceptualization and design of the study as well as the experiments. Formal analysis and writing—original draft: Y.W.; Validation: Y.Y. and H.L.; Visualization: Z.Q. and S.T.; Data curation: X.M. and H.C.; Conceptualization: Y.G. All authors have read and agreed to the published version of the manuscript.

Funding

This research was funded by the National Natural Science Foundation of China (No. 52270085), and the Project of Construction and Support for High-Level Innovative Teams of Beijing Municipal Institutions (BPHR20220108).

Data Availability Statement

The data presented in this study are available on request from the corresponding author.

Conflicts of Interest

The authors declare no conflicts of interest.

References

  1. Yang, D.; Yang, Y.; Xia, J. Hydrological cycle and water resources in a changing world: A review. Geogr. Sustain. 2021, 2, 115–122. [Google Scholar]
  2. Gleeson, T.; Befus, K.M.; Jasechko, S.; Luijendijk, E.; Cardenas, M.B. The global volume and distribution of modern groundwater. Nat. Geosci. 2016, 9, 161–167. [Google Scholar] [CrossRef]
  3. Jasechko, S.; Seybold, H.; Perrone, D.; Fan, Y.; Shamsudduha, M.; Taylor, R.G.; Fallatah, O.; Kirchner, J.W. Rapid groundwater decline and some cases of recovery in aquifers globally. Nature 2024, 625, 715–721. [Google Scholar] [PubMed]
  4. Gorelick, S.M.; Zheng, C. Global change and the groundwater management challenge. Water Resour. Res. 2015, 51, 3031–3051. [Google Scholar] [CrossRef]
  5. He, C.; Liu, Z.; Wu, J.; Pan, X.; Fang, Z.; Li, J.; Bryan, B.A. Future global urban water scarcity and potential solutions. Nat. Commun. 2021, 12, 4667. [Google Scholar] [CrossRef]
  6. Raimondi, A.; Quinn, R.; Abhijith, G.R.; Becciu, G.; Ostfeld, A. Rainwater harvesting and treatment: State of the art and perspectives. Water 2023, 15, 1518. [Google Scholar] [CrossRef]
  7. Shi, C.; Li, Y.; Li, H.; Qiu, H.; Xu, T. Towards sustainable urban water management: An ecological compensation framework for sponge cities. Environ. Res. Lett. 2024, 19, 123002. [Google Scholar]
  8. Wang, M.; Zhang, D.Q.; Su, J.; Dong, J.W.; Tan, S.K. Assessing hydrological effects and performance of low impact development practices based on future scenarios modeling. J. Clean. Prod. 2018, 179, 12–23. [Google Scholar] [CrossRef]
  9. Chui, T.F.M.; Liu, X.; Zhan, W. Assessing cost-effectiveness of specific LID practice designs in response to large storm events. J. Hydrol. 2016, 533, 353–364. [Google Scholar] [CrossRef]
  10. Xia, J.; Zhang, Y.; Xiong, L.; He, S.; Wang, L.; Yu, Z. Opportunities and challenges of the Sponge City construction related to urban water issues in China. Sci. China Earth Sci. 2017, 60, 652–658. [Google Scholar] [CrossRef]
  11. Qiao, X.-J.; Liao, K.-H.; Randrup, T.B. Sustainable stormwater management: A qualitative case study of the Sponge Cities initiative in China. Sustain. Cities Soc. 2020, 53, 101963. [Google Scholar]
  12. Li, J.; Zhao, R.; Li, Y.; Li, H. Simulation and optimization of layered bioretention facilities by HYDRUS-1D model and response surface methodology. J. Hydrol. 2020, 586, 124813. [Google Scholar]
  13. Vijayaraghavan, K.; Biswal, B.K.; Adam, M.G.; Soh, S.H.; Tsen-Tieng, D.L.; Davis, A.P.; Chew, S.H.; Tan, P.Y.; Babovic, V.; Balasubramanian, R. Bioretention systems for stormwater management: Recent advances and future prospects. J. Environ. Manag. 2021, 292, 112766. [Google Scholar]
  14. Shrestha, P.; Hurley, S.E.; Wemple, B.C. Effects of different soil media, vegetation, and hydrologic treatments on nutrient and sediment removal in roadside bioretention systems. Ecol. Eng. 2018, 112, 116–131. [Google Scholar]
  15. Su, J.; Wang, M.; Zhang, D.; Sun, C.; Zhao, X.; Razi, M.A.B.M. A systematic and bibliometric review of bioretention system (BRS) for urban ecosystem regulation services. Urban Clim. 2024, 55, 101923. [Google Scholar] [CrossRef]
  16. Søberg, L.C.; Winston, R.; Viklander, M.; Blecken, G.-T. Dissolved metal adsorption capacities and fractionation in filter materials for use in stormwater bioretention facilities. Water Res. X 2019, 4, 100032. [Google Scholar] [PubMed]
  17. Palanisamy, B.; Borkar, R.; Sangeetha, K.; Narasimhan, B. Evaluation of augmented infiltration based LIDs for low lying urbanizing coastal catchments: A case study of Chennai city, India. Urban Water J. 2024, 21, 638–655. [Google Scholar] [CrossRef]
  18. Zhang, K.; Chui, T.F.M.; Yang, Y. Simulating the hydrological performance of low impact development in shallow groundwater via a modified SWMM. J. Hydrol. 2018, 566, 313–331. [Google Scholar]
  19. D’Aniello, A.; Cimorelli, L.; Cozzolino, L.; Pianese, D. The effect of geological heterogeneity and groundwater table depth on the hydraulic performance of stormwater infiltration facilities. Water Resour. Manag. 2019, 33, 1147–1166. [Google Scholar]
  20. Zheng, Y.; Chen, S.; Qin, H.; Jiao, J.J. Modeling the spatial and seasonal variations of groundwater head in an urbanized area under low impact development. Water 2018, 10, 803. [Google Scholar] [CrossRef]
  21. Kim, H.; Mallari, K.J.B.; Baek, J.; Pak, G.; Choi, H.I.; Yoon, J. Considering the effect of groundwater on bioretention using the Storm Water Management Model. J. Environ. Manag. 2019, 231, 1270–1276. [Google Scholar] [CrossRef] [PubMed]
  22. Chui, T.F.M.; Trinh, D.H. Modelling infiltration enhancement in a tropical urban catchment for improved stormwater management. Hydrol. Process. 2016, 30, 4405–4419. [Google Scholar] [CrossRef]
  23. Jiang, Y.; Li, J.; Gao, J.; Xia, J. A multi-objective optimization and evaluation framework for LID facilities considering urban surface runoff and shallow groundwater regulation. J. Clean. Prod. 2024, 478, 143921. [Google Scholar]
  24. Zhang, K.; Chui, T.F.M. Interactions between shallow groundwater and low-impact development underdrain flow at different temporal scales. Hydrol. Process. 2018, 32, 3495–3512. [Google Scholar]
  25. Zhang, K.; Chui, T.F.M. Evaluating hydrologic performance of bioretention cells in shallow groundwater. Hydrol. Process. 2017, 31, 4122–4135. [Google Scholar]
  26. Locatelli, L.; Mark, O.; Mikkelsen, P.S.; Arnbjerg-Nielsen, K.; Wong, T.; Binning, P.J. Determining the extent of groundwater interference on the performance of infiltration trenches. J. Hydrol. 2015, 529, 1360–1372. [Google Scholar]
  27. Jackisch, N.; Weiler, M. The hydrologic outcome of a Low Impact Development (LID) site including superposition with streamflow peaks. Urban Water J. 2017, 14, 143–159. [Google Scholar] [CrossRef]
  28. Zhang, K.; Chui, T.F.M. Design measures to mitigate the impact of shallow groundwater on hydrologic performance of permeable pavements. Hydrol. Process. 2020, 34, 5146–5166. [Google Scholar] [CrossRef]
  29. Hillel, D. Environmental Soil Physics: Fundamentals, Applications, and Environmental Considerations; Elsevier Science: Amsterdam, The Netherlands, 2014. [Google Scholar]
  30. Bear, J. Dynamics of Fluids in Porous Media; Courier Corporation: New York, NY, USA, 2013. [Google Scholar]
  31. Locatelli, L.; Mark, O.; Mikkelsen, P.S.; Arnbjerg-Nielsen, K.; Jensen, M.B.; Binning, P.J. Modelling of green roof hydrological performance for urban drainage applications. J. Hydrol. 2014, 519, 3237–3248. [Google Scholar] [CrossRef]
  32. Le Coustumer, S.; Fletcher, T.D.; Deletic, A.; Barraud, S.; Poelsma, P. The influence of design parameters on clogging of stormwater biofilters: A large-scale column study. Water Res. 2012, 46, 6743–6752. [Google Scholar] [CrossRef]
  33. Kandra, H.; McCarthy, D.; Deletic, A. Assessment of the impact of stormwater characteristics on clogging in stormwater filters. Water Resour. Manag. 2015, 29, 1031–1048. [Google Scholar] [CrossRef]
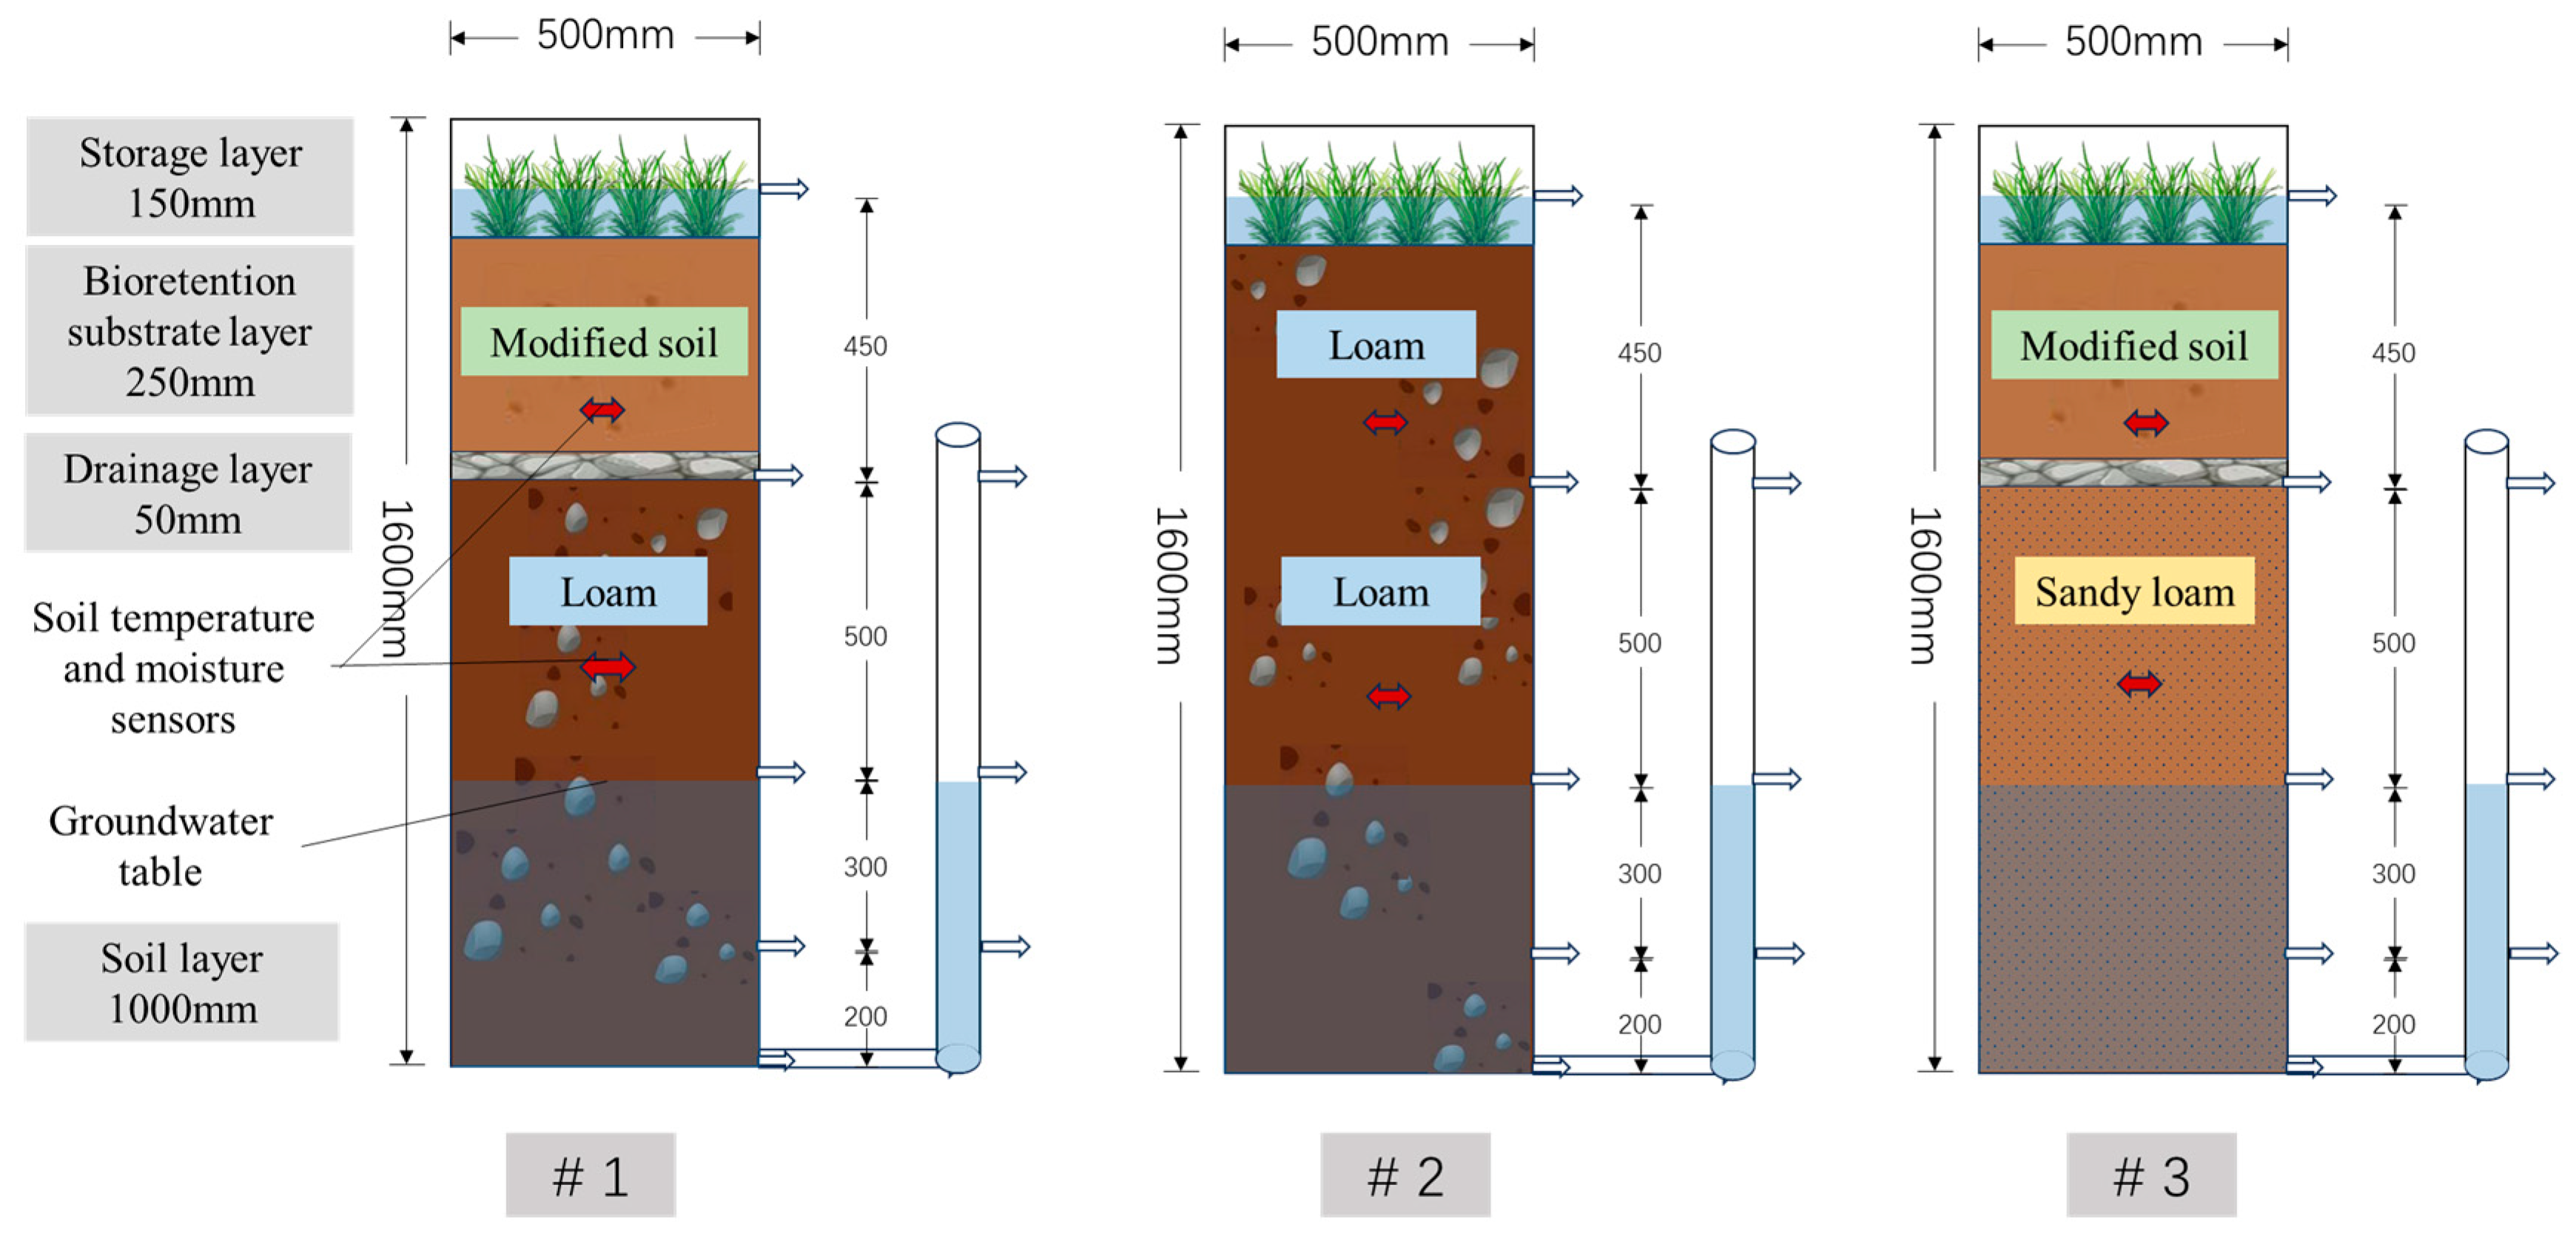
Figure 1. Real-scene pictures of the devices Main column (500 mm × 500 mm × 1600 mm): Stratified into functional layers—bioretention layer (1000–1300 mm), drainage layer (1000–1050 mm, gravel-embedded cross-arranged drainpipes), and soil layer (0–1000 mm). Auxiliary column: Hydraulically connected to the main column base to simulate constant groundwater tables (0.2 m, 0.3 m, 0.5 m).
Water 17 01096 g001
Figure 2. Device parameters. #1 soil column: 0–1000 mm consists of loam, with a bioretention facility installed at 1000–1300 mm. #2 soil column: uniformly filled with loam (0–1300 mm). #3 soil column: 0–1000 mm consists of sandy loam, with a bioretention facility installed at 1000–1300 mm.
Water 17 01096 g002
Figure 3. Schematic diagram of the simulation rainfall experiment process.
Water 17 01096 g003
Figure 4. The discharge rate and volume of the drain pipe of Facility #3 under heavy rainfall conditions with a drain pipe installed.
Water 17 01096 g004
Figure 5. The discharge rate and volume of the drain pipe of Facility #3 under moderate rainfall conditions with a drain pipe installed.
Water 17 01096 g005
Figure 6. The groundwater recharge rate and volume of #1, #2, and #3 under the confluence ratios of 10:1 and 20:1.
Water 17 01096 g006
Figure 7. The groundwater recharge rates and volumes of #1, #2, and #3 under different rainfall intervals.
Water 17 01096 g007
Figure 8. The moisture content of the upper facility layer and the bottom soil layer of #1, #2, and #3 under different experimental conditions.
Water 17 01096 g008
Figure 9. The groundwater recharge rate and volume of #1, #2, and #3 under different rainfall intensities.
Water 17 01096 g009
Figure 10. The groundwater recharge rate and volume of #1, #2, and #3 under groundwater tables of 0.2 m, 0.3 m and 0.5 m (GW02 stands for a groundwater table of 0.2 m).
Water 17 01096 g010
Figure 11. The discharge rate and volume of the drain pipe of #1 and #3 when there is a drain pipe installed and the groundwater table is at 0.5 m.
Water 17 01096 g011
Figure 12. The hydrological conditions of #1, #2, and #3 under different facility matrices and in situ soil types.
Water 17 01096 g012
Table 1. Physical parameters of the soil used in the experiment.
Medium TypeBulk Density (g/cm3)Saturated Volumetric Water Content (cm3·cm⁻3)Saturated Hydraulic Conductivity (mm·h⁻1)
Sandy loam1.780.3010.84
Loam1.590.371.86
Modified soil0.820.2954
Table 2. Experimental conditions.
Experiment NumberGroundwater Table (m)IDGW
(m)
Drainage PipeConfluence RATIORainfall Interval (day)Rainfall Intensity (mm)
10.20.8Without10: 1741.37
20.20.8Set up10: 1741.37
30.20.8Without10: 1715.26
40.20.8Without20: 1715.26
50.20.8Without10: 11415.26
60.50.5Without10: 1715.26
70.50.5Set up10: 1715.26
80.30.7Without10: 1715.26
90.30.7Without10: 1732.90
100.30.7Without10: 174.44
110.20.8Without10: 1144.44
120.20.8Set up10: 1715.26
Note: IDGW—Initial depth of the groundwater table from the bottom of the facility.
Table 3. Hydrological information of #1 and #3 with and without the installation of drain pipes under different rainfall conditions.
Drainage PipeRainfall Intensity (mm)Device NumberInflow Volume (L)Overflow Volume (L)Groundwater Recharge Volume (L)Drainage Volume of the Drain Pipe (L)Recharge Coefficient α
Without41.37#192.4846.645.63/0.49
41.37#392.484346.29/0.50
Set up41.37#192.4846.520.9823.130.23
41.37#392.483837.8114.320.41
Without15.26#134.3028.72/0.84
15.26#334.3029.95/0.87
Set up15.26#134.3015.117.70.44
15.26#334.3021.710.50.63
Table 4. Hydrological information of #1, #2, and #3 under the confluence ratios of 10:1 and 20:1.
Confluence RatioDevice NumberPeak Value of Recharge Rate (L/h)Peak Time (h)Groundwater Recharge Volume (L)Recharge Coefficient α
20:1#10.86440.10.58
#20.442539.060.57
#32.91246.380.68
10:1#10.91528.720.84
#20.442428.130.82
#32529.950.87
Disclaimer/Publisher’s Note: The statements, opinions and data contained in all publications are solely those of the individual author(s) and contributor(s) and not of MDPI and/or the editor(s). MDPI and/or the editor(s) disclaim responsibility for any injury to people or property resulting from any ideas, methods, instructions or products referred to in the content.

