
Flood Susceptibility Analysis with Integrated Geographic Information System and Analytical Hierarchy Process: A Multi-Criteria Framework for Risk Assessment and Mitigation


Abstract
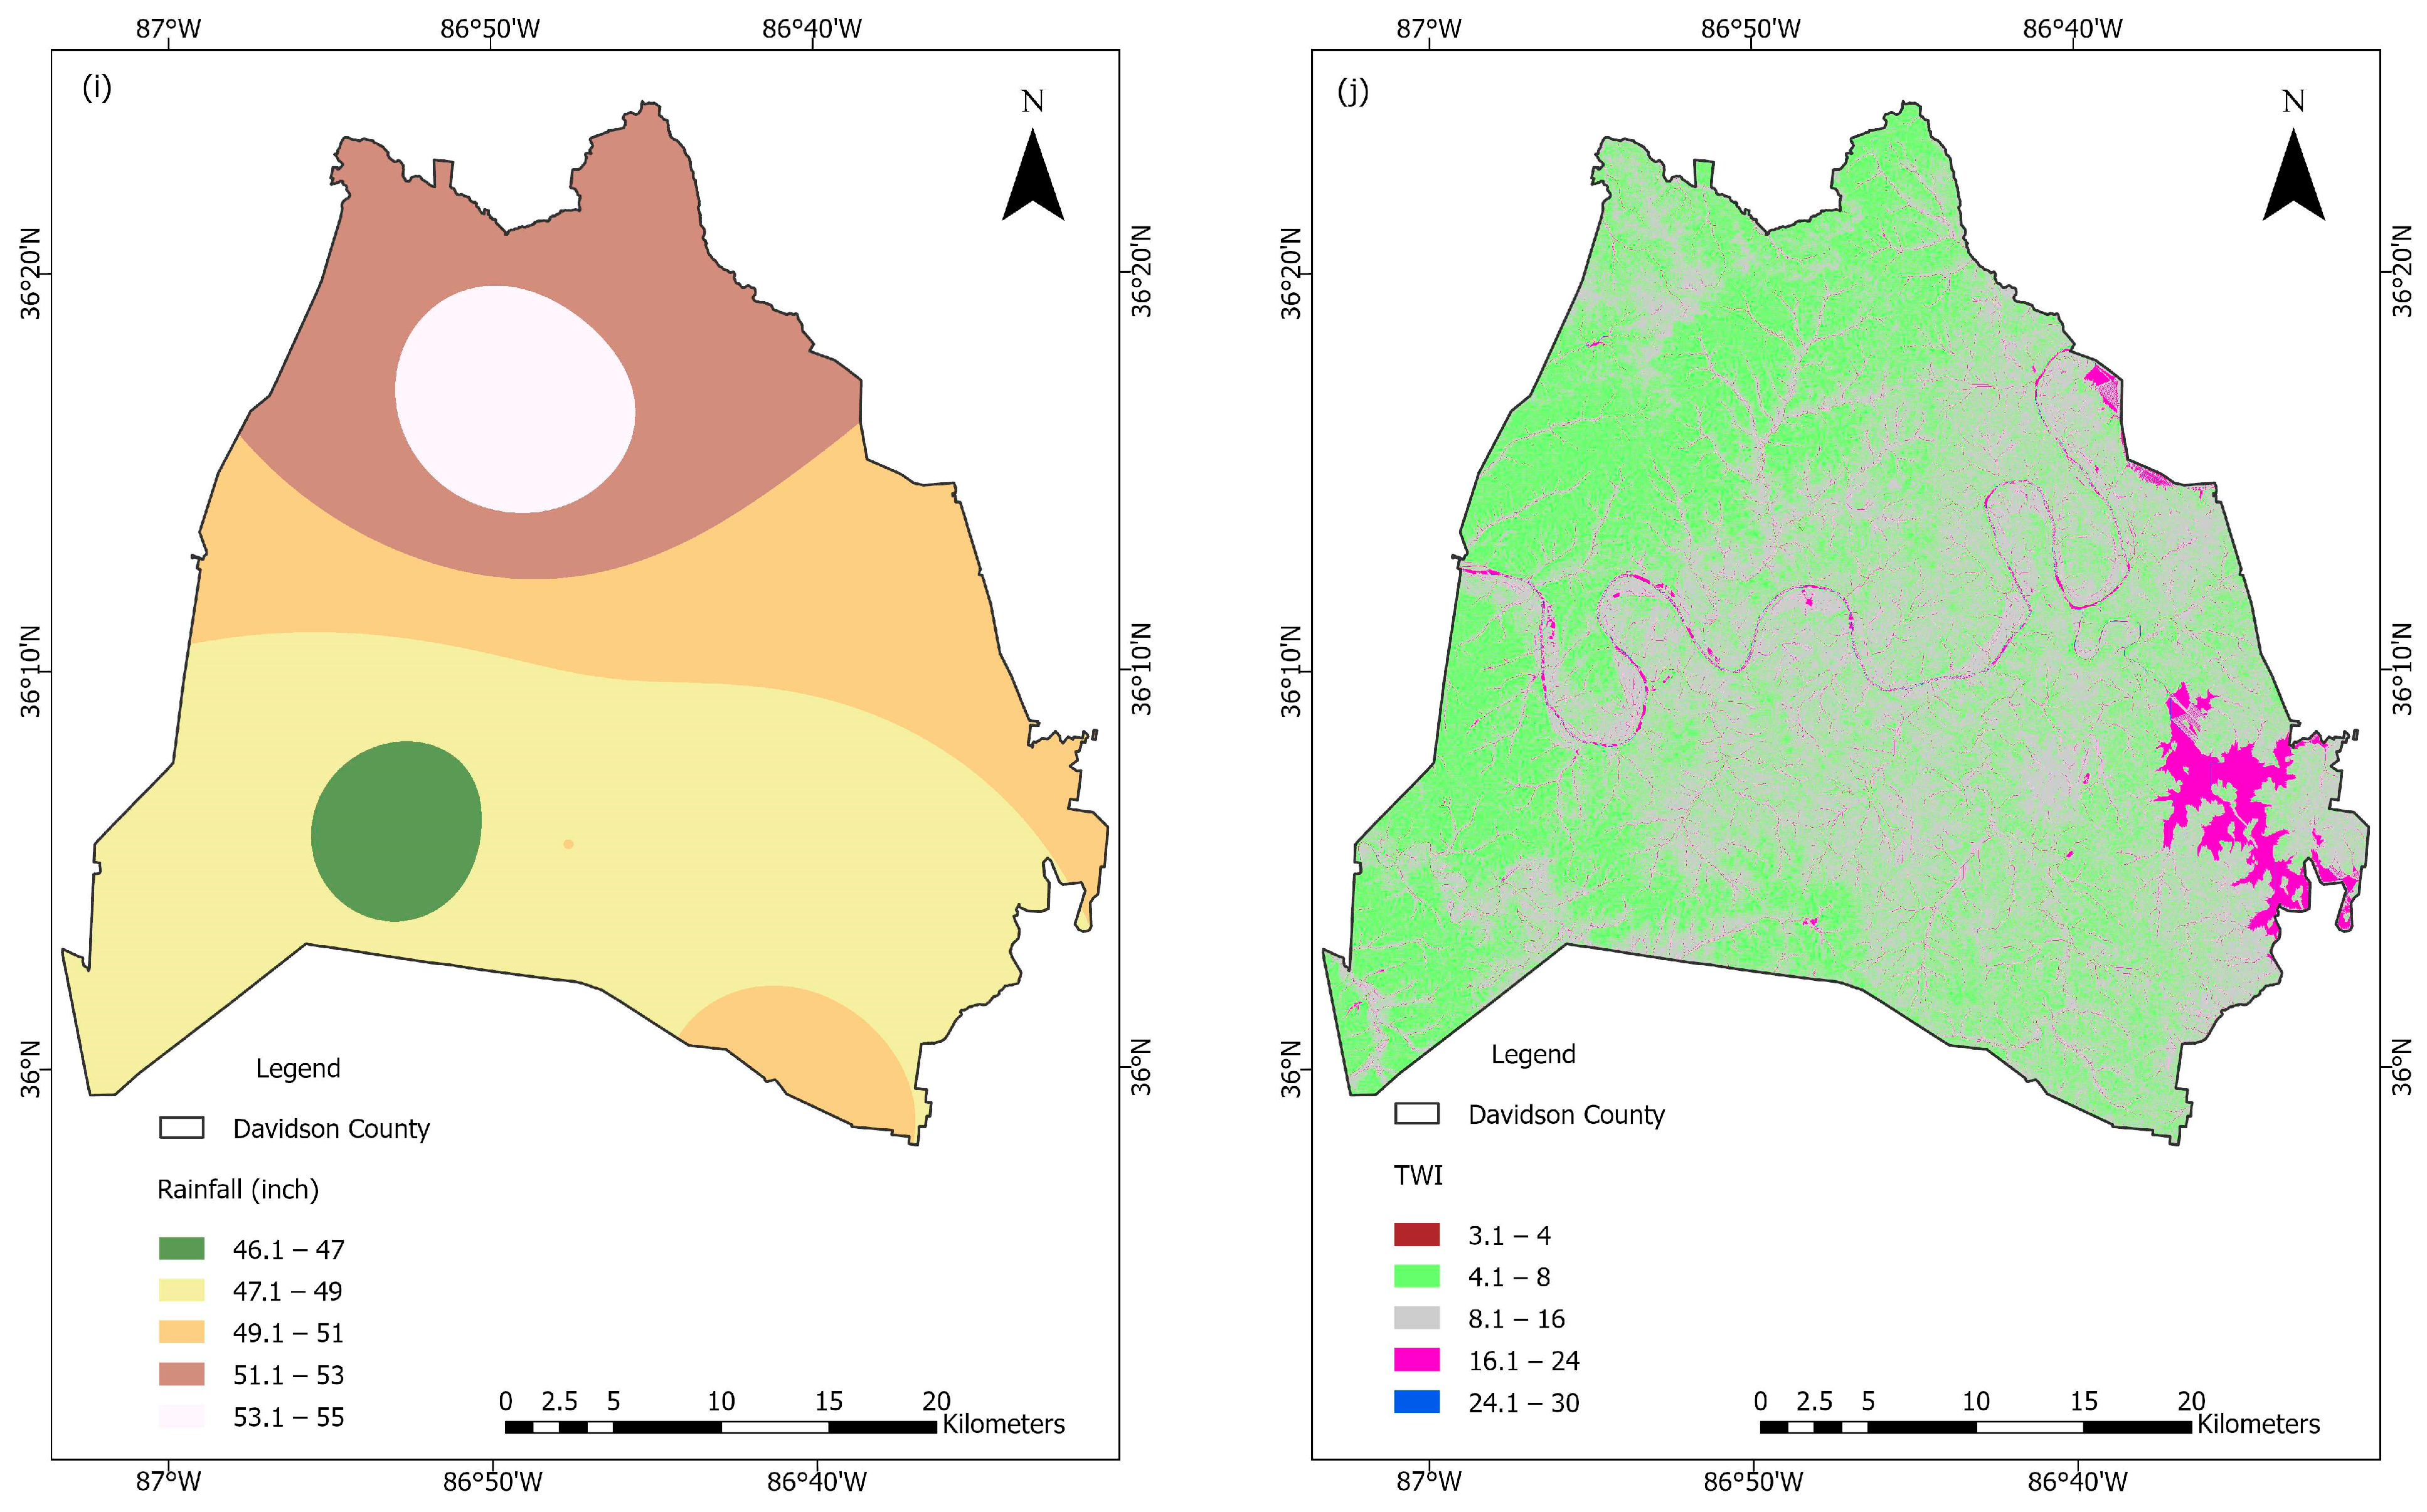
1. Introduction
- Provide a detailed flood susceptibility map at the county level, addressing the limited application of GIS-AHP methodology at this scale within the United States.
- Leverage FEMA maps to overcome the challenge of limited historical flood data availability while providing a practical and accessible validation method.
- Establish a baseline for future studies to compare and evaluate advanced techniques like Fuzzy AHP or machine learning approaches in similar contexts.
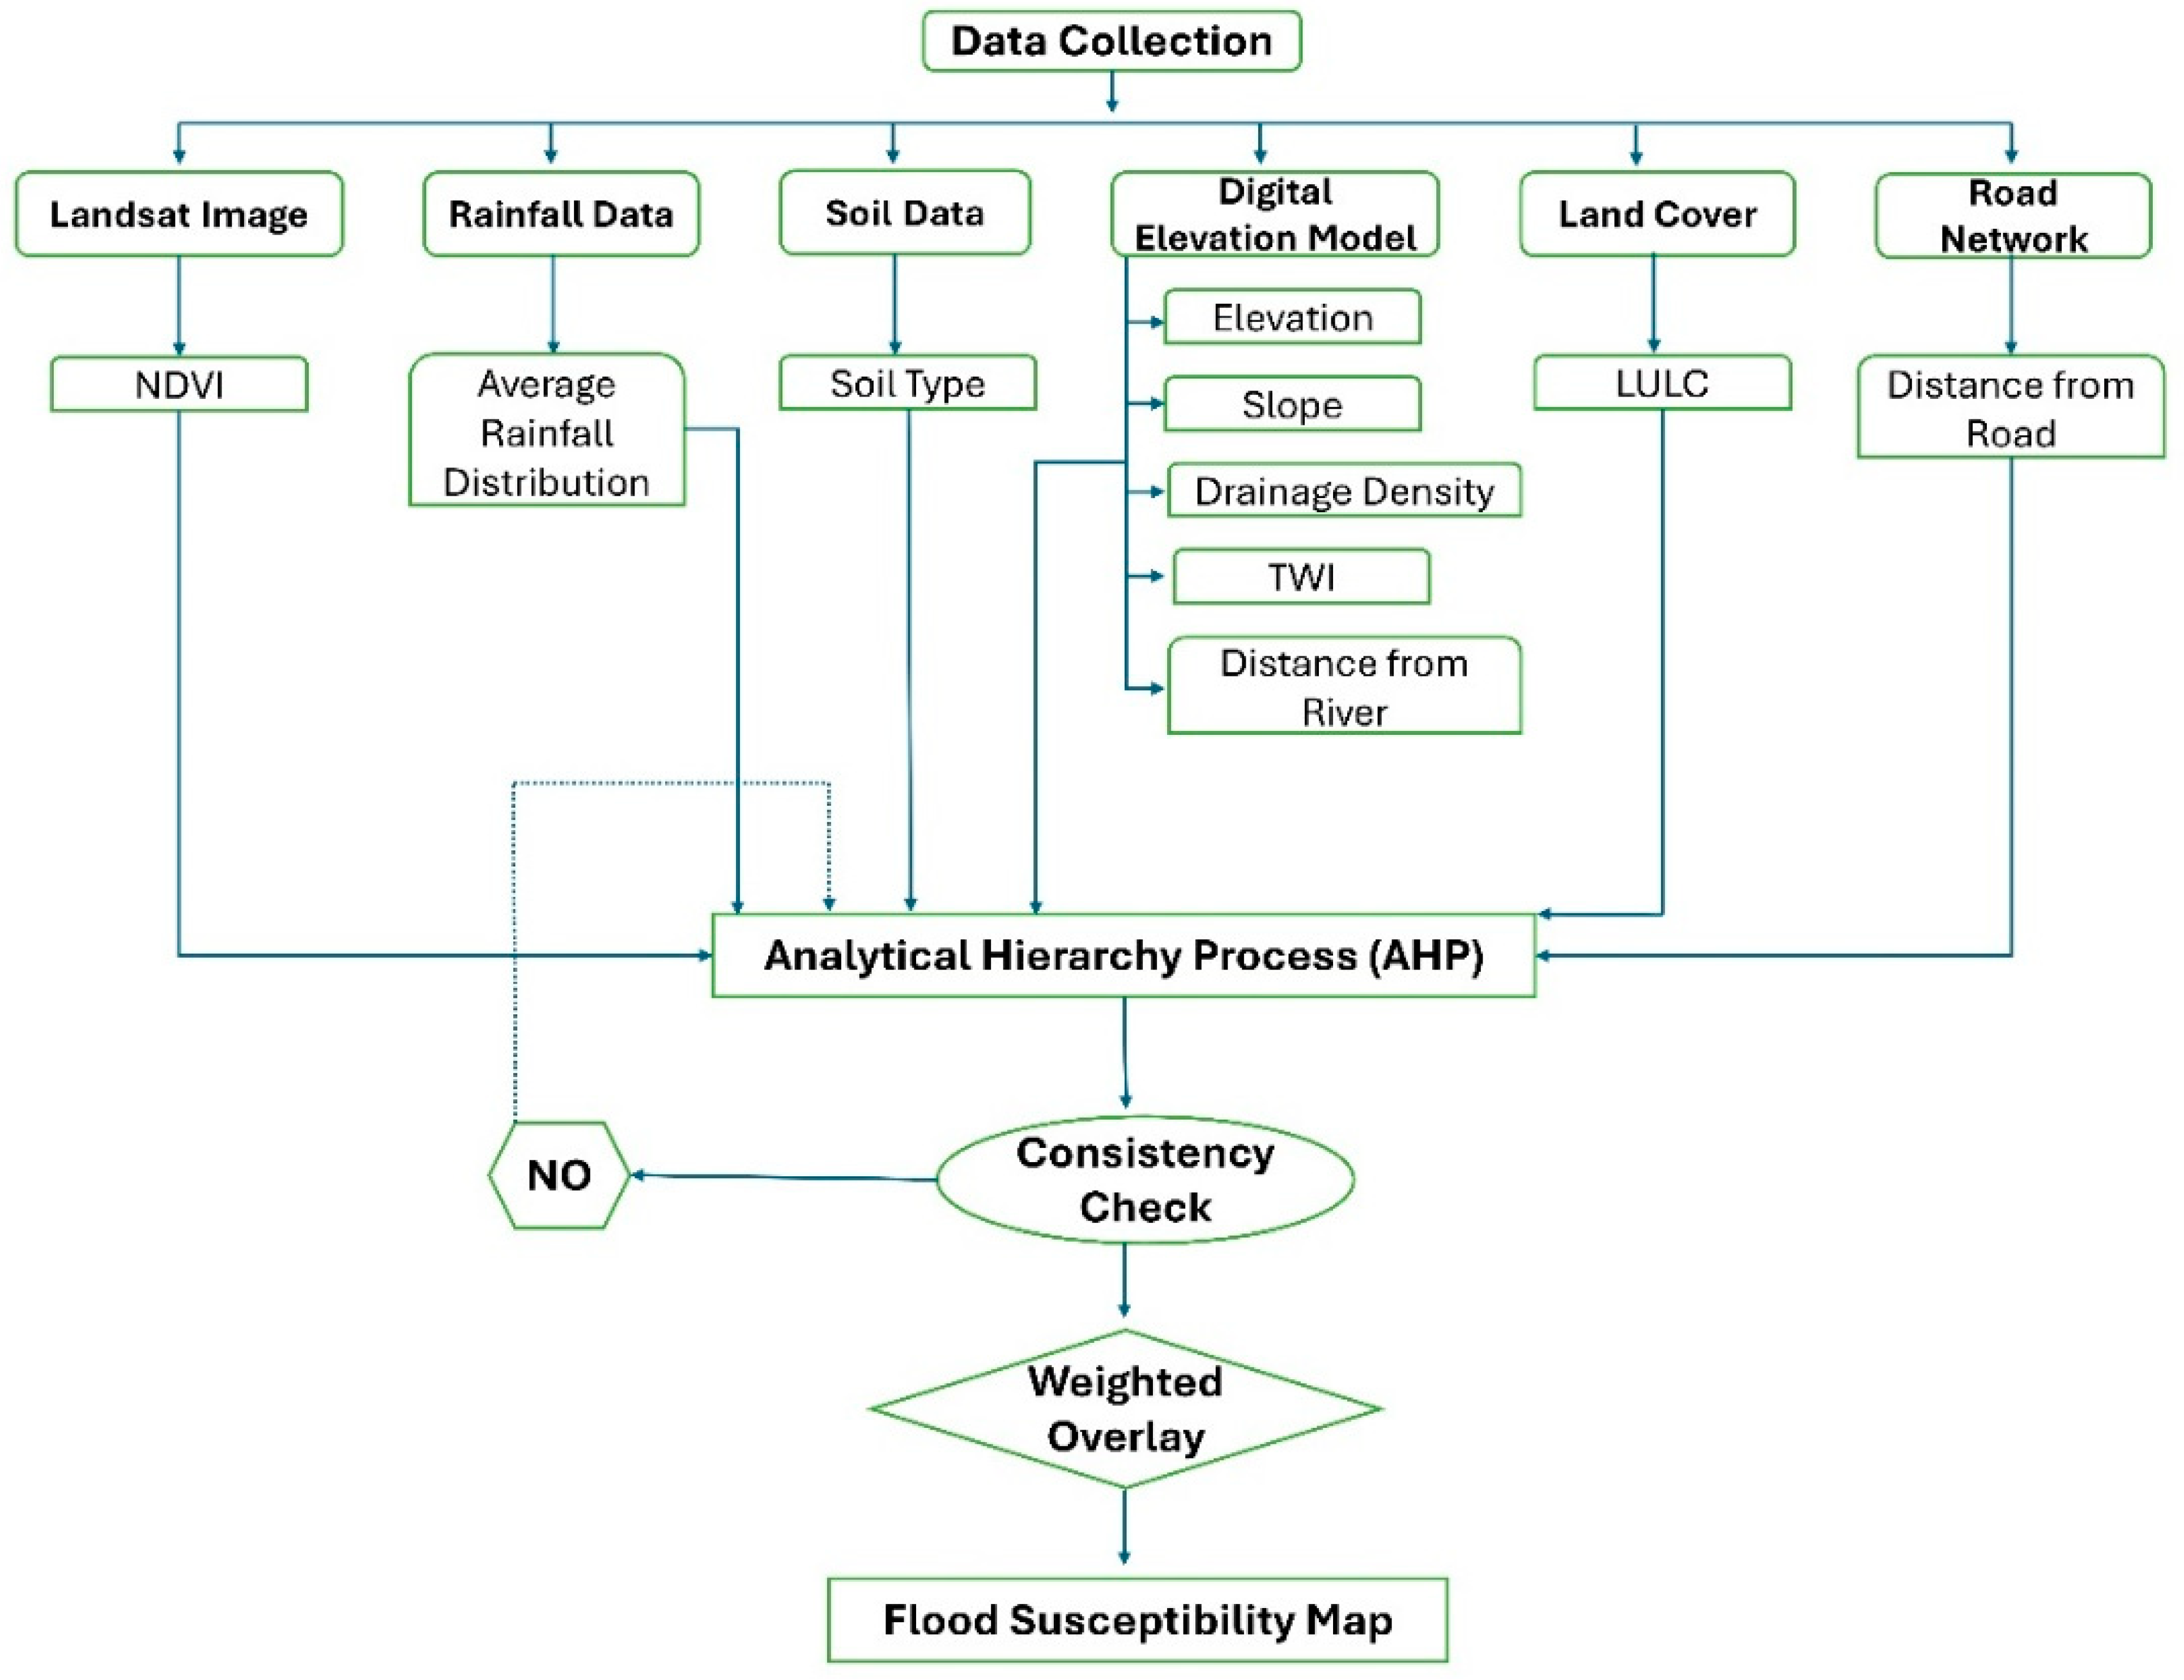
2. Materials and Methods
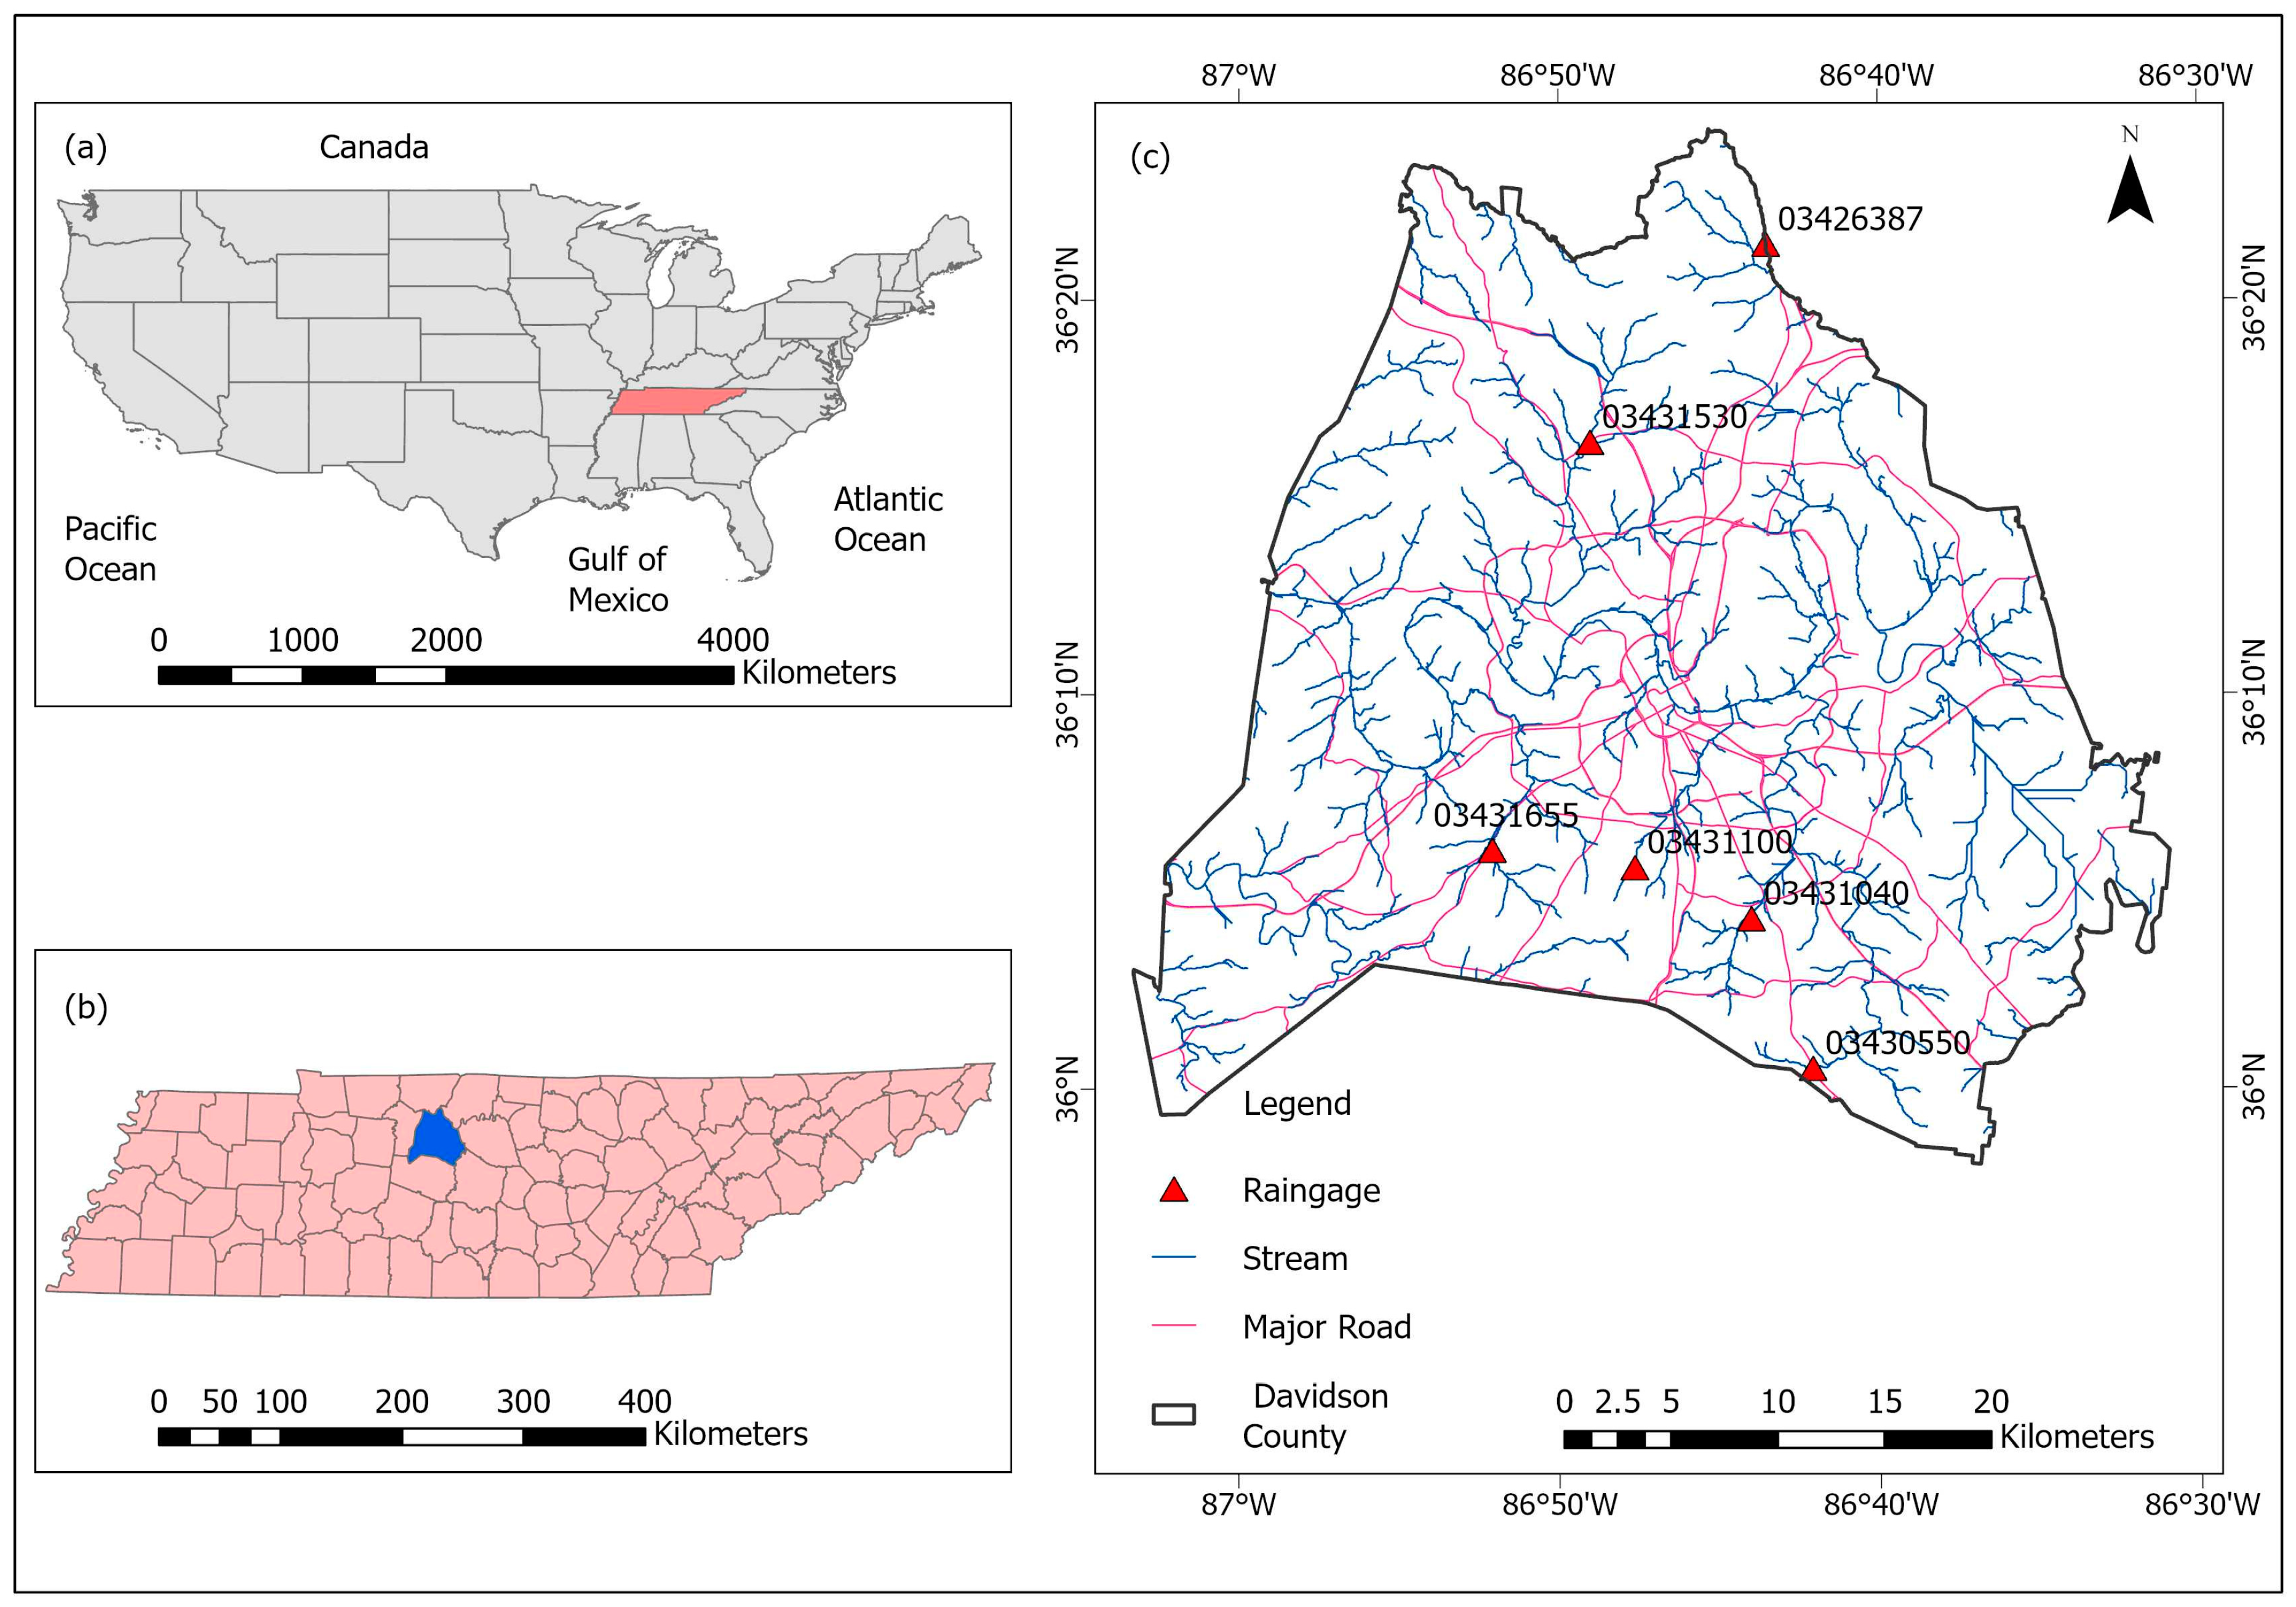
2.1. Study Area
2.2. Data
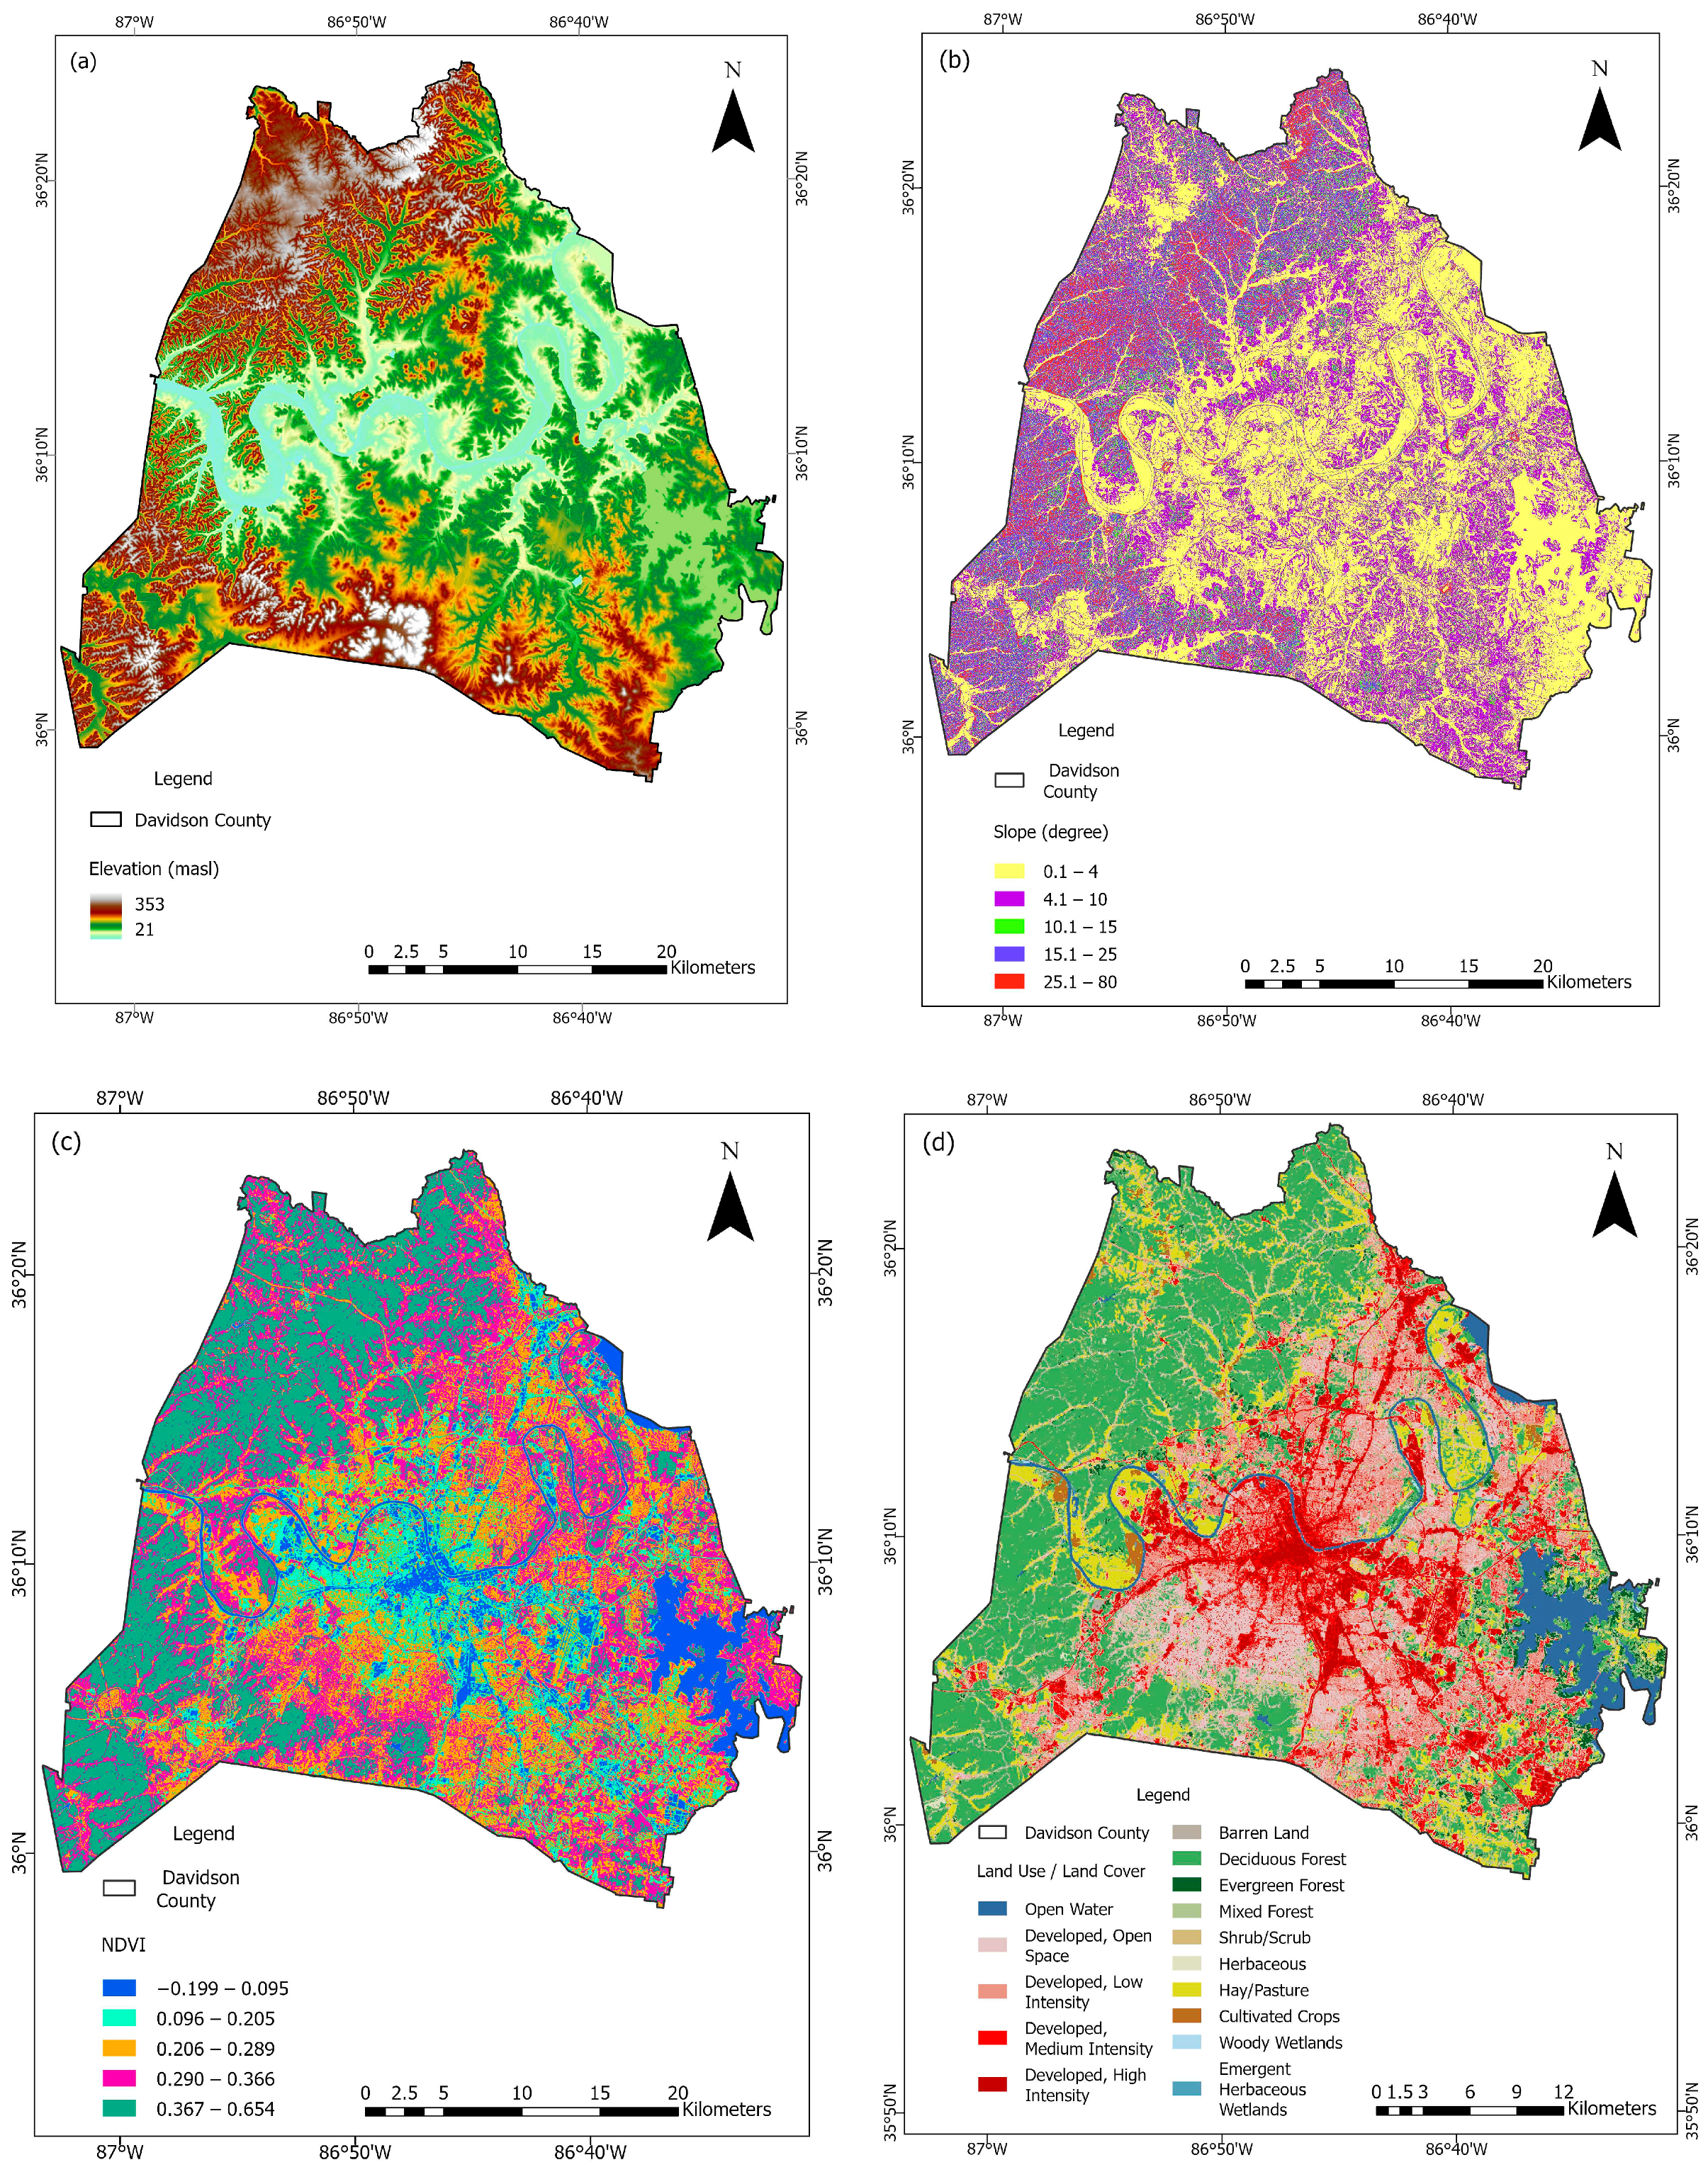
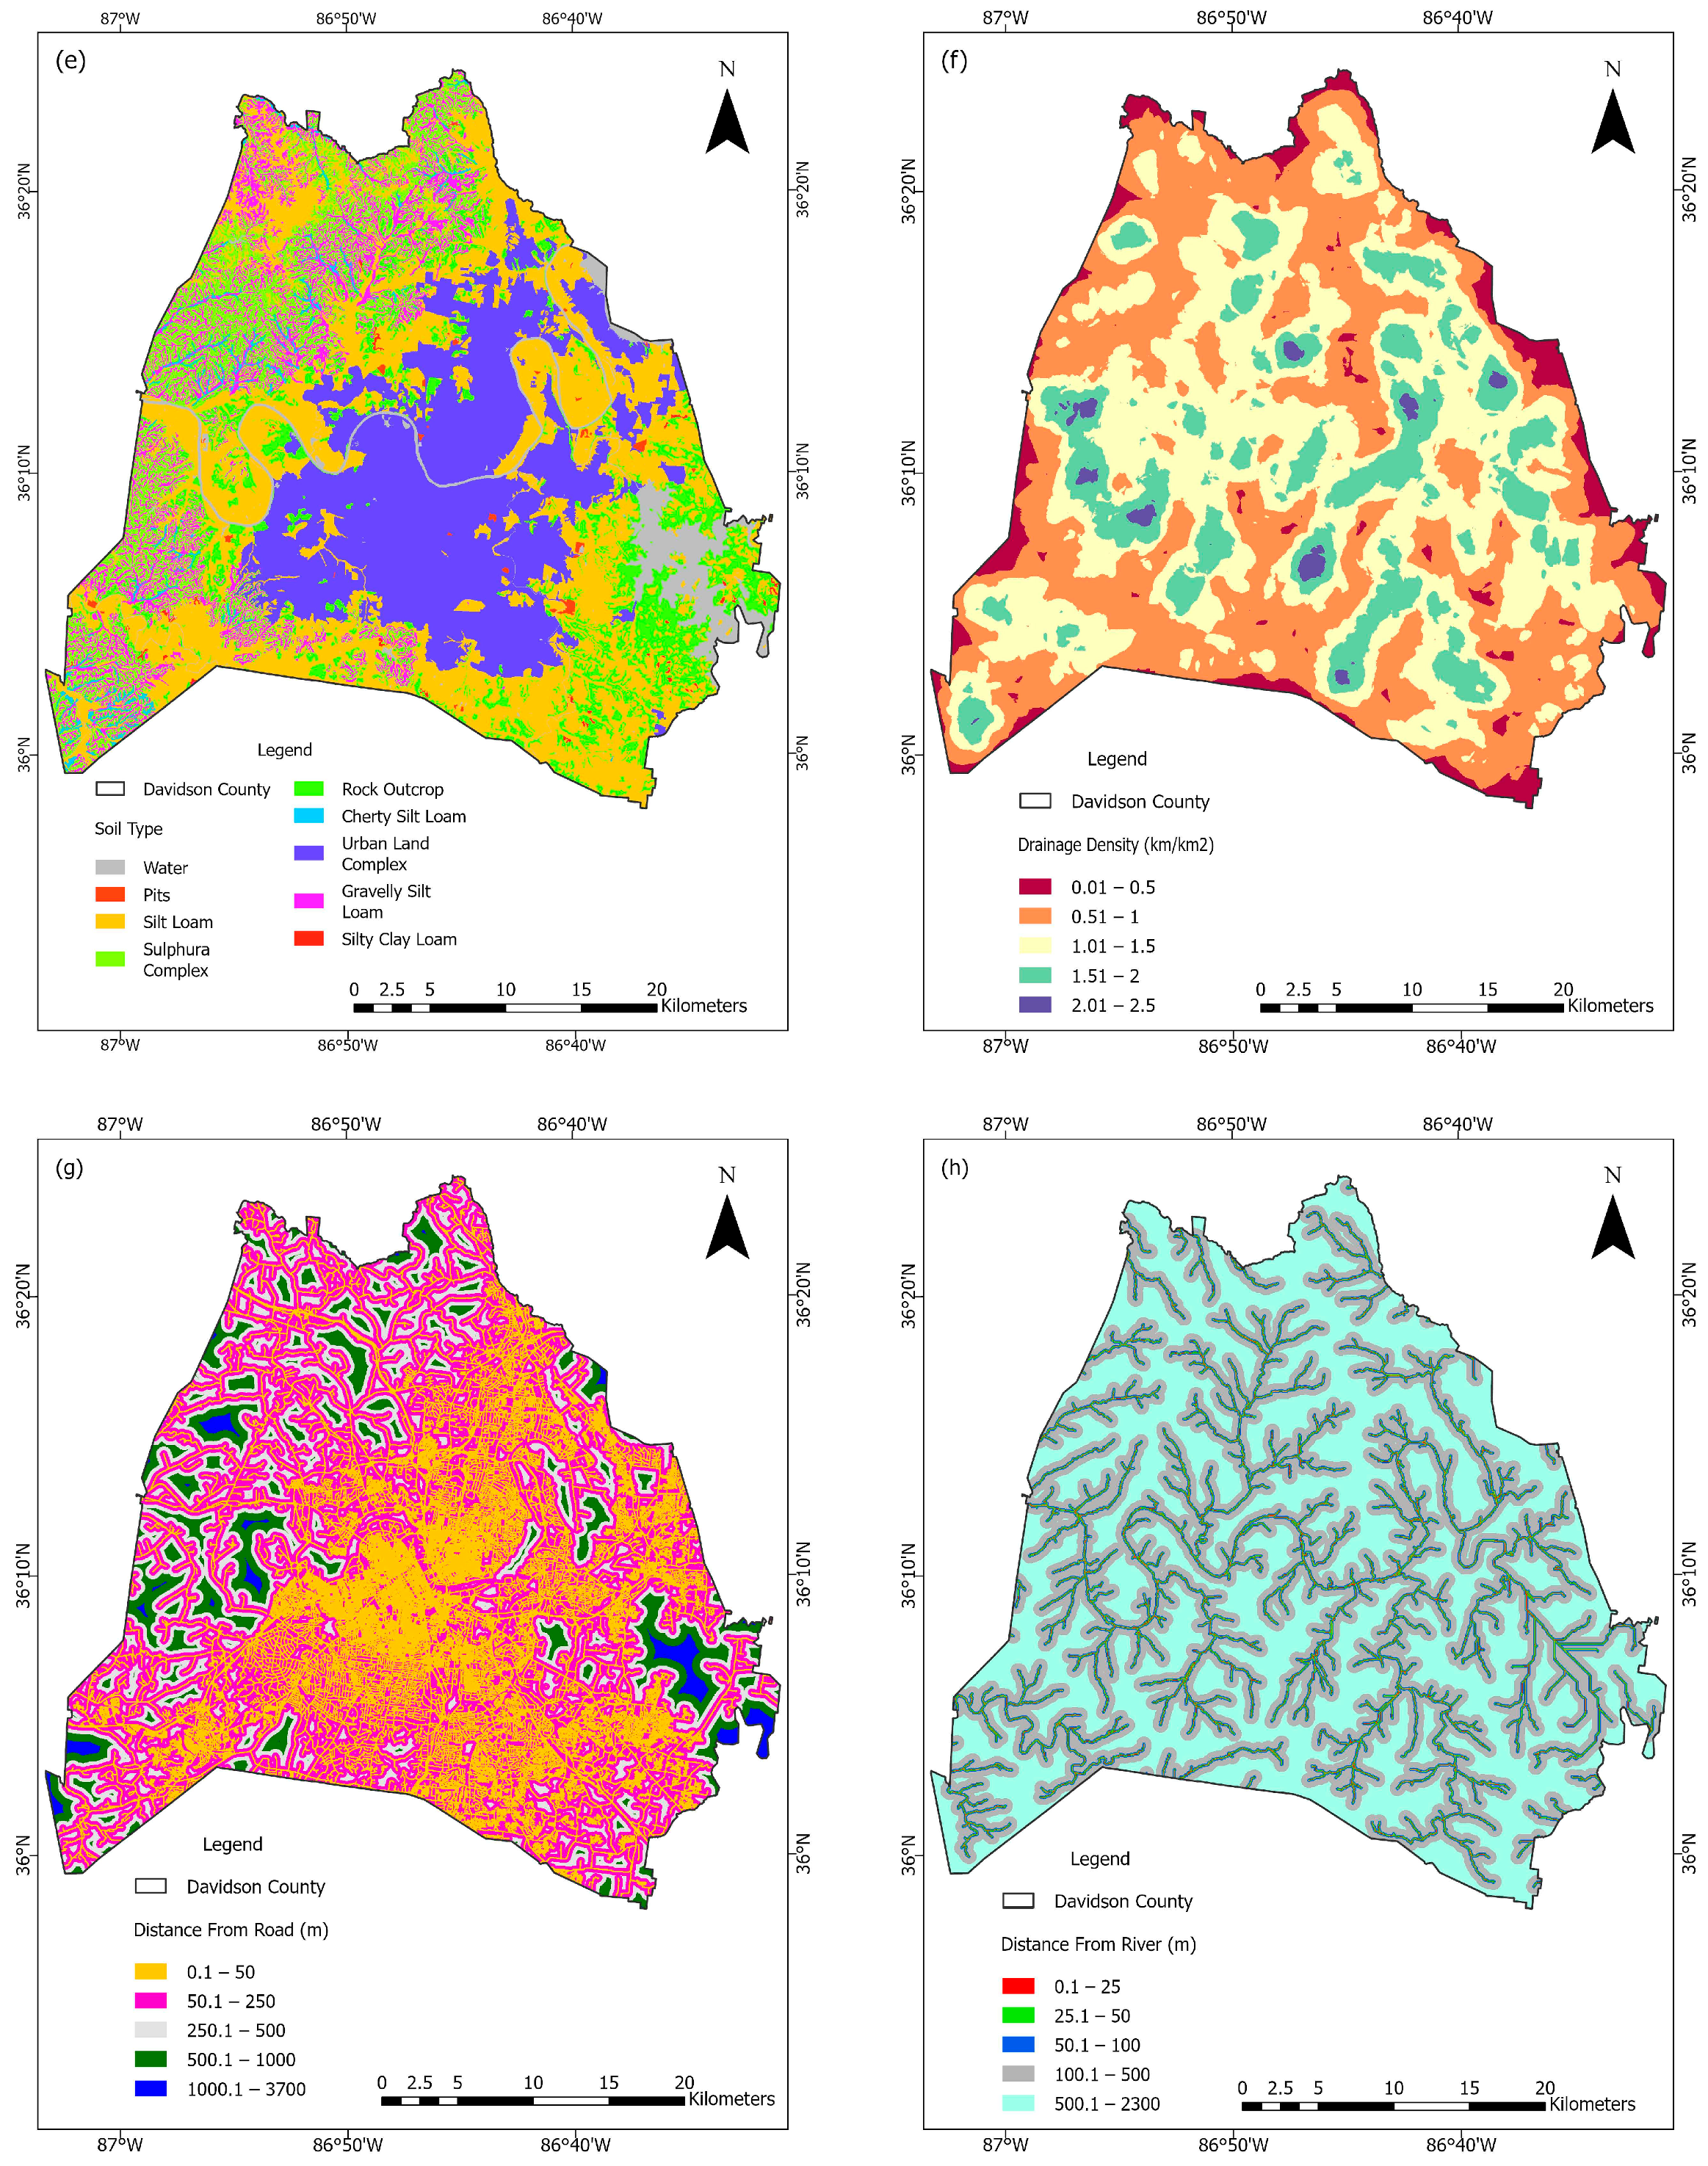
2.3. GIS Processing of Flood Conditioning Factors
2.3.1. Elevation
2.3.2. Slope
2.3.3. Normalized Difference Vegetation Index (NDVI)
2.3.4. Land Use/Land Cover (LULC)
2.3.5. Soil Type
2.3.6. Drainage Density (DD)
2.3.7. Distance from Road (DRO)
2.3.8. Distance from River (DRI)
2.3.9. Rainfall
2.3.10. Topographic Wetness Index (TWI)
2.4. Analytical Hierarchy Process for Relative Weightage
2.5. Sensitivity Analysis
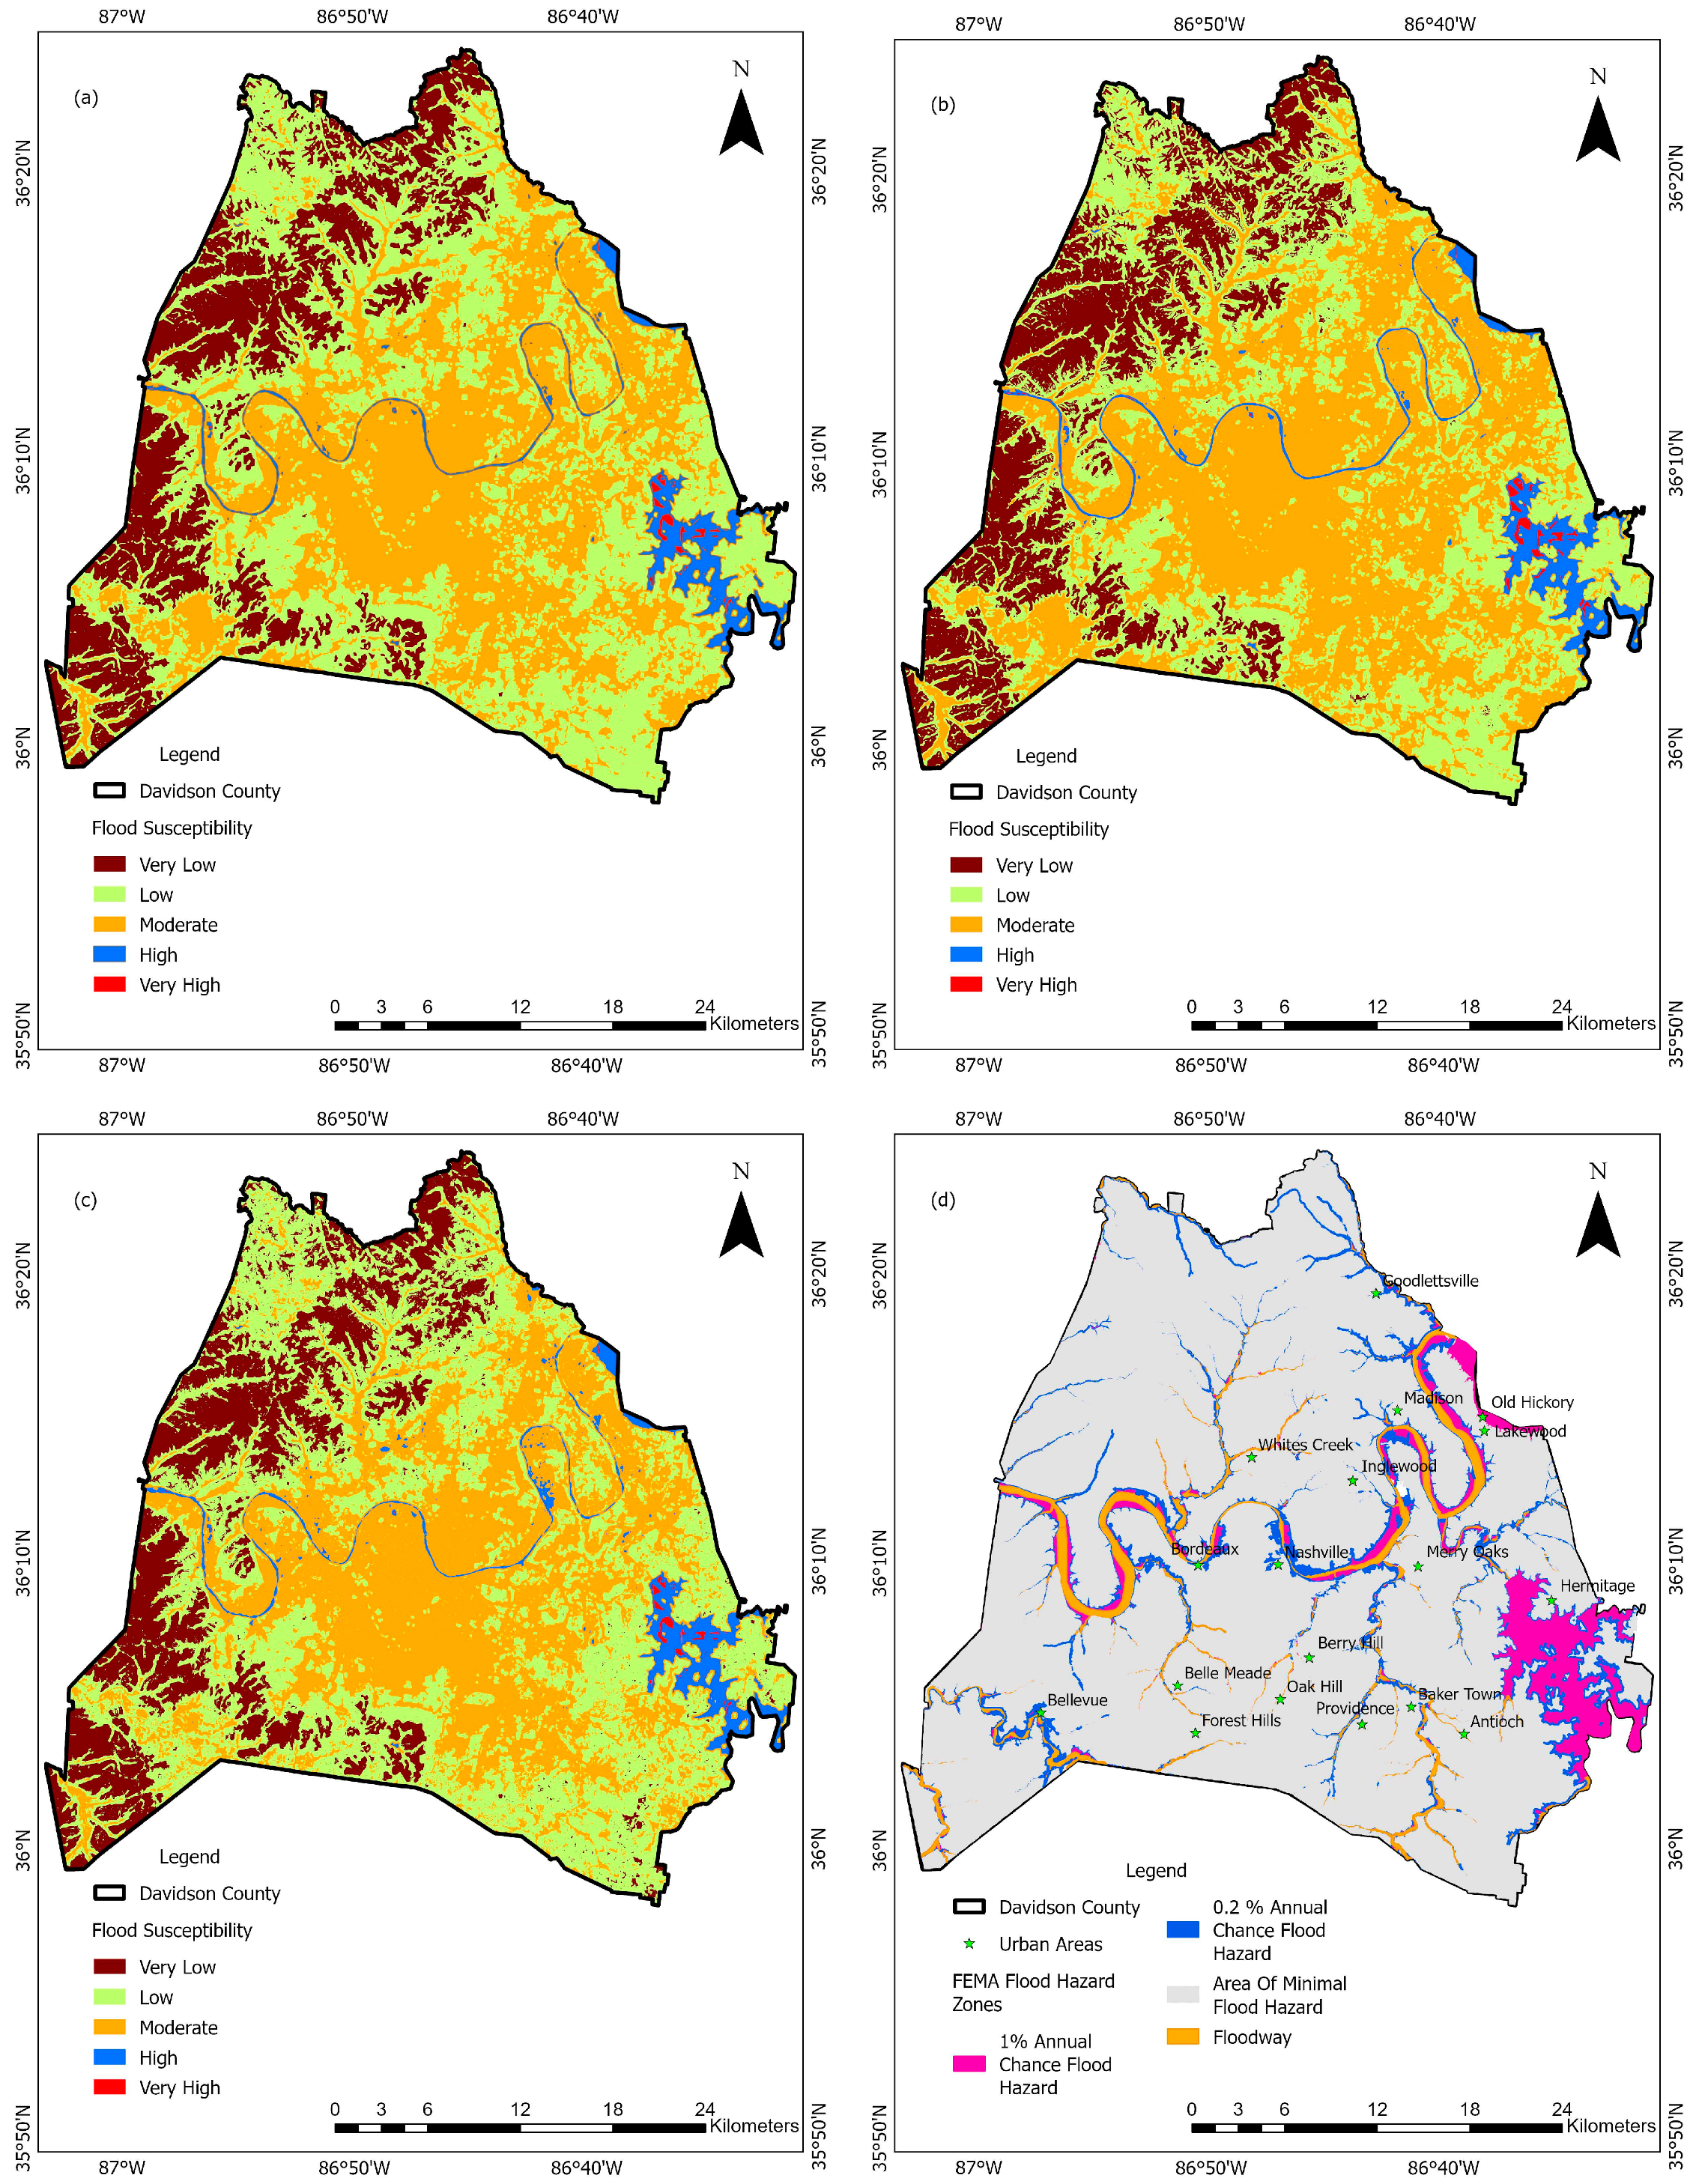
3. Results
4. Discussion
4.1. Spatial Distribution of Flood Susceptibility
4.2. Spatial Distribution of Flood Susceptibility by Land Cover Type
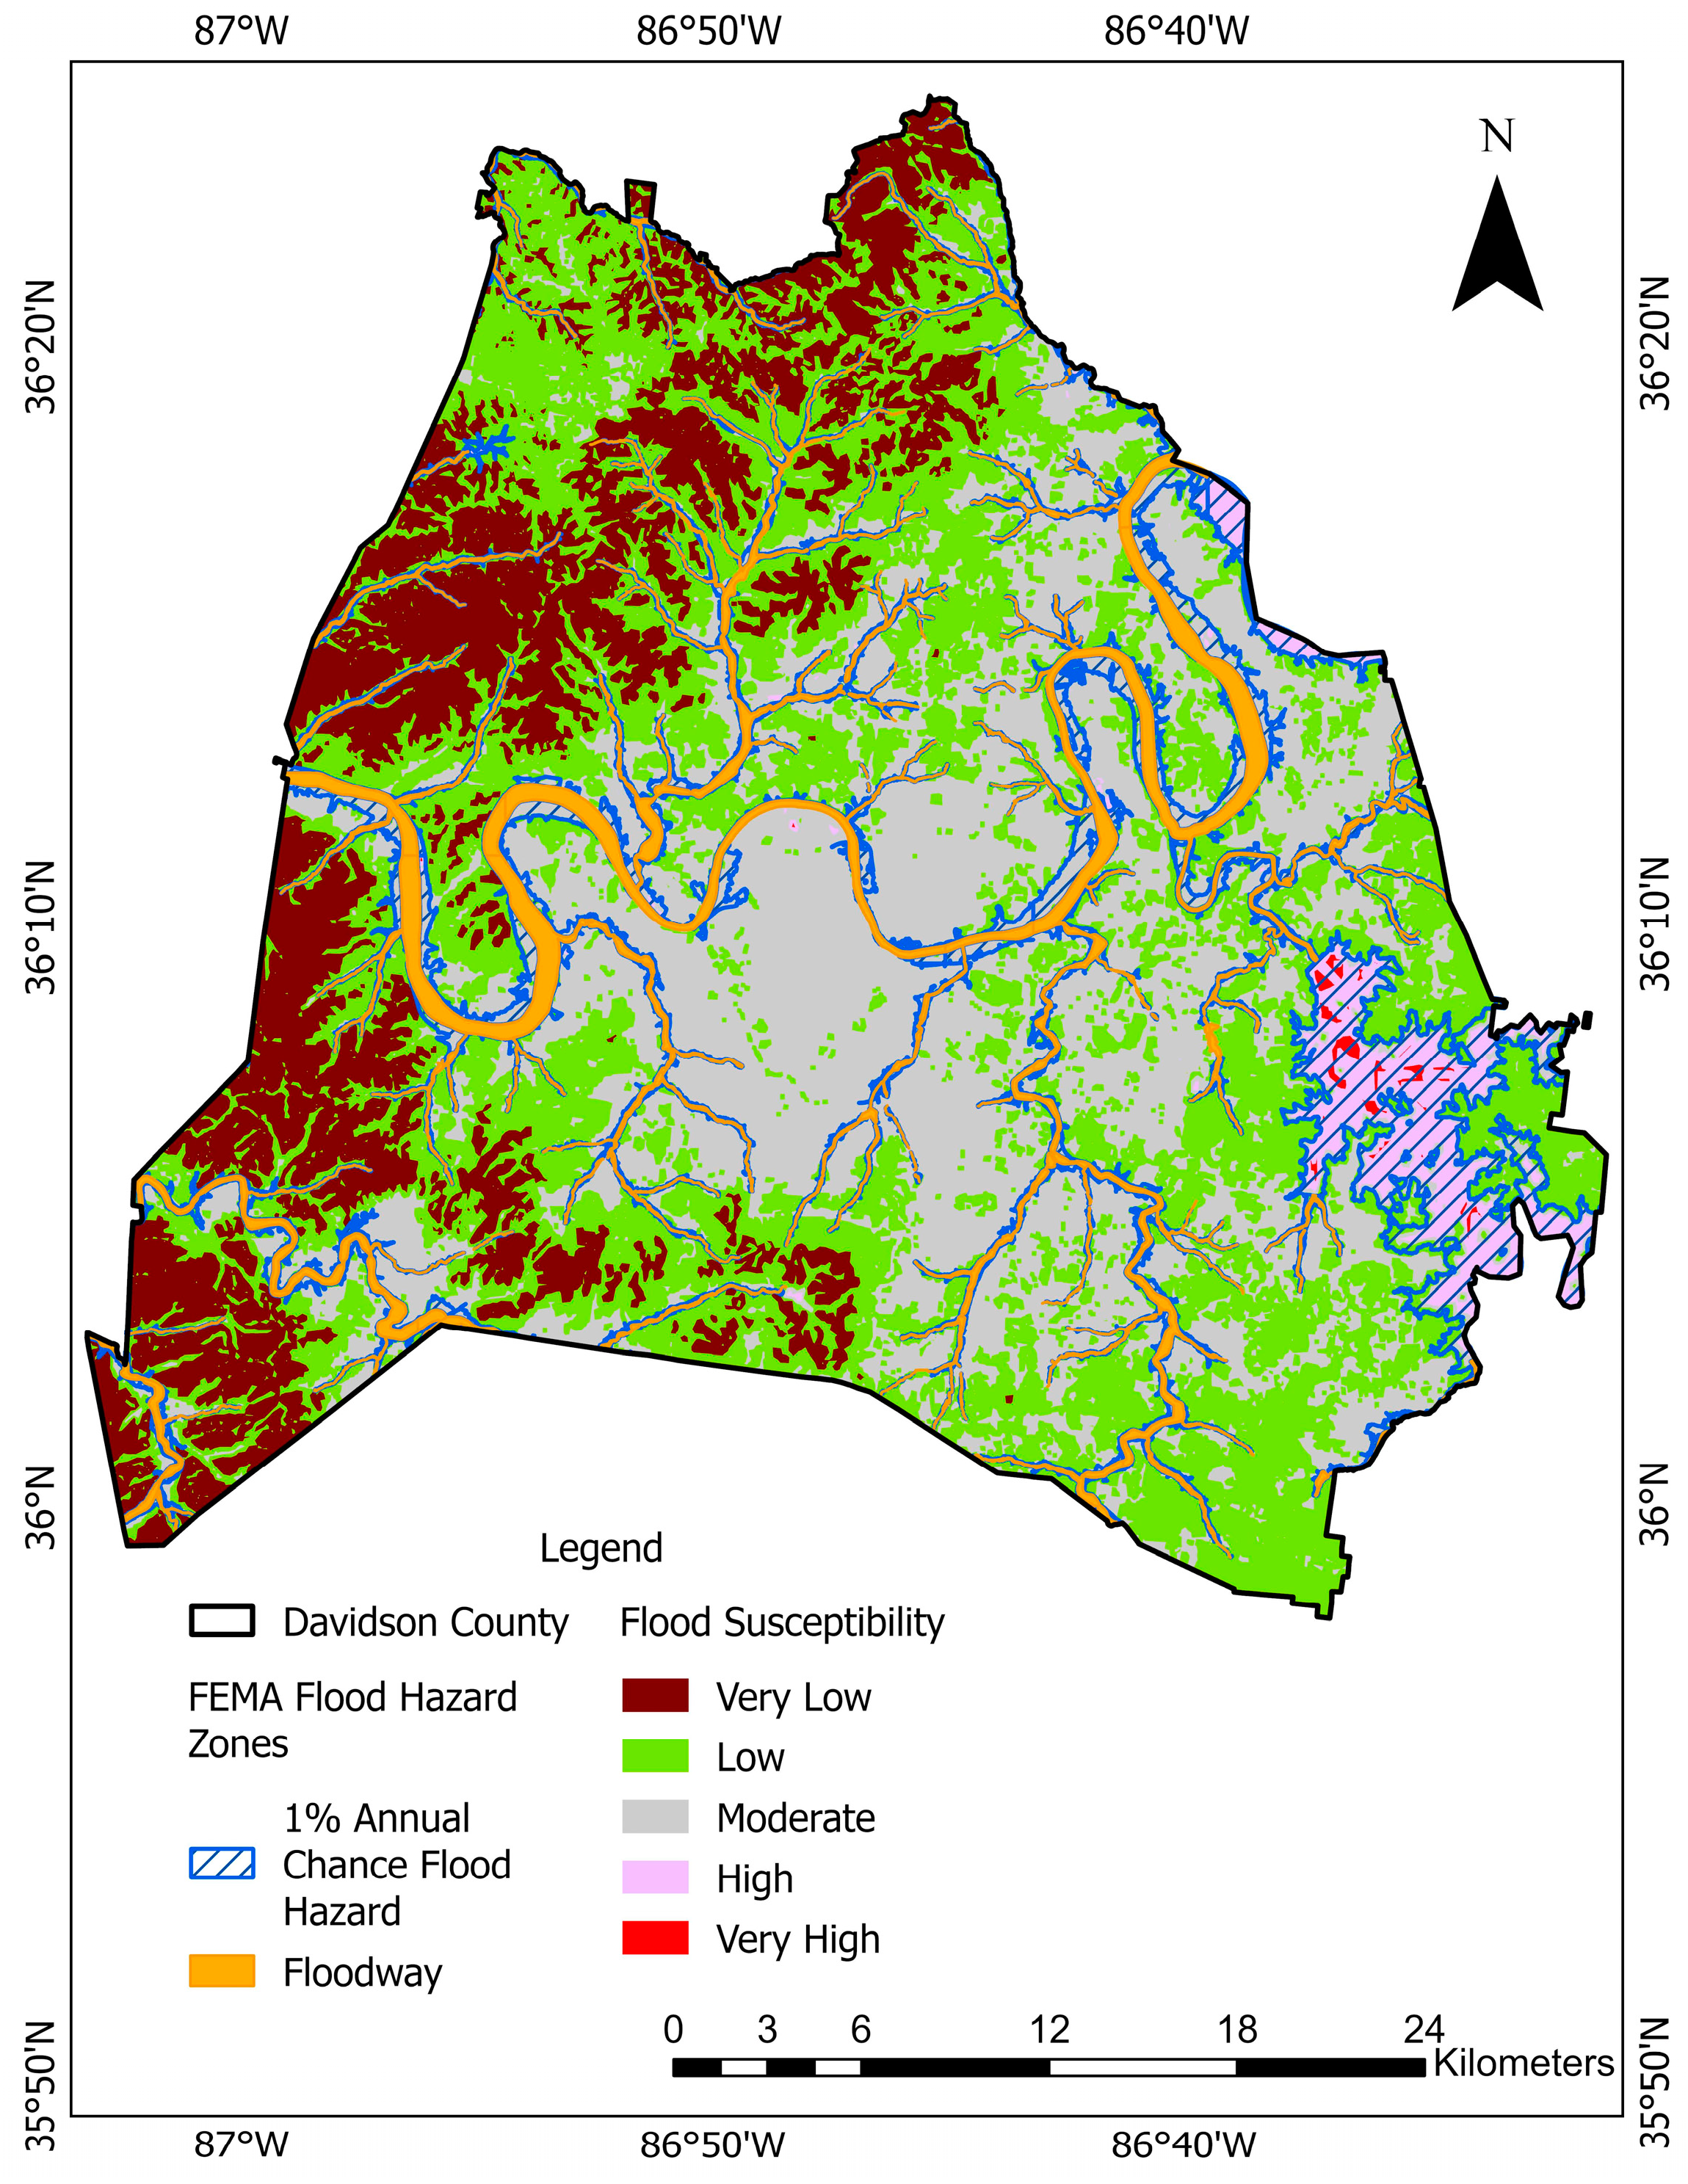
4.3. Validation of FSM with FEMA Flood Hazard Maps
4.4. Limitations and Potential Directions for Future Research
5. Conclusions
Author Contributions
Funding
Data Availability Statement
Conflicts of Interest
References
- Jenkins, K.; Surminski, S.; Hall, J.; Crick, F. Assessing surface water flood risk and management strategies under future climate change: Insights from an Agent-Based Model. Sci. Total Environ. 2017, 595, 159–168. [Google Scholar] [CrossRef] [PubMed]
- Dahal, D.; Magar, B.A.; Aryal, A.; Poudel, B.; Banjara, M.; Kalra, A. Analyzing Climate Dynamics and Developing Machine Learning Models for Flood Prediction in Sacramento, California. Hydroecol. Eng. 2024, 1, 10003. [Google Scholar] [CrossRef]
- Poudel, B.; Dahal, D.; Banjara, M.; Kalra, A. Assessing Meteorological Drought Patterns and Forecasting Accuracy with SPI and SPEI Using Machine Learning Models. Forecasting 2024, 6, 1026–1044. [Google Scholar] [CrossRef]
- Joint Economic Committee Congress of The United States. The 2024 Joint Economic Report; U.S. Government Publishing Office: Washington, DC, USA, 2024.
- Narimani, R.; Jun, C.; Shahzad, S.; Oh, J.; Park, K. Application of a Novel Hybrid Method for Flood Susceptibility Mapping with Satellite Images: A Case Study of Seoul, Korea. Remote Sens. 2021, 13, 2786. [Google Scholar] [CrossRef]
- Metropolitan Government of Nashville & Davidson County. Threat and Hazard Identification and Risk Assessment (THIRA); Metropolitan Government of Nashville & Davidson County: Nashville, TN, USA, 2023; pp. 3–7. [Google Scholar]
- National Weather Service Great Flood of 1927. Available online: https://www.weather.gov/ohx/greatfloodof1927 (accessed on 22 November 2024).
- Metropolitan Nashville-Davidson County. Metropolitan Nashville-Davidson Multi Hazard Mitigation Plan; Metropolitan Government of Nashville & Davidson County: Nashville, TN, USA, 2020. [Google Scholar]
- Quinones, F.; Gamble, C.R. Floods of February 1989 in Tennessee; Water-Resources Investigations Report; University of Michigan: Ann Arbor, MI, USA, 1990. [Google Scholar]
- Keim, B.D.; Kappel, W.D.; Muhlestein, G.A.; Hultstrand, D.M.; Parzybok, T.W.; Lewis, A.B.; Tomlinson, E.M.; Black, A.W. Assessment of the Extreme Rainfall Event at Nashville, TN and the Surrounding Region on May 1–3, 2010. J. Am. Water Resour. Assoc. 2018, 54, 1001–1010. [Google Scholar] [CrossRef]
- Metropolitan Development and Housing Agency. Metropolitan Nashville-Davidson County Action Plan for Disaster Recovery; Metropolitan Development and Housing Agency: Nashville, TN, USA, 2011; p. 2. [Google Scholar]
- US Department of Commerce. 27–28 March 2021 Historic Flash Flooding. Available online: https://www.weather.gov/ohx/20210327 (accessed on 5 March 2025).
- Beddoes, D.W.; Booth, C.A. Property level flood adaptation measures: A novel approach. Int. J. Saf. Secur. Eng. 2011, 1, 162–181. [Google Scholar] [CrossRef]
- Swain, K.C.; Singha, C.; Nayak, L. Flood Susceptibility Mapping through the GIS-AHP Technique Using the Cloud. ISPRS Int. J. Geo-Inf. 2020, 9, 720. [Google Scholar] [CrossRef]
- Elkhrachy, I. Flash Flood Hazard Mapping Using Satellite Images and GIS Tools: A case study of Najran City, Kingdom of Saudi Arabia (KSA). Egypt. J. Remote Sens. Space Sci. 2015, 18, 261–278. [Google Scholar] [CrossRef]
- Hammami, S.; Zouhri, L.; Souissi, D.; Souei, A.; Zghibi, A.; Marzougui, A.; Dlala, M. Application of the GIS based multi-criteria decision analysis and analytical hierarchy process (AHP) in the flood susceptibility mapping (Tunisia). Arab. J. Geosci. 2019, 12, 653. [Google Scholar] [CrossRef]
- Kazakis, N.; Kougias, I.; Patsialis, T. Assessment of flood hazard areas at a regional scale using an index-based approach and Analytical Hierarchy Process: Application in Rhodope–Evros region, Greece. Sci. Total Environ. 2015, 538, 555–563. [Google Scholar] [CrossRef]
- Mukherjee, F.; Singh, D. Detecting flood prone areas in Harris County: A GIS based analysis. GeoJournal 2020, 85, 647–663. [Google Scholar] [CrossRef]
- Ozkan, S.P.; Tarhan, C. Detection of Flood Hazard in Urban Areas Using GIS: Izmir Case. Procedia Technol. 2016, 22, 373–381. [Google Scholar] [CrossRef]
- Vojtek, M.; Vojteková, J. Flood Susceptibility Mapping on a National Scale in Slovakia Using the Analytical Hierarchy Process. Water 2019, 11, 364. [Google Scholar] [CrossRef]
- Kalra, A.; Parajuli, U.; Faruk, O.; Sarker, M.S.; Aryal, A.; Poudel, B.; Gupta, R. Assessing Flood Risk through GIS-Based Weighted Overlay and 1D Flood Simulation in Critical Sub-Catchment. In Proceedings of the World Environmental and Water Resources Congress 2024, Henderson, NV, USA, 19–23 May 2024; pp. 57–70. [Google Scholar] [CrossRef]
- Ali, S.A.; Parvin, F.; Pham, Q.B.; Vojtek, M.; Vojteková, J.; Costache, R.; Linh, N.T.T.; Nguyen, H.Q.; Ahmad, A.; Ghorbani, M.A. GIS-based comparative assessment of flood susceptibility mapping using hybrid multi-criteria decision-making approach, naïve Bayes tree, bivariate statistics and logistic regression: A case of Topľa basin, Slovakia. Ecol. Indic. 2020, 117, 106620. [Google Scholar] [CrossRef]
- Al-Juaidi, A.E.M.; Nassar, A.M.; Al-Juaidi, O.E.M. Evaluation of flood susceptibility mapping using logistic regression and GIS conditioning factors. Arab. J. Geosci. 2018, 11, 765. [Google Scholar] [CrossRef]
- Chowdhuri, I.; Pal, S.C.; Chakrabortty, R. Flood susceptibility mapping by ensemble evidential belief function and binomial logistic regression model on river basin of eastern India. Adv. Space Res. 2020, 65, 1466–1489. [Google Scholar] [CrossRef]
- Shafapour Tehrany, M.; Kumar, L.; Neamah Jebur, M.; Shabani, F. Evaluating the application of the statistical index method in flood susceptibility mapping and its comparison with frequency ratio and logistic regression methods. Geomat. Nat. Hazards Risk 2019, 10, 79–101. [Google Scholar] [CrossRef]
- Addis, A. GIS—Based flood susceptibility mapping using frequency ratio and information value models in upper Abay river basin, Ethiopia. Nat. Hazards Res. 2023, 3, 247–256. [Google Scholar] [CrossRef]
- Pawar, U.; Suppawimut, W.; Muttil, N.; Rathnayake, U. A GIS-Based Comparative Analysis of Frequency Ratio and Statistical Index Models for Flood Susceptibility Mapping in the Upper Krishna Basin, India. Water 2022, 14, 3771. [Google Scholar] [CrossRef]
- Rahmati, O.; Pourghasemi, H.R.; Zeinivand, H. Flood susceptibility mapping using frequency ratio and weights-of-evidence models in the Golastan Province, Iran. Geocarto Int. 2016, 31, 42–70. [Google Scholar] [CrossRef]
- Samanta, R.K.; Bhunia, G.S.; Shit, P.K.; Pourghasemi, H.R. Flood susceptibility mapping using geospatial frequency ratio technique: A case study of Subarnarekha River Basin, India. Model. Earth Syst. Environ. 2018, 4, 395–408. [Google Scholar] [CrossRef]
- Batar, A.K.; Watanabe, T. Landslide Susceptibility Mapping and Assessment Using Geospatial Platforms and Weights of Evidence (WoE) Method in the Indian Himalayan Region: Recent Developments, Gaps, and Future Directions. ISPRS Int. J. Geo-Inf. 2021, 10, 114. [Google Scholar] [CrossRef]
- Costache, R.; Pham, Q.B.; Arabameri, A.; Diaconu, D.C.; Costache, I.; Crăciun, A.; Ciobotaru, N.; Pandey, M.; Arora, A.; Ali, S.A.; et al. Flash-flood propagation susceptibility estimation using weights of evidence and their novel ensembles with multicriteria decision making and machine learning. Geocarto Int. 2022, 37, 8361–8393. [Google Scholar] [CrossRef]
- Tehrany, M.S.; Pradhan, B.; Jebur, M.N. Flood susceptibility mapping using a novel ensemble weights-of-evidence and support vector machine models in GIS. J. Hydrol. 2014, 512, 332–343. [Google Scholar] [CrossRef]
- Akay, H. Flood hazards susceptibility mapping using statistical, fuzzy logic, and MCDM methods. Soft Comput. 2021, 25, 9325–9346. [Google Scholar] [CrossRef]
- Mousavi, S.M.; Ataie-Ashtiani, B.; Hosseini, S.M. Comparison of statistical and MCDM approaches for flood susceptibility mapping in northern Iran. J. Hydrol. 2022, 612, 128072. [Google Scholar] [CrossRef]
- Kourgialas, N.N.; Karatzas, G.P. Flood management and a GIS modelling method to assess flood-hazard areas—A case study. Hydrol. Sci. J. 2011, 56, 212–225. [Google Scholar] [CrossRef]
- Saaty, T.L. The Analytic Hierarchy Process: Planning, Priority Setting, Resource Allocation; McGraw-Hill International Book Co.: New York, NY, USA; London, UK, 1980; ISBN 978-0-07-054371-3. [Google Scholar]
- Varra, G.; Della Morte, R.; Tartaglia, M.; Fiduccia, A.; Zammuto, A.; Agostino, I.; Booth, C.A.; Quinn, N.; Lamond, J.E.; Cozzolino, L. Flood Susceptibility Assessment for Improving the Resilience Capacity of Railway Infrastructure Networks. Water 2024, 16, 2592. [Google Scholar] [CrossRef]
- US Census Bureau Davidson County, Tennessee—Census Bureau Profile. Available online: https://data.census.gov/profile/Davidson_County,_Tennessee?g=050XX00US47037 (accessed on 22 November 2024).
- Potapov, P.; Hansen, M.C.; Kommareddy, I.; Kommareddy, A.; Turubanova, S.; Pickens, A.; Adusei, B.; Tyukavina, A.; Ying, Q. Landsat Analysis Ready Data for Global Land Cover and Land Cover Change Mapping. Remote Sens. 2020, 12, 426. [Google Scholar] [CrossRef]
- Choubin, B.; Moradi, E.; Golshan, M.; Adamowski, J.; Sajedi-Hosseini, F.; Mosavi, A. An ensemble prediction of flood susceptibility using multivariate discriminant analysis, classification and regression trees, and support vector machines. Sci. Total Environ. 2019, 651, 2087–2096. [Google Scholar] [CrossRef]
- Chen, Y.; Liu, R.; Barrett, D.; Gao, L.; Zhou, M.; Renzullo, L.; Emelyanova, I. A spatial assessment framework for evaluating flood risk under extreme climates. Sci. Total Environ. 2015, 538, 512–523. [Google Scholar] [CrossRef] [PubMed]
- Soltani, K.; Ebtehaj, I.; Amiri, A.; Azari, A.; Gharabaghi, B.; Bonakdari, H. Mapping the spatial and temporal variability of flood susceptibility using remotely sensed normalized difference vegetation index and the forecasted changes in the future. Sci. Total Environ. 2021, 770, 145288. [Google Scholar] [CrossRef]
- Farhadi, H.; Najafzadeh, M. Flood Risk Mapping by Remote Sensing Data and Random Forest Technique. Water 2021, 13, 3115. [Google Scholar] [CrossRef]
- Mojaddadi, H.; Pradhan, B.; Nampak, H.; Ahmad, N.; Ghazali, A.H. bin Ensemble machine-learning-based geospatial approach for flood risk assessment using multi-sensor remote-sensing data and GIS. Geomat. Nat. Hazards Risk 2017, 8, 1080–1102. [Google Scholar] [CrossRef]
- Magesh, N.S.; Chandrasekar, N.; Soundranayagam, J.P. Delineation of groundwater potential zones in Theni district, Tamil Nadu, using remote sensing, GIS and MIF techniques. Geosci. Front. 2012, 3, 189–196. [Google Scholar] [CrossRef]
- Regmi, N.R.; Giardino, J.R.; Vitek, J.D. Modeling susceptibility to landslides using the weight of evidence approach: Western Colorado, USA. Geomorphology 2010, 115, 172–187. [Google Scholar] [CrossRef]
- Karymbalis, E.; Andreou, M.; Batzakis, D.-V.; Tsanakas, K.; Karalis, S. Integration of GIS-Based Multicriteria Decision Analysis and Analytic Hierarchy Process for Flood-Hazard Assessment in the Megalo Rema River Catchment (East Attica, Greece). Sustainability 2021, 13, 10232. [Google Scholar] [CrossRef]
- Nguyen, H.N.; Fukuda, H.; Nguyen, M.N. Assessment of the Susceptibility of Urban Flooding Using GIS with an Analytical Hierarchy Process in Hanoi, Vietnam. Sustainability 2024, 16, 3934. [Google Scholar] [CrossRef]
- Kaya, C.M.; Derin, L. Parameters and methods used in flood susceptibility mapping: A review. J. Water Clim. Change 2023, 14, 1935–1960. [Google Scholar] [CrossRef]
- Mokhtari, E.; Abdelkebir, B.; Djenaoui, A.; Hamdani, N.E.H. Integrated analytic hierarchy process and fuzzy analytic hierarchy process for Sahel watershed flood susceptibility assessment, Algeria. Water Pract. Technol. 2024, 19, 453–475. [Google Scholar] [CrossRef]
- Mukherjee, K. A Note on Limitations of FAHP. In Supplier Selection; Studies in Systems, Decision and Control; Springer India: New Delhi, India, 2017; Volume 88, pp. 101–111. ISBN 978-81-322-3698-6. [Google Scholar]
- Noori, A.; Bonakdari, H. A GIS-Based Fuzzy Hierarchical Modeling for Flood Susceptibility Mapping: A Case Study in Ontario, Eastern Canada. Environ. Sci. Proc. 2023, 25, 62. [Google Scholar] [CrossRef]
- Purnawali, H.S.; Hariyanto, T.; Pratomo, D.G.; Hidayati, N. Flood vulnerability analysis using remote sensing and GIS: A case study of Sidoarjo Regency. IPTEK J. Proc. Ser. 2017, 3, 568–577. [Google Scholar] [CrossRef]
- Skilodimou, H.D.; Bathrellos, G.D.; Chousianitis, K.; Youssef, A.M.; Pradhan, B. Multi-hazard assessment modeling via multi-criteria analysis and GIS: A case study. Environ. Earth Sci. 2019, 78, 47. [Google Scholar] [CrossRef]
- Skilodimou, H.D.; Bathrellos, G.D.; Alexakis, D.E. Flood Hazard Assessment Mapping in Burned and Urban Areas. Sustainability 2021, 13, 4455. [Google Scholar] [CrossRef]
- Chen, Y.; Yu, J.; Khan, S. Spatial sensitivity analysis of multi-criteria weights in GIS-based land suitability evaluation. Environ. Model. Softw. 2010, 25, 1582–1591. [Google Scholar] [CrossRef]
- Bathrellos, G.D.; Karymbalis, E.; Skilodimou, H.D.; Gaki-Papanastassiou, K.; Baltas, E.A. Urban flood hazard assessment in the basin of Athens Metropolitan city, Greece. Env. Earth Sci. 2016, 75, 319. [Google Scholar] [CrossRef]
- Drobne, S.; Lisec, A. Multi-attribute decision analysis in GIS: Weighted linear combination and ordered weighted averaging. Informatica 2009, 33, 459–474. [Google Scholar]
- Mahmoud, S.H.; Gan, T.Y. Multi-criteria approach to develop flood susceptibility maps in arid regions of Middle East. J. Clean. Prod. 2018, 196, 216–229. [Google Scholar] [CrossRef]
- Haghizadeh, A.; Siahkamari, S.; Haghiabi, A.H.; Rahmati, O. Forecasting flood-prone areas using Shannon’s entropy model. J. Earth Syst. Sci. 2017, 126, 39. [Google Scholar] [CrossRef]
- Khosravi, K.; Nohani, E.; Maroufinia, E.; Pourghasemi, H.R. A GIS-based flood susceptibility assessment and its mapping in Iran: A comparison between frequency ratio and weights-of-evidence bivariate statistical models with multi-criteria decision-making technique. Nat. Hazards 2016, 83, 947–987. [Google Scholar] [CrossRef]
- Rahmati, O.; Zeinivand, H.; Besharat, M. Flood hazard zoning in Yasooj region, Iran, using GIS and multi-criteria decision analysis. Geomat. Nat. Hazards Risk 2016, 7, 1000–1017. [Google Scholar] [CrossRef]
- Samanta, S.; Koloa, C.; Kumar Pal, D.; Palsamanta, B. Flood Risk Analysis in Lower Part of Markham River Based on Multi-Criteria Decision Approach (MCDA). Hydrology 2016, 3, 29. [Google Scholar] [CrossRef]

| Data | Source of Data | Original Resolution | Temporal Coverage |
|---|---|---|---|
| DEM | 3DEP from United States Geological Survey (USGS) (https://apps.nationalmap.gov/) | 10 m × 10 m | 30 January 2023 and 7 April 2023 (Published Date) |
| Slope | Derived from DEM | 10 m × 10 m | Same as of DEM |
| NDVI | Landsat 9 from USGS (https://earthexplorer.usgs.gov/) | 30 m × 30 m | 21 August 2023 |
| LULC | Multi-Resolution Land Characteristics Consortium (https://www.mrlc.gov/data) | 30 m × 30 m | NLCD 2023, updates annually |
| Soil Type | gSSURGO data from United States Department of Agriculture (USDA) (https://datagateway.nrcs.usda.gov/) | 30 m × 30 m | October 2024, updates annually |
| Drainage Density | Derived from DEM | 10 m × 10 m | Same as of DEM |
| Distance from Road | Topologically Integrated Geographic Encoding and Referencing (TIGER) from US Census Bureau | Not Applicable | September 2024, updates annually |
| Distance from River | Derived from DEM | 10 m × 10 m | Same as of DEM |
| Rainfall | USGS Water Data for Nation (https://waterdata.usgs.gov/nwis) | Not Applicable | 2012–2023 (Daily) |
| TWI | Derived from DEM | 10 m × 10 m | Same as of DEM |
| FEMA Flood Map | FEMA Flood Map Service Center (https://msc.fema.gov/portal/home) | Not Applicable | 20 June 2024 (Published Date) |
| USGS Site Number | Latitude (Degree) | Longitude (Degree) | Location | Average Annual Rainfall for 12 Years (Inch) |
|---|---|---|---|---|
| 03430550 | 36.009 | 86.702 | Mill Creek near Nolensville | 49.48 |
| 03431040 | 36.072 | 86.733 | Seven Mile Creek at Blackman Rd | 47.33 |
| 03431100 | 36.094 | 86.794 | Glendale Lane at Nashville | 49.00 |
| 03431655 | 36.102 | 86.868 | Richland Creek Belle Meade | 45.89 |
| 03426387 | 36.358 | 86.725 | Mansker Creek at Millersville | 51.65 |
| 03431530 | 36.274 | 86.817 | Whites Creek at Old Hickory Blvd | 54.59 |
| Scale | Numerical Rating | Reciprocal |
|---|---|---|
| Equally Important | 1 | 1 |
| Equally to Moderately Important | 2 | 1/2 |
| Moderately Important | 3 | 1/3 |
| Moderately to Strongly Important | 4 | 1/4 |
| Strongly Important | 5 | 1/5 |
| Strongly to Very Strongly Important | 6 | 1/6 |
| Very Strongly Important | 7 | 1/7 |
| Very Strongly to Extremely Important | 8 | 1/8 |
| Extremely Important | 9 | 1/9 |
| n | 1 | 2 | 3 | 4 | 5 | 6 | 7 | 8 | 9 | 10 |
|---|---|---|---|---|---|---|---|---|---|---|
| RI | 0 | 0 | 0.58 | 0.90 | 1.12 | 1.24 | 1.32 | 1.41 | 1.45 | 1.49 |
| Factors | Soil | LULC | TWI | Slope | Elevation | DD | NDVI | DRI | Rainfall | DRO |
|---|---|---|---|---|---|---|---|---|---|---|
| Soil | 1 | 2 | 3 | 4 | 5 | 6 | 7 | 8 | 9 | 10 |
| LULC | 0.5 | 1 | 2 | 3 | 4 | 5 | 6 | 7 | 8 | 9 |
| TWI | 0.33 | 0.5 | 1 | 2 | 3 | 4 | 5 | 6 | 7 | 8 |
| Slope | 0.25 | 0.33 | 0.5 | 1 | 2 | 3 | 4 | 5 | 6 | 7 |
| Elevation | 0.20 | 0.25 | 0.33 | 0.5 | 1 | 2 | 3 | 4 | 5 | 6 |
| DD | 0.17 | 0.20 | 0.25 | 0.33 | 0.5 | 1 | 2 | 3 | 4 | 5 |
| NDVI | 0.14 | 0.17 | 0.20 | 0.25 | 0.33 | 0.5 | 1 | 2 | 3 | 4 |
| DRI | 0.13 | 0.14 | 0.17 | 0.20 | 0.25 | 0.33 | 0.5 | 1 | 2 | 3 |
| Rainfall | 0.11 | 0.13 | 0.14 | 0.17 | 0.20 | 0.25 | 0.33 | 0.5 | 1 | 2 |
| DRO | 0.10 | 0.11 | 0.13 | 0.14 | 0.17 | 0.20 | 0.25 | 0.33 | 0.5 | 1 |
| Factors | Soil | LULC | TWI | Slope | Elevation | DD | NDVI | DRI | Rainfall | DRO | Wt (%) |
|---|---|---|---|---|---|---|---|---|---|---|---|
| Soil | 0.34 | 0.41 | 0.39 | 0.35 | 0.30 | 0.27 | 0.24 | 0.22 | 0.20 | 0.18 | 29 |
| LULC | 0.17 | 0.21 | 0.26 | 0.26 | 0.24 | 0.22 | 0.21 | 0.19 | 0.18 | 0.16 | 21 |
| TWI | 0.11 | 0.10 | 0.13 | 0.17 | 0.18 | 0.18 | 0.17 | 0.16 | 0.15 | 0.15 | 15 |
| Slope | 0.09 | 0.07 | 0.06 | 0.09 | 0.12 | 0.13 | 0.14 | 0.14 | 0.13 | 0.13 | 11 |
| Elevation | 0.07 | 0.05 | 0.04 | 0.04 | 0.06 | 0.09 | 0.10 | 0.11 | 0.11 | 0.11 | 8 |
| DD | 0.06 | 0.04 | 0.03 | 0.03 | 0.03 | 0.04 | 0.07 | 0.08 | 0.09 | 0.09 | 5 |
| NDVI | 0.05 | 0.03 | 0.03 | 0.02 | 0.02 | 0.02 | 0.03 | 0.05 | 0.07 | 0.07 | 4 |
| DRI | 0.04 | 0.03 | 0.02 | 0.02 | 0.02 | 0.01 | 0.02 | 0.03 | 0.04 | 0.05 | 3 |
| Rainfall | 0.04 | 0.03 | 0.02 | 0.01 | 0.01 | 0.01 | 0.01 | 0.01 | 0.02 | 0.04 | 2 |
| DRO | 0.03 | 0.02 | 0.02 | 0.01 | 0.01 | 0.01 | 0.01 | 0.01 | 0.01 | 0.02 | 2 |
| Flood Susceptibility | Area (km2) | Area (%) |
|---|---|---|
| Very Low | 237.81 | 17.48 |
| Low | 569.93 | 41.89 |
| Moderate | 510.66 | 37.53 |
| High | 39.90 | 2.93 |
| Very High | 2.26 | 0.17 |
| Flood Susceptibility | FSM (%) | FSMmax (%) | FSMmin (%) |
|---|---|---|---|
| Very Low | 17.48 | 17.90 | 17.37 |
| Low | 41.89 | 41.62 | 42.49 |
| Moderate | 37.53 | 36.86 | 36.80 |
| High | 2.93 | 3.38 | 3.18 |
| Very High | 0.17 | 0.24 | 0.16 |
| NLCD Classes | Very Low | Low | Moderate | High | Very High | |||||
|---|---|---|---|---|---|---|---|---|---|---|
| Area (km2) | Area (%) | Area (km2) | Area (%) | Area (km2) | Area (%) | Area (km2) | Area (%) | Area (km2) | Area (%) | |
| Open Water | 0.01 | 0.02 | 0.88 | 1.54 | 15.23 | 26.57 | 38.92 | 67.91 | 2.26 | 3.95 |
| Developed, Open Space | 3.27 | 1.67 | 92.48 | 47.20 | 100.08 | 51.09 | 0.08 | 0.04 | 0.00 | 0.00 |
| Developed, Low Intensity | 0.33 | 0.17 | 55.68 | 28.57 | 138.83 | 71.22 | 0.07 | 0.04 | 0.00 | 0.00 |
| Developed, Medium Intensity | 0.15 | 0.11 | 28.06 | 21.55 | 101.86 | 78.22 | 0.15 | 0.12 | 0.00 | 0.00 |
| Developed, High Intensity | 0.01 | 0.01 | 7.45 | 10.58 | 62.50 | 88.75 | 0.46 | 0.66 | 0.00 | 0.00 |
| Barren Land | 0.02 | 0.52 | 2.09 | 61.03 | 1.27 | 36.95 | 0.05 | 1.49 | 0.00 | 0.00 |
| Deciduous Forest | 221.54 | 52.41 | 187.14 | 44.27 | 13.99 | 3.31 | 0.02 | 0.00 | 0.00 | 0.00 |
| Evergreen Forest | 0.60 | 2.10 | 26.07 | 91.55 | 1.80 | 6.31 | 0.01 | 0.03 | 0.00 | 0.00 |
| Mixed Forest | 7.52 | 8.92 | 70.10 | 83.19 | 6.64 | 7.89 | 0.00 | 0.00 | 0.00 | 0.00 |
| Shrub/Scrub | 0.65 | 19.36 | 2.41 | 71.35 | 0.31 | 9.27 | 0.00 | 0.03 | 0.00 | 0.00 |
| Herbaceous | 1.23 | 15.63 | 5.36 | 67.98 | 1.28 | 16.22 | 0.01 | 0.17 | 0.00 | 0.00 |
| Pasture/Hay | 2.48 | 1.66 | 88.94 | 59.78 | 57.34 | 38.54 | 0.02 | 0.01 | 0.00 | 0.00 |
| Cultivated Crops | 0.00 | 0.05 | 2.73 | 30.78 | 6.14 | 69.17 | 0.00 | 0.00 | 0.00 | 0.00 |
| Woody Wetlands | 0.00 | 0.00 | 0.33 | 16.98 | 1.58 | 80.28 | 0.05 | 2.74 | 0.00 | 0.00 |
| Emergent Herbaceous Wetlands | 0.00 | 0.04 | 0.19 | 9.43 | 1.81 | 88.63 | 0.04 | 1.90 | 0.00 | 0.00 |
Disclaimer/Publisher’s Note: The statements, opinions and data contained in all publications are solely those of the individual author(s) and contributor(s) and not of MDPI and/or the editor(s). MDPI and/or the editor(s) disclaim responsibility for any injury to people or property resulting from any ideas, methods, instructions or products referred to in the content. |
© 2025 by the authors. Licensee MDPI, Basel, Switzerland. This article is an open access article distributed under the terms and conditions of the Creative Commons Attribution (CC BY) license (https://creativecommons.org/licenses/by/4.0/).
Share and Cite
Shrestha, S.; Dahal, D.; Poudel, B.; Banjara, M.; Kalra, A. Flood Susceptibility Analysis with Integrated Geographic Information System and Analytical Hierarchy Process: A Multi-Criteria Framework for Risk Assessment and Mitigation. Water 2025, 17, 937. https://doi.org/10.3390/w17070937
Shrestha S, Dahal D, Poudel B, Banjara M, Kalra A. Flood Susceptibility Analysis with Integrated Geographic Information System and Analytical Hierarchy Process: A Multi-Criteria Framework for Risk Assessment and Mitigation. Water. 2025; 17(7):937. https://doi.org/10.3390/w17070937
Chicago/Turabian StyleShrestha, Sujan, Dewasis Dahal, Bishal Poudel, Mandip Banjara, and Ajay Kalra. 2025. "Flood Susceptibility Analysis with Integrated Geographic Information System and Analytical Hierarchy Process: A Multi-Criteria Framework for Risk Assessment and Mitigation" Water 17, no. 7: 937. https://doi.org/10.3390/w17070937
APA StyleShrestha, S., Dahal, D., Poudel, B., Banjara, M., & Kalra, A. (2025). Flood Susceptibility Analysis with Integrated Geographic Information System and Analytical Hierarchy Process: A Multi-Criteria Framework for Risk Assessment and Mitigation. Water, 17(7), 937. https://doi.org/10.3390/w17070937