Abstract
Drought is a major meteorological disaster that affects the growth of spring maize in Inner Mongolia. Understanding the spatiotemporal characteristics of drought is crucial for maintaining crop production. This study categorized Inner Mongolia into five climatic regions based on geography and climate characteristics: hyper-arid, arid, semi-arid, dry and semi-humid, and moist and semi-humid, reflecting Regions I to V, respectively. Based on data collected from 107 meteorological stations, the standardized precipitation evapotranspiration index (SPEI) was used to assess the characteristics of drought occurrence in different climatic regions during the spring maize growing season over the past 60 years, as well as the impact of drought on yield. SPEI decreased across all regions during growth periods, with mid-growth stages showing the smallest decline and a slight slowdown in drought severity. Spatially, 15 stations showed reduced drought during the early growth stage, which increased to 20 stations during the mid-growth stage. The overall drought trend of intensification was obtained across various climate regions, with Region I showing the most severe drought. The drought frequency during the growth period of spring maize ranged from 20% to 42%, and the drought frequency decreased from light drought, moderate drought, and severe drought to extreme drought. The drought range in each growth stage increased, with localized and regional drought dominating the region. The drought intensity also increased. Precipitation is the main factor affecting spring maize yield, and water replenishment during the early and middle stages of growth is crucial. These findings provide a basis for efficient water resource management in the region.
1. Introduction
Global climate change has become an undeniable fact and is further intensifying over time [1]. Climate change is characterized by significant increases in temperature, large temporal and spatial differences in rainfall, and frequent extreme weather events [2,3]. Affected by various complex weather patterns, China experiences one of the highest frequencies of extreme meteorological disasters [4,5,6]. Inner Mongolia, located on the northern border of China, spans three major regions: Northeast, North, and Northwest China. The entire region mainly comprises arid and semi-arid areas that are climate-fragile and sensitive [7]. Inner Mongolia is an important agricultural and pastoral production area in the country, accounting for 5% of the national grain production [8], with spring maize as its most widely planted high-yield crop. Meteorological disasters adversely affecting agriculture production in the region mainly include drought, floods, low temperatures, and hail, with drought being the predominant factor [9]. Drought directly leads to reduced crop yields and crop failures, having the most significant impact on agriculture in the area. Recently, with the increase in cultivated land area and agricultural water consumption to fight drought and ensure production, the agricultural mining output of groundwater has increased, resulting in a serious decline in groundwater level. Additionally, groundwater funnel areas have formed in some regions [10]. This scarcity of water resources not only affects agricultural irrigation and livestock watering but also potentially triggers conflicts over water use between urban and rural areas. Meteorological droughts are the basis of agricultural, hydrological, and economic droughts, with prolonged meteorological droughts often triggering the others [11]. Therefore, a better understanding of the characteristics of meteorological drought occurrence during the growth period of spring maize in this region is crucial for mitigating drought impacts and improving risk assessments.
The drought index is an important tool for studying the characteristics of drought occurrence. The proper selection of a drought index for monitoring and evaluating drought during the growth period of spring maize is essential for drought resistance and disaster reduction. Researchers have proposed over 50 drought indices to address drought characteristics [12]. The drought index constructed by considering rainfall as a single factor mainly includes the precipitation anomaly percentage (Pa), standardized precipitation index (SPI), and generalized extreme value (GEV). Commonly used two- or three-factor drought indices, including rainfall, potential evapotranspiration, soil moisture content, and temperature, include the comprehensive meteorological drought index (CI), Palmer drought index (PDSI), crop water stress index (CWSI), and standardized precipitation evapotranspiration index (SPEI) [13,14]. The SPI is widely used owing to its advantages of simple calculation and flexible timescale [15]. The PDSI was constructed based on the principle of soil moisture, considering the roles of temperature and precipitation in droughts. However, it has drawbacks, such as unclear starting and ending points of droughts and large calculation errors in potential evapotranspiration [16,17]. The SPEI index absorbs the advantages of the other two indices and has become an ideal and effective evaluation tool for monitoring drought characteristics under global warming conditions. In Inner Mongolia, the SPEI has been widely used to study the evolutionary trends of drought and the spatial–temporal distribution characteristics of drought [18,19]. However, studies involving the relationship between meteorological drought and crop yield are relatively scarce. In addition, Inner Mongolia stretches across a narrow strip of land, and climate types and geographical features significantly contribute to drought.
This paper comprehensively considers the aforementioned factors and divides the entire Inner Mongolia region from west to east into five climate zones: hyper arid climate region (Region I), arid climate region (Region II), semi-arid climate region (Region III), dry and semi humid climate region (Region IV), and moist and semi humid climate region (Region V). Based on daily meteorological data from 107 meteorological stations in Inner Mongolia, drought indicators such as the M-K mutation test, Climate inclination rate, drought frequency, drought station occurrence ratio, and drought intensity were used to analyze the characteristics of drought occurrence in different climate regions and at different growth stages of spring maize in Inner Mongolia from 1961 to 2020. Additionally, typical cities in different climate zones were selected, and the correlation between drought and yield was analyzed using the stepwise regression analysis method. This study breaks through traditional research zoning by evaluating drought characteristics during the spring maize growing period based on climate zoning and multi-dimensional indicators, thus enhancing the precision of regional climate analysis. The findings of this study can provide a basis for agricultural management and efficient water resource utilization in the region.
2. Materials and Methods
2.1. Study Area Overview
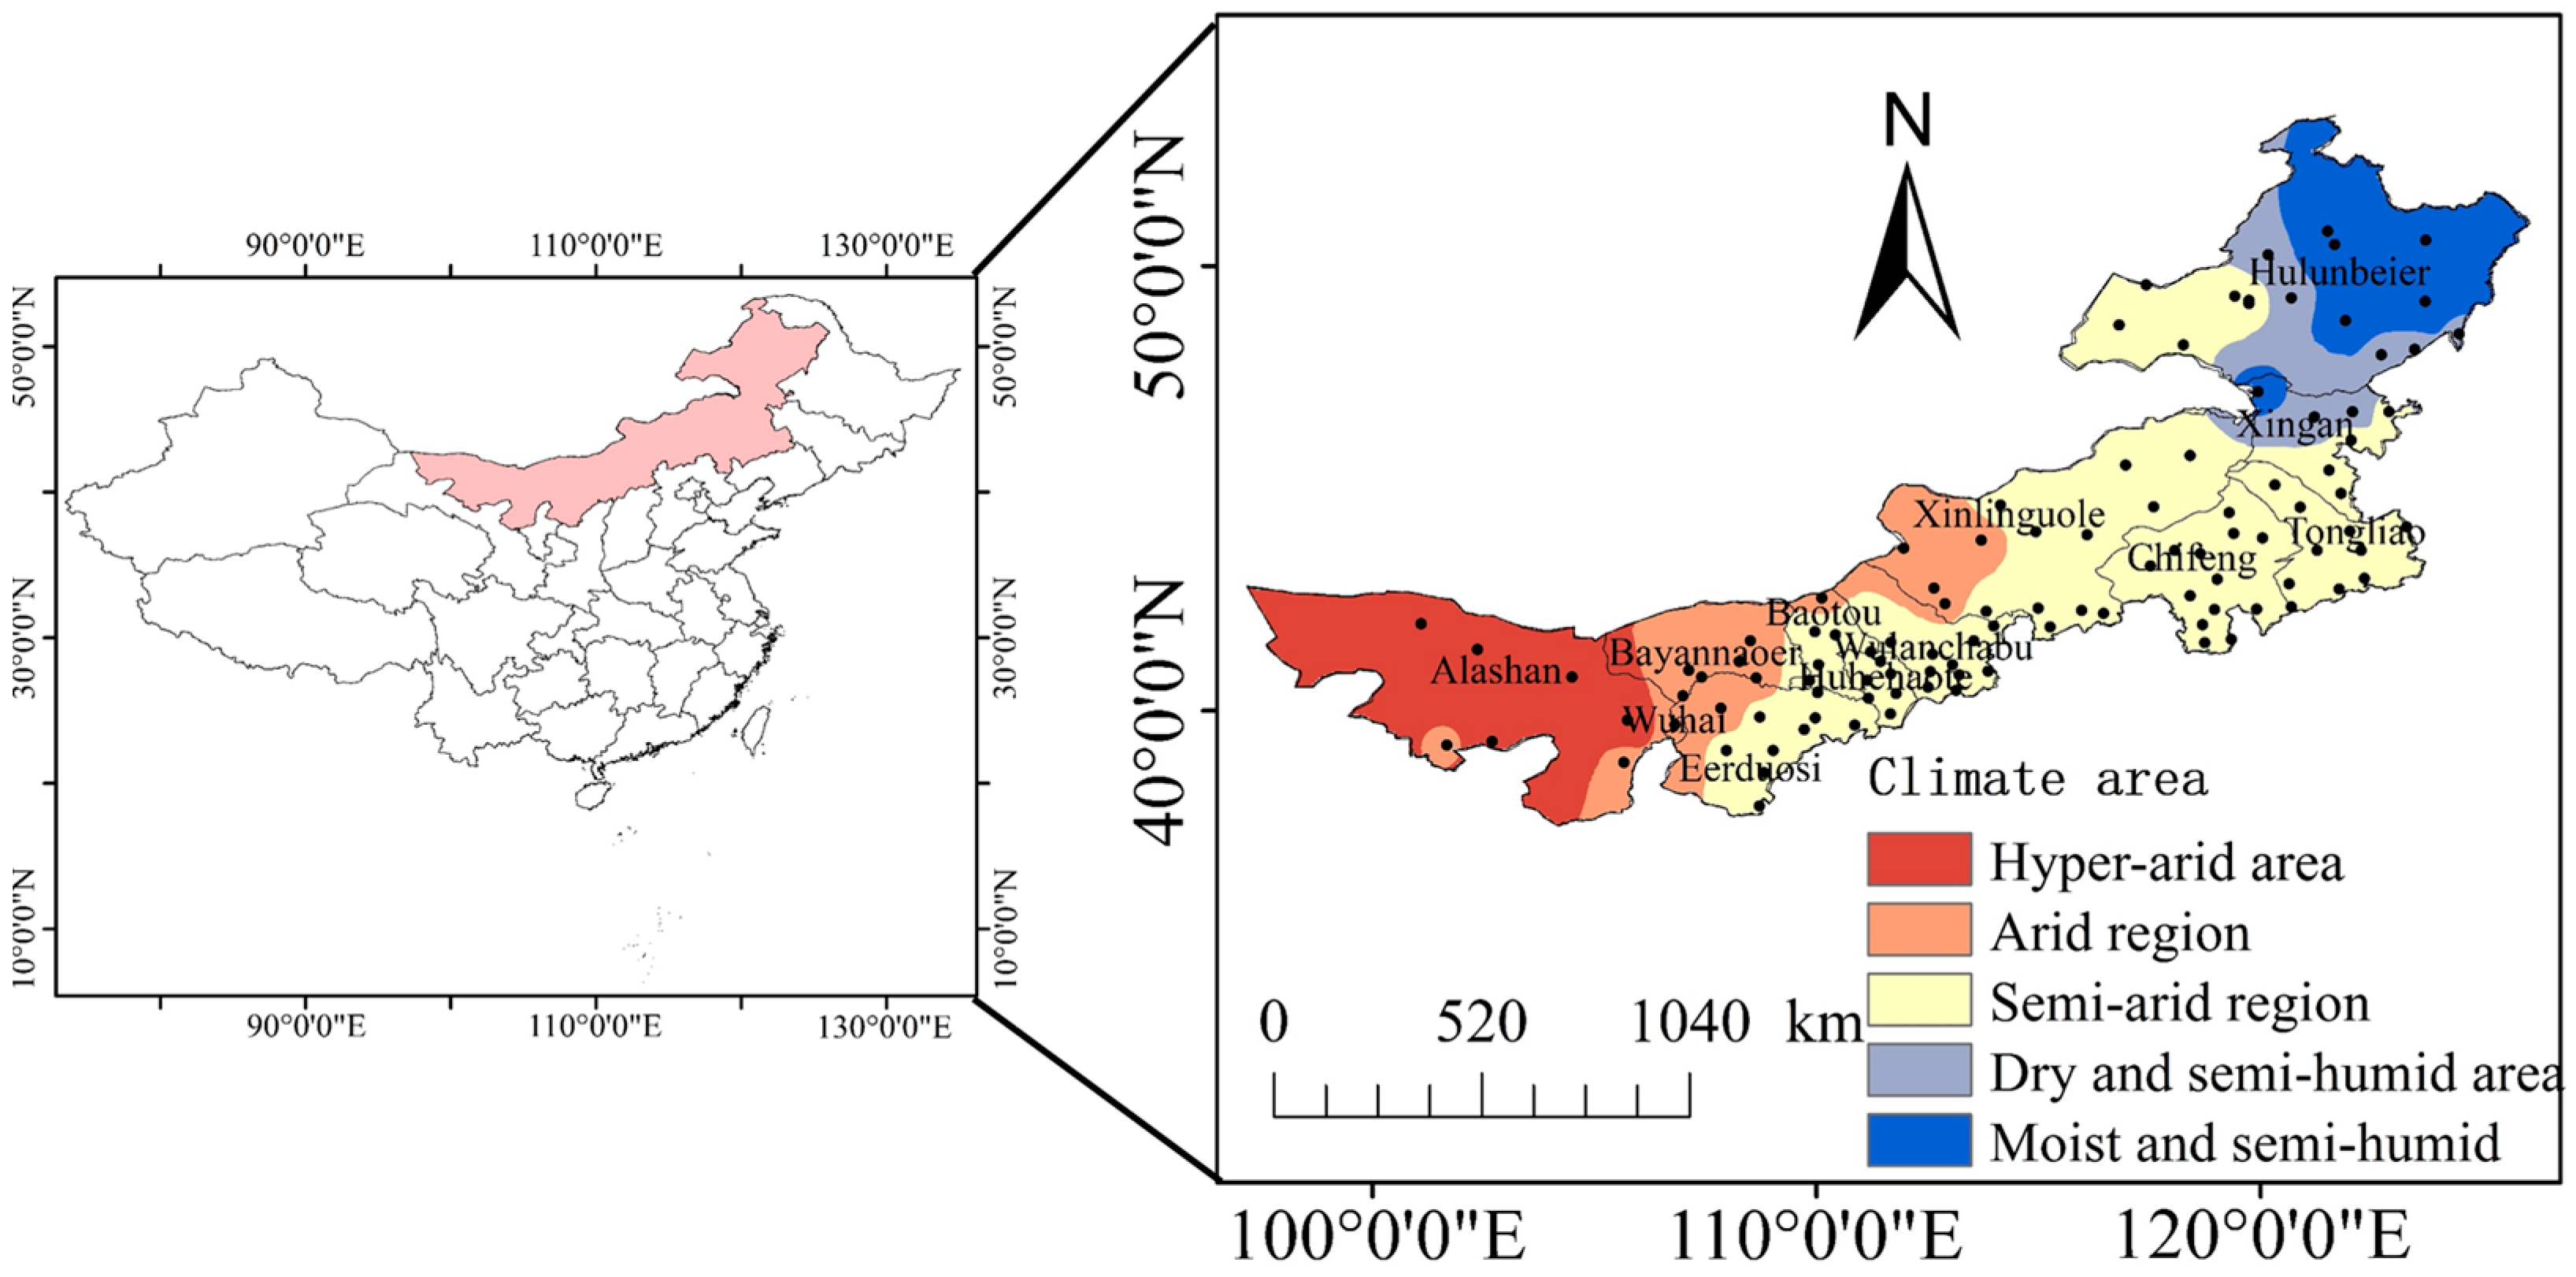
The Inner Mongolia Autonomous Region lies along the northern border of China (37°24′ N~53°23′ N, 97°12′ E~126°04′ E), bordering Russia and Mongolia. It covers an area of 1.183 million km2, accounting for 12.3% of the country’s total land area. It includes nine prefecture-level cities and three leagues. Inner Mongolia is located in the mid-temperate continental region, with an average annual temperature of 3.93 °C. The temperature increases gradually from the Greater Khingan Range towards the southeast and southwest. The annual average precipitation is 323 mm [20]. Vegetation types from northeast to southwest are forest, grassland, and desert, with most in this area located in the arid and semi-arid agricultural pastoral transitional region and a fragile ecological environment, making it highly sensitive to global climatic changes [21]. Spring maize is the main crop in this area. The average temperature during the growth period of spring maize (April to September) ranges between 9.9 and 21.7 °C, with an average of 16.2 °C. The spatial distribution exhibits a decreasing trend from west to east. The rainfall during the growth period of spring maize falls between 20.1 and 452.8 mm, and its spatial distribution increases from west to east [22].
2.2. Data Sources and Processing
2.2.1. Meteorological Data
Meteorological data were obtained from the China Meteorological Data Network (https://data.cma.cn/site/index.html; accessed on 6 Decembe 2022) and the Irrigation Area Water Use Information Monitoring Platform (www.etspatial.com; accessed on 17 April 2022), primarily encompassing 107 meteorological stations located within Inner Mongolia. The meteorological elements included daily rainfall, average temperature, maximum and minimum temperature, wind speed, and sunshine duration data spanning from 1961 to 2020. These daily scale data were processed to obtain monthly scale data. For individual missing test datapoints, the average value of the past 5 years was used as a substitute. The aridity index (ratio of evapotranspiration to precipitation) was used to partition the climate of the Inner Mongolia region [23]. According to the zoning standards, Inner Mongolia was categorized into hyper-arid (Region I), arid (Region II), semi-arid (Region III), dry and semi-humid (Region IV), and moist and semi-humid (Region V) climate regions. The hyper-arid climate region is mainly in the western part of Inner Mongolia; the arid climate region is mainly in the central and western parts of Inner Mongolia; the semi-arid climate region is mainly in the central and eastern parts of Inner Mongolia; the dry and semi-humid climate region is mainly in the hilly areas of northeastern Inner Mongolia; and the moist and semi-humid climate region is mainly in the northeastern part of Inner Mongolia. The spring maize yield data were mainly obtained from local statistical yearbooks. The study area is shown in Figure 1.

Figure 1.
Distribution of study areas and meteorological stations.
2.2.2. Standardized Precipitation Evapotranspiration Index (SPEI)
The SPEI incorporates the combined effects of rainfall and evapotranspiration with flexible time scales. This drought index is based on the principles of water balance [24]. It calculates water deficit (Di) by subtracting potential evapotranspiration (PETi) from precipitation (Pi) during different growth periods of spring corn, which indicates the loss and increase in water and thus represents the degree of meteorological drought. The probability distribution function of log-logistics was used to fit the water surplus and deficit series, providing a standardized measure of drought conditions at different time scales. The specific calculation process is as follows.
The first step is to calculate the climate water balance, which is the difference between monthly rainfall and evapotranspiration:
where Pi is precipitation and PETi is potential evapotranspiration, calculated using the following formula:
where PETi represents the potential evaporation in the i-th month, K is the correction factor calculated based on latitude, I is the heat constant, and m is a constant. The specific parameter calculation is as follows:
where j represents the month.
The second step was to establish the water accumulation sequences , at different stages of the growth period of spring maize using the following formula:
where is within the range of k months; the sum of the water deficit in the k-1 month before the j-th month of the i-th year and the current month.
In the third step, to standardize the moisture profit and loss sequence , a three-parameter log-logistic probability density function was used to fit it:
where f(x) is the probability density function; α is the scale parameter; β is the shape parameter; and γ is the origin parameter. It can be obtained by using the L-moment method. The formula for calculating the cumulative probability at a given timescale is as follows:
The fourth step was to normalize the cumulative probability density F(x) and obtain the SPEI value of the water profit and loss sequences on the cumulative scale. When the cumulative probability p is ≤0.5, the calculation formula is as follows:
where C0 = 2.515517; C1 = 0.802853; C2 = 0.010328; d1 = 1.432788; d2 = 0.189269; d3 = 0.001308.
When p is >0.5, the calculation formula is as follows:
The SPEI has multiple time scales (such as 1, 3, 6, 12, and 24 months) and standardized regional features [25]. We calculated the SPEI at 3-month and 6-month scales for 107 stations in Inner Mongolia. SPEI3 describes the drought changes during the growth period of spring maize, with the initial growth period mainly corresponding to March to May, represented by SPEI on a 3-month scale in May (May-SPEI-3). The mid-growth period mainly corresponds to May to July, represented by SPEI on a 3-month scale in July (July-SPEI-3), and the late growth period mainly corresponds to July to September, represented by SPEI on a 3-month scale in September (September-SPEI-3). SPEI6 describes drought variation patterns throughout the spring maize growth period. The entire reproductive period mainly corresponded to April to September, represented by the SPEI on a 6-month scale in September (September-SPEI-6). The specific classifications of the drought levels are listed in Table 1.

Table 1.
Drought classification of standardized precipitation evapotranspiration index (SPEI) in Inner Mongolia.
2.2.3. Frequency of Drought Occurrence
To record the number of occurrences of different drought severity levels annually during the spring maize growing stage, we calculated the frequency of these drought levels throughout the crop growth period. The drought frequency (Pi) reflects the frequency of disaster occurrence at a meteorological station within statistical years. The calculation method is as follows:
where Pi is the frequency of disaster occurrence; N is the total number of years of statistical data for this site; n is the total number of years in which disasters occurred at the site or the number of years in which disasters occurred at different disaster levels. To record the number of occurrences of different drought severity levels annually during the spring maize growing stage, we calculated the frequency of these drought levels throughout the crop growth period.
2.2.4. Scope of Drought Occurrence
The drought station occurrence ratio (Pj) reflects the magnitude of the impact range of drought disasters in a given region. It is defined as the ratio of the number of stations experiencing drought to the total number of stations in the region [26]. The formula is as follows:
where m represents the number of stations where drought occurs in the region, M represents the total number of meteorological stations in the region, and Pj represents the drought station occurrence ratio, which indirectly reflects the severity of the drought impact in the region.
The magnitude of the drought was categorized into five levels: (1) No significant drought: Pj < 10%; (2) Localized drought: 10% ≤ Pj < 25%; (3) Partial regional drought: 25% ≤ Pj < 33%; (4) Regional drought: 33% ≤ Pj < 50%; (5) Widespread drought: Pj ≥ 50%.
2.2.5. Intensity of Drought Occurrence
Drought intensity can be used to reflect the severity of a drought when it occurs [26]. The calculation formula is as follows:
where m represents the number of stations where droughts occurred in the region. |SPEIi| represents the absolute value of SPEI at the ith station during a drought event, and Sij represents the drought intensity. The classification of drought intensity is presented in Table 2.
Table 2.
Classification of drought intensity grades.
Trends in drought characteristics and the occurrence of abrupt changes were calculated using the climate tendency rate [27] and the Mann-Kendall (M-K) test [28], respectively. We used stepwise regression analysis to investigate the relationship between spring maize yield and meteorological factors.
3. Results
3.1. Characteristics of Drought Occurrence During the Growth Period of Spring Maize
Temporal Variation Characteristics of SPEI During the Growth Period of Spring Maize
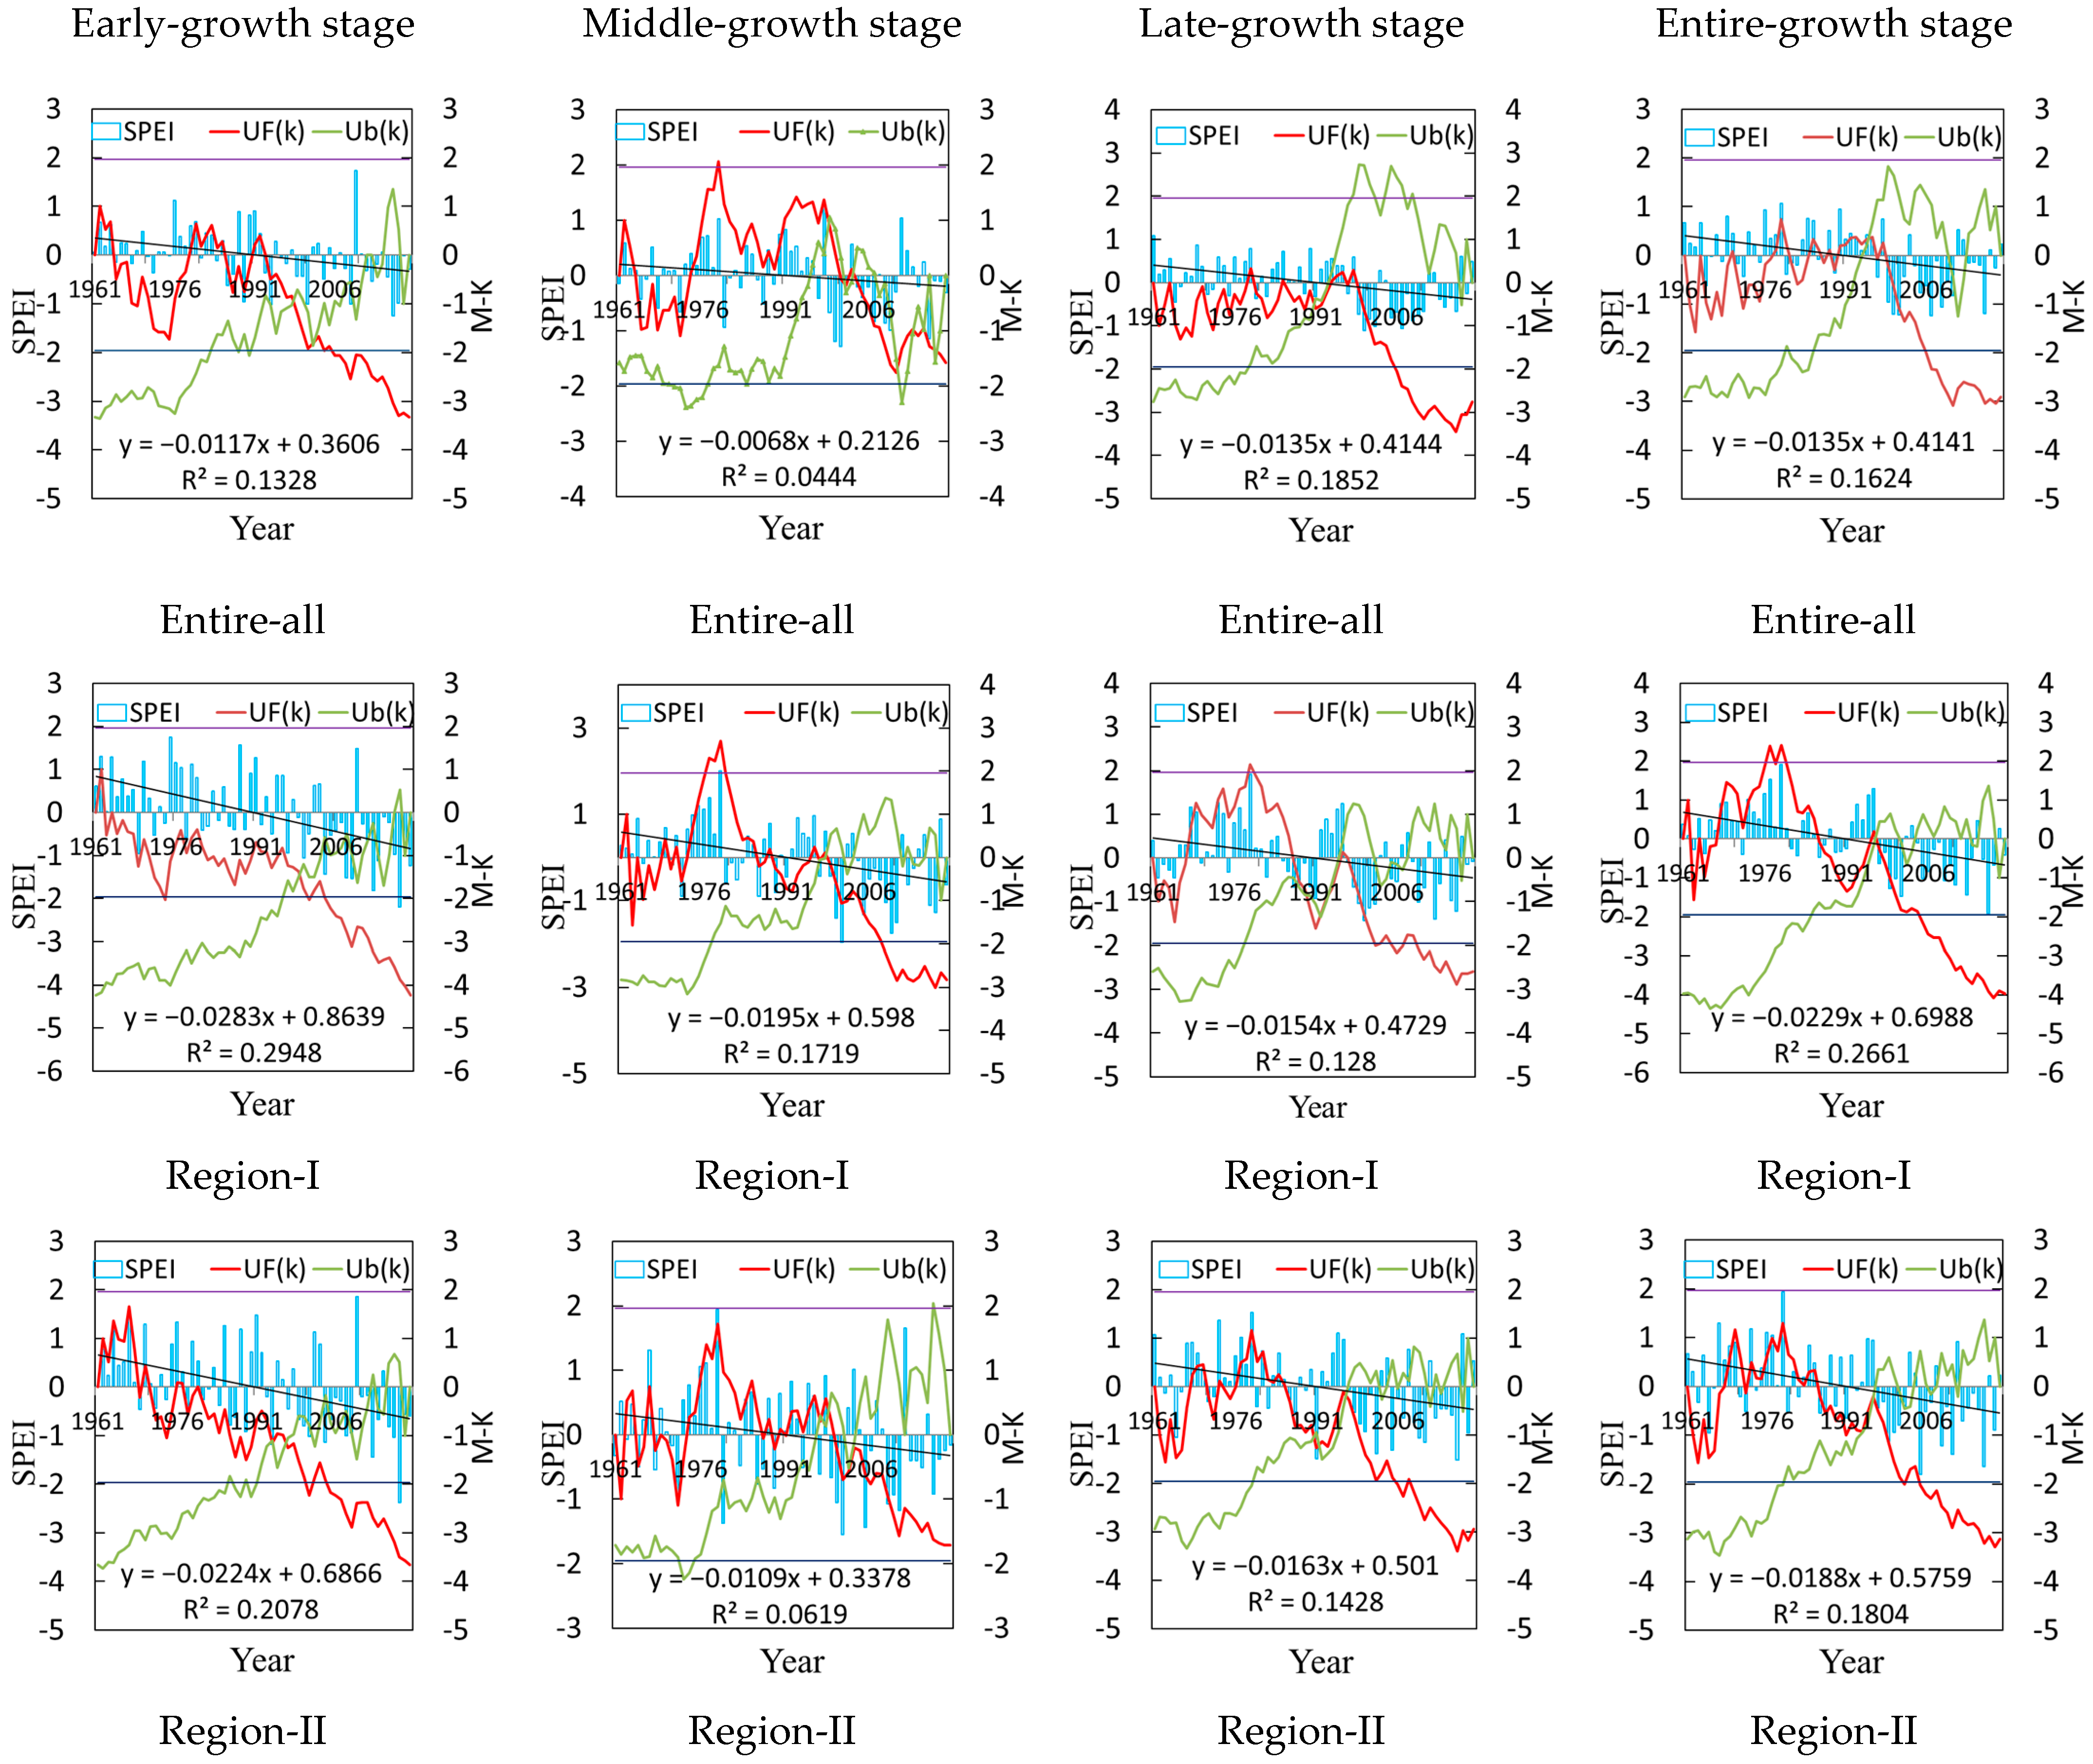
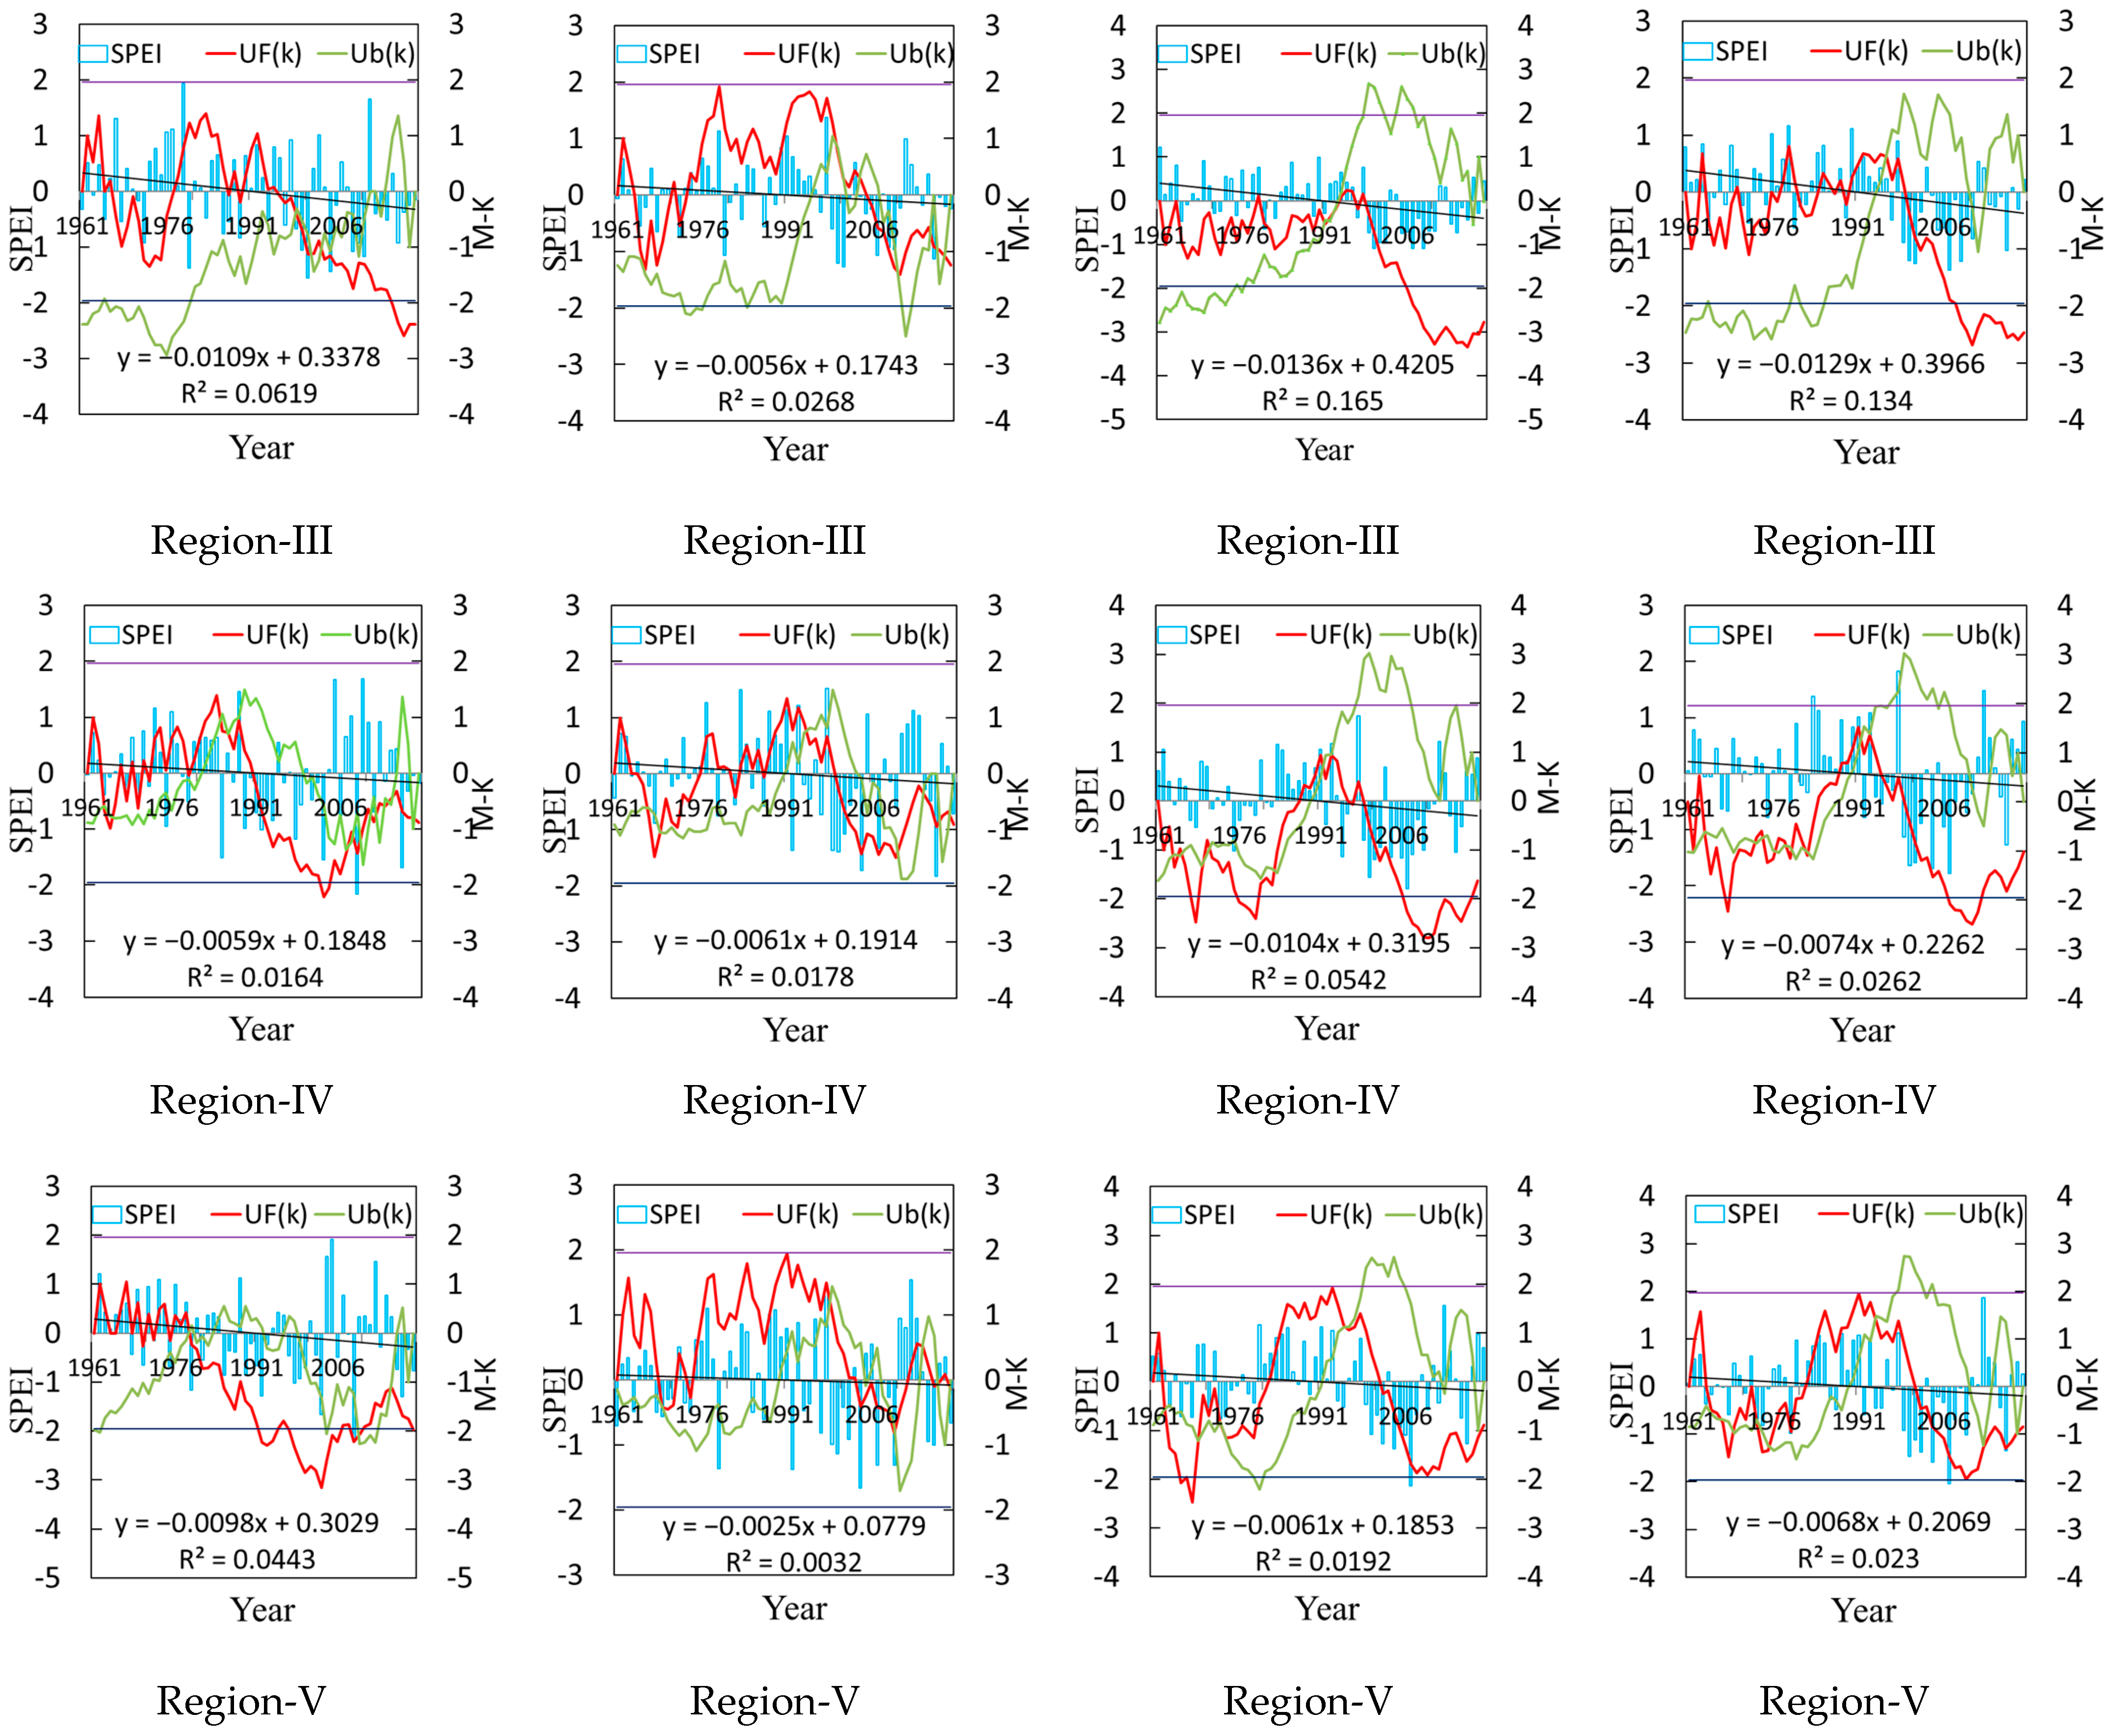
The interannual variations in SPEI across various regions in Inner Mongolia from 1961 to 2020 are shown in Figure 2. During the initial growth stage, the SPEI values across the entire region and in different climatic regions decreased, indicating a drying tendency. Among them, Region I experienced a more severe drought trend, with a climatic tendency rate of −0.28 decade−1. The SPEI values across the entire region ranged from −1.24 to 1.72. The year 2010 was the wettest of the past 60 years in the region, whereas 2017 was the driest. Before the 1990s, the Upward Trend Statistic (UF) curve fluctuated around 0, indicating alternating increases and decreases in the SPEI. After 1996, the UF curve was below zero and exceeded the 0.05 significance level in 2005, suggesting a significant downward trend in the SPEI. In Region I, the SPEI increased only in 1962, whereas it decreased in the remaining years, with a significant decrease occurring after 2004. The SPEI trends in Regions II and V were similar, increasing initially and then decreasing, with significant decreases occurring in 1992 and 2004, respectively. In Region III, the SPEI showed a decreasing trend only in 1972 and 1973, before the 20th century, with an increasing trend in the remaining years. However, after 2005, it exhibited a decreasing trend. Before the 1990s, the SPEI in Region IV exhibited an alternating trend of decline and increase, followed by a notable downward trend in 2003. According to the Mann-Kendall mutation test, the years of transition from wet to dry conditions for the entire region, as well as Regions I, II, III, and V, occurred in 1998, 1997, 2002, and 1997, respectively. In Region IV, there were multiple intersections between the UF and Backward Trend Statistic (UB) curves, indicating extremely unstable changes in drought and flood conditions. During the mid-growth period, the SPEI values for the entire region ranged from −1.55 to 1.94. The wettest year was 1979, whereas the driest year was 2001. The SPEI in the entire region and all climate regions exhibited alternating trends of increasing and decreasing. Notably, the entire region and Region I showed a significant increasing trend only in 1979, whereas the decreasing trends in the other climate regions were insignificant. The mutation years for regions I and II were 1995 and 1997, respectively. In other climate regions, there were multiple intersections between the UF and UB curves, indicating unstable changes in drought and flood conditions. During the late growth period, the SPEI for the entire region ranged from −1.10 to 1.08, with the driest year being 2000 and the wettest year being 1961. Before the mid-1990s, the UF curves for the entire region and Regions III, IV, and V were generally below 0 and then above 0, indicating a downward trend in SPEI first followed by an upward trend. After the mid-1990s, the UF curves were below 0 and exceeded the 0.05 significance level after 2005, indicating a significant downward trend in the SPEI. For Regions I and II, the SPEI increased during the 1970s and 1980s and then shifted to a downward trend in the 1990s. According to the Mann-Kendall mutation test, the years of transition from wet to dry conditions for regions I, II, III, and IV were 1988, 1991, 1991, and 1993, respectively. For Region V, the UF and UB curves had multiple intersections before the 1990s, indicating unstable drought and flood patterns. During the entire growth period, the SPEI for the entire region ranged from −1.23 to 1.07, showing an overall drying trend. The wettest year was 1979, whereas the driest year was 2007. The SPEI trends for the other climate regions were consistent with those of the entire region, showing an overall downward trend. Specifically, the years with an increasing trend in SPEI for the entire region and Region II were concentrated between 1968 and 2000, whereas for Region I, the years with an increasing trend were mainly concentrated between 1967 and 1985. For Regions IV and V, the years with an increasing trend in the SPEI were mainly concentrated in the 1980s and 1990s. The mutation years for the entire region, Regions I, II, III, and IV, were mainly concentrated around 1994. For Region V, the UF and UB curves had multiple intersections before the 1990s, indicating unstable changes in drought and flood conditions.
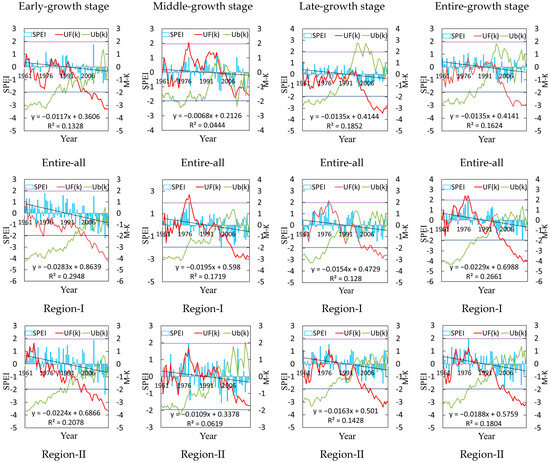
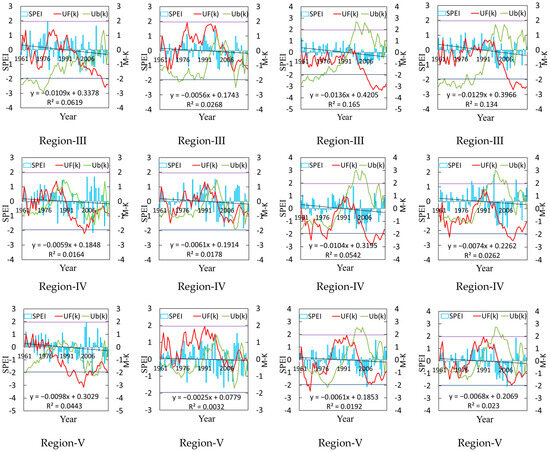
Figure 2.
Interannual variation in SPEI and Mann-Kendall mutation test for various regions in Inner Mongolia during crop growth seasons from 1961 to 2020. Note: UF = Upward Trend Statistic; UB = Backward Trend Statistic. Note: The dark blue parallel lines and purple parallel lines denote the 0.05 significance level, with the black diagonal lines representing trend lines.
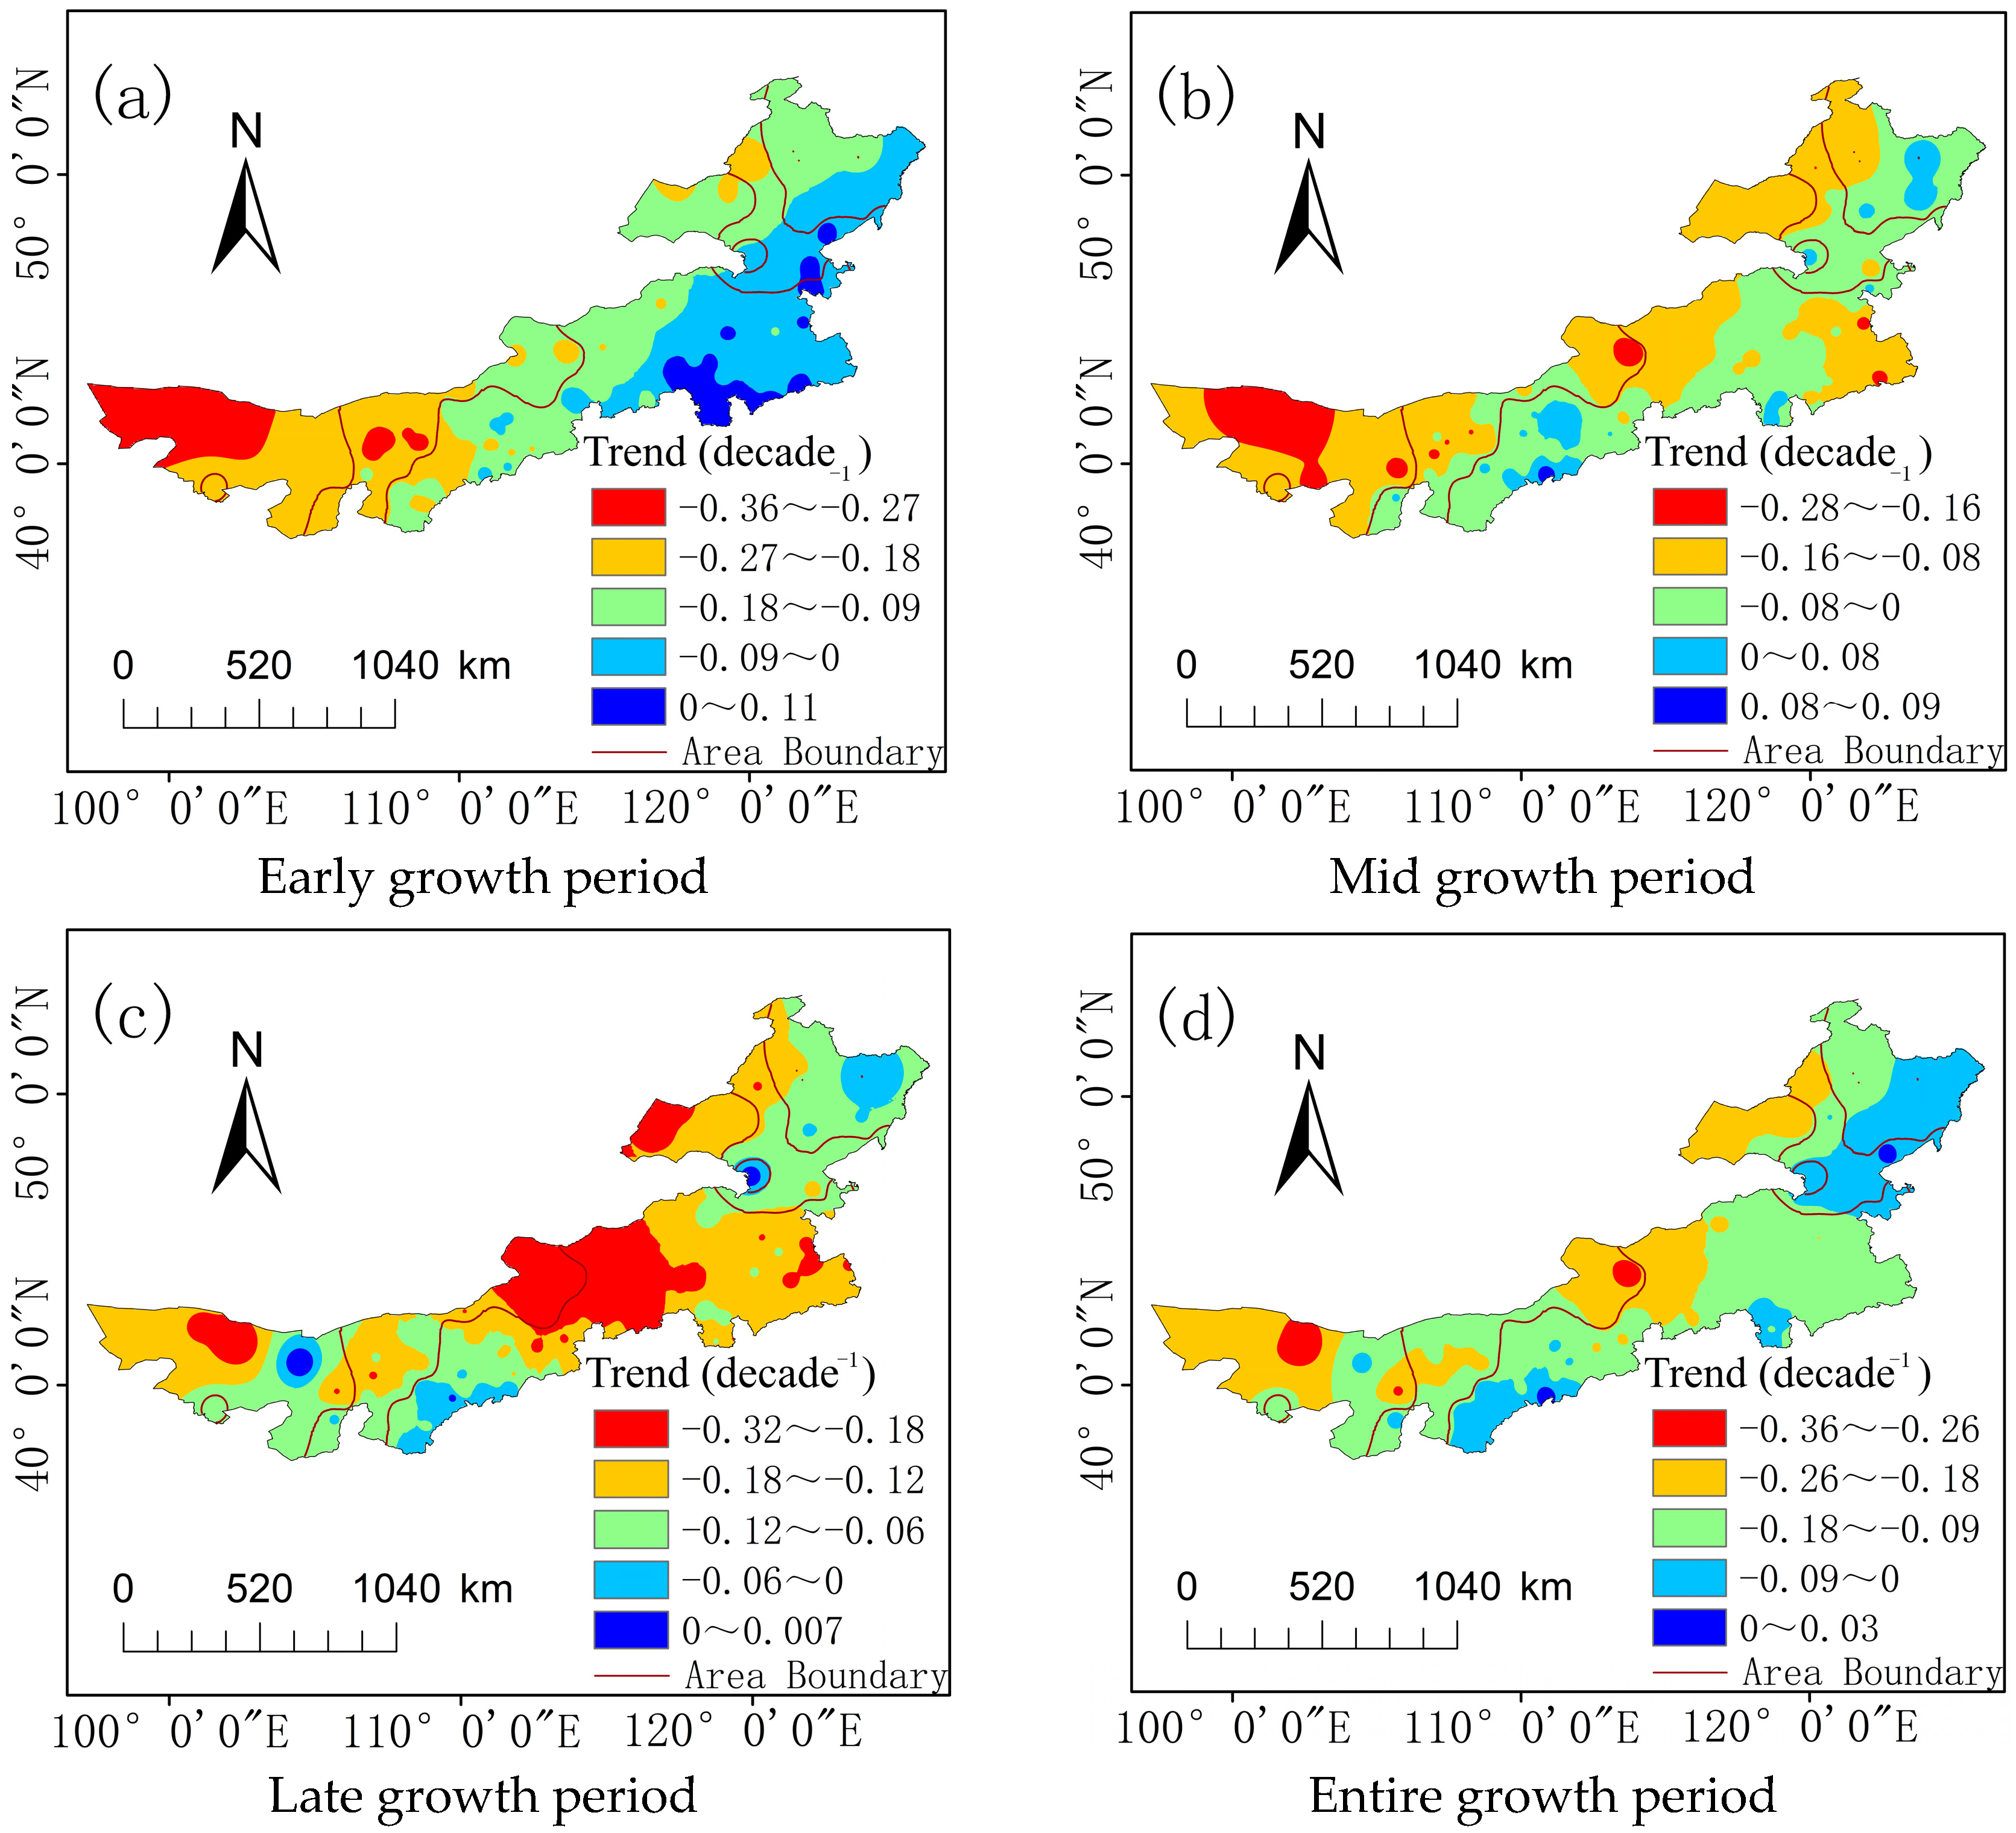
From the perspective of spatial distribution, the drought evolution in the spring maize areas of Inner Mongolia over the past 60 years can be depicted more intuitively. The spatial distribution of the SPEI climatic tendency rates during different growth stages of spring maize is shown in Figure 3. Notable differences in SPEI variations were observed among the different regions during the early, middle, and late growth stages, as well as the entire growth period of spring maize. The areas where drought intensification was more significant during the early growth stage were mainly located in Regions I and II in Western Inner Mongolia, with an average SPEI climatic tendency rate of −0.23 decade−1. Areas such as Guaizi Lake, Ejina Banner, Dengkou, and Urad Frontier Banner showed rates below −0.3 decade−1. The regions where droughts showed a significant reduction were mainly located in the Chifeng area within Region III, with a climate tendency rate above 0, accounting for 14% of the total number of stations. The regions where the drought trend intensified significantly during the mid-growth period are mainly found in Region I, with an average climate tendency rate of −0.19 decade−1. The stations where the drought trend eased were mainly distributed in Regions III and V, with 20 stations accounting for 18.6% of the total number of stations. During the late growth period, all climatic regions exhibited an increasing drought trend, with only three stations showing an increasing trend in SPEI, whereas the remaining areas showed a worsening drought trend. The regions with significant drought trends were mainly distributed in the Xilin Gol League within Region III. Throughout the entire growth period, all other stations exhibited a worsening drought trend except for Zhungeer Banner in Region III and Zhalantun in Region IV, which showed a drought mitigation trend. The regions with significant intensification were mainly distributed throughout Region I, parts of the Xilin Gol League, and the Hulunbeir League within Region III.
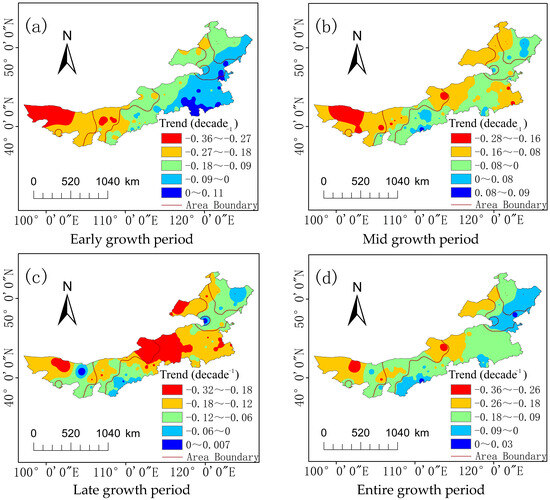
Figure 3.
Spatial distribution of SPEI climate trend during the growth period of spring maize in Inner Mongolia from 1960 to 2020. Note: The area boundaries in the figure represent the divisions between different climatic regions.
3.2. Frequency of Drought Occurrence During the Growth Period of Spring Maize
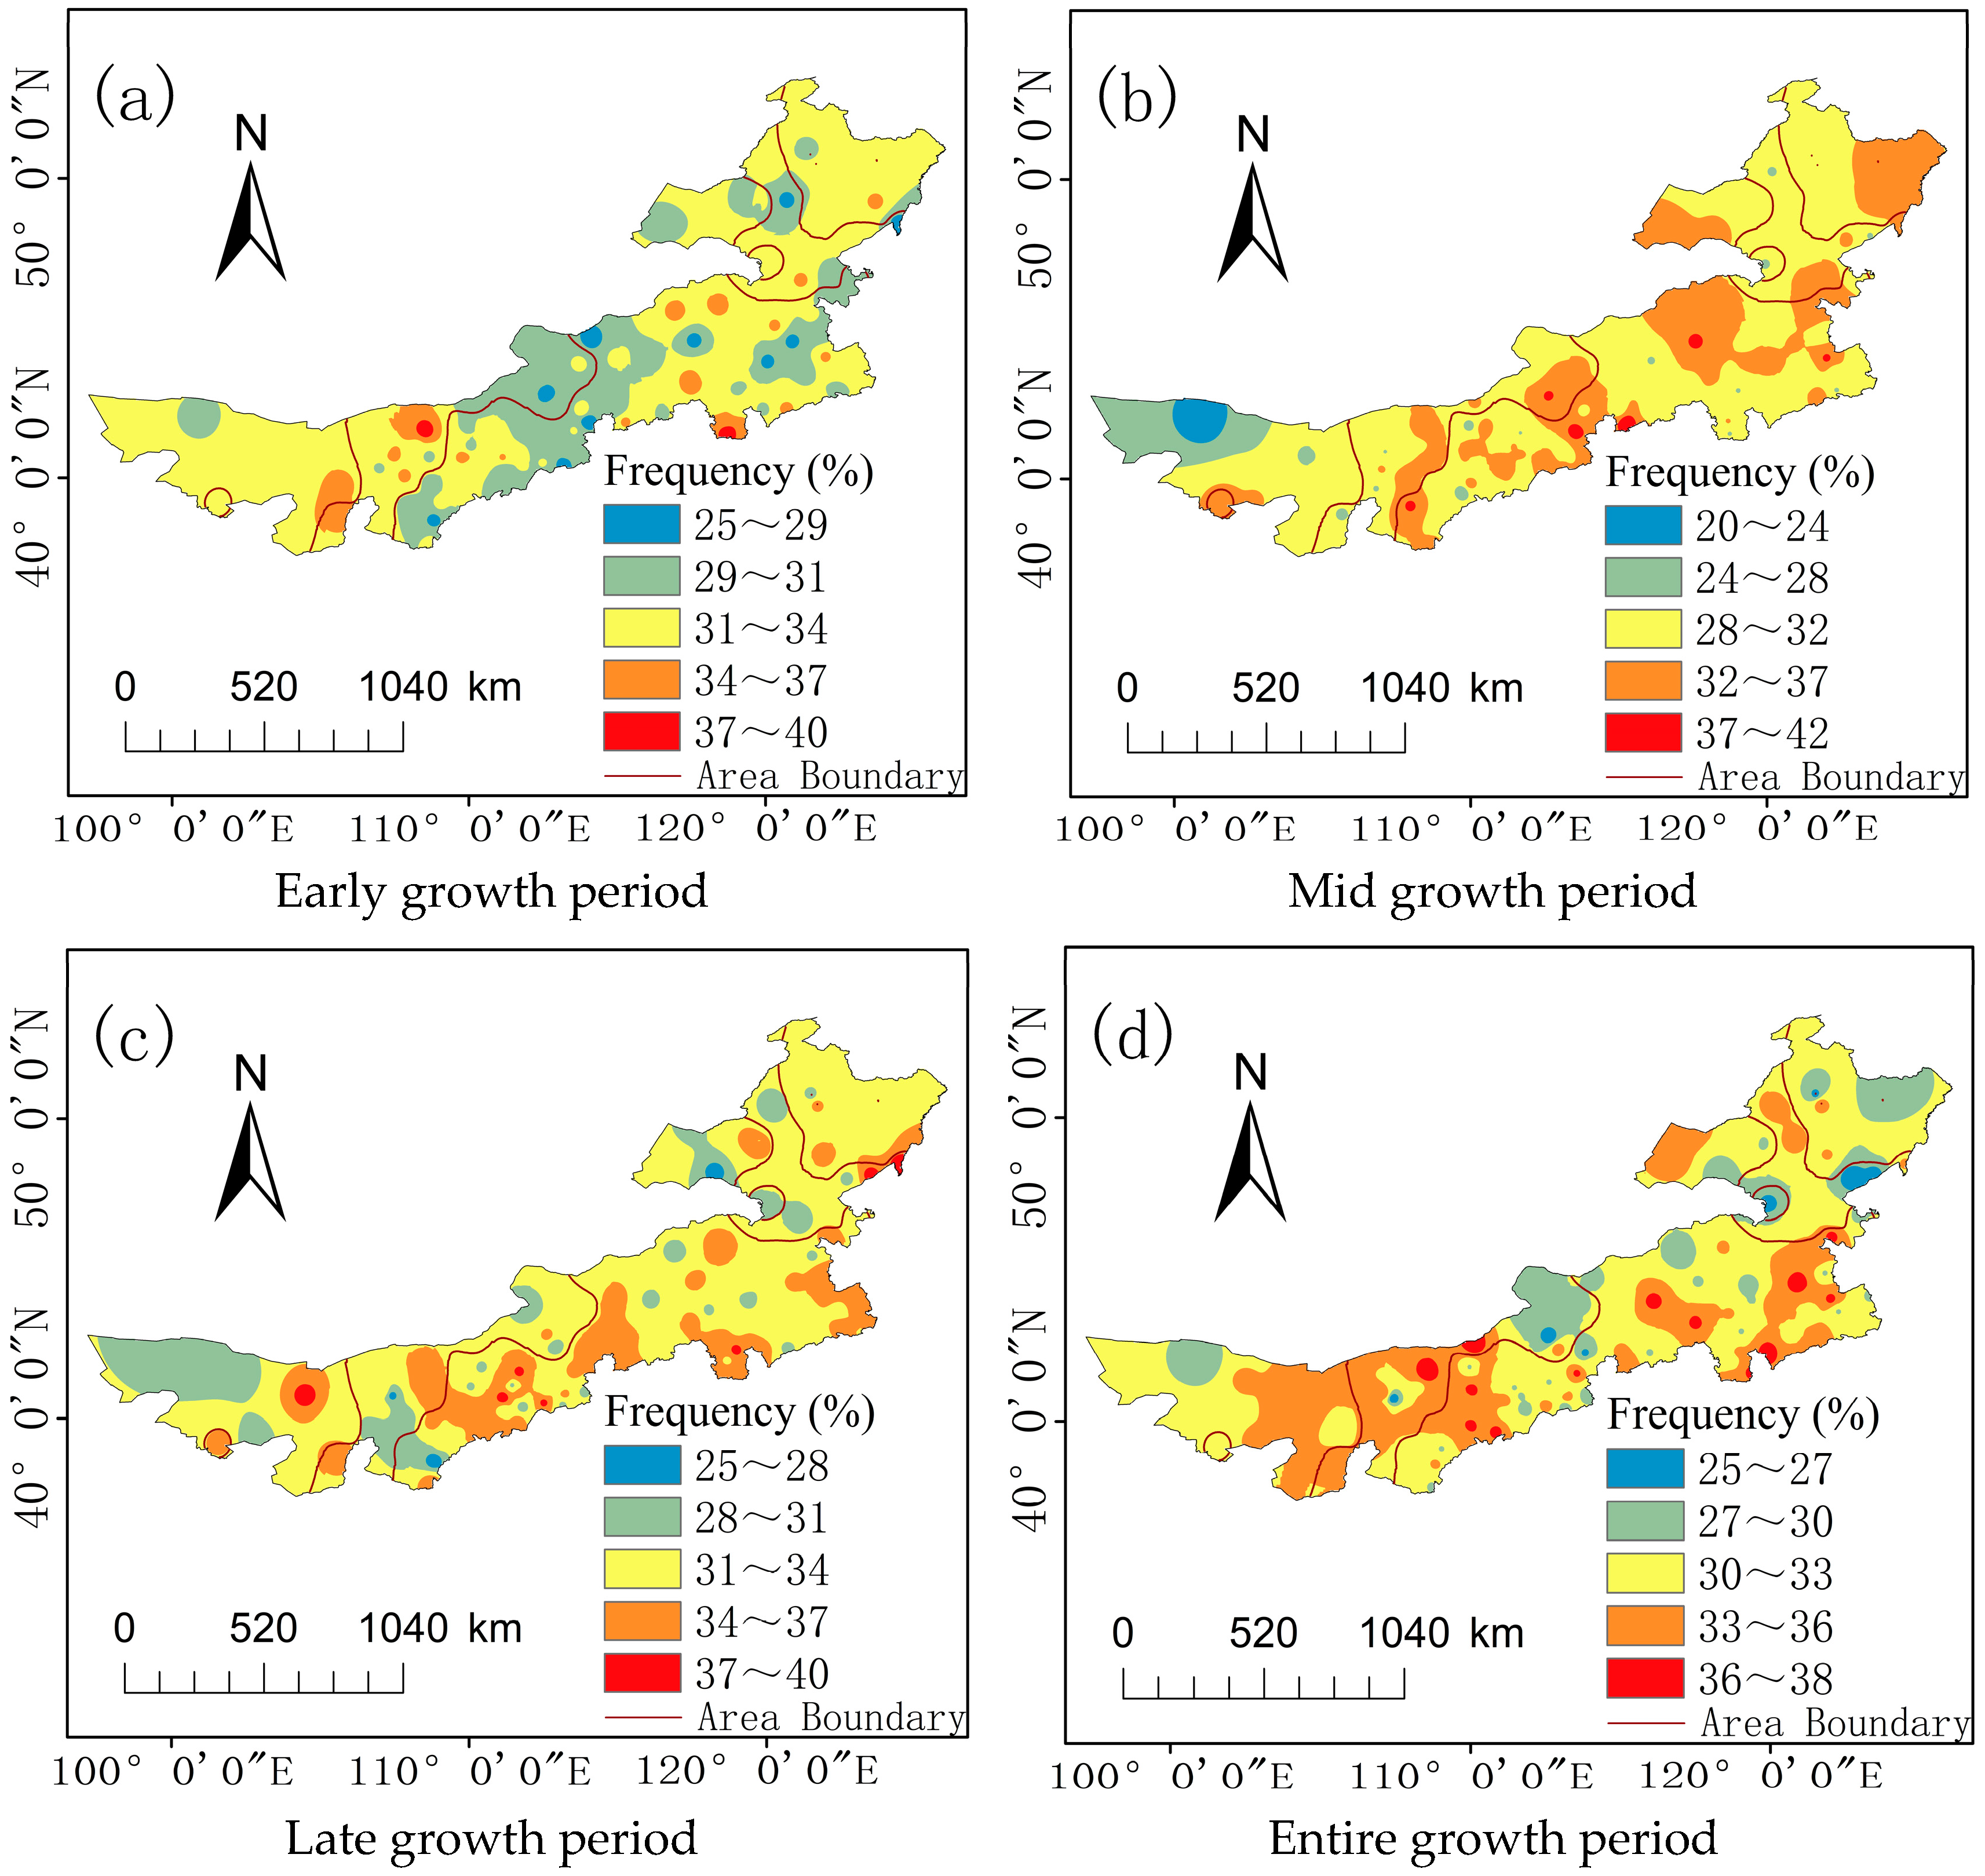
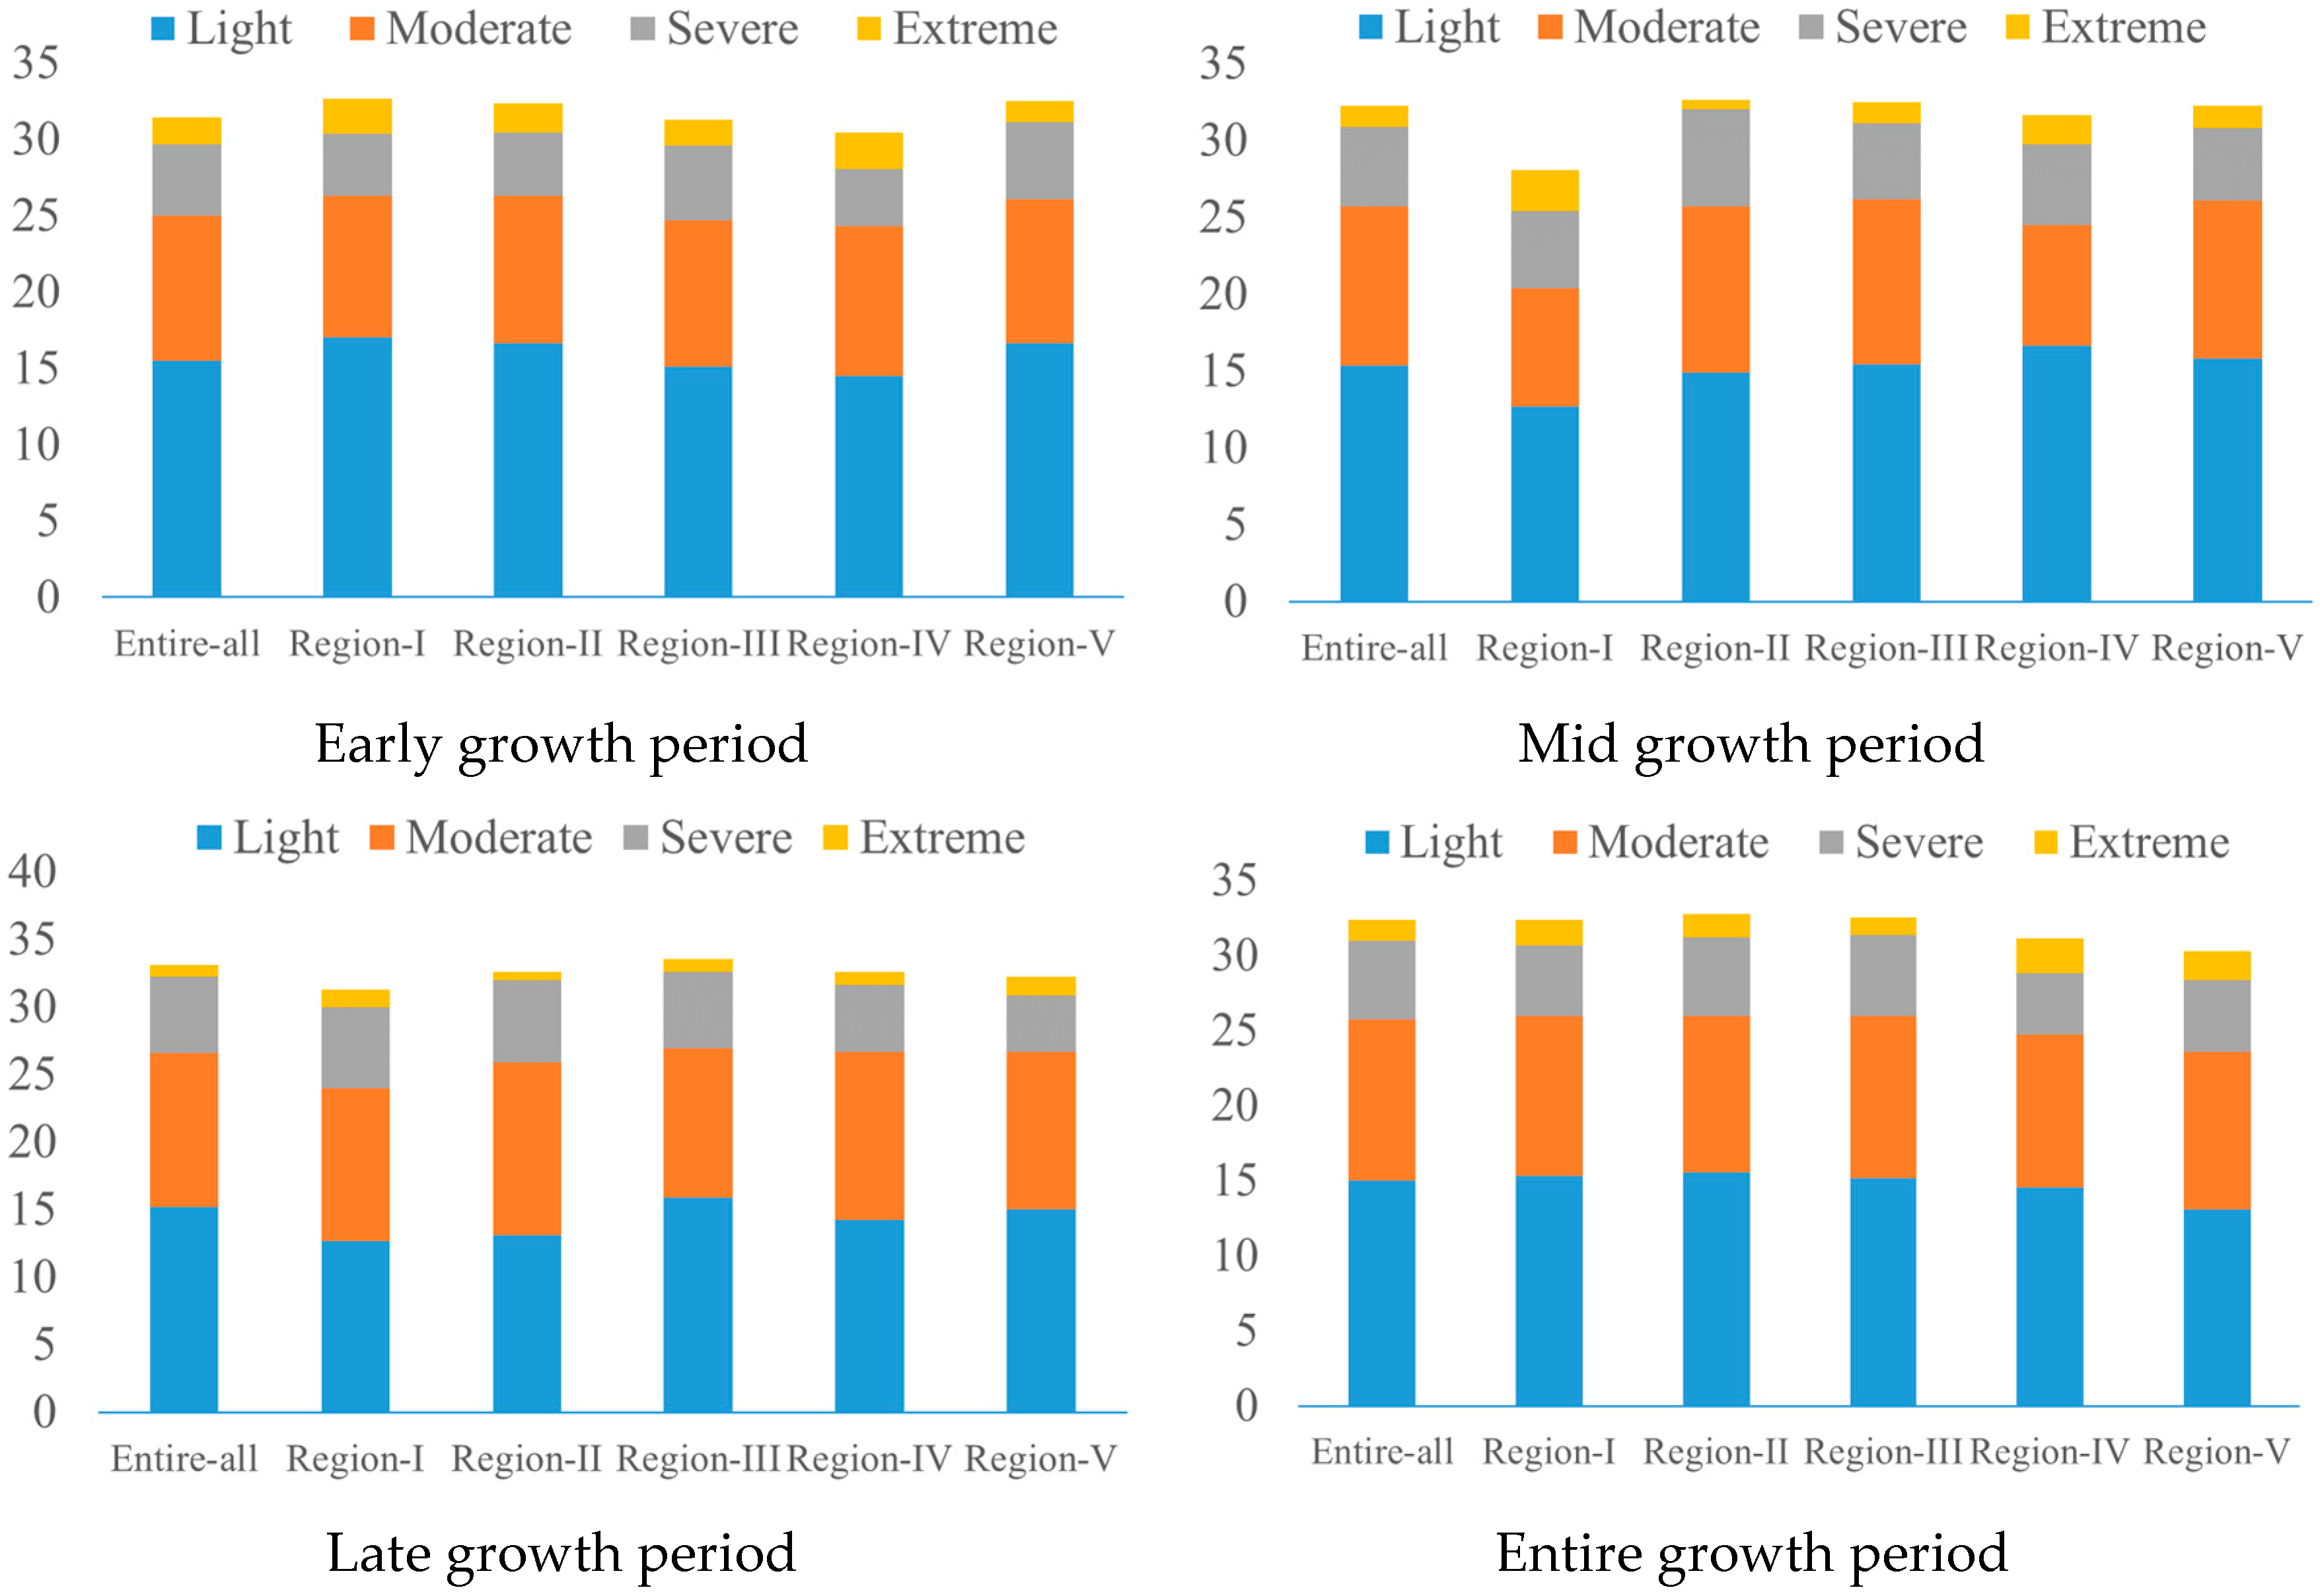
To clarify the characteristics of drought frequency in different climatic regions of Inner Mongolia during the growth period of spring maize, spatial distribution maps for various growth stages were created (Figure 4). A summary of the frequency of drought occurrence at different severity levels in each climatic region during the spring maize growth period is shown in Figure 5. During the initial growth stage, the lowest drought frequency areas were mainly distributed in the Wulanchabu region of Region III, whereas the highest drought frequency areas were Wulate Middle Banner in Region II and Baotou, Chifeng, and Ningcheng in Region III, with values exceeding 36%. Among the various climatic regions, Region I had a relatively high overall drought frequency (32%), whereas Region IV had a relatively low frequency (30.46%). During the mid-growth stage, the areas with higher frequencies of drought occurrence were mainly distributed in Shangdu and Taipusi Banner in Region III. Areas with lower drought frequencies (below 25%) included Ejina Banner in Region I and Ejin Horo Banner in Region III. Among the various climatic regions, Region I had a relatively low overall frequency of drought, whereas Region II had a higher frequency. During the late growth stage, the overall trend of drought frequency was lower in the western region and higher in the central and eastern regions than in other regions. Areas with higher drought frequencies were located in Hohhot in Region III, whereas areas with lower frequencies were found in Xinbarhu Zuoqi and Wushen Banner in Region III and near Linhe in Region II. Among the various climatic regions, Region I had a relatively low overall frequency of drought, whereas Region III had a generally higher frequency. Throughout the entire growth period, the drought occurrence frequency was relatively high in Mandula and Wulate Zhongqi in Region II, as well as in Zhalute Banner and Aohan Banner in Region III, with a frequency of 38%. The frequency is relatively low in places such as the Sonid Right Banner and Linhe in Region II and Zhalantun in Region IV. Among the various climatic regions, the overall drought frequency was relatively high in the entire region, Regions I, II, and III and relatively low in Regions IV and V. In general, during the spring maize growing period in Inner Mongolia, the drought frequency in various climatic regions exhibited characteristics of a higher occurrence of light and moderate droughts, the lowest occurrence of extreme droughts, and a moderate occurrence of severe droughts. Among all the growth stages, the mid-growth stage exhibited the highest drought frequency.
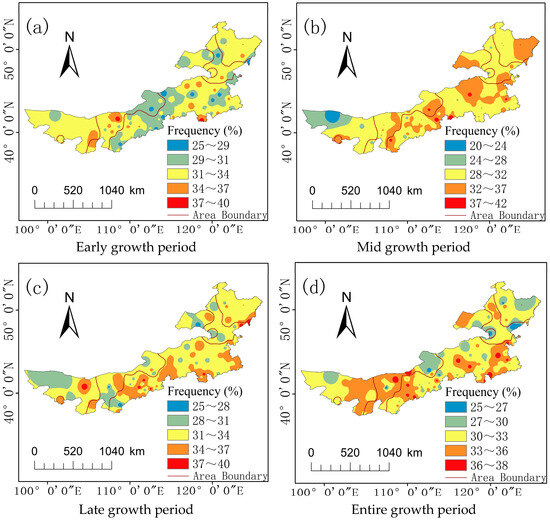
Figure 4.
Frequency of drought occurrence during the growth period of spring maize in Inner Mongolia from 1961 to 2020. Note: The area boundaries in the figure represent the divisions between different climatic regions.
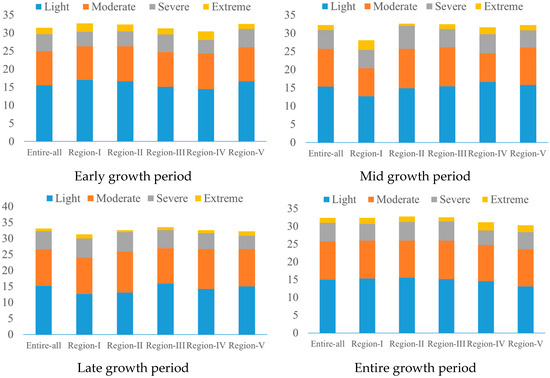
Figure 5.
Frequency of drought occurrence during the growth period of spring maize in various regions of Inner Mongolia from 1961 to 2020.
3.3. Scope of Drought Occurrence
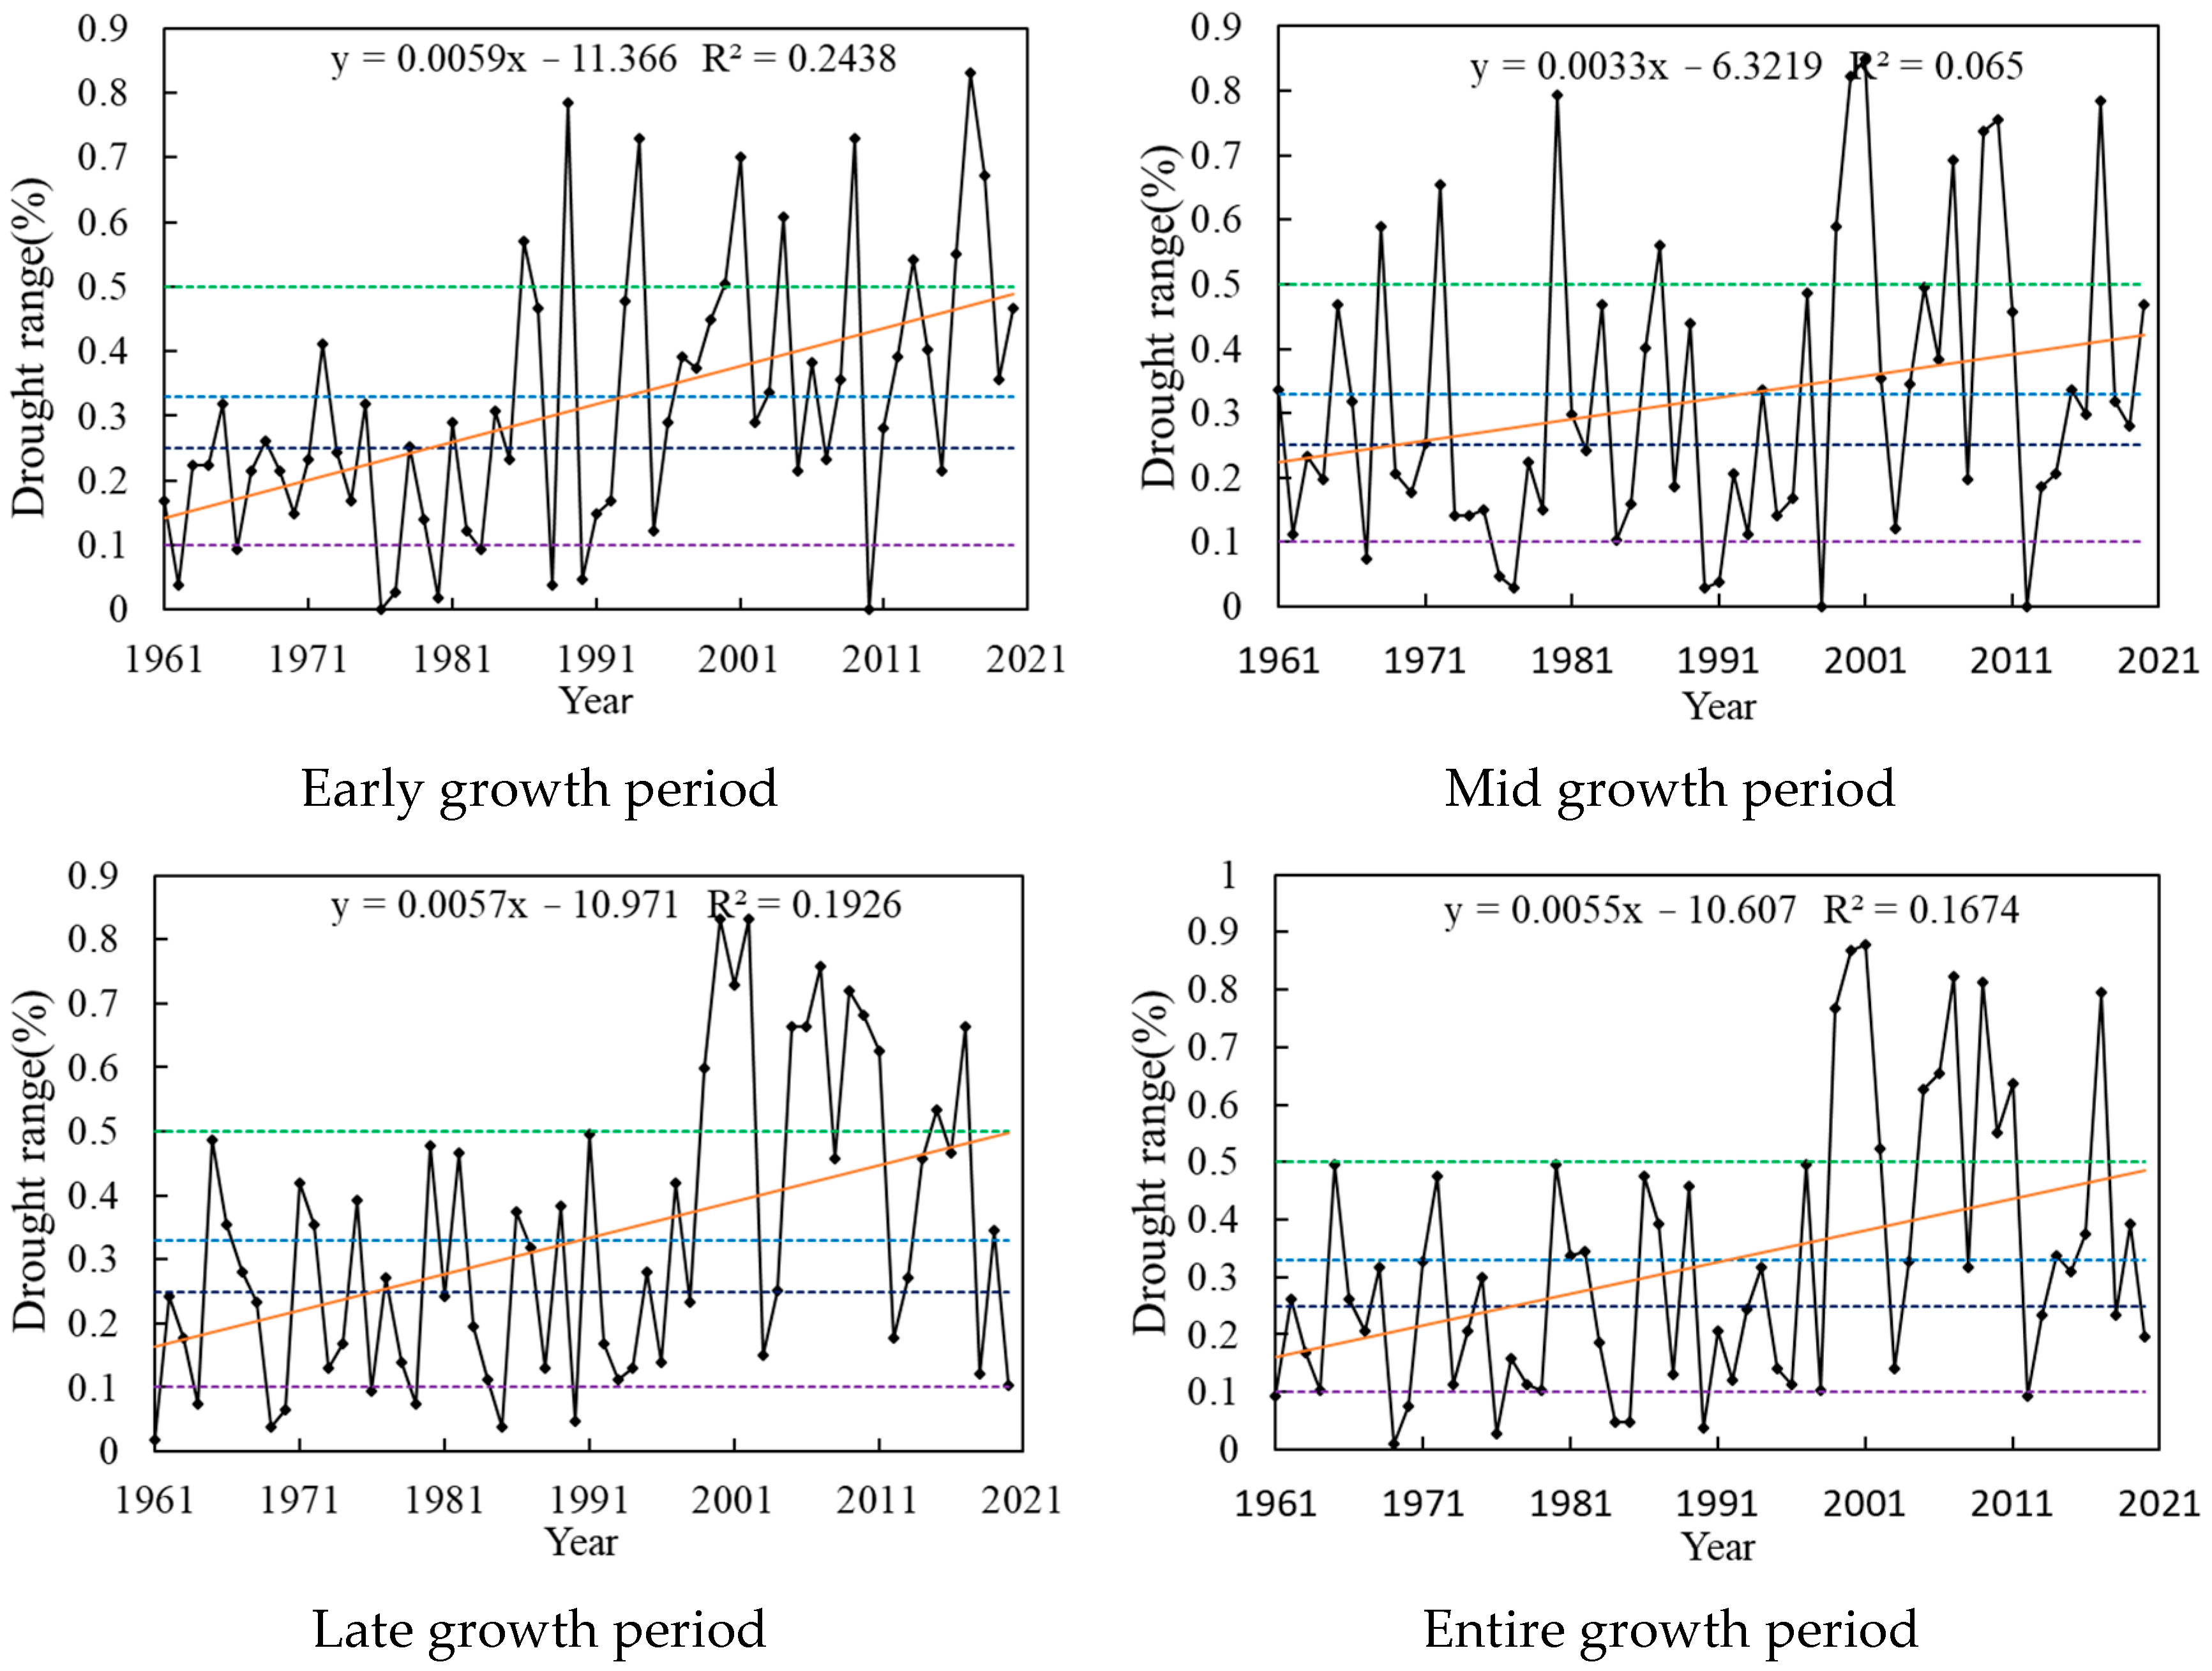
Using the drought station occurrence ratio to represent the scope of disaster occurrence during the growth period of spring maize in the region, a higher station occurrence ratio indicates a larger scope of drought. Figure 6 illustrates the statistical results for the drought scope during different growth periods. The drought scope during each growth period exhibited a significant increasing trend (p < 0.05), with a relatively large increasing trend observed during the initial growth period at a rate of 0.059 decade−1. During the initial growth period, over the past 60 years, there were 9 years that experienced no significant drought. In the remaining years, localized drought was the most frequent, occurring in 18 years and primarily in the 1960s and 1970s. Partial regional drought was relatively infrequent, occurring in 9 years. Regional and widespread drought occurred over 13 and 11 years, respectively, mainly after the 1990s. The largest drought coverage occurred in 2017, affecting 83% of the area. The drought scope during the mid-growth period ranged from 0 to 85%. Localized drought occurred most frequently, affecting 22 years, whereas partial regional drought occurred least frequently, affecting only 6 years. Regional and widespread drought occurred in 14 and 11 years, respectively, mainly in the 2010s.
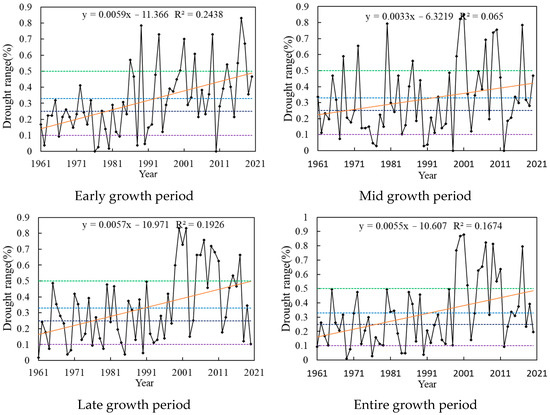
Figure 6.
Changes in the scope of drought during the growth period of spring maize in Inner Mongolia from 1961 to 2020. Note: The green, blue, pink, and black lines indicate the level of drought range.
The years in which widespread drought occurred during the late growth period were mainly concentrated after 1999, with 7 years experiencing widespread drought between 2000 and 2009. Localized droughts primarily occurred before 2000, with 19 years recorded. Partial regional droughts and regional droughts occurred in 6 and 15 years, respectively. Throughout the entire growth period, widespread and partial regional droughts occurred in 11 and 9 years, respectively. Regional and localized droughts occurred in 12 and 20 years, respectively.
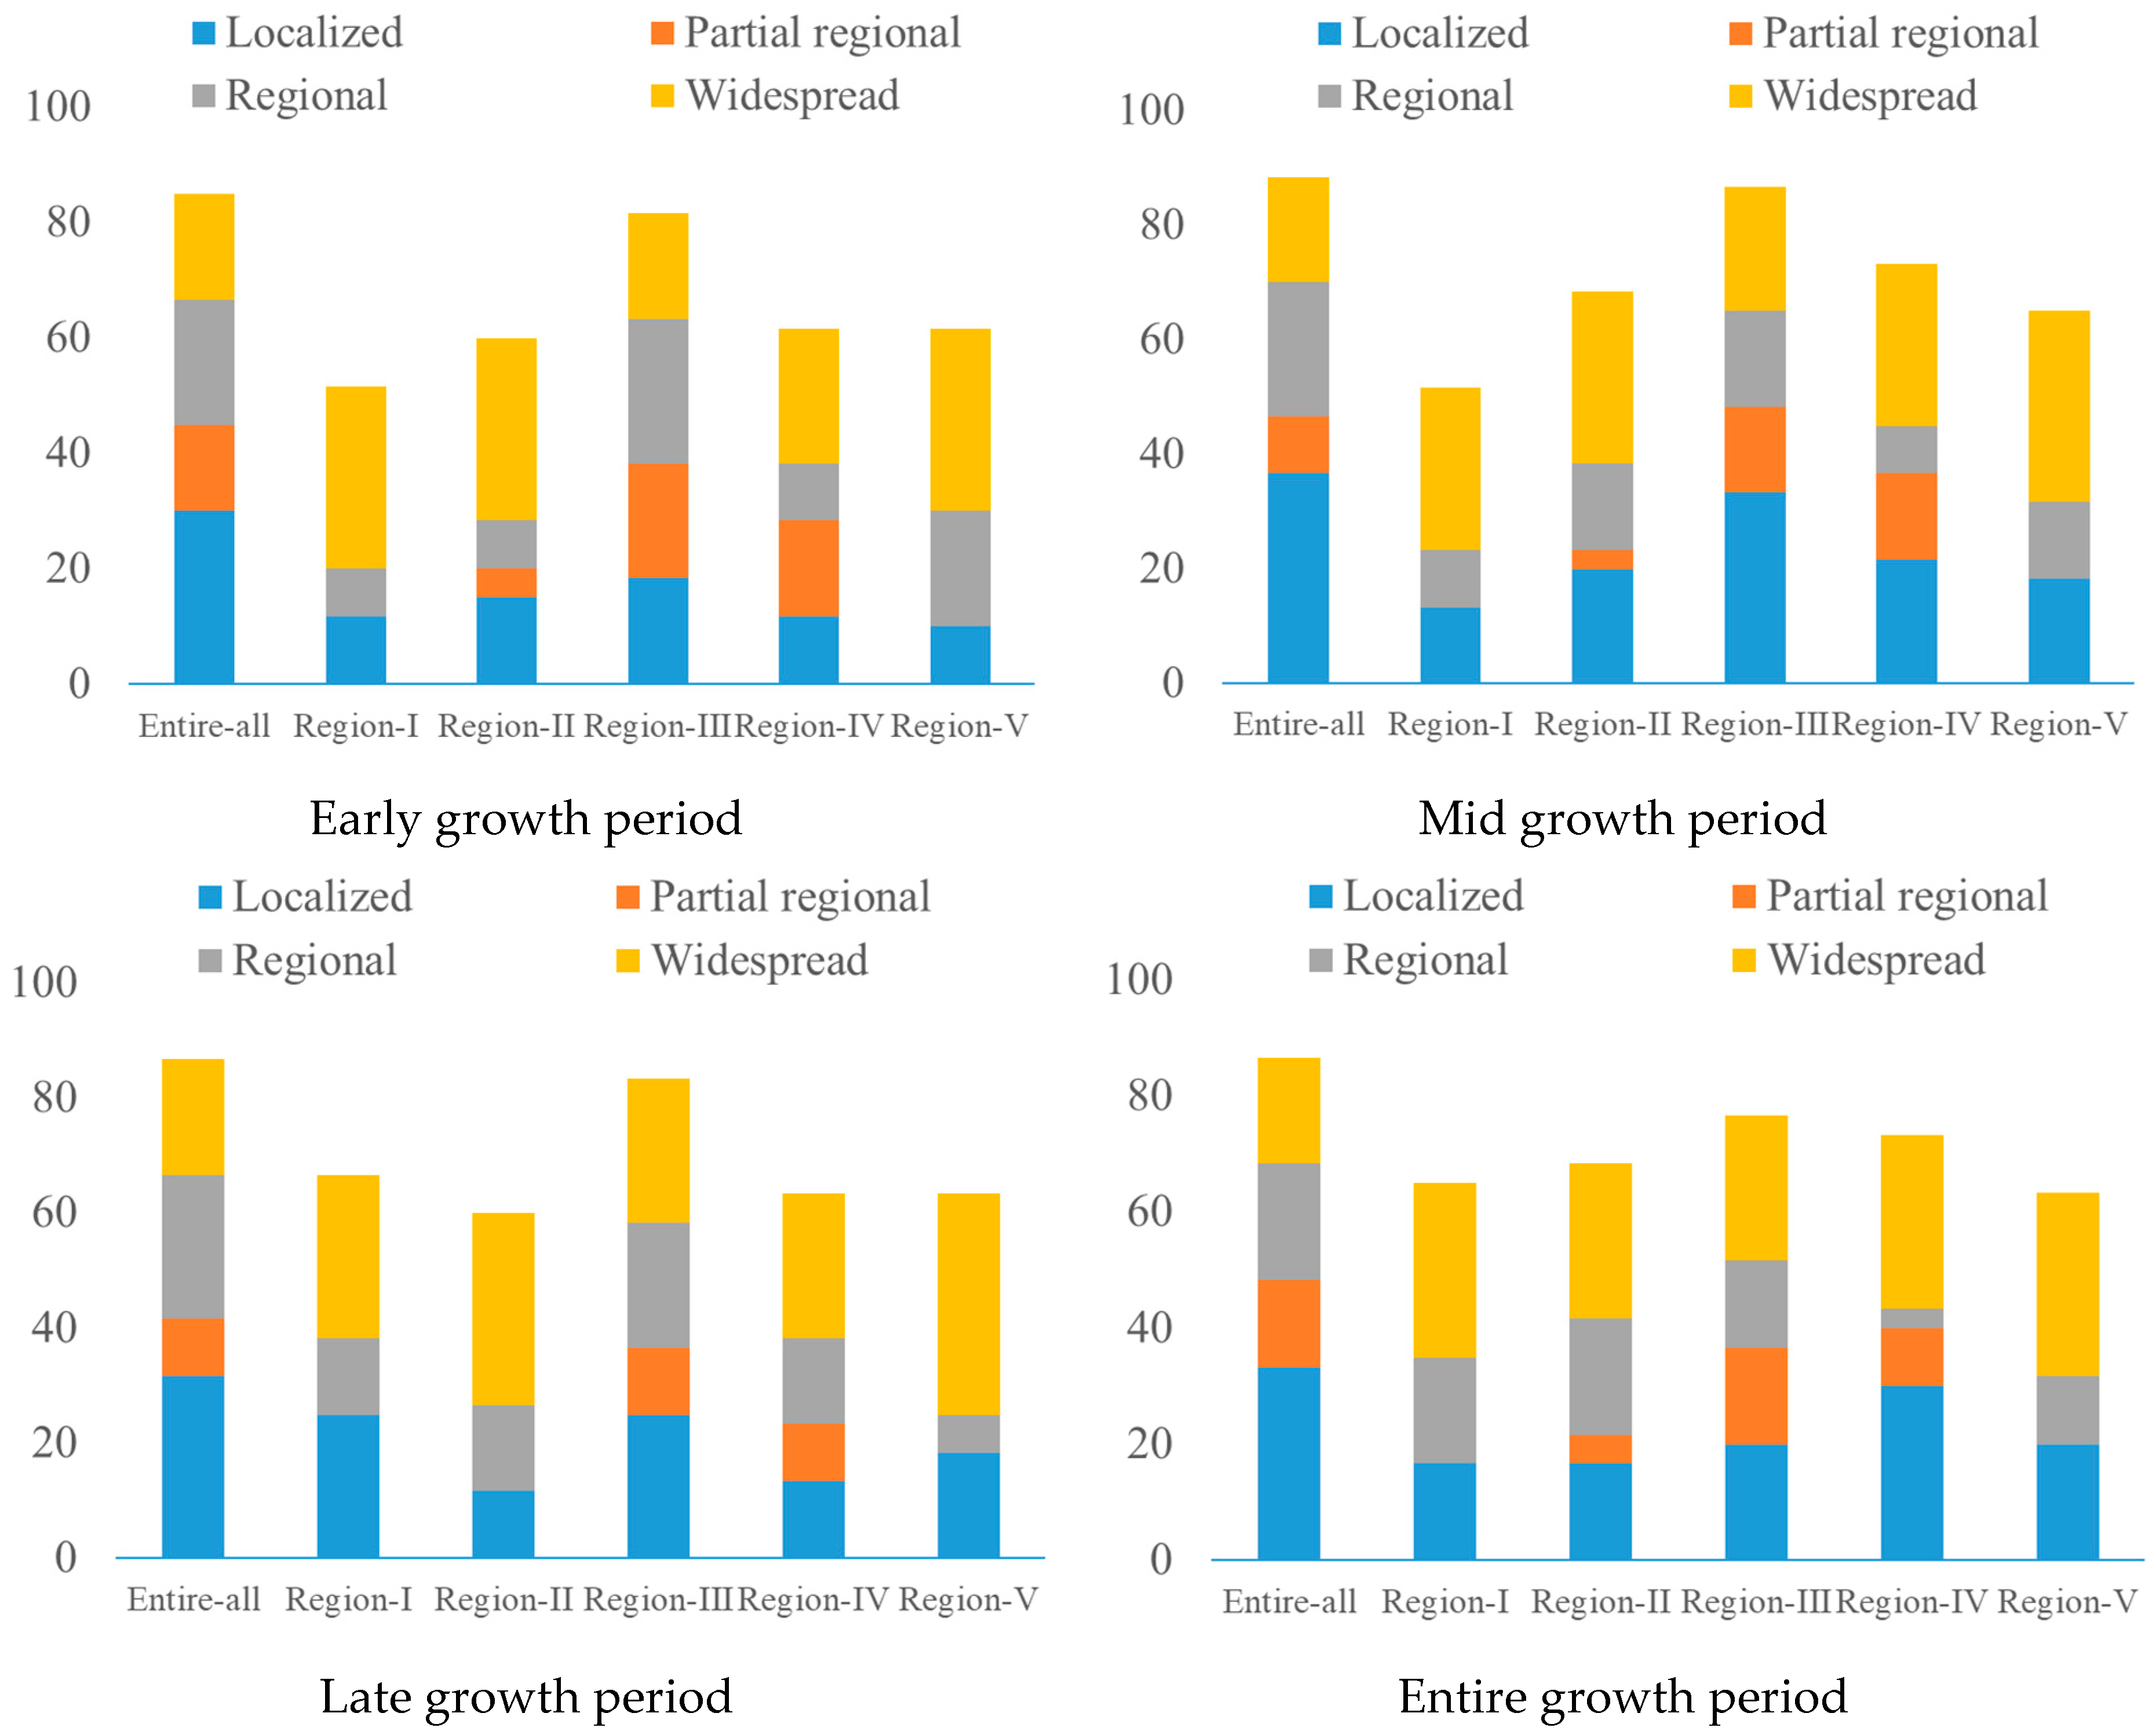
A compilation of the occurrence scope of different drought severity levels across the entire study region and its various climatic regions is illustrated in Figure 7. During different growth stages, localized and regional droughts predominantly occurred across the entire region. However, widespread droughts were more prevalent in most regions except Region III, which experienced a relatively large drought scope, exceeding the 76% occurrence range. Region I experienced a lower scope of drought during the early and middle growth stages, Region II experienced a lower scope of drought during the late growth stage, and Region V had the lowest scope of drought throughout the entire growth period. Except for Region III, during the early and middle stages of crop growth, the occurrence of widespread drought was extensive across all climate regions during different growth periods. Partial regional droughts were mainly distributed in Regions II, III, and IV during the early, middle, and entire growth periods, respectively.
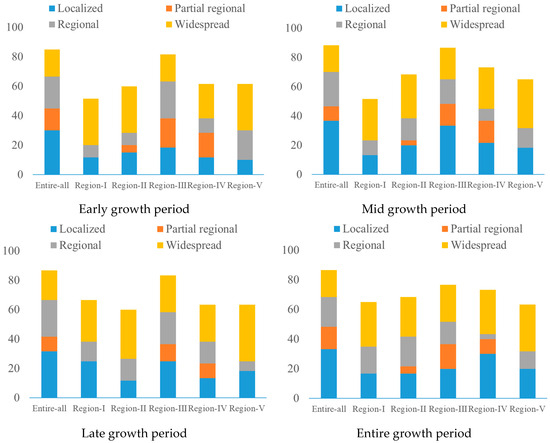
Figure 7.
Scope of drought occurrence in various regions of Inner Mongolia during the growth period of spring maize from 1961 to 2020.
3.4. Intensity of Drought Occurrence
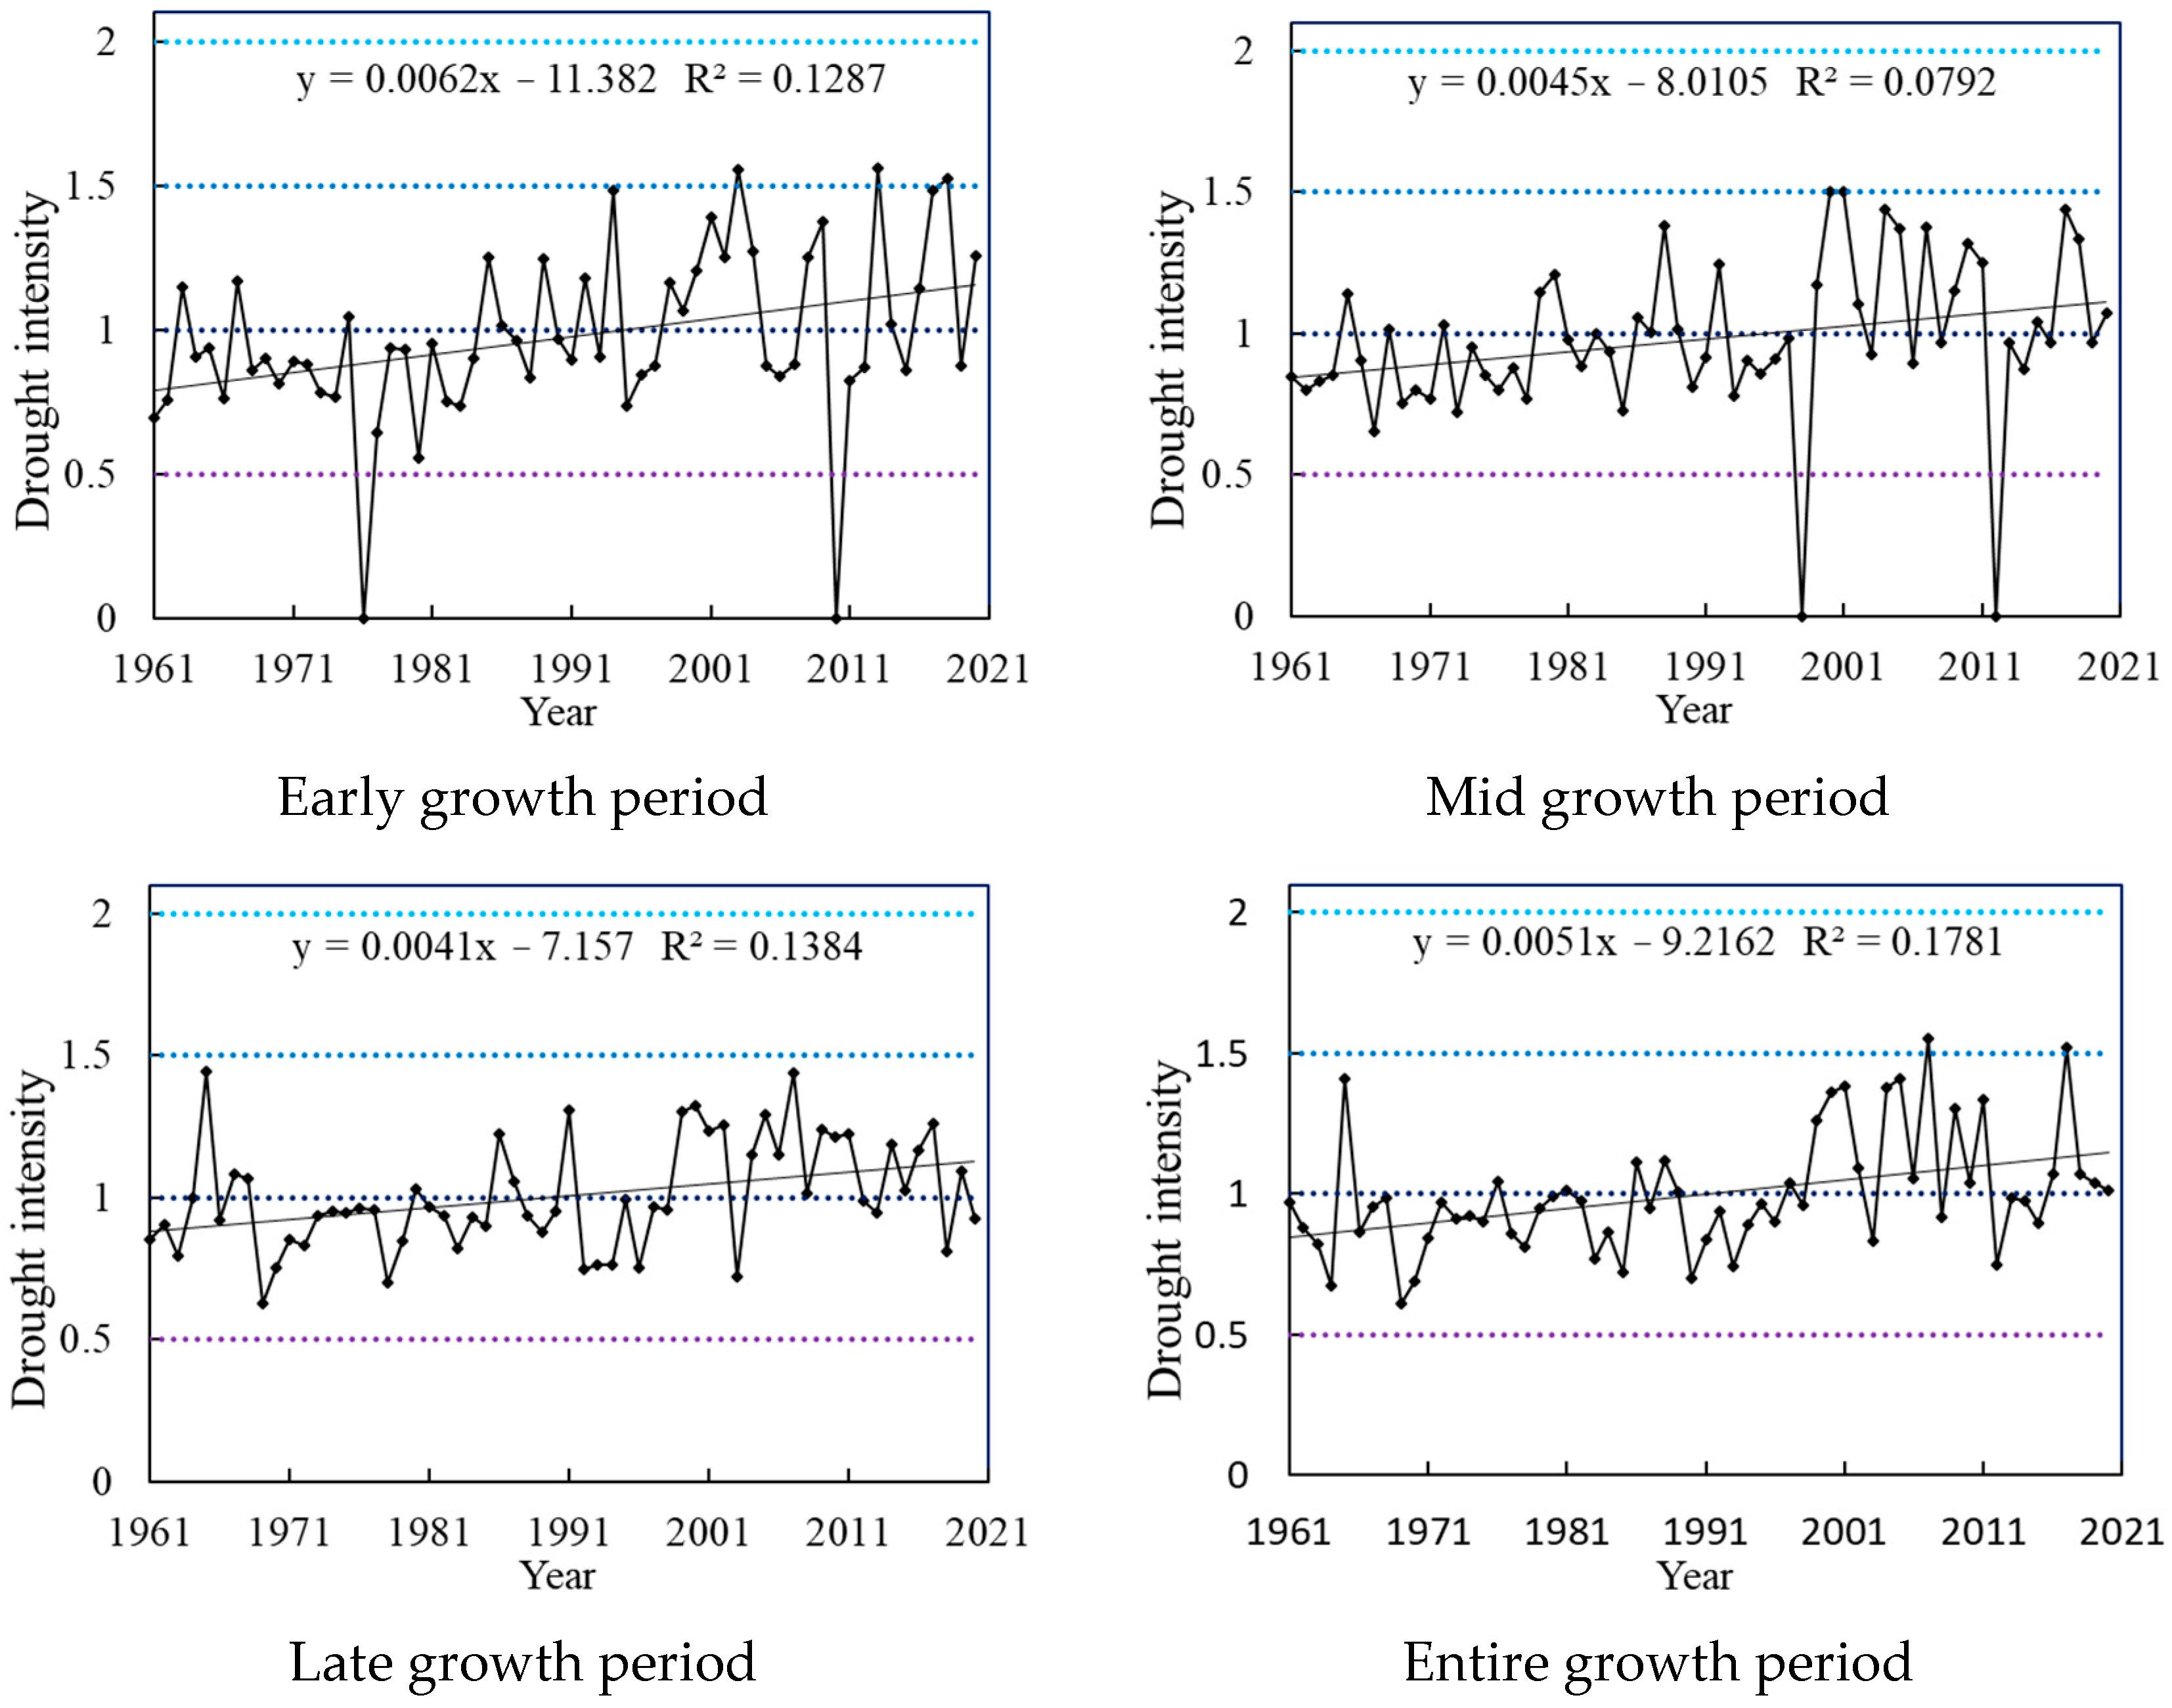
Drought intensity during spring maize growth in Inner Mongolia over the past 60 years is summarized in Figure 8. Drought intensity during the initial growth stage of spring maize ranges from 0 to 1.56, with a climatic tendency rate of 0.062 decade−1, indicating a significant increasing trend in drought intensity (p < 0.05). The maximum drought intensity occurred in 2013, which was classified as a severe drought, whereas the minimum drought intensity occurred in 1976 and 2010, representing normal years. Mild drought accounted for 58% of the total, moderate drought for 20 years, and severe drought for 3 years, specifically in 2003, 2013, and 2018. During the mid-growth period, the climatic tendency rate of drought intensity was 0.045 decade−1, indicating a significant increasing trend. The drought intensity ranged from 0.65 to 1.51, with an average of 0.97, categorizing it as mild drought. The maximum drought intensity occurred in 2001, which was classified as severe drought, whereas 1998 and 2012 were normal years. Mild and moderate droughts accounted for 56% and 38% of the total years, respectively. During the late growth period, the drought intensity mainly fluctuated between mild and moderate drought, ranging from 0.62 to 1.44. The average drought intensity over multiple years was 1, categorizing it as moderate drought. The drought intensity showed an increasing trend, with 35 and 25 years of mild and moderate drought, respectively. The climatic tendency rate of drought intensity across the entire growth period was 0.051 decade−1 years, indicating an overall significant increasing trend. The drought intensity ranged from 0.60 to 1.55, fluctuating between mild and severe drought, except for 2007 and 2017, which were classified as severe drought years. Mild drought accounted for 61% of the total, whereas moderate drought accounted for 35%.
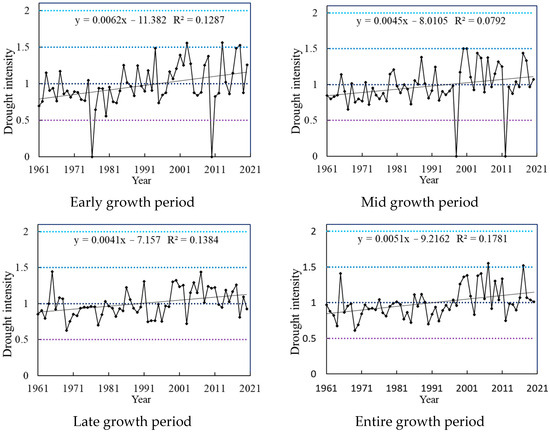
Figure 8.
Drought intensity in various regions of Inner Mongolia during the spring maize growth period from 1961 to 2020. Note: The light blue, blue, pink, and black lines represent different levels of drought intensity.
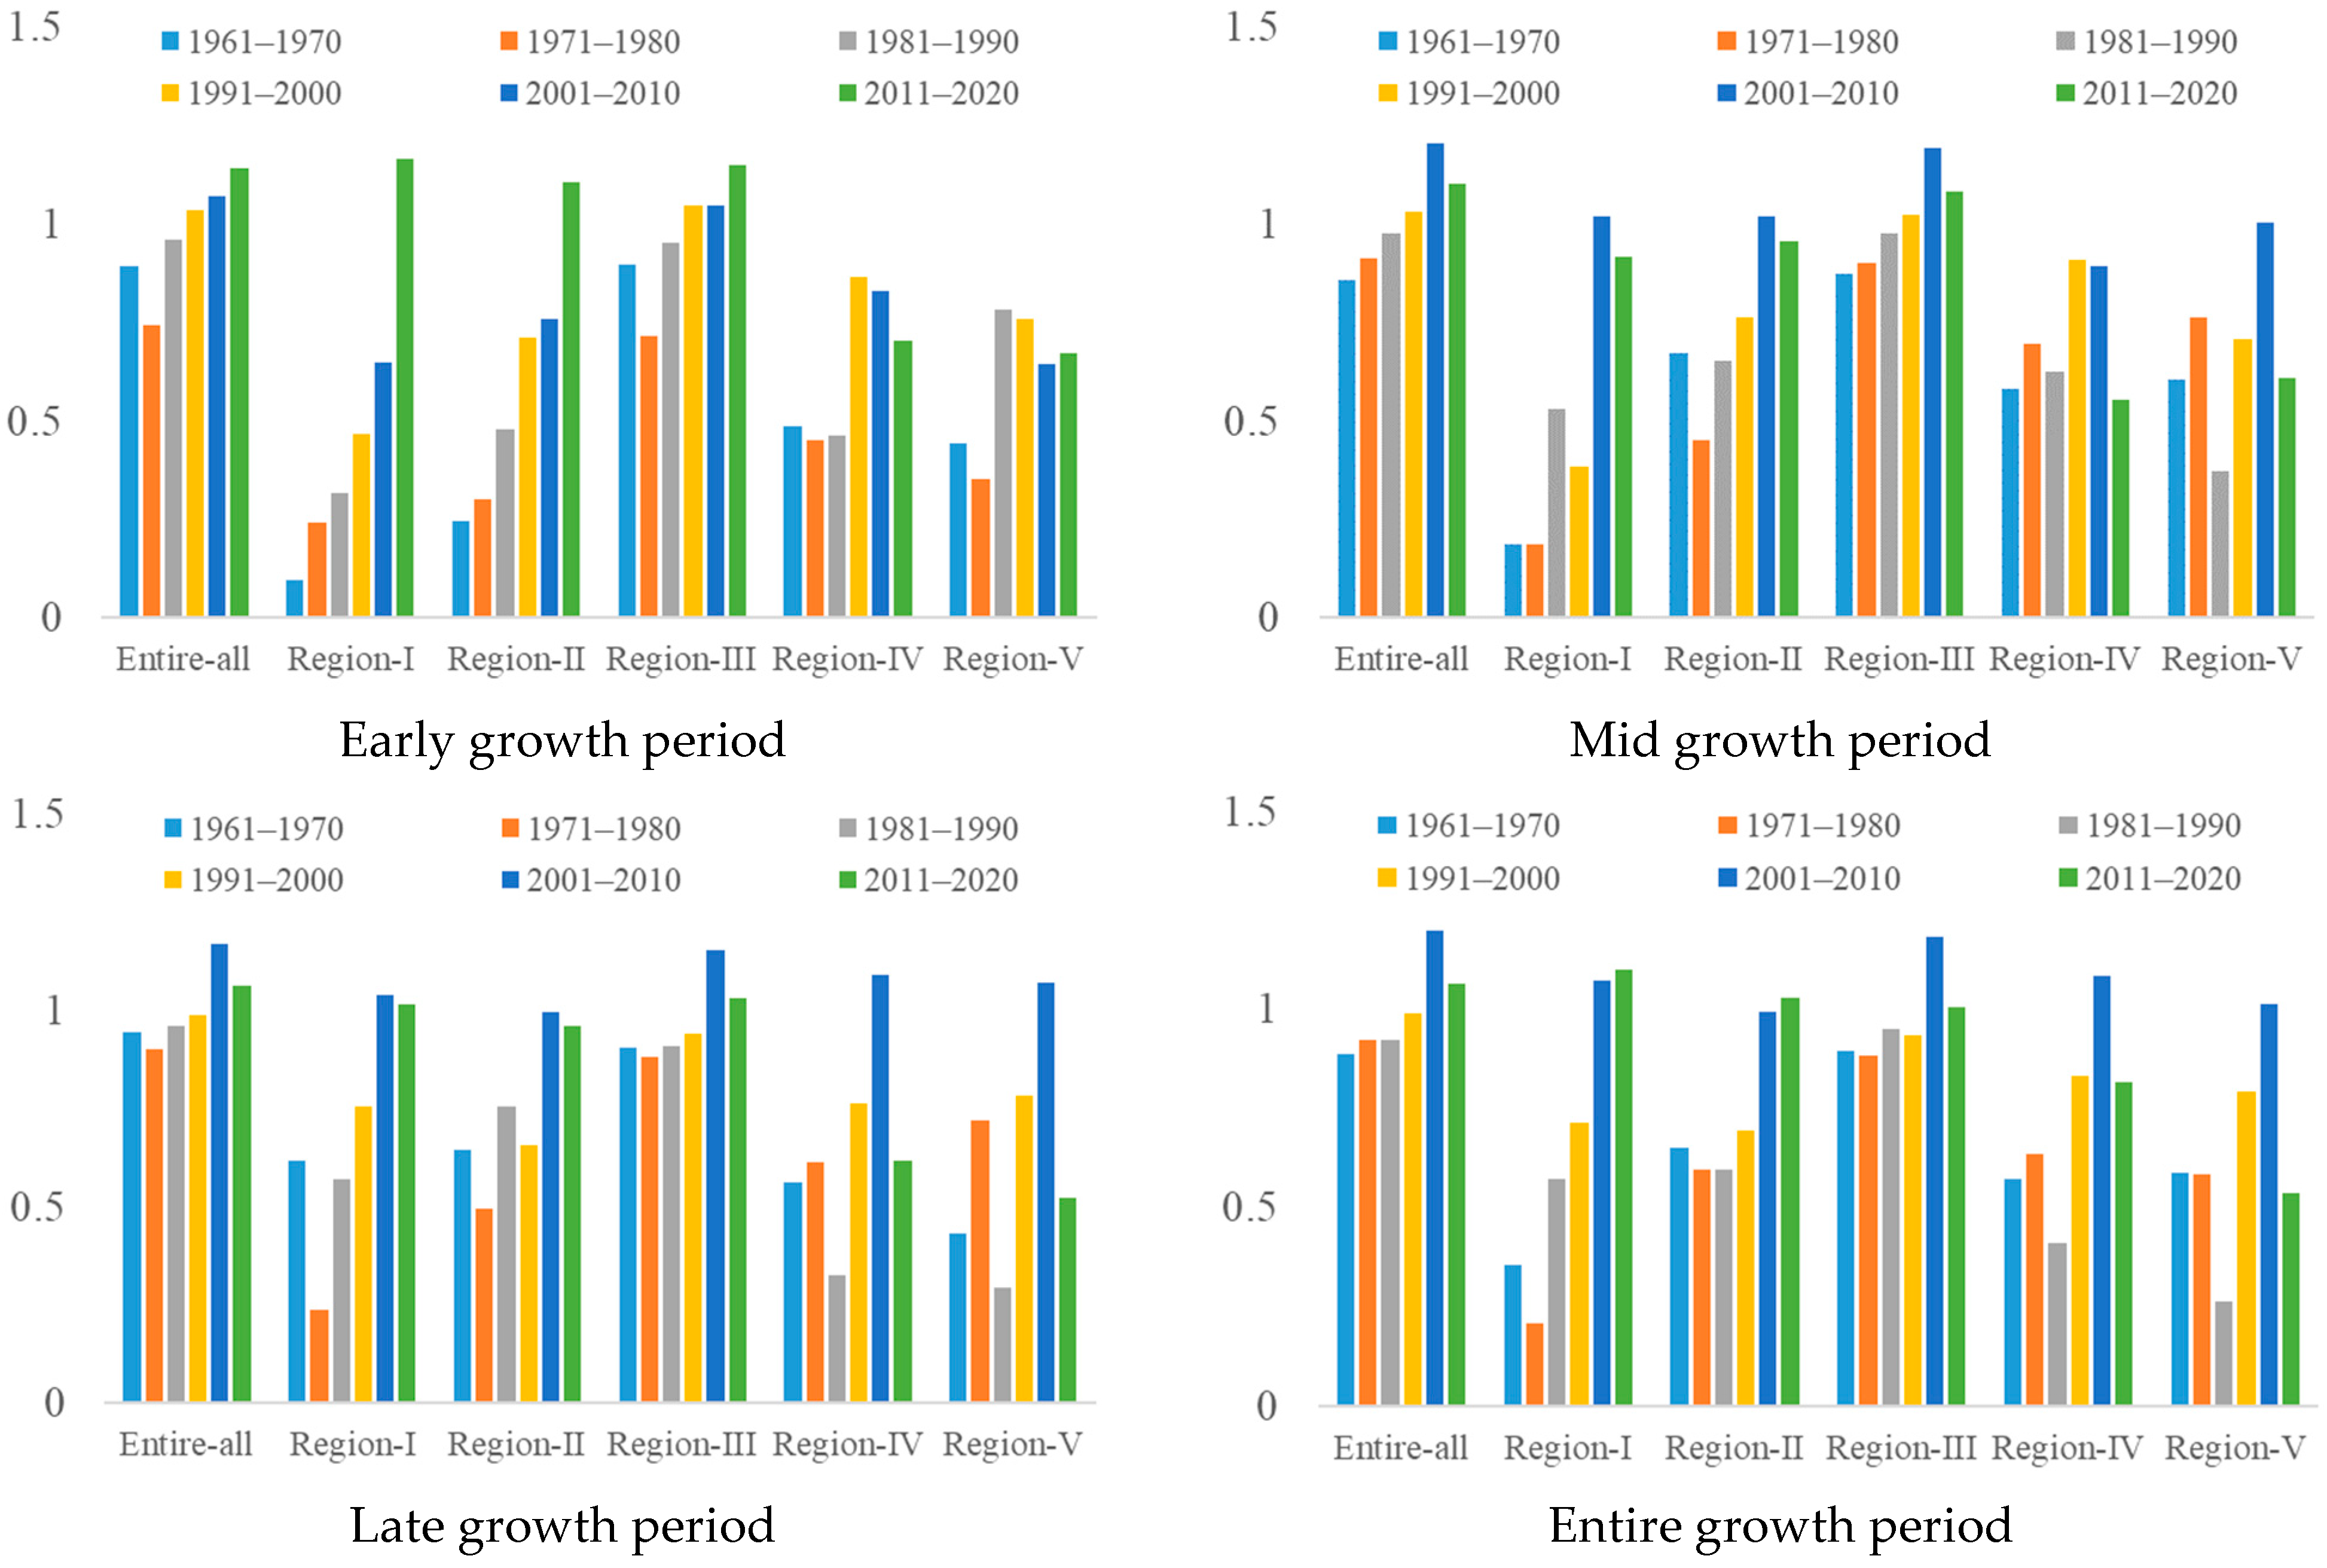
The interdecadal drought intensity in various climatic regions during the spring maize growth period is shown in Figure 9. During the early growth stage, the average drought intensity in the entire region and Region III was <1 during the 1960s, 1970s, and 1980s, indicating mild drought conditions. After the 1990s, moderate drought conditions became more prevalent. Regions I and II transitioned from normal years and mild droughts in the early periods to moderate drought conditions after the 2010s. Regions IV and V had predominantly normal years in the early periods, subsequently transitioning to mild drought conditions in the 1990s and the 1980s, respectively. During the mid-growth stage, the entire region and Region III experienced mild drought conditions before the 1990s, which shifted to moderate drought conditions thereafter. In Regions I, II, and V, the drought intensity in the 2010s was >1, indicating moderate drought years. Region I experienced normal conditions in the early period, whereas Regions II and V were predominantly characterized by mild droughts. The average drought intensity across different decades in Region IV ranged from 0.5 to 1, falling into the category of mild drought. During the later stages of reproduction, the entire region and Region III experienced mild drought before the 2000s, which shifted to moderate drought thereafter. Region I experienced moderate drought in the 2000s and 2010s, with the 1970s characterized as normal. Mild drought was the primary condition in other decades. Region II consistently experienced mild drought across the decades, with intensity ranging from 0.5 to 1. Regions IV and V experienced moderate drought in the 2000s and normal conditions in the 1980s, whereas mild drought was the main condition in other decades. Throughout the entire growth period, in the entire region, Regions II and III experienced mild drought before the 2000s, which shifted to moderate drought thereafter. Region I had a drought intensity of >1 in the 2000s and the 2010s, categorizing it as moderate drought; the other decades were predominantly normal years or mild drought. Regions IV and V experienced moderate drought in the 2000s, normal conditions in the 1980s, and mild drought in other decades.
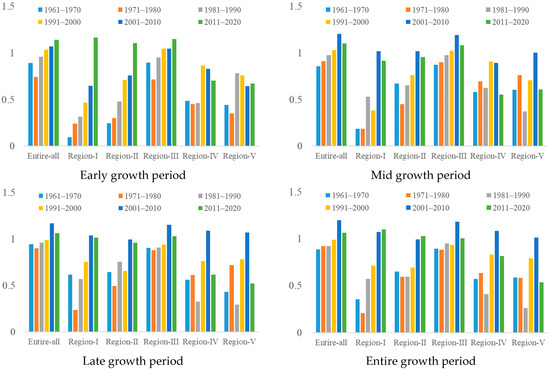
Figure 9.
Interdecadal variation of drought intensity during the spring maize growth period in various climatic regions from 1961 to 2020.
3.5. Relationship Between Yield and Drought Conditions
Drought is a complex phenomenon influenced by a combination of various meteorological factors, such as temperature, precipitation, and wind speed. By selecting typical, representative cities in different climatic regions, and using climatic variables and meteorological drought conditions as independent variables, with climate-induced yield as the dependent variable, a multiple regression analysis was conducted to explore the qualitative relationships between meteorological factors and yield in different climatic regions. According to Table 3, the impact of climatic factors on maize yield varies by region. In the Alxa League, wind speed and precipitation are the primary factors affecting yield. For Bayannur, wind speed, drought conditions, and sunshine duration are the main factors. In Erdos, humidity is the dominant factor. For Baotou and Hohhot, precipitation is the main factor. In Chifeng, precipitation and drought conditions are the key factors. For Hulunbeir, precipitation and sunshine duration are the primary factors. Overall, precipitation is the crucial factor affecting meteorological yield in these seven regions, followed by wind speed, drought conditions, sunshine duration, and humidity. Although the analysis indicates that dry and wet conditions are not the most important factors affecting spring corn yield, the meteorological conditions they constitute are key factors.
Table 3.
Regression models established in the seven selected areas in different climate regions.
4. Discussion
This study categorized the Inner Mongolia Autonomous Region into five climatic regions based on climate types and used the SPEI to analyze the characteristics of meteorological drought during the spring maize growth period in each climatic region. The SPEI in various climatic regions showed a downward trend across different growth stages of spring maize, with climate tendency rates of −0.117, −0.068, −0.135, and −0.135, respectively, indicating increasing drought severity. The initial, middle, and late growth stages of spring maize in Inner Mongolia mainly corresponded to the spring, summer, and autumn seasons in the region, respectively. The SPEI in Inner Mongolia tends to indicate drying conditions in spring, summer, and autumn [29], aligning with the trend of SPEI changes observed in this study. However, some scholars have pointed out that the SPI and the Pa index show a downward trend in summer, indicating increased aridity, while in spring and autumn, the SPI index and the Pa index decrease, suggesting a mitigation of aridity. The reason for the inconsistency with the findings of this study may be that these indices only consider precipitation as a single factor [30,31].
Drought frequency, scope, and intensity were the main characteristics used to describe drought occurrence. The results of this study indicate that the drought frequency during various growth stages of spring maize ranges from 20% to 42%, consistent with related studies. For instance, using the SPEI to indicate drought frequency in spring, summer, and autumn in Inner Mongolia, the range was between 23% and 45% [29]. Nayintai [32] analyzed the characteristics of drought occurrence in the four seasons in Inner Mongolia using the SPI, with drought frequencies in spring, summer, and autumn ranging from 14% to 33%. The frequency of drought varies across different regions, potentially influenced by the nature of the underlying surface, precipitation, and vegetation. Region I experienced a higher frequency of drought during the initial and entire growth periods, with a lower frequency of drought occurring during the mid and late growth stages. Rainfall is the main limiting factor for spring maize growth in this region, and drought stress reduces maize emergence rates. Therefore, timely water replenishment is essential [33]. Regions II and III had a higher frequency of drought occurrence during all growth stages and the entire growth period, possibly due to a combination of rising temperatures, decreased precipitation, and increased vegetation, which collectively alter soil moisture content [30]. Attention should be paid to minimize drought impact on maize growth in these regions. The drought station frequency ratio reflects the scope and severity of drought disasters in the region. Han Zhihui [34] and Tong Siqin [26] noted that the scope of spring droughts in Inner Mongolia shows a decreasing trend, whereas that of summer and autumn droughts is increasing. This study found an increasing trend in the scope of drought during the initial, mid-, and late-growth stages of spring maize. The trend in drought scope during the initial growth stage did not align with that of the spring drought. This discrepancy may be due to differences in the number of meteorological stations involved and study periods considered in the research process. In Region III, the drought scope exceeded 76% of the area, likely linked to decreased rainfall during the growing season in this region. This region contains the largest number of meteorological stations, and widespread droughts may adversely affect spring maize growth. Drought intensity during each growth stage of spring maize showed a significant increasing trend. Since the early 21st century, drought intensity has increased by varying degrees in all climatic regions, resulting in periods of drought [19]. This was mainly due to increased temperatures and reduced rainfall in Inner Mongolia after 1990 [35,36].
Inner Mongolia is a vital part of the Mongolian Plateau. Research conducted by Zhang Qiaofeng and others has indicated that decreasing precipitation is a crucial factor affecting vegetation in the Mongolian Plateau region [37]. Consistent with the results of this study, precipitation is the primary factor influencing spring maize yield across different climate regions. Therefore, during the growth period of spring maize, each region should adopt adaptive management measures, such as enhancing the deployment of water conservancy facilities, intensifying the screening of drought-tolerant spring maize varieties, and establishing an early warning system for drought periods. These measures are intended to counteract the effects of drought on spring maize growth.
5. Conclusions
This study analyzed the changes in drought indices, drought frequency, drought-affected areas, drought intensity, and other related features of spring maize across different climatic regions in Inner Mongolia using data from 107 meteorological stations combined with information on the growth period of spring maize. The conclusions are as follows:
- (1)
- During the growing season, the climate tendency rates of the SPEI values across different climate regions and at various time scales were negative, indicating a trend towards aridification. Region I exhibited the most severe aridification trend, whereas Region V showed the mildest. Regarding spatial distribution, a few stations showed drought mitigation; however, most indicated intensifying drought trends.
- (2)
- Significant spatial differences in drought frequency were observed across spring maize growth stages. Areas with higher drought frequencies in the early, mid-, and late growth periods were concentrated in Regions I, II, and III, respectively. Throughout the reproductive period, drought frequency was generally higher in the entire region, Regions I, II, and III, whereas it was generally lower in Regions IV and V. The drought frequency at different levels in various climatic regions was characterized by a higher occurrence of mild and moderate drought, the lowest occurrence of extreme drought, and a moderate occurrence of severe drought.
- (3)
- The drought scope and intensity of spring maize showed an increasing trend in various growth stages, with larger increases occurring in the early growth stage. In the climatic regions, Region III experienced a relatively large drought scope during all growth stages, exceeding 76%. Drought intensity during each growth stage was predominantly mild to moderate, with severe droughts occurring infrequently, primarily during the initial growth stage and across the entire growth period. The main factors affecting spring corn yield are rainfall, wind speed, and drought conditions. The deployment of water-saving facilities and the selection of drought-tolerant varieties will be the main measures adopted in this region to address meteorological droughts. This study can provide a basis for developing drought resistance strategies in different climate regions.
Author Contributions
Conceptualization, X.Y. and S.Q.; methodology, X.F.; software, X.C.; validation, S.H., H.Q. and Y.H.; formal analysis, F.Y.; investigation, C.H.; resources, N.L.; data curation, X.F.; writing—original draft preparation, S.Q.; writing—review and editing, X.Y.; visualization, X.Y.; supervision, N.L.; project administration, H.Q.; funding acquisition, X.Y. All authors have read and agreed to the published version of the manuscript.
Funding
This research was funded by Hetao College Talent Introduction and Research Launch Project, grant no. HYRC202305, and Hetao College Talent Introduction and Research Launch Project, grant no. HYRC202306.
Data Availability Statement
The data for this study will be available upon request.
Conflicts of Interest
The authors declare no conflicts of interest.
References
- Ara Begum, R.; Lempert, E.; Ali, E.; Benjaminsen, T.A.; Bernauer, T.; Cramer, W.; Cui, X.; Mach, K.; Nagy, G.; Stenseth, N.C.; et al. Point of Departure and Key Concepts (Chapter 1). In IPCC 2022: Climate Change 2022: Impacts, Adaptation and Vulnerability. Contribution of Working Group II to the Sixth Assessment Report of the Intergovernmental Panel on Climate Change; Pörtner, H.-O., Roberts, D.C., Tignor, M., Poloczanska, E.S., Mintenbeck, K., Alegría, A., Craig, M., Langsdorf, S., Löschke, S., Möller, V., et al., Eds.; Cambridge University Press: Cambridge, UK; New York, NY, USA, 2022; pp. 121–196. [Google Scholar]
- Duan, W.L.; Takara, K.T. Extreme precipitation events, floods, and associated socio-economic damages in China in recent decades. In Impacts of Climate and Human Activities on Water Resources and Quality; Springer: Singapore, 2020; pp. 11–29. [Google Scholar]
- Yu, C.; Huang, X.; Chen, H.; Huang, G.; Ni, S.; Wright, J.S.; Hall, J.; Ciais, P.; Zhang, J.; Xiao, Y.; et al. Assessing the impacts of extreme agricultural droughts in China under climate and socioeconomic changes. Earth’s Future 2018, 6, 689–703. [Google Scholar]
- Zhou, Z.G.; He, L.J.; Zhong, Y.; Wang, L.C.; Qin, W.M.; Zhang, X. Evaluation and analysis of MODIS and VIIRS satellite aerosol optical depth products over China. China Environ. Sci. 2024, 44, 4211–4229. [Google Scholar]
- Wang, M.H.; Jiang, S.H.; Ren, L.L.; Cui, H.; Ren, M.M. Evaluation of flash drought under the impact of heat waves events in the Weihe River Basin. Water Resour. Dev. Res. 2023, 23, 21–28. [Google Scholar]
- Li, G.Y. Thoroughly implement the spirit of the 20th National Congress of the Communist Party of China and solidly promote the high-quality development of water conservancy in the new stage—Speech at the National Water Conservancy Work Conference in 2023. Water Resour. Dev. Res. 2023, 23, 1–11. [Google Scholar]
- Dai, H.Y.; Li, D.; Su, R.N.; Chen, S.H.; Du, W.L. Dry and wet environment evolution and climatic background analysis of regional ecological construction in Inner Mongolia. Arid. Land. Geogr. 2019, 42, 745–752. [Google Scholar]
- Yu, L.L.; Tang, S.N.; Chen, F.; Ding, Y.Y.; Yang, Y.Z. Analysis of the development and utilization of water resources in Inner Mongolia autonomous region and countermeasures. Water Resour. Plan. Des. 2019, 16–19+43. [Google Scholar]
- Qiao, S.S.; Gao, X.Y.; Qu, Z.Y.; Yang, X.J.; Chang, X.; Yang, F.; Feng, X.W. Impact of climate change on the water requirements and yield of spring maize in Inner Mongolia of China from 1959 to 2018. Agric. Water Manag. 2022, 38, 87–97. [Google Scholar]
- Chen, J.; Zhou, L.; Yu, M.W. Ecological environmental problems and suggestion of scientific exploitation and utilization of groundwater resource in the west of liaohe plain inner Mongolia. Hydrogeol. Eng. Geol. 2008, 35, 123–125. [Google Scholar]
- Xing, Z.X.; Li, G.; Fu, Q.; Wang, J.Q.; Duan, W.Y.; Wang, H.L.; Liu, H.Q. Construction of an optimized comprehensive drought index for agricultural watersheds in cold regions and its applicability analysis. Water Resour. Prot. 2023, 39, 42–51+78. [Google Scholar]
- Song, Y.L. Global research progress of drought indices. J. Appl. Meteorol. Sci. 2022, 33, 513–526. [Google Scholar]
- Li, W.G.; Liu, S.J.; Hou, M.T.; Han, J.; Chen, X.M. Advance in the study on meteorological and agricultural drought indices. Meteorol. Environ. Sci. 2021, 44, 76–82. [Google Scholar]
- Su, X.L.; Zhang, G.X.; Feng, K. Progress and perspective of drought index. J. Water Resour. Archit. Eng. 2019, 17, 9–18. [Google Scholar]
- Yao, N.; Jiang, K.H.; Xie, W.X.; Zhang, D.Y.; Yang, X.J.; Yu, Q. Temporal and spatial evolution of drought disasters in Shanxi province under background of climate change. Trans. Chin. Soc. Agric. Machin. 2024, 55, 270–281. [Google Scholar]
- Wei, J.; Ma, Z. Comparison of palmer drought severity index, percentage of precipitation anomaly and surface humid index. Acta Geogr. Sin. 2003, 58, 117–124. [Google Scholar]
- Palmer, W.C. Meteorological Drought; US Department of Commerce, Weather Bureau: Washington, DC, USA, 1965.
- Zhao, Z.Z.; Zhang, B.L.; Pan, L.J.; Niu, P.T.; Guo, J.P. Drought diagnosis and prediction using SPEI in eastern Inner Mongolia. Environ. Ecol. 2023, 5, 39–48. [Google Scholar]
- Xie, M.; Gao, J.L.; Sun, J.Y.; Yu, X.F.; Wang, Z.G.; Hu, S.P.; Zhang, L. Spatiotemporal variation of drought in Inner Mongolia estimated based on the standardized precipitation evapotranspiration index. J. Irrig. Drain. 2022, 41, 140–146. [Google Scholar]
- Li, H.Y.; Ma, L.; Liu, T.X.; Du, Y.X.; Liu, M. Change and relationship of temperature and precipitation in Inner Mongolia during 1951–2014. J. Glaciol. Geocryol. 2017, 39, 1098–1112. [Google Scholar]
- Zhang, X.T.; Pan, X.B.; Xu, L.; Wei, P.; Yin, Z.W.; Shao, C.X. Analysis of spatio-temporal distribution of drought characteristics based on SPEI in Inner Mongolia during 1960–2015. Trans. Chin. Soc. Agric. Eng. 2017, 33, 190–199. [Google Scholar]
- Yang, X.J.; Sun, J.Y.; Gao, J.L.; Qiao, S.S.; Zhang, B.L.; Bao, H.Z.; Feng, X.W.; Wang, S.Y. Effects of climate change on cultivation patterns and climate suitability of spring maize in Inner Mongolia. Sustainability 2021, 13, 8072. [Google Scholar] [CrossRef]
- Middleton, N.; Thomas, D. World Atlas of Desertification, 2nd ed.; Arnold, Hodder Headline, PLC: London, UK, 1997. [Google Scholar]
- Begueria-Portugues, S.; Vicente-Serrano, S.M.; Angulo-Martínez, M.; López-Moreno, J.I.; El Kenawy, A. The standardized precipitation-evapotranspiration index (SPEI): A multiscalar drought index. In Proceedings of the 10th EMS Annual Meeting, Zürich, Switzerland, 13–17 September 2010. [Google Scholar]
- Yu, L.H.; Xie, W.S.; Xiong, S.W.; Zhang, X.T.; Xing, C.; Hu, S.S. Characteristics of drought and flood based on SPEI and its impact on wheat yield in Chuzhou of Anhui province. J. Arid. Meteorol. 2021, 39, 742–749. [Google Scholar]
- Tong, S.Q. Spatio-Temporal Variations and Prediction of Meteorological Drought in Inner Mongolia Under Climate Change; Northeast Normal University: Changchun, China, 2019. [Google Scholar]
- Qu, M.L. Guidance for Agricultural Climate Internship; Beijing Agricultural University Press: Beijing, China, 1991. [Google Scholar]
- Güçlü, Y.S. Multiple Şen-innovative trend analyses and partial Mann-Kendall test. J. Hydrol. 2018, 566, 685–704. [Google Scholar] [CrossRef]
- Guo, X.M.; Tong, S.Q.; Bao, Y.H.; Ren, J.Y. Spatial and temporal variation trend analysis of drought in Inner Mongolia in the past 55 years based on SPEI. Geomat. World 2021, 28, 42–48+79. [Google Scholar]
- Zhao, S.X.; Zhou, Q.C.; Wang, W.J.; Wu, Y.J. Dry-wet climate characteristics of Inner Mongolia based on standardized precipi tation index. J. China Inst. Water Resour. Hydropower Res. 2022, 20, 10–19. [Google Scholar]
- Wu, Y.J.; Li, W.; Wang, W.; Quan, Q.; Chen, X.J.; Yin, H.; Zhou, Q.C.; Xu, K.R. Drought characteristics in Inner Mongolia based on precipitation anomaly percentage. Arid Zone Res. 2019, 36, 943–952. [Google Scholar]
- Na, Y.T. Drought characteristics in Inner Mongolia based on the SPI index in the last 50 years. J. Arid. Land Resour. Environ. 2015, 29, 161–166. [Google Scholar]
- Zhu, M.Y.; Zhang, H.; Li, S.; Zhang, B.B.; Chang, S.; Cai fu Zhao, J.; Cai, W.B. Effects of water stress and supplement after sowing on emergence rates of maize. J. Meteorol. Environ. 2019, 35, 101–107. [Google Scholar]
- Han, Z.H.; Liu, X.G.; Hao, K.; Yu, N.; Liu, Y.W.; Yang, Q.L. Drought evolution characteristics and trend prediction in Inner Mongolia based on standardized precipitation index. J. Drain. Irrig. Machin. Eng. 2017, 35, 430–439. [Google Scholar]
- Sun, B.L.; Ma, L.; Feng, Q.; Liu, T.X.; Liang, L.T.; Li, H.Y.; Zhou, Y.; Liu, Y. Response of the warming hiatus to changing influences over the Inner Mongolia autonomous region. China Environ. Sci. 2019, 39, 2131–2142. [Google Scholar]
- Ma, Z.C.; Yu, H.B.; Zhang, Q.F.; Cao, C.M. Characteristics and sudden changes of temperature and precipitation in Inner Mongolia from 1960 to 2016. Res. Soil Water Conserv. 2019, 26, 114–121. [Google Scholar]
- Zhang, Q.F.; Yu, H.B.; Huang, F. The spatiotemporal dynamics of drought and the cumulative impact on vegetation phenology in the Mongolian Plateau. Arid Zone Res. 2024, 41, 1548–1559. [Google Scholar]
Disclaimer/Publisher’s Note: The statements, opinions and data contained in all publications are solely those of the individual author(s) and contributor(s) and not of MDPI and/or the editor(s). MDPI and/or the editor(s) disclaim responsibility for any injury to people or property resulting from any ideas, methods, instructions or products referred to in the content. |
© 2025 by the authors. Licensee MDPI, Basel, Switzerland. This article is an open access article distributed under the terms and conditions of the Creative Commons Attribution (CC BY) license (https://creativecommons.org/licenses/by/4.0/).