Article

A Two-Stage, Self-Pressure-Controlled Smart Manhole System with Motor-Driven and Lifting Mechanisms for Enhanced Flood Disaster Preparedness

Department of Building and Plant Engineering, Hanbat National University, Daejeon 34158, Republic of Korea
*
Author to whom correspondence should be addressed.
Water 2025, 17(7), 978; https://doi.org/10.3390/w17070978
Submission received: 18 February 2025 / Revised: 15 March 2025 / Accepted: 20 March 2025 / Published: 27 March 2025

Abstract

:
Frequent extreme rainfall events by climate change have substantially heightened drainage system loads, often resulting in manhole cover dislodgment, property damage, and injuries from open manholes. To address this escalating risk, this study proposes a self-pressure-controlled smart manhole system comprising a motor-driven rotating blade for initial pressure regulation and a lid-lifting mechanism for secondary relief under high-intensity flows. By offering two distinct opening stages, the design successfully mitigates excessive internal pressures and velocities that would otherwise endanger public safety. Through computational fluid dynamics (CFD) simulations and verification using a 3D-printed prototype, the system demonstrated the capacity to reduce internal pressures by up to 99.5% and lower peak flow velocities by approximately 93.4% compared to conventional closed-cover conditions. These results underscore the effectiveness of the multi-phase approach in managing both moderate and severe inflow scenarios, providing a viable strategy for improving urban drainage resilience against increasingly frequent and intense rainfall events.

1. Introduction

In recent years, extreme rainfall events resulting from abnormal weather patterns have become more frequent, causing significant damage nationwide, including river flooding and inundation in low-lying areas. Although heavy rainfall is typically addressed through advisories or warnings, approximately 80% of actual damage occurs during these extreme downpours. Extreme rainfall is defined as an accumulated precipitation exceeding 50 mm per hour, reaching up to 90 mm within three hours [1]. According to data from the Korea Meteorological Administration, the annual frequency of recorded extreme rainfall events is on the rise (Figure 1), highlighting the urgent need for disaster mitigation measures [1,2,3].
One of the main hazards during extreme rainfall is the dislodgment of manhole covers due to excessive backflow pressure in stormwater drainage systems. For instance, during heavy rainfall in 2022, a manhole cover in Korea was propelled by internal water pressure, striking a bus and damaging both the vehicle and the road surface [1,2,3]. As the damage caused by extreme rainfall continues, extensive research has been conducted domestically to prevent manhole dislodgment. Most studies focus on stormwater storage systems designed to prevent backflow in manholes during flooding. The rainwater backflow prevention manhole is designed to prevent rainwater discharged below the manhole from re-entering its interior. It features a protruding edge on the manhole base to prevent backflow, with the lower center elevated above the ground.
To prevent such events, there have been several patents and prior studies to be considered. The backflow prevention manhole is designed to block the re-entry of rainwater discharged below the manhole. It features a protruding edge at the base, an opening element that connects to the upper cover, a collection section with drainage holes, and a check valve installed above ground level [4,5]. Although this system effectively prevents rainwater from flowing back into the manhole, it struggles with elevated hydraulic pressure when the collection section’s capacity is exceeded during extreme rainfall.
The flow control device for rainwater manholes protects manholes from sewer pressure damage by naturally opening the fluid passage during backflow. It includes a discharge plate, sidewall components, a rainwater drainage plate, and a backflow discharge valve [6]. However, under severe downpours, the increased internal pressure acting on both the manhole cover and discharge plate can cause dislodgment or even explosion. An infiltration-type flood control rainwater manhole aims to reduce flood risk by collecting, storing, and then overflowing or preventing backflow via an infiltration-based design [7]. Yet, to handle short, intense rainfall, the storage capacity must increase substantially, raising construction costs and complexity. If the system’s limit is surpassed, the manhole cover can still be dislodged. Another backflow prevention device places one blocking plate beneath the manhole and another below it, each capable of moving up and down to close one or more inlet holes [8]. While effective at preventing backflow, it shares the vulnerability to high internal pressure that can dislodge the cover under extreme conditions. A dual manhole cover with pressure control maintains internal water pressure below a set level using a detachable cover frame and a groove system with a panel that opens based on internal pressure [9]. However, its limited opening area hampers large-volume pressure relief, and it passively depends on internal pressure without enabling multi-step flow control. Additionally, the upward movement of the cover can obstruct traffic and pedestrian pathways.
Similarly, the anti-displacement manhole cover with pressure control prevents the cover from separating from the frame under backflow pressure, providing easy detachment via simple rotation [10]. Yet, like the dual-cover design, its passive central opening mechanism cannot manage flow in discrete stages, and the opening area remains restricted. Lastly, the safety manhole cover with pressure regulation and anti-fall features has a supporting frame and a pressure-dispersion device to release some pressure as it rises [11]. Although it offers a larger drainage area, it sacrifices load capacity and durability, making it less suitable for heavy-traffic urban regions. Its complicated design also poses challenges in installation and maintenance [12]. In sum, most existing systems rely on passive, natural opening triggered by internal pressure, with the following common drawbacks: (1) lack of multi-step pressure control for dynamically changing inflow rates, (2) potential obstruction to traffic or pedestrians if the cover rises excessively, and (3) structural weakness under extreme hydraulic loads.
Several recent studies underscore the critical influence of manholes on urban flood control and stormwater management. For example, Gebregziabher and Demissie [13] employed a coupled model—combining the Storm Water Management Model (SWMM) with a Flood Inundation and Recession Model (FIRM)—to investigate manhole flooding events in Edmonds, Washington. Their results revealed a close match between simulated and observed flood extents, emphasizing that manholes must be explicitly included in urban flood simulations to capture the true extent of inundation. In another numerical study, Sifa et al. [14] analyzed stormwater overflow in manholes using OpenFOAM and a standard (k)-(varepsilon) turbulence model, showing that non-uniform pressure beneath the manhole cover can produce localized overflow peaks.
Mathurin et al. [15] highlighted the limitations of steady-flow assumptions in drainage networks prone to frequent flood events. Their transient-flow model demonstrated how manhole capacity affects the propagation of surge waves, altering the filling speed of downstream conduits. To mitigate sewer overflows in Mbale City, Uganda, Nabende et al. [16] used computational fluid dynamics (CFD) to examine optimal flow ranges for a pipe–manhole system, finding that velocities between 0.67 m/s and 5.5 m/s significantly reduce overflow risk. Meanwhile, Martins et al. [17] investigated various grate designs under subcritical flow, noting strong agreement between 2D PIV experiments and numerical models but also identifying localized discrepancies near the grates.
Using a similar CFD framework, Beg et al. [18] conducted simulations to explore how flow regime transitions—ranging from free-surface to pressurized—impact pressure distributions in a manhole–pipe drainage system. Validating these results against experimental data revealed a maximum error of less than 7%, underscoring the reliability of CFD for stormwater research. Finally, Arao et al. [19] addressed the often-overlooked energy losses in manholes, proposing an optimization approach that factors in both pipe friction and manhole-induced losses. Their work aims to refine storm sewer designs by minimizing total energy expenditure, reinforcing the crucial role of manhole configuration in urban drainage efficiency.
Despite these advancements, manhole cover dislodgment remains a critical safety concern under extreme rainfall, calling for new solutions that combine active sensing with stepwise pressure control. An experiment by the National Disaster Management Research Institute demonstrated that in a 50 mm/hour downpour at Seoul, a 40 kg manhole cover lifted approximately 27 cm in just 41 s [1,2,3,4,5,6] illustrating the imminent threat to pedestrians. To address these issues, this study proposes a self-pressure-controlled smart manhole system featuring two-phase pressure relief:
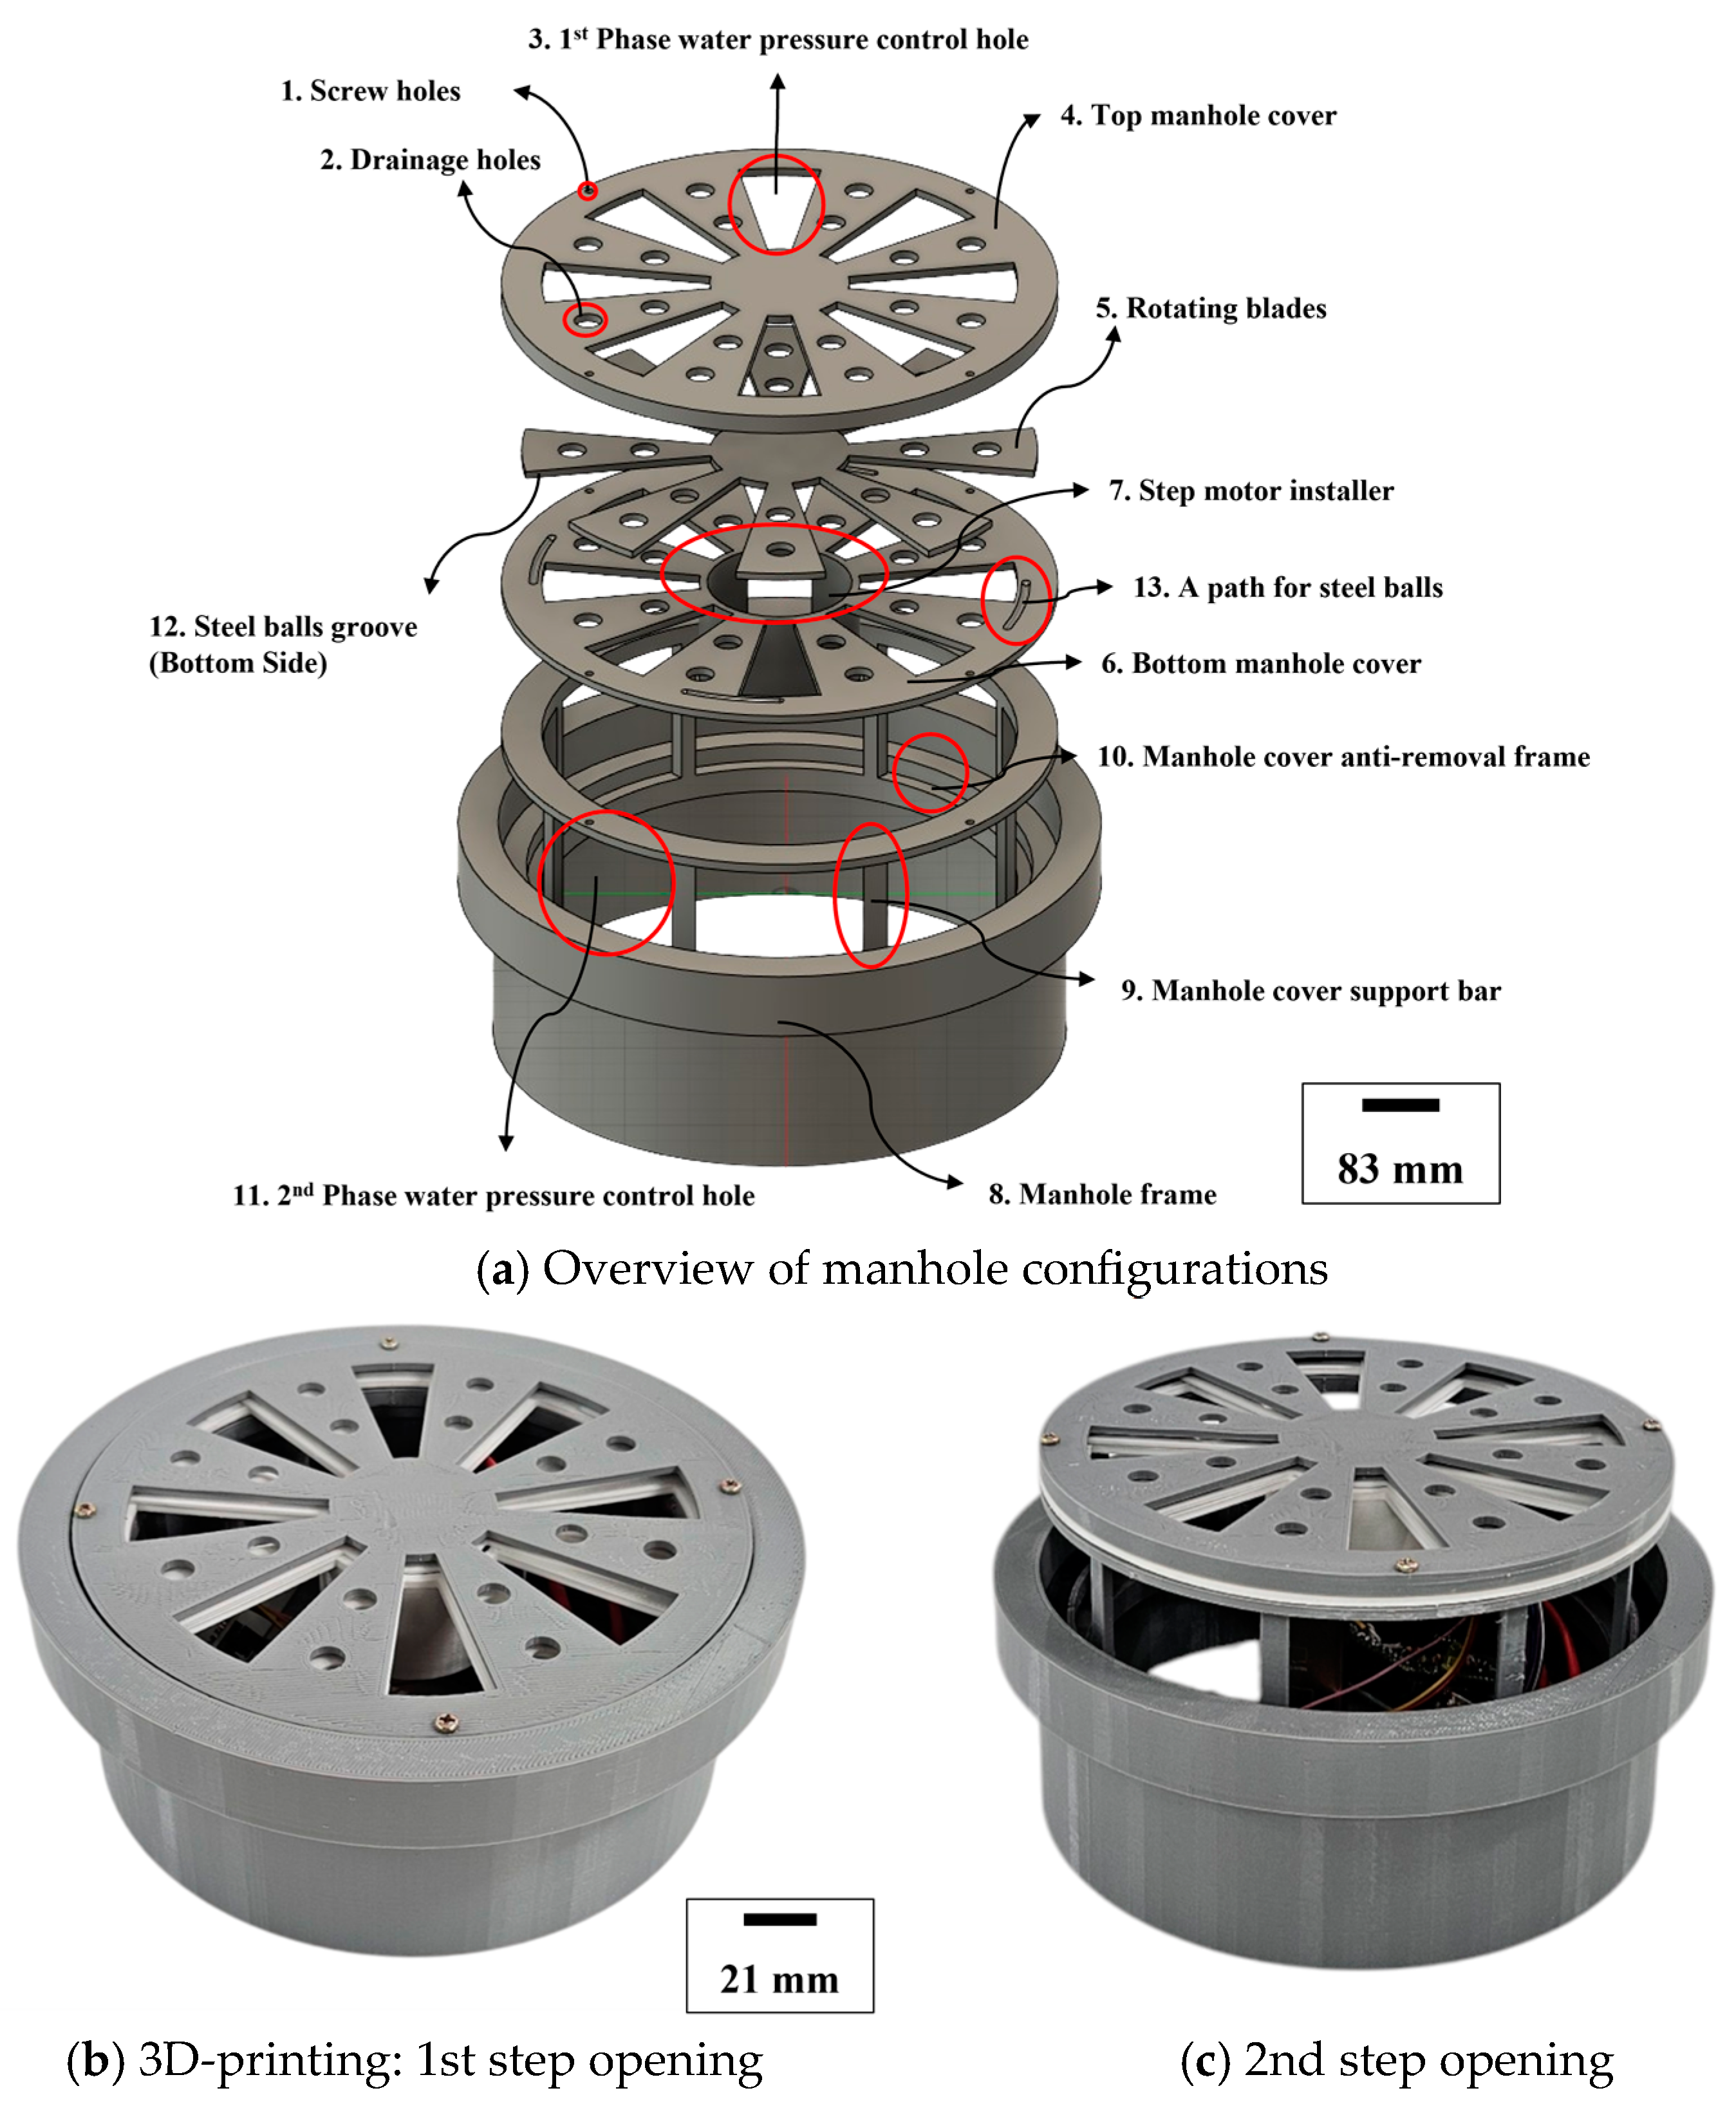
  • Motor-Driven Rotating Blade: In the first stage, a rotating blade assembly enlarges the drainage pathway, mitigating initial pressure buildup.
  • Controlled Vertical Lift: Under extremely high backflow pressure, the manhole cover lifts by a defined amount, dispersing any residual surge while minimizing obstruction to traffic or pedestrians.
By integrating Arduino-based sensors for real-time monitoring, this novel design aims to prevent sudden cover displacements, lowering public safety risks and infrastructure damage during extreme rainfall. Through both computational fluid dynamics (CFD) analysis and prototyping, we examine how the two-stage mechanism moderates internal flow velocity and pressure, offering a more adaptable alternative to purely passive solutions. Ultimately, we seek to enhance urban resilience by reducing backflow-induced accidents and ensuring stable operation of drainage systems under increasingly severe weather conditions.

2. Smart Manhole Solution and Analysis

2.1. Three-Dimensional Printing Fabrication and Control Algorithm

The manhole dimensions for 3D printing were designed at one-third of the standard size of cast iron manhole covers used in water and sewage systems, specifically 648 × 110 mm2, where 648 mm is diameter. A preliminary 3D-printed model is made for validating the feasibility of the smart manhole’s design and assembly before conducting full-scale structural tests. By producing a tangible prototype, researchers can confirm that each component—such as the rotating blade assembly, the lid lifting support shown in Figure 2a, and the inner frame—fits together precisely as intended.
This physical verification is particularly crucial given the complex geometries involved, which may not always translate seamlessly from a computer-generated model to a functional, real-world configuration. Furthermore, inspecting 3D-printed prototype aids in identifying potential mechanical interferences, facilitating accurate fluid flow analyses, and refining the design to ensure that the system can be practically assembled without compromising its hydraulic performance. Overall, 3D printing offers an efficient, cost-effective means of bridging the gap between conceptual simulations and actual product development, thereby enhancing confidence in the system’s viability for subsequent structural and operational testing.
The three-dimensional model of the proposed manhole system was developed to optimize both the rotating blade unit (Figure 2(a5)) and the lifting components (Figure 2(a9,a10)). During the second stage of pressure adjustment, an inner frame (Figure 2(a10)) was placed inside the larger manhole frame (Figure 2(a8)) to prevent the lid’s lifting support (Figure 2(a9)) from rising beyond a certain height. The top cover (Figure 2(a4)) was designed separately from the lifting support and anti-detachment assembly, and screw holes (Figure 2(a1)) were incorporated to simplify assembly. Meanwhile, the bottom cover (Figure 2(a6)), which houses the rotating blade (Figure 2(a7)) and motor drive system, includes additional screw holes around its perimeter for secure attachment and easier maintenance. A dedicated path for steel balls (Figure 2(a13)) was also introduced to distribute the load exerted on the motor shaft. More specifically, a groove (Figure 2(a12)) was machined on the underside of the rotating blade to accommodate the steel balls, and the motor shaft is fixed to the center of the blade’s backside. This arrangement ensures that the rotating blade’s weight is borne primarily by the steel balls, preventing excessive strain on the motor during repeated operation. Once all components are assembled, the fully constructed system appears as illustrated in Figure 2b,c.
By uniting multi-step pressure control with an enhanced mechanical layout, the proposed manhole design aims to mitigate the risk of cover displacement during heavy downpours more effectively than prior systems. The remainder of this paper discusses the operating principles of the smart manhole system, its experimental setup, and the results of performance evaluations under simulated extreme rainfall conditions. The goal is to demonstrate that integrating a motor-driven rotating blade, Arduino-based pressure sensing, and a controllable lifting mechanism can substantially reduce backflow-induced accidents, thereby bolstering public safety in urban environments.
Figure 3 shows the overall control algorithm for the proposed manhole system, which continuously collects and analyzes hydraulic pressure data. After each cycle of measurement, the system identifies the maximum measured value and then proceeds as follows:
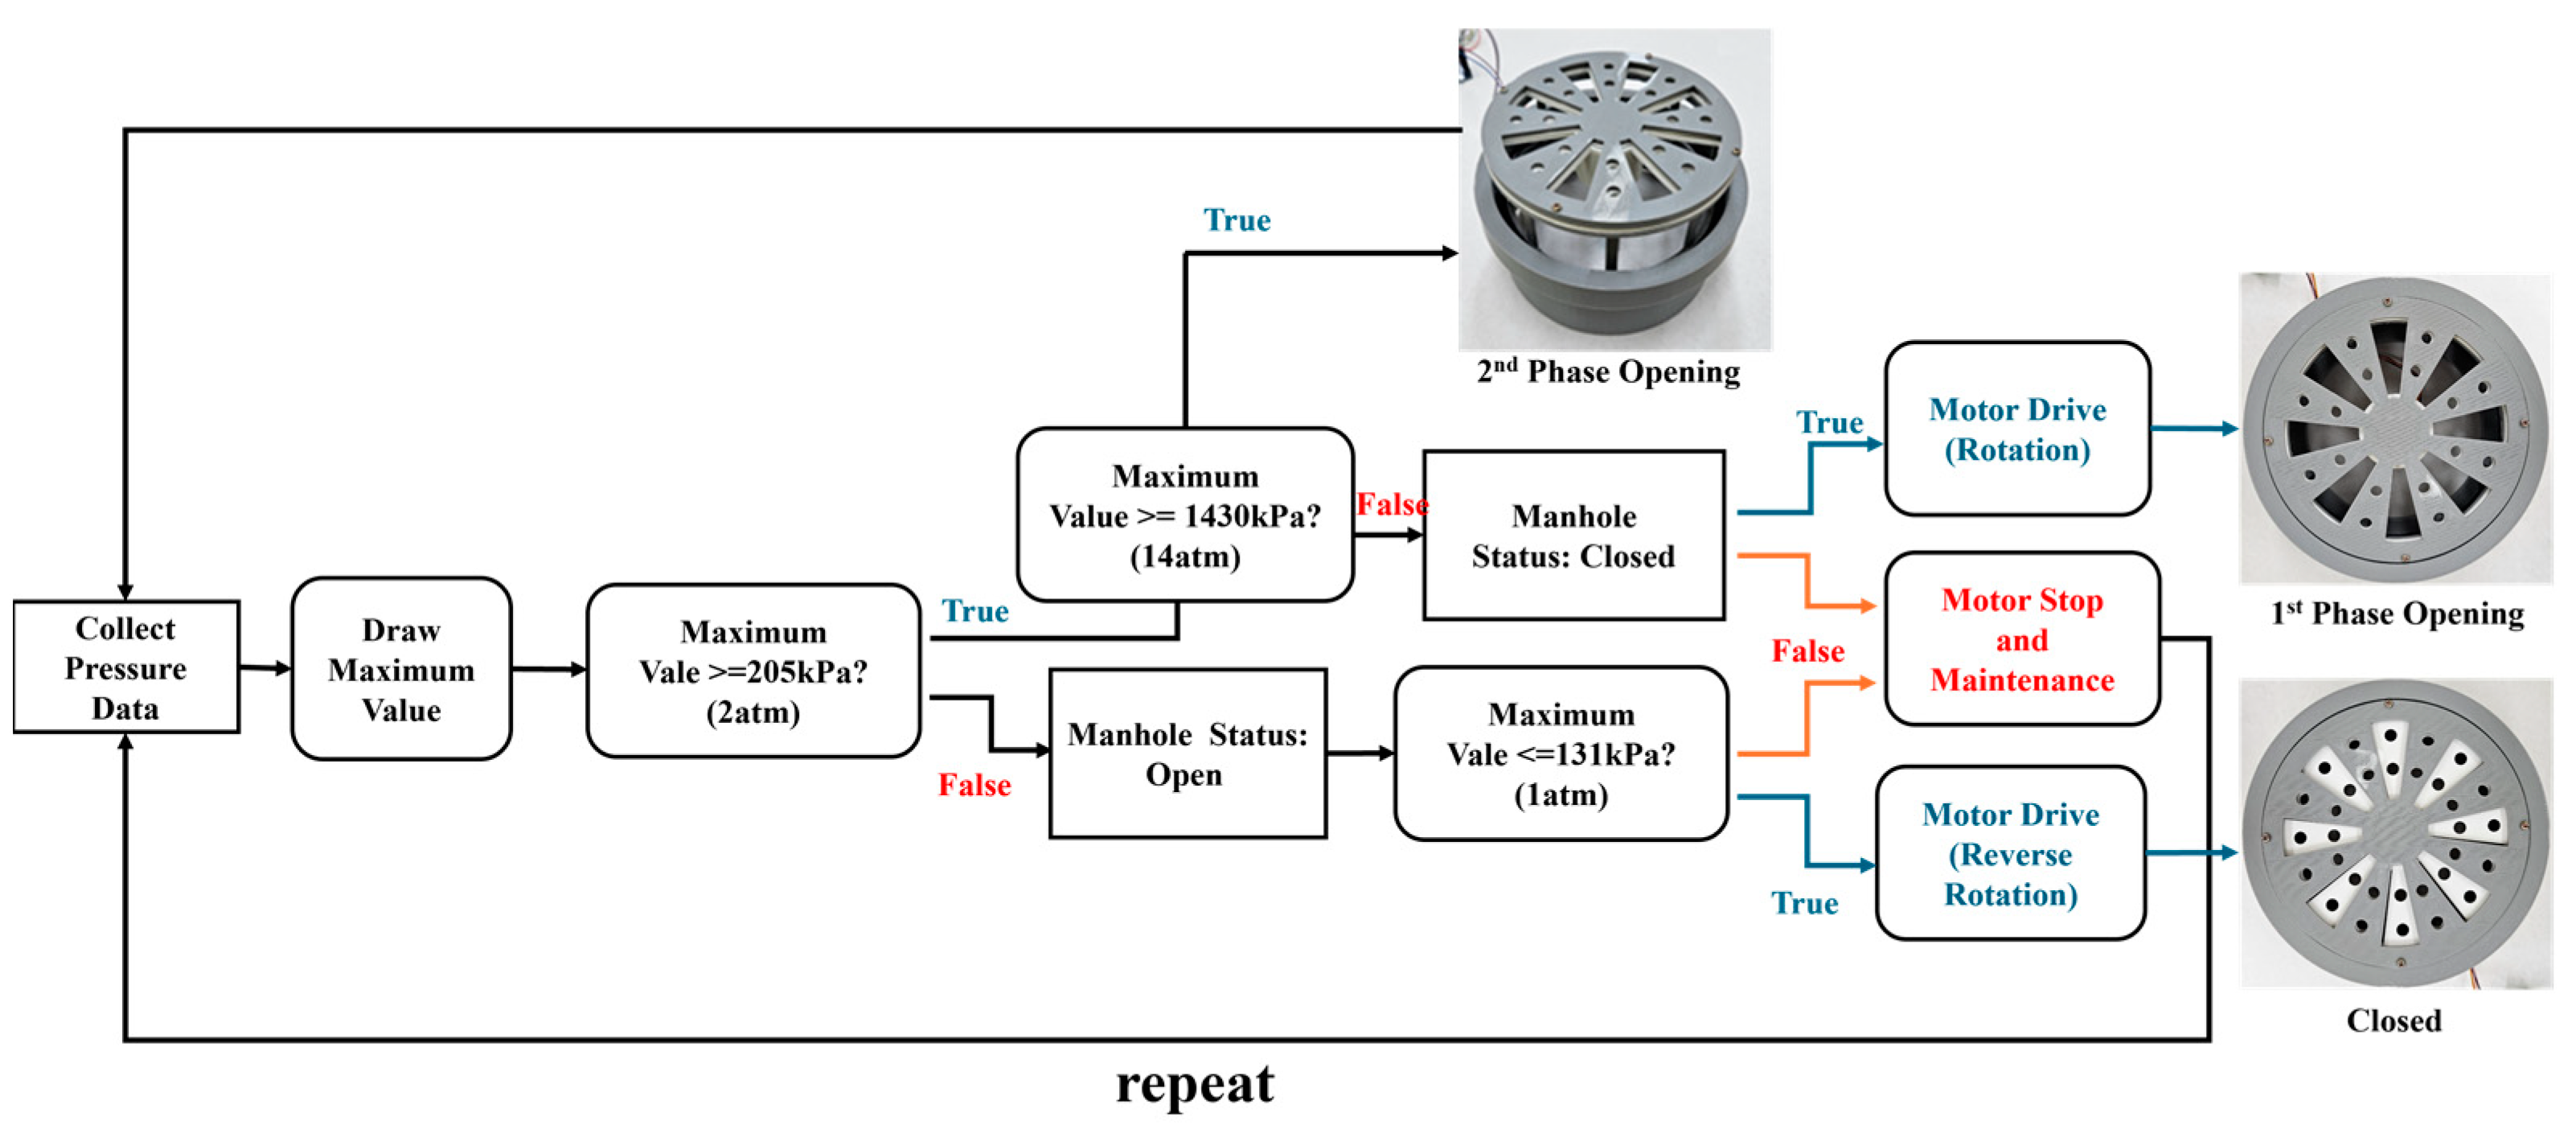
  • First Threshold Check (2 atm/205 kPa)
    If the maximum measured pressure is at least 205 kPa, the system sets the manhole to “open” status (i.e., first-phase control). While the manhole is open, if the measured pressure later drops to or below 131 kPa (safe level), the stepper motor rotates in reverse, returning the manhole to “closed”. Conversely, if the manhole is open and the pressure remains above 131 kPa, the motor stops and a maintenance state is triggered.
  • Second Threshold Check (14 atm/1430 kPa)
    If the sensor—located approximately two meters below the manhole cover—detects a maximum pressure below 205 kPa (i.e., not meeting the threshold for first-phase, motor-driven control), the system then checks whether the pressure exceeds 1430 kPa (14 atm). Upon reaching or surpassing this level, the manhole cover naturally rises in response to the hydraulic force, triggering the second-phase control. In this elevated position, the cover remains “closed” from above to withstand extremely high internal pressures. Depending on subsequent flow conditions, the motor may either initiate or shut off. This dual-step approach ensures a rapid response to abrupt surges—providing an early opportunity for the motorized system to relieve pressure—while still maintaining a fail-safe mechanism if the first-phase control proves insufficient.
After these checks, the algorithm repeats, enabling continuous, real-time adjustment of the manhole cover. By incorporating two distinct thresholds—one for initiating first-phase control (opening) and another for second-phase control (staying closed under extreme loads)—the system aims to reduce the risk of manhole cover displacement while allowing for more nuanced, stepwise regulation of internal pressure.

2.2. Theoretical Basis

A motor with sufficient power is required to rotate the 5 kg manhole blade in the smart manhole. Therefore, the minimum torque of the motor was calculated to select the most optimal motor. Equation (1) is the equation used to calculate torque during the rotational motion of an object:
τ = I × α
Assuming an initial angular velocity of 0 and a rotation of 22.75° around the disk’s center within 1 s, the angular acceleration is 0.396 rad/s2. The moment of inertia was confirmed to be 2.72 kg∙m2 using Fusion 360, and according to Equation (1).
According to the results of the reference [1], during intense rainfall exceeding 30 mm per hour, water begins to gush out of the manhole cover after 1 min and 22 s, and the manhole cover dislodges after 1 min and 25 s. In low-lying areas, the likelihood of backflow caused by rainwater inflow increases. Equation (2) is the flow rate equation, where the flow rate is expressed as the product of the cross-sectional area and the velocity [20]:
Q = A 1 × v 1
The hydraulic pressure criteria were subdivided to ensure that the motor installed in the manhole operates at the precise moment. Accordingly, using Bernoulli’s equation (Equation (3)), the static pressure acting on the manhole cover based on rainfall was calculated by dividing the pressure into static pressure, dynamic pressure, and hydrostatic pressure:
P + 1 2 ρ v 2 + ρ g h = C o n s t a n t
The static pressure based on rainfall was extracted from the pre-regulation CFD model in the open step, serving as the reference [1,2,3].

2.3. Computational Fluid Dynamics

The Computational Fluid Dynamics (CFD) model was described, and the initial conditions, boundary conditions, velocity, and specifications for the analysis were established.
In this study, Autodesk® CFD (https://www.autodesk.com/au/products/cfd/overview, accessed on 19 March 2025) was employed to perform three-dimensional flow simulations of the proposed manhole design. The software enabled detailed visualization of velocity fields and pressure distributions under varying inflow conditions. Through iterative analyses, the efficacy of the two-step pressure relief mechanism in mitigating internal pressure spikes during extreme rainfall was confirmed. To perform CFD analysis, a 3D spatial domain for numerical analysis was created shown in Figure 4. The vertical pipe of the manhole was set to 2.5 m, based on the average manhole depth of 2.5 to 3 m. In Figure 4, boundary conditions and initial conditions were established for the top and bottom surfaces of the fluid. The boundary condition at the bottom surface of the fluid (the inlet of the manhole riser pipe) was set as a velocity type, with the velocity magnitude incrementally varied from 0.6 m/s to 15 m/s for the flow analysis. The boundary condition at the top surface of the fluid (the upper domain surface) was set as a pressure type, with a gauge pressure of 0, corresponding to atmospheric pressure.
A grid independence test was carried out to confirm the accuracy and reliability of simulation results by assessing the impact of grid resolution on computational outcomes. Five distinct grid setups were evaluated, featuring grid sizes ranging from 298,100 to 881,000 cells. The findings showed that increasing the grid resolution led to a minimal change in the predicted velocity, specifically from 51.21 m/s at the coarsest grid to 51.20 m/s at the finest grid, with negligible variation occurring beyond 495,200 cells. Consequently, a grid containing 881,000 cells was chosen for subsequent analyses to guarantee high precision while maintaining computational efficiency. The computational domain used in this study employed an unstructured Cartesian staggered grid system.
The computational grid employed in the analysis is an unstructured Cartesian staggered grid. The k-epsilon realizable turbulence model is employed to simulate turbulent flow. The PISO (Pressure-Implicit with Splitting of Operators) scheme is applied for coupling the pressure and velocity fields. The fluid considered is water, assumed to be incompressible and Newtonian, and the governing equations are used to analyze three-dimensional flows [21]. The conservation laws for continuity and momentum equations form the foundation for studying fluid flow and heat transfer during the cooling process. These equations are expressed as follows:
U i x i = 0
x j ρ U i U j = p x i + x j μ U i x j + U j x i 2 3 δ i j U l x l + x j ρ u i u j ¯
where Ui is the velocity vector, p is the static pressure, g is the gravitational acceleration, ρ is density assumed as a constant value [21].

3. Results

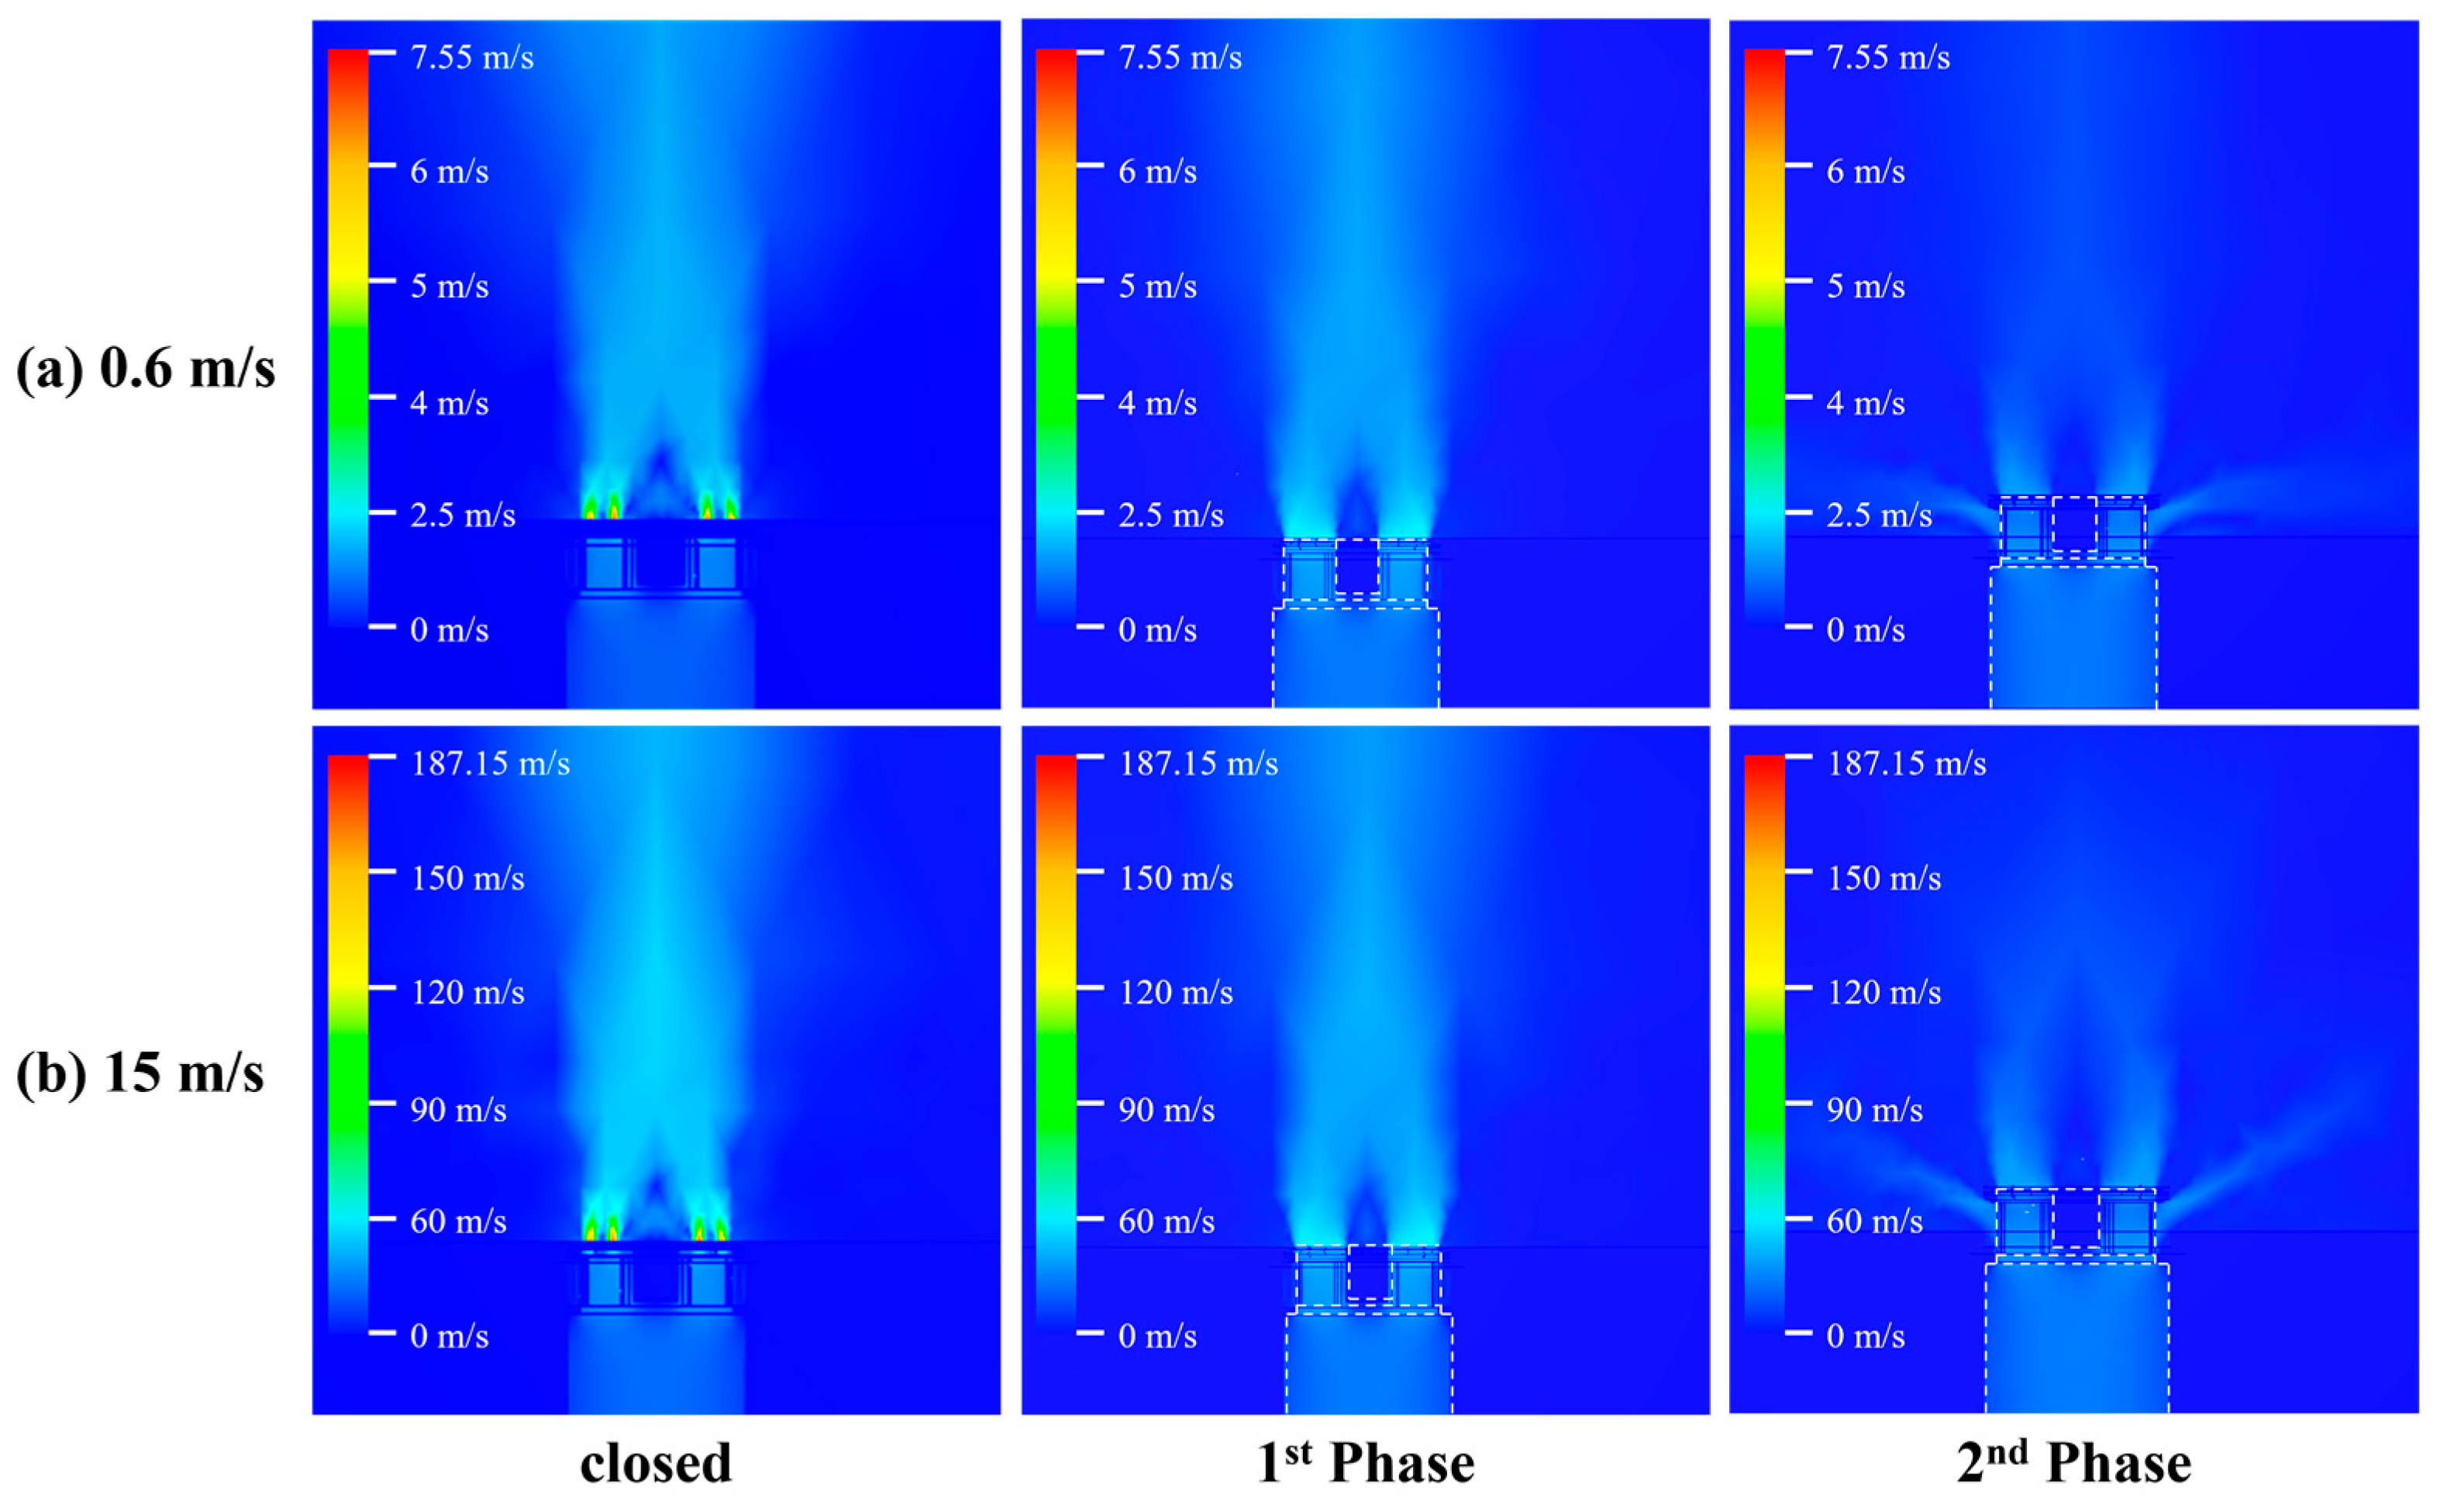
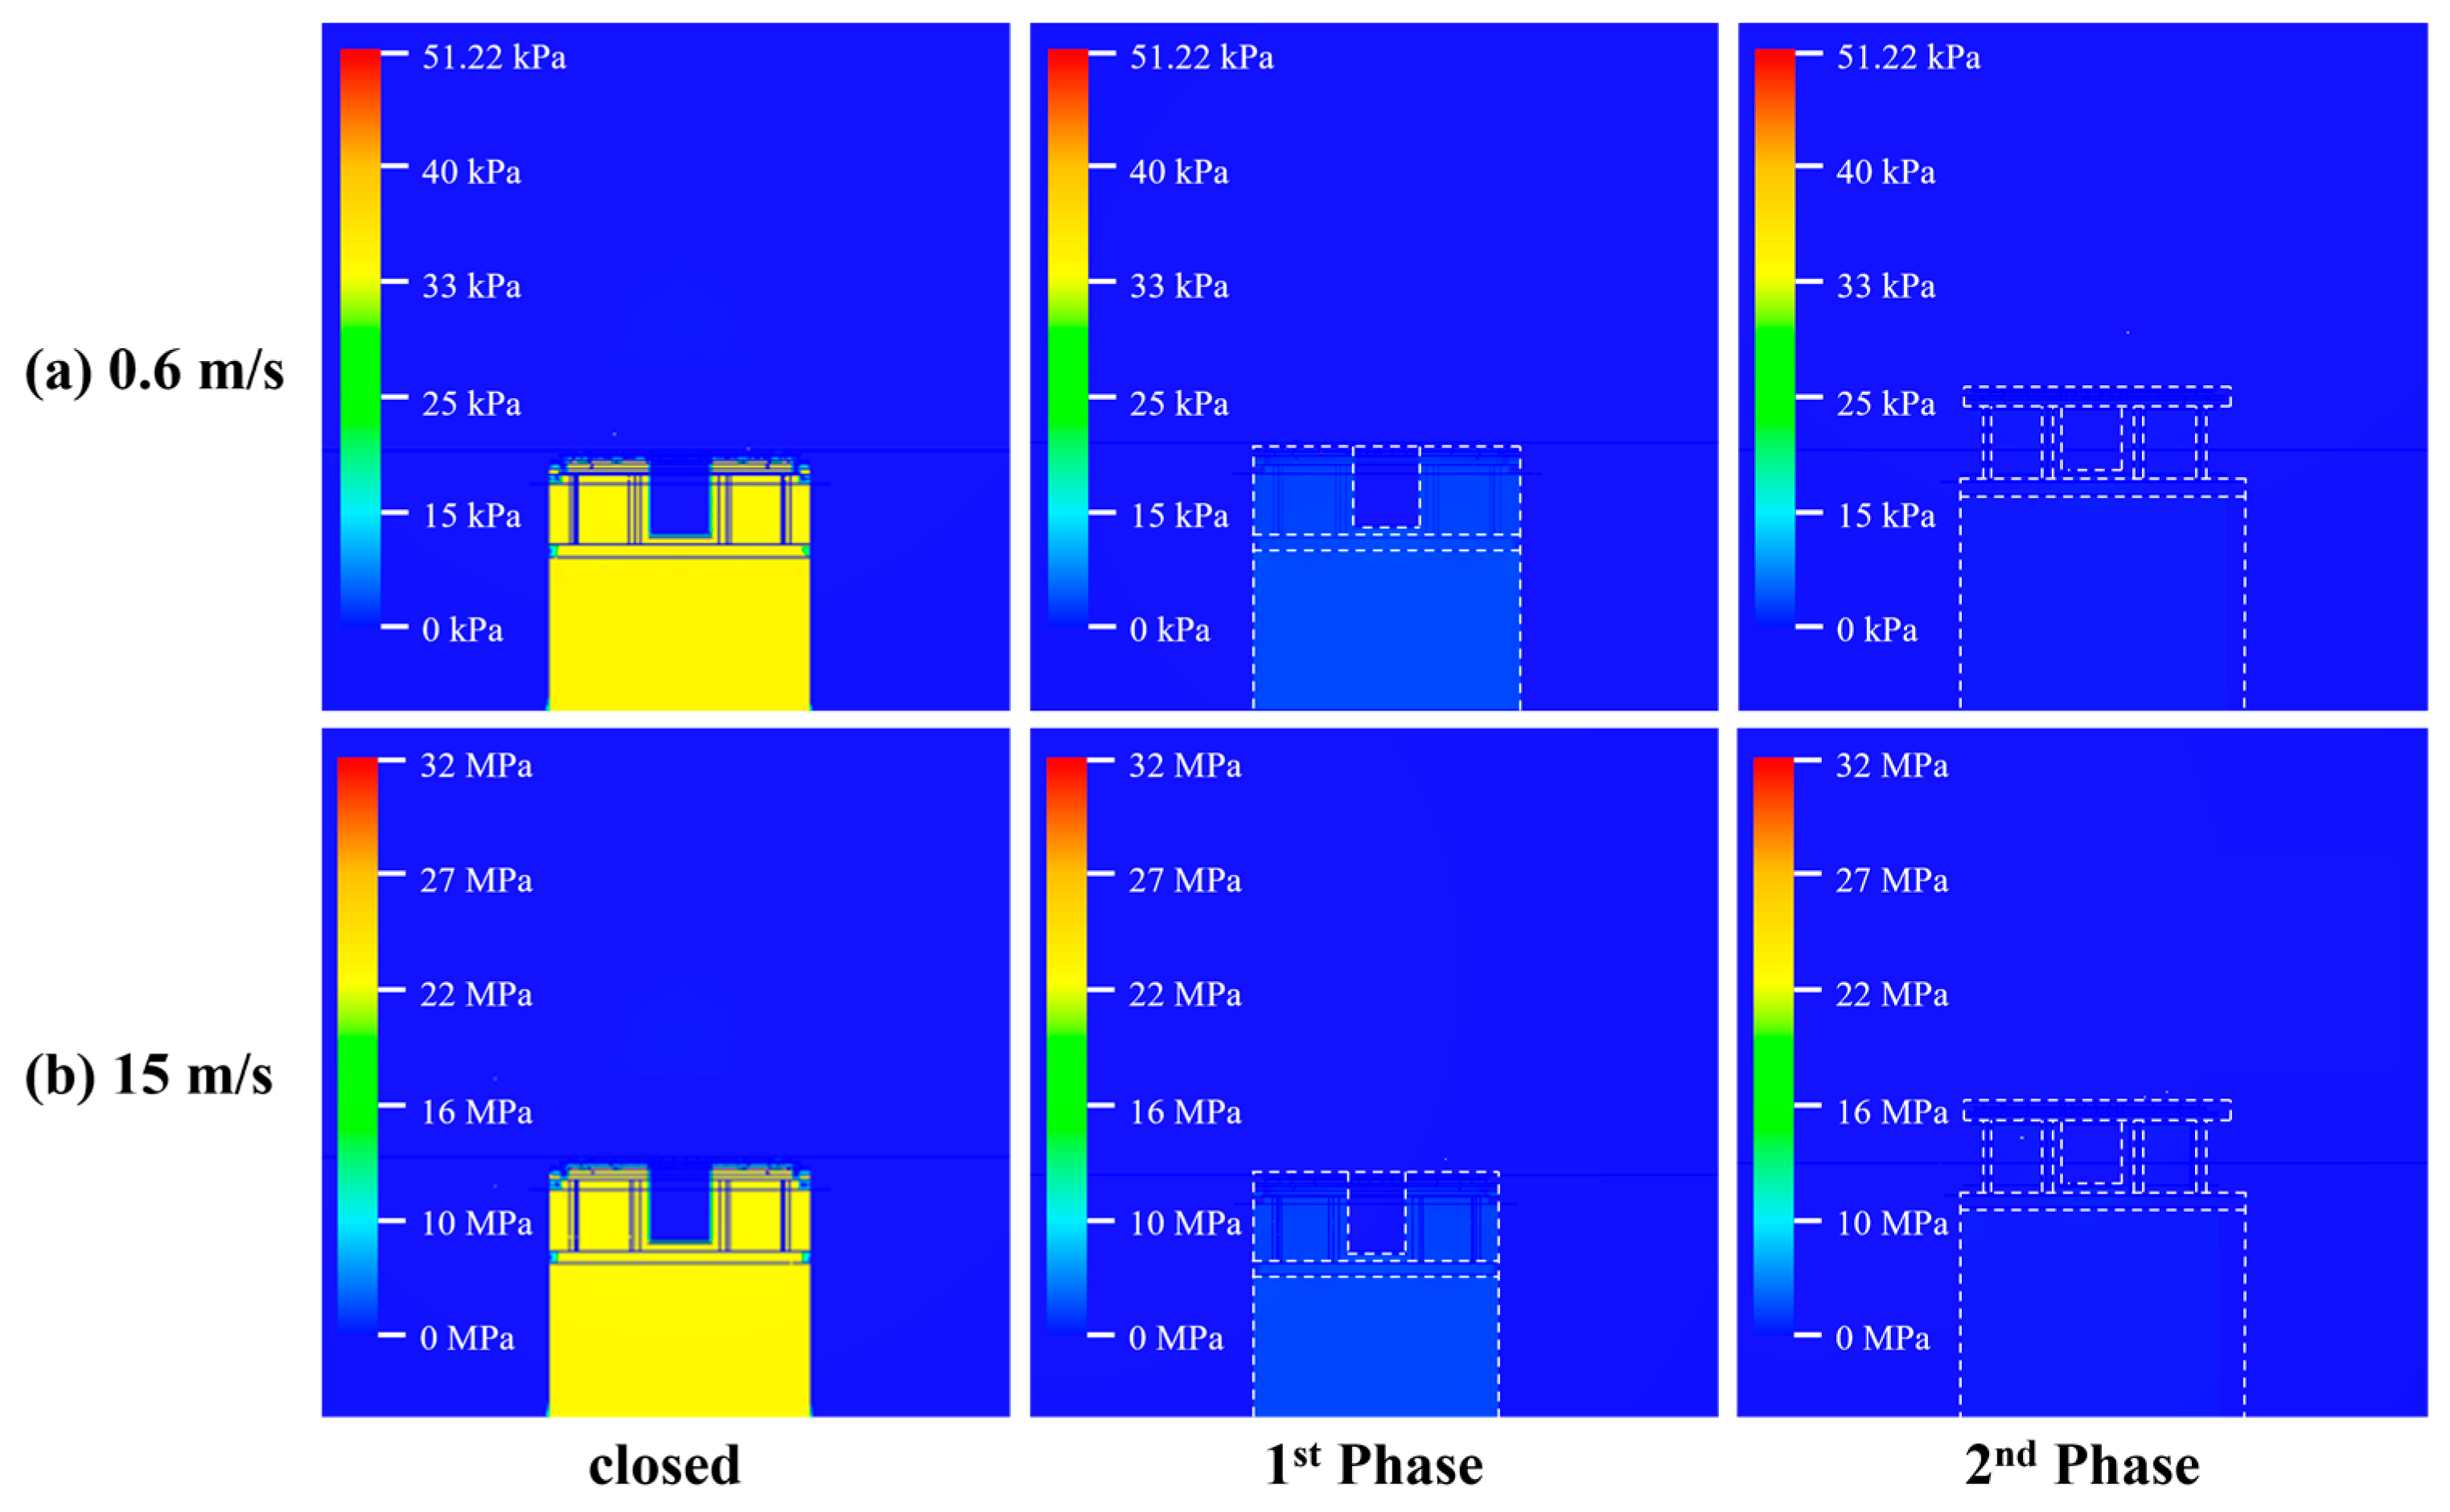
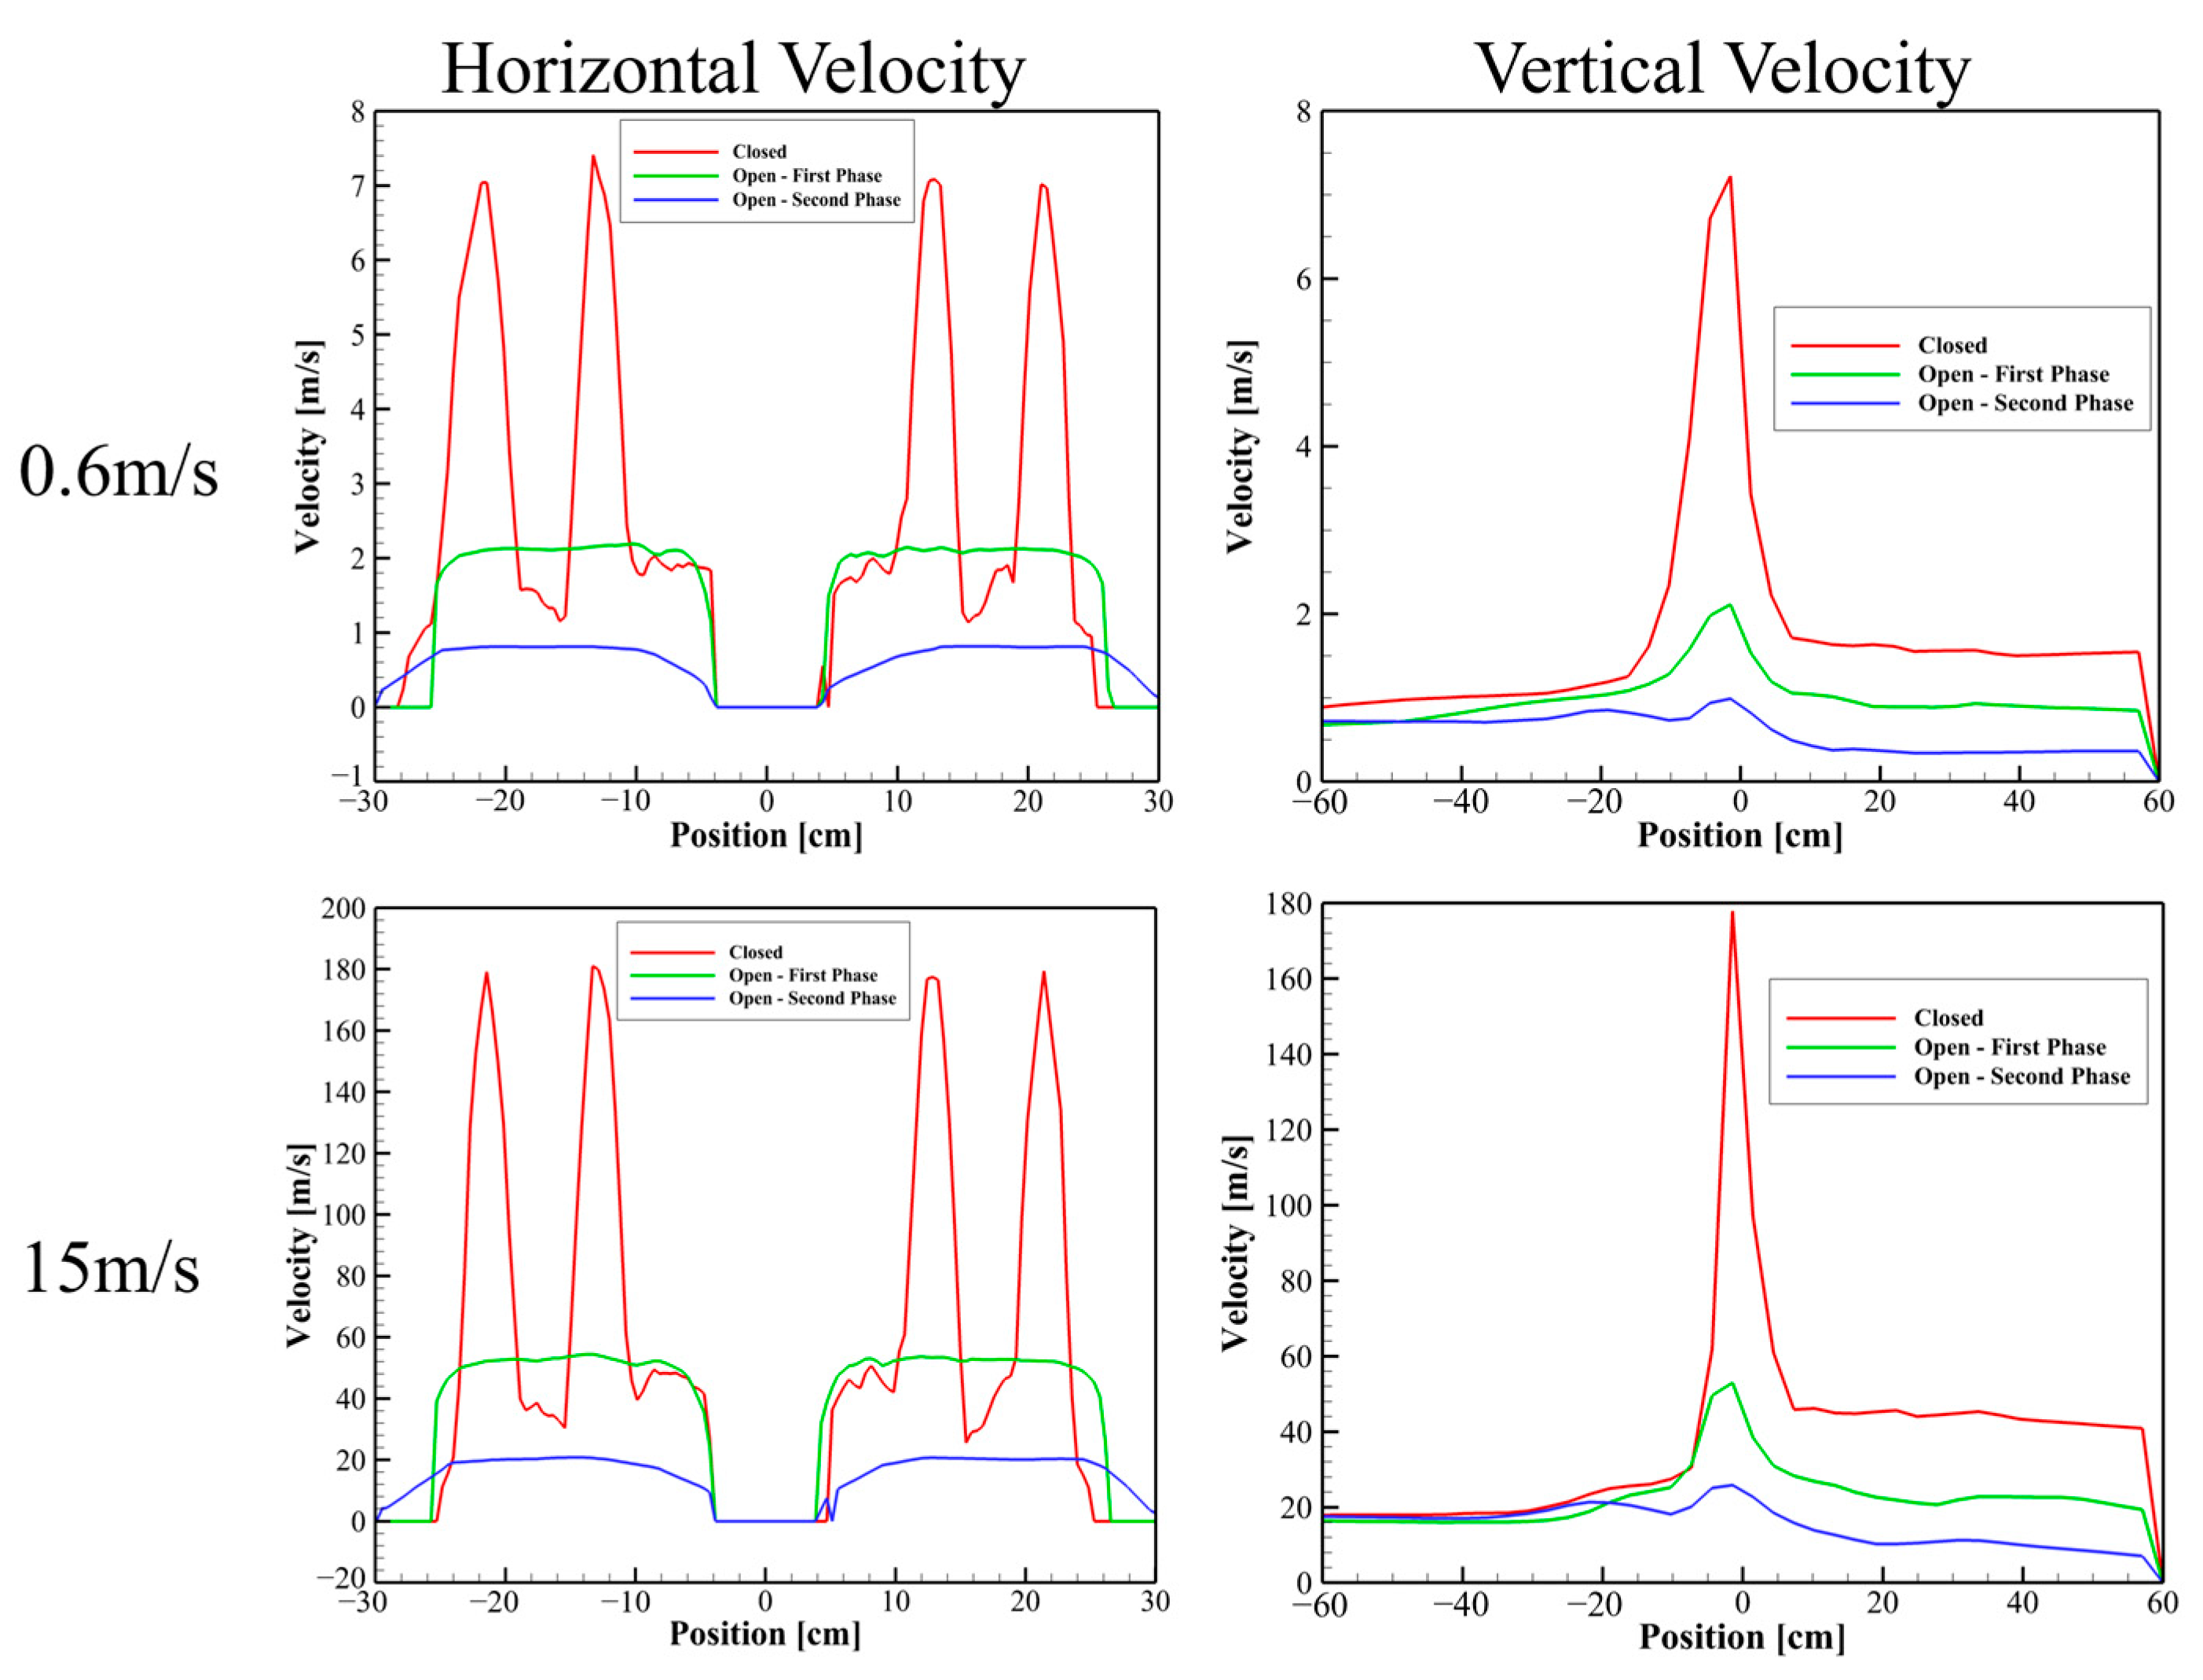
3.1. Simulation Results

Figure 5 presents the velocity contour plots for three operational states of the proposed smart manhole system—closed, first-step opening, and second-step opening—under two different inflow conditions (0.6 m/s and 15 m/s). In the closed configuration at 0.6 m/s, the velocity magnitudes around the top surface remain relatively low, with the flow primarily contained within the riser. In the closed condition, the difference in velocity between 0.6 m/s and 15 m/s is substantial—approximately 12–25 times greater at the higher inflow rate. At 0.6 m/s, the flow below the cover remains relatively controlled, generating only moderate pressure beneath the manhole lid. However, at 15 m/s, the incoming water strikes the closed cover with a much greater force, producing a localized high-velocity region that can lead to significantly elevated internal pressures. If the manhole cover is not securely fastened or if there are gaps in the sealing mechanism, this sudden surge in pressure can forcefully eject the cover, posing serious risks to nearby pedestrians, vehicles, and infrastructure. Consequently, ensuring a proper and robust seal in the closed state is critical for preventing potentially explosive displacements under high-velocity inflow conditions.
Once the system transitions to the first-step opening, a distinct jet flow pattern emerges around the rotating blade slots, allowing water to exit more freely while still limiting the outflow area. By the time the system reaches the second-step opening, an even larger portion of the cover is elevated, enabling a broader distribution of the outflow. These sequential changes in the velocity field illustrate the way incremental cover openings can effectively modulate flow discharge, keeping internal pressures in check at relatively modest inflow velocities.
When subjected to a much higher inflow velocity of 15 m/s, the contrast in the velocity contours becomes more pronounced. In the closed state, the riser’s inflow impinges on the underside of the manhole cover, creating localized high-velocity regions just below the cover but preventing the water from escaping. Under the first-step opening, these high-velocity jets begin to exit through the rotating-blade openings, forming stronger but more focused outflow pathways. In the second-step opening, the combined effects of the rotating blade and the vertical lift provide a substantially larger discharge area, redistributing the high-velocity jets across a broader span. This expansion reduces the likelihood of pressure buildup beneath the cover, illustrating the system’s capacity to handle extreme flow conditions by progressively activating each operational step.
Overall, the velocity contours in Figure 5 confirm that the two-stage opening mechanism not only alters the outflow pattern but also mitigates potential surge pressures. At lower inflow speeds, each successive opening step gently directs the flow upward, minimizing abrupt pressure changes. Under higher inflow speeds, the partial and full openings disperse strong jets more effectively, reducing localized velocity peaks and lowering the risk of manhole cover displacement. These findings underscore the importance of a multi-step control strategy for maintaining system integrity and public safety during both moderate and extreme flow events.
In Figure 6, the pressure fields for various flow conditions clearly indicate that the highest pressure zones are concentrated around the immediate vicinity of the manhole. As water exits the manhole cover and transitions into the open domain, this high-pressure region transforms into high flow velocity. Comparing the closed, first-step, and second-step configurations, it becomes evident that the closed state traps a significant amount of pressure within the riser, whereas the incremental opening of the manhole through one-step and then two-step relief mechanisms progressively decreases the internal pressure. The first-step opening provides an initial outflow path, effectively lowering the overall pressure in the manhole chamber, while the second-step opening further expands the outlet area, resulting in a more pronounced pressure gradient and a greater net reduction in pressure.
Additionally, the simulations reveal that the total internal pressure tends to raise as the inflow velocity increases. Under high inflow velocities, the pressure gradients near the manhole cover are larger, though still mitigated by the two-step opening mechanism. Once the system transitions to the second step, the fluid can escape more freely, thereby preventing excessive buildup of pressure. This multi-stage approach allows the manhole to handle varying flow rates more effectively: the closed state accommodates lower flow conditions, whereas the two-step opening design caters to moderate and extreme flow scenarios by strategically redistributing pressures into controlled outflow velocities.
Figure 7 illustrates how the velocity distribution inside and around the manhole changes as the cover transitions from fully closed (red line) to first-step (green line) and then to second-step (blue line), under two different inflow velocities: 0.6 m/s (upper figures) and 15 m/s (lower figures). In both the vertical and horizontal directions, the closed configuration exhibits the largest velocity peaks, reflecting a severe buildup of flow speed beneath the unvented cover. At 0.6 m/s, the closed state peaks around 7–8 m/s, whereas opening the manhole in the first step reduces these peaks to roughly 3–4 m/s, and the second step further drops them to under 2 m/s. This progressive decrease indicates that increasing the outflow area incrementally alleviates the bottleneck that drives up internal velocities. When the inflow velocity is raised to 15 m/s (lower figures), the magnitude of these velocity peaks is much higher for the closed condition—on the order of 180–200 m/s in some cross-sections. By moving to the first-step opening, those extreme peaks fall closer to 60–80 m/s, and in the second-step opening, the peak velocities diminish further to around 20–40 m/s. Notably, across all scenarios, the minimum velocities remain comparatively low in regions away from the narrowest flow paths or near the outflow edges. Overall, the data confirm that each additional phase of opening substantially moderates velocity surges, demonstrating how a multi-step design can mitigate high-speed jets and the associated pressure risks inside the manhole.
In Figure 8, the pressure profiles at different cross-sections (horizontal on the left, vertical on the right) are shown for closed (red), first-phase (green), and second-phase (blue) manhole conditions. In the upper plots, where the inlet velocity is relatively low (e.g., 0.6 m/s), the closed configuration leads to noticeable pressure fluctuations, sometimes spiking above 4–5 kPa in the horizontal plane and approaching 40 kPa in the vertical plane. Once the manhole transitions to the first-phase opening, these peaks are markedly reduced—green curves remain below 2–5 kPa. By the second-phase opening, the pressure becomes nearly uniform at or near 0 kPa in most regions (blue curves), indicating that the additional outflow area more effectively disperses fluid buildup and stabilizes internal pressure at lower levels.
The lower plots correspond to a significantly higher inlet velocity (on the order of 15 m/s), where the closed manhole shows extreme pressure accumulation, exceeding 1200 kPa in the horizontal cut and reaching around 23,000 kPa in the vertical section. This dramatic rise highlights the potential for cover displacement if no relief mechanism is available. However, with the first-step opening, pressure maxima drop to below 1500 kPa, and in the second-step opening, they are brought down to only a few hundred kilopascals. As in the lower-inflow case, the progressive increase in outflow cross-section effectively mitigates high-pressure zones, underscoring the importance of a multi-step control strategy for safely handling large surges of incoming water.
Figure 9 compares the horizontal velocity and pressure distributions at various inflow velocities—0.6 m/s, 1 m/s, 3 m/s, 5 m/s, 10 m/s, and 15 m/s—highlighting how changes in the manhole’s internal structure can modify flow characteristics under increasingly demanding conditions. In the velocity plots (left column), the pink curves representing 15 m/s inflow exhibit the highest peaks, often surpassing 180 m/s near the central outflow regions if the cover opening is relatively constrained. As the inflow velocity drops (e.g., 10 m/s in orange, 5 m/s in gray, and 0.6 m/s in green), these peaks become progressively smaller, reflecting less intense jet formation within the manhole. Notably, the velocity profiles flatten and broaden at the lower inflows, suggesting that the larger openings in the redesigned manhole effectively disperse the flow across a wider cross-section. By distributing the fluid more evenly, the system mitigates localized high-speed jets that could otherwise lead to sudden pressure surges or cover dislodgment.
The pressure curves (right column) similarly reveal a pronounced drop-off as flow transitions away from the inflow region. At 15 m/s, the manhole registers pressure spikes on the order of hundreds to over a thousand kilopascals in localized zones, whereas at 3 m/s or below, peak pressures remain relatively modest. This indicates that the increased cross-sectional openings and pressure relief mechanisms introduced by the smart manhole design help regulate not only the velocity but also the associated pressure buildup. In practice, this means that even if a high-velocity inflow occurs, the manhole’s internal structure can redirect and dissipate the incoming fluid energy, keeping pressures within safer limits. Consequently, the multi-step manhole configuration offers a robust means of handling a broad spectrum of inflow rates, reducing the likelihood of abrupt cover ejections and improving overall urban drainage reliability.
We can estimate how much pressure and velocity can drop or “flatten” when moving from the closed to the first-step and then the second-step opening, based on the typical values shown in earlier tables (e.g., a 30 mm/h rainfall scenario and an initial velocity on the order of 39.5 m/s in the fully closed state). In terms of velocity flattening, transitioning from the fully closed state (approximately 39.5 m/s) to the first-step opening (7.57 m/s) represents a drop of around 80.8%. Further opening into the second step reduces the velocity to roughly 2.62 m/s, yielding an additional 65.4% decrease relative to the first-step condition. Overall, the velocity falls by about 93.4% from the closed configuration to the second-step state. These figures illustrate that even a partial opening substantially moderates the internal flow’s maximum speed, while the second-step opening ensures a more uniform flow distribution and mitigates high-speed jets.
A similar trend is observed for pressure relief. From the closed condition (around 740 kPa) to the first-step opening (28.6 kPa), the pressure declines by approximately 96.1%, and it decreases by a further 88.1% when transitioning from first-step (28.6 kPa) to second-step (3.4 kPa). Overall, this corresponds to nearly a 99.5% reduction compared to the fully closed scenario. These results underscore the effectiveness of the two-phase design, which not only eliminates the largest pressure spikes but also maintains consistently lower pressures that lessen the risk of manhole cover displacement under extreme inflow conditions.

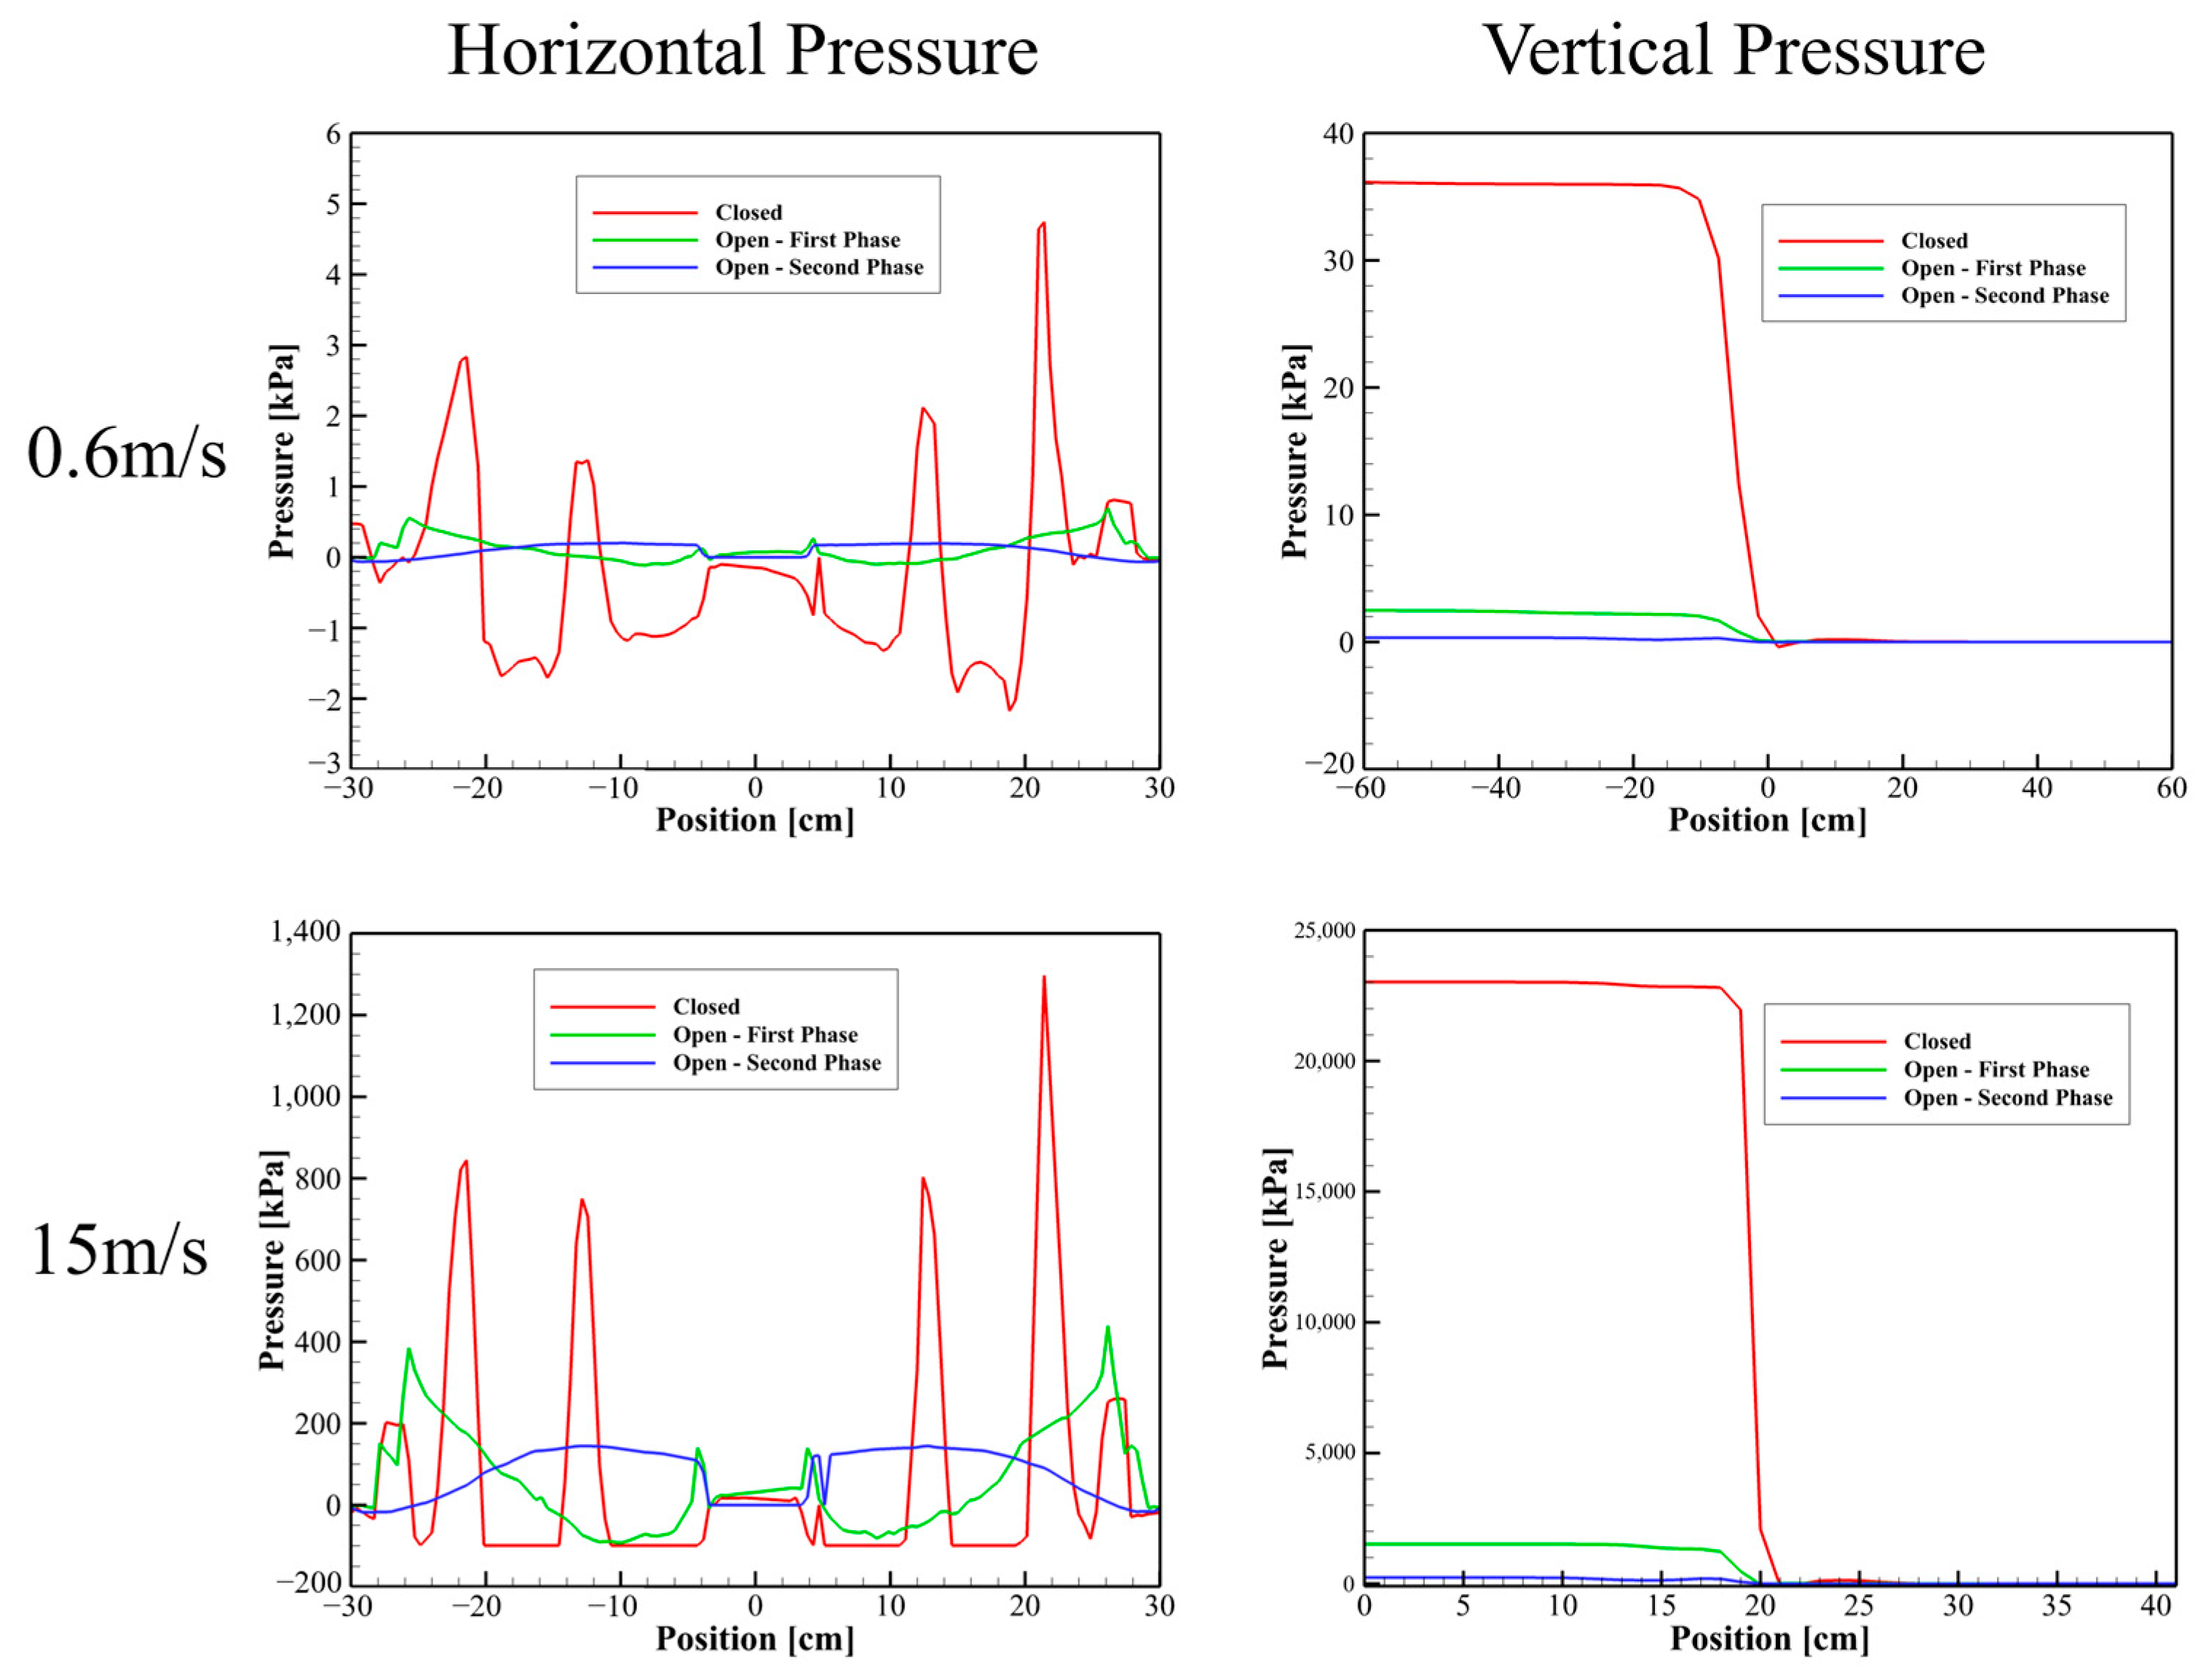
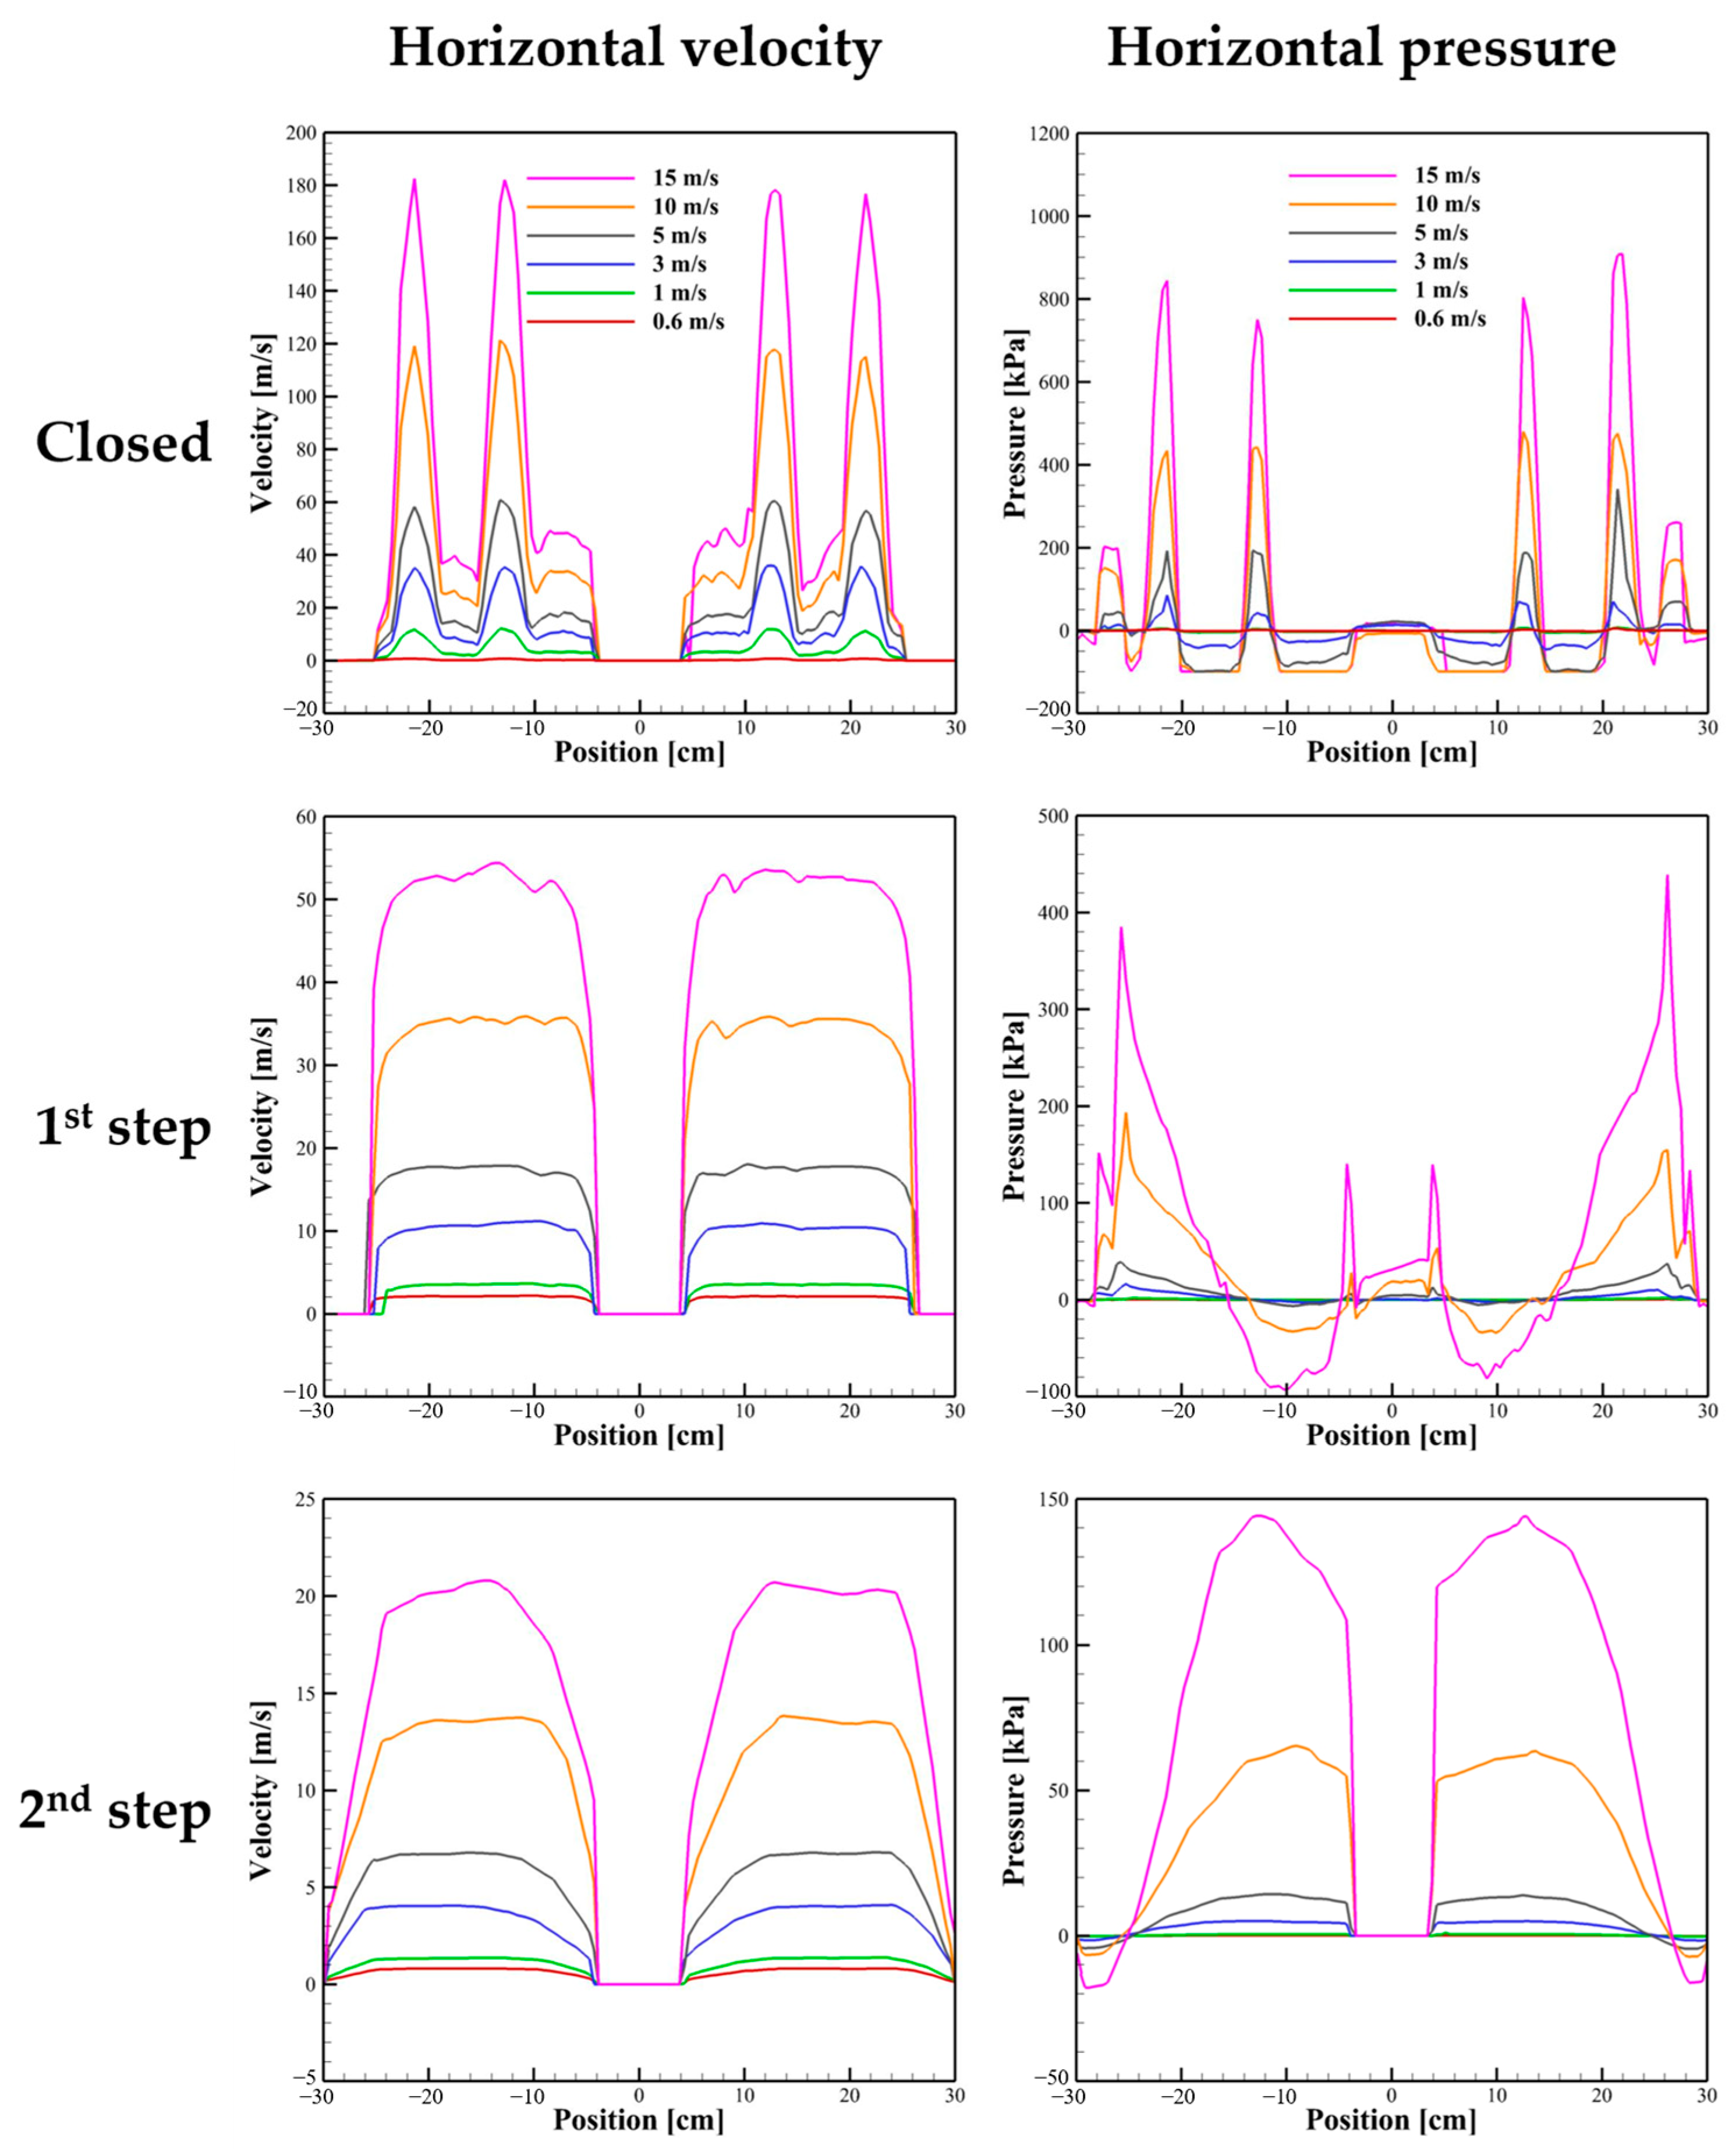
3.2. Analysis of Calculated Hydraulic Pressure Results

The hydraulic pressure corresponding to each velocity was calculated using Equations in Chapter 2.2 and presented in Table 1 as the fluid velocity increased from 0.6 m/s to 15 m/s. One additional observation that can be drawn from these results is the pronounced effect of incremental opening on both velocity and dynamic pressure within the manhole. In the closed configuration, the flow is severely restricted, causing a rapid buildup of velocity (39.5 m/s) and dynamic pressure (740 kPa). Once the manhole transitions to the first-step opening, these values drop dramatically, reflecting the ability of the partially opened cover to disperse accumulated pressure. By the second-step opening, the velocity (2.62 m/s) and dynamic pressure (3.40 kPa) reach comparatively safe levels. This underscores the advantage of a multi-step design: each additional stage of opening not only provides a larger cross-sectional area for water to exit but also prevents critical pressure surges that could otherwise dislodge the manhole cover, thereby enhancing overall system safety even under continuous rainfall conditions of 30 mm/h.
The total pressure values presented in Table 1 illustrate the dramatic effect that inflow velocity and manhole cover configuration can have on internal pressure levels. At lower inflow speeds (0.6 m/s or 1 m/s), the total pressure remains within tens or hundreds of kilopascals, which is more manageable and unlikely to dislodge a properly secured cover. However, as the inflow velocity increases to 10 m/s or 15 m/s, the peak total pressure can rise into the megapascal range, indicating the potential for forceful backflow rainfall events. Such high local pressures—though possibly localized to small zones—could be sufficient to lift or even eject a manhole cover if no pressure relief mechanism is in place.
Notably, the first-step and second-step openings significantly reduce internal pressure, reinforcing the utility of a multi-stage relief approach. In the closed configuration at 15 m/s, the total pressure reaches approximately 23,000 kPa; transitioning to the first-step opening drops this to around 1511 kPa, and the second-step opening further decreases it to 237 kPa. This progression confirms that the increase in outflow area meaningfully dissipates the built-up pressure, thereby lowering the likelihood of cover displacement under high-velocity inflow conditions. Nevertheless, it would be prudent to emphasize in any final discussion that real-world boundary conditions—such as pipe geometry, frictional losses, and exit flow conditions—could moderate or shift these values somewhat. In practice, these modeled results highlight the importance of providing stepwise capacity for pressure relief in manhole designs, ensuring that even unexpectedly high flows can be managed without catastrophic cover failure.

4. Conclusions

In this study, a self-pressure-controlled smart manhole system was developed to address the persistent threat of cover dislodgment and associated accidents during extreme rainfall events. By integrating a motor-driven rotating blade for initial flow regulation (first-step opening) and a lifting mechanism to further relieve internal pressure (second-step opening), the system successfully mitigates the sudden surges that have historically led to manhole failures. Through both computational fluid dynamics (CFD) simulations and physical prototyping, we demonstrated that incremental cover openings effectively dissipate localized high-velocity jets and extreme pressures that typically accumulate beneath sealed manhole covers. In particular, our findings show that the stepwise design reduces velocity by up to 93.4% and pressure by as much as 99.5% compared to the closed state, emphasizing the potential of multi-stage relief strategies in urban drainage systems.
Moreover, the CFD analyses revealed that while a single closed configuration can confine and amplify incoming flow to highly elevated pressure levels—sometimes reaching the megapascal range at high inflow velocities—progressively enlarging the outflow area offers an important safeguard. Even at inflow speeds as high as 15 m/s, the proposed manhole maintains internal pressures at levels unlikely to dislodge a properly installed cover. These results highlight the design’s robustness across a wide range of flow conditions, from light rainfall to severe downpours. Beyond preventing dangerous cover ejections, the system’s capacity to control and modulate flows can minimize hazards for pedestrians, vehicles, and infrastructure.
Finally, while the simulation-driven approach underscores the overall effectiveness of this smart manhole system, real-world factors—such as pipe geometry, frictional losses, and debris accumulation—can affect its performance. Future research should incorporate extended field testing under diverse hydraulic and environmental conditions. Nevertheless, the presented dual-phase pressure regulation concept offers a practical, cost-effective solution that can be readily implemented in existing urban drainage networks. By actively managing internal manhole pressures and enhancing overall safety, this system advances the resilience of infrastructure against increasingly frequent and intense rainfall events.

Author Contributions

Conceptualization, J.K., J.-H.M. and S.L.; methodology, J.-H.M. and S.L.; software, J.K.; validation, J.K., J.-H.M. and S.L.; formal analysis, J.K. and S.L.; investigation, J.K. and S.L.; resources, J.-H.M.; data curation, J.K.; writing—original draft preparation, J.K. and S.L.; writing—review and editing, J.-H.M. and S.L.; visualization, J.K.; supervision, J.-H.M. and S.L.; project administration, J.-H.M.; funding acquisition, J.-H.M. All authors have read and agreed to the published version of the manuscript.

Funding

This research was supported by “Regional Innovation Strategy (RIS)” through the National Research Foundation of Korea (NRF) funded by the Ministry of Education (MOE) (2021RIS-004). Also, this work was supported by the Starting growth Technological R&D Program (RS-2024-00467958) funded by the Ministry of SMEs and Startups (MSS, Republic of Korea).

Data Availability Statement

Data is contained within the article.

Conflicts of Interest

The authors declare no conflicts of interest.

Abbreviations

CFDComputational Fluid Dynamics
FIRMFlood Inundation and Recession Model
GISGeographic Information System
k–εk-epsilon (turbulence model)
kPaKilopascal
mm/hMillimeters per hour
m/sMeters per second
PIVParticle Image Velocimetry
PISOPressure-Implicit with Splitting of Operators
SWMMStorm Water Management Model
VOFVolume of Fluid

Nomenclatures

ACross-sectional area, m2
ETotal energy (in fluid flow/thermodynamics), J/kg
gGravitational acceleration, m/s2
hHydraulic head (water column height), m
IMoment of inertia
kTurbulent kinetic energy (in k–ε model), m2/s2
pPressure (general/dynamic, depending on context), Pa or kPa
PrPrandtl number, -
QFlow rate, m3/s
tTime, s
UiVelocity vector components, m/s
vFlow velocity, m/s
αAngular acceleration, rad/s2
δijKronecker delta
εTurbulent dissipation rate (in k–ε model), m2/s3
μDynamic viscosity, Pa·s
μtTurbulent viscosity, Pa·s
ρDensity of fluid, kg/m3
τTorque, J/rad
θAngle, rad
ωAngular velocity, rad/s

References

  1. Kim, T.-H. The Risk of Manhole Cover Displacement Due to Heavy Rainfall? National Disaster and Safety Research Institute of Republic of Korea. 2014. Available online: https://www.mois.go.kr/frt/bbs/type010/commonSelectBoardArticle.do?bbsId=BBSMSTR_000000000008&nttId=42694 (accessed on 23 July 2014).
  2. The Hankyoreh. Torrential Downpour Turns Seoul’s Manholes into Death Traps. 2023. Available online: https://english.hani.co.kr/arti/english_edition/e_national/1054420.html (accessed on 11 August 2022).
  3. Wang, J.; Vasconcelos, J. Manhole Cover Displacement Caused by the Release of Entrapped Air Pockets; Auburn University: Auburn, AL, USA, 2018. [Google Scholar] [CrossRef]
  4. Heo, P. Manhole to Prevent Stormwater Backflow. KR102145783B1, Filed 4 July 2018, and Issued 12 August 2020. Available online: https://patents.google.com/patent/KR102145783B1/ko?inventor=%ED%97%88%ED%8F%89%EC%A7%84 (accessed on 26 March 2025).
  5. Kim, S. Flow Control Device for Stormwater Manholes. KR101301697B1, Filed 18 October 2011, and Issued 27 August 2013. Available online: https://patents.google.com/patent/KR101301697B1/ko?oq=KR101301697B1 (accessed on 15 November 2024).
  6. Kim, J. Stormwater Manhole with Infiltration-Type Flood Control Function. KR101962037B1, Filed 7 April 2017, and Issued 26 March 2019. Available online: https://patents.google.com/patent/KR101962037B1/ko?oq=KR101962037B1 (accessed on 26 March 2025).
  7. Choi, G. Backflow Prevention Device for Manhole Connected to Sewer Pipe. KR102008815B1, Filed 4 July 2019, and Issued 2 August 2019. Available online: https://patents.google.com/patent/KR102008815B1/ko?oq=KR102008815B1 (accessed on 15 November 2024).
  8. Lee, S. Double Manhole Cover with Hydraulic Pressure Adjustment Function. KR100987500B1, Filed 18 October 2011, and Issued 27 August 2013. Available online: https://patents.google.com/patent/KR100987500B1/ko?oq=KR100987500B1 (accessed on 26 March 2025).
  9. Nam, D. Manhole Cover for Preventing Displacement with Hydraulic Pressure Adjustment Function. KR101448569B1, Filed 18 February 2014, and Issued 1 October 2014. Available online: https://patents.google.com/patent/KR101448569B1/ko?q=(%EC%88%98%EC%95%95%EC%A1%B0%EC%A0%88%EA%B8%B0%EB%8A%A5%EC%9D%84%EA%B0%96%EB%8A%94%EC%9D%B4%ED%83%88%EB%B0%A9%EC%A7%80%EC%9A%A9%EB%A7%A8%ED%99%80%EB%9A%9C%EA%BB%91)&oq=%EC%88%98%EC%95%95%EC%A1%B0%EC%A0%88+%EA%B8%B0%EB%8A%A5%EC%9D%84+%EA%B0%96%EB%8A%94+%EC%9D%B4%ED%83%88%EB%B0%A9%EC%A7%80%EC%9A%A9+%EB%A7%A8%ED%99%80%EB%9A%9C%EA%BB%91 (accessed on 26 March 2025).
  10. Jeon, B.; Choi, K. Manhole Cover with Backflow Prevention Function. KR102619464B1, Filed 21 October 2022, and Issued 26 December 2023. Available online: https://patents.google.com/patent/KR102619464B1/ko?oq=KR102619464B1 (accessed on 26 March 2025).
  11. Lee, S.; Lee, Y. Design and Implementation of a Manhole Management System Using Wireless Communication. J. Digit. Ind. Inf. Stud. 2017, 13, 53–61. [Google Scholar]
  12. Lee, H. Design and Fabrication of a Manhole Floating Device Using 3D Printing and Structural Analysis. J. Korea Acad.-Ind. Coop. Soc. 2018, 19, 648–654. [Google Scholar]
  13. Gebregziabher, M.; Demissie, Y. Modeling Urban Flood Inundation and Recession Impacted by Manholes. Water 2020, 12, 1160. [Google Scholar] [CrossRef]
  14. Sifa, Y.B.; Baseka, V.G.; Masanja, M. Computational Fluid Dynamics of Manhole Overflow Due to Storm-water Inflow. J. Mekanika Indonesia 2020, 18, 33–48. [Google Scholar] [CrossRef]
  15. Mathurin, D.; Fuamba, M.; Mahdi, T.-F. Manhole Storage Capacity Influence on Transient Flow Modeling during Storm Sewer Flooding Event. J. Water Manag. Model. 2009, 17, 257–279. [Google Scholar] [CrossRef]
  16. Nabende, A.; Semwogerere, T.; Awichi, R.O. Mathematical Modelling of Sewage Overflow Through Pipe-Manhole Drainage Sewer Systems Using CFD: A Case of Mbale City, Eastern Uganda. East Afr. J. Eng. 2020, 2, 33–45. [Google Scholar] [CrossRef]
  17. Martins, R.; Rubinato, M.; Kesserwani, G.; Leandro, J.; Djordjević, S.; Shucksmith, J. On the Characteristics of Velocity Fields in the Vicinity of Manhole Inlet Grates During Flood Events. Water Resour. Res. 2018, 54, 6408–6422. [Google Scholar] [CrossRef]
  18. Beg, M.N.A.; Carvalho, R.F.; Lopes, P.; Leandro, J.; Melo, N. Numerical Investigation of the Flow Field inside a Manhole-Pipe Drainage System. In Proceedings of the Hydraulic Structures and Water System Management. 6th IAHR International Symposium on Hydraulic Structures, Portland, OR, USA, 27–30 June 2016; Crookston, B., Tullis, B., Eds.; USU Library: Logan, UT, USA, 2016; pp. 61–71, ISBN 978-1-884575-75-4. [Google Scholar] [CrossRef]
  19. Arao, S.; Mihara, T.; Kusuda, T. An Optimal Design Method of Storm Sewer Network Considered with Manhole Energy Loss. Doboku Gakkai Ronbunshu 1999, 1999, 109–120. [Google Scholar] [CrossRef] [PubMed]
  20. Munson, B.R. Fundamentals of Fluid Mechanics; John Wiley & Sons, Inc.: Hoboken, NJ, USA, 2013. [Google Scholar]
  21. Kim, D.Y.; Lee, B.; Kim, M.; Moon, J.H. Thermal assessment of lithium-ion battery pack system with heat pipe assisted passive cooling using Simulink. Therm. Sci. Eng. Prog. 2023, 46, 102230. [Google Scholar] [CrossRef]
Figure 1. Annual frequency of counted extreme rainfall events by year in Republic of Korea [1,2,3].
Water 17 00978 g001
Figure 2. (a) Schematic representation smart manhole. The manhole has an outer diameter of 648 mm, a cover diameter of 600 mm, and a total height of 141 mm. (b) The first-step operation shows the top cover partially open via motor-driven rotation to relieve internal pressure. (c) In the second-step operation, the cover is further lifted, providing additional pressure relief during extreme flow conditions.
Water 17 00978 g002
Figure 3. Manhole hydraulic pressure control algorithm.
Water 17 00978 g003
Figure 4. Manhole schematic and boundary conditions.
Water 17 00978 g004
Figure 5. Velocity contours for different opening step and water velocity cases.
Water 17 00978 g005
Figure 6. Pressure contours for different opening step and water velocity cases.
Water 17 00978 g006
Figure 7. Velocity profiles for different inlet velocities and opening steps.
Water 17 00978 g007
Figure 8. Pressure profiles for different inlet velocities and opening steps.
Water 17 00978 g008
Figure 9. Velocity and pressure for horizontal directions for different water inlet velocities.
Water 17 00978 g009
Table 1. Total pressure data according to inflow velocity.
Closed [kPa]1st Step [kPa]2nd Step [kPa]
0.6 m/s36.142.480.34
1 m/s101.077.010.97
3 m/s916.3560.358.74
5 m/s2537.62168.9224.31
10 m/s10,138.40678.20104.29
15 m/s23,027.401511.71237.35
Disclaimer/Publisher’s Note: The statements, opinions and data contained in all publications are solely those of the individual author(s) and contributor(s) and not of MDPI and/or the editor(s). MDPI and/or the editor(s) disclaim responsibility for any injury to people or property resulting from any ideas, methods, instructions or products referred to in the content.

