Article

Metabolomic Analysis of Both Microcystin-Producing and Microcystin-Free Microcystis aeruginosa Strains in Response to Exogenous Microcystin Exposure

1
College of Chemistry and Chemical Engineering, Linyi University, Linyi 276000, China
2
College of Life Sciences, Linyi University, Linyi 276000, China
3
State Key Laboratory of Lake Science and Environment, Nanjing Institute of Geography and Limnology, Chinese Academy of Sciences, Nanjing 210008, China
*
Author to whom correspondence should be addressed.
These authors contributed equally to this work.
Water 2025, 17(7), 993; https://doi.org/10.3390/w17070993
Submission received: 3 March 2025 / Revised: 23 March 2025 / Accepted: 26 March 2025 / Published: 28 March 2025

Abstract

:
Microcystis aeruginosa (M. aeruginosa), a key species in cyanobacterial blooms, is notably concerning due to its production of harmful microcystins (MCs). In this study, the differences in the ability of MC-producing and MC-free strains of M. aeruginosa to respond to the exogenous MCs (MC-LR) were compared. The results showed that at higher concentrations, MC-LR affected cell morphology, cell growth, photosynthetic efficiency, and induced oxidative stress in M. aeruginosa. Under high MC-LR concentration exposure, MC-producing strains showed a 14.7% reduction in cell density, accompanied by a 32% elevation in Vj and a 63.1% decline in FV/FM. MC-free strains showed cell density decreasing by 22.5%, Vj increasing 2-fold, and FV/FM dropping by 69.5%. The inhibitory effect of MC-LR at higher concentrations was found to be stronger in MC-free compared to MC-producing strains. In addition, MC-LR reduced the efficiency of photosystem II by blocking electron transfer from QA to QB; for MC-free strains, MC-LR may have acted as a signaling molecule affecting the targeting of QB on the D1 protein, thus leading to QB detachment from the protein complex. Metabolomics analysis showed that MC-LR affects arginine synthesis in M. aeruginosa and thus the synthesis and release of MCs.

1. Introduction

Extreme global climate change has increased the frequency of the occurrence of cyanobacterial blooms. Cyanobacterial blooms represent a water environmental problem that threatens the global ecosystem [1]. Microcystis aeruginosa (M. aeruginosa) is one of the major species responsible for cyanobacterial blooms [2], as it can release microcystins (MCs) into the water body through cell senescence, death, or lysis. The regulation of M. aeruginosa growth and MCs production has been extensively investigated globally. Traditionally, M. aeruginosa has been classified into MC-producing and MC-free strains. However, recent studies, including the findings from this experiment, suggest that some strains classified as MC-free may still produce trace amounts of MCs. For consistency, this paper retains the traditional classification of “MC-free strains”.
MC concentrations in natural water bodies vary significantly depending on factors such as eutrophication levels, seasonal dynamics, and geographic location. For example, a June 2014 study of 75 irrigable streams in the Piedmont region, USA, reported mean, median, and maximum MC concentrations of 0.29 µg L−1, 0.11 µg L−1, and 3.2 µg L−1, respectively [3]. In contrast, the maximum MC concentration recorded at Gonghu Bay in Taihu Lake, China, was 17 µg L−1 [4]. Raw water from surface reservoirs in regions such as Finland has also been reported to contain MC levels exceeding 10 µg L−1 [5], highlighting the global variability in contamination levels. These examples were selected to represent both baseline concentrations and extremes observed in eutrophic systems, which are critical for contextualizing environmentally relevant exposure scenarios in this study.
MCs, as secondary metabolites of cyanobacteria, pose a significant risk to aquatic ecosystems by inhibiting the growth of eukaryotic algae while promoting the dominance of MC-producing strains [6]. However, the specific functions of MCs have not yet been clearly examined. A study has suggested that MCs are allelochemicals [7], and MCs may enhance the competitiveness of algae by promoting them to reach high densities [8,9]. Recent studies have shown that MCs protect cyanobacteria from pathogens, parasites, and predators and that the presence of predators may also induce MC production [10]. There is also a possible mechanism by which the active release of algal toxins may inhibit the growth or survival of competing species, thereby creating ecological niches favorable to cyanobacterial proliferation [11]. Moreover, MCs may also be involved in photosynthesis [12]. For example, MCs play a key role in inhibiting the growth of other phytoplankton and the rate of photosynthesis in submerged plants. MC-LR has been shown to affect photosynthesis in species such as Fistulifera pelliculosa, Gomphonema parvulum, Nitzschia frustulum, and Stephanodiscus minutulus [13]. MCs induce the formation of excess reactive oxygen species (ROS) in Ulothrix, causing biofilm peroxidation, which increases malondialdehyde (MDA) content, antioxidant enzyme activity, and metabolite levels, disrupting intracellular homeostasis, causing oxidative stress, and leading to algal death [14]. Kurmayer et al. demonstrated a positive correlation between MC production and colony size in field studies, suggesting that MCs may play a role in the formation and maintenance of M. aeruginosa colonies [15]. In another study, Phelan et al. exposed the algal strain Synechocystis PCC6803 to MC-LR and found that MC-LR was taken up and localized in the cystoid membrane, leading to a decrease in photosystem II (PSII) activity [16]. This finding suggests that MCs may act as signaling molecules that interfere with the cell growth and metabolism of algae. However, the question of whether MCs are metabolites of cells for allelochemicals or signaling molecules involved in signaling and gene regulation remains unanswered to date. These findings highlight the necessity and urgency of an integrated algal bloom management strategy.
Although studies have revealed the ecotoxicological effects of MCs and their impacts on aquatic organisms, differences in the physiological responses of MCs to MC-producing and MC-free strains of M. aeruginosa remain unclear, and whether MCs, which are present at a high concentration (>10 µg L−1) in the later stages of blooms, may affect the M. aeruginosa themselves. Does exogenous MCs exposure affect growth, photosynthesis, antioxidant capacity, and expression of metabolites related to MCs synthesis in M. aeruginosa? Are there significant differences between MC-producing and MC-free strains in response to exogenous MCs? These questions have not been answered systematically.
The aim of this study was to investigate the differences in physiological responses of exogenous MCs exposure to MC-producing and MC-free strains of M. aeruginosa, focusing on the effects of MCs on algal cell growth, photosynthesis, antioxidant capacity, and metabolites related to MC synthesis.

2. Materials and Methods

2.1. Strains and Culture Conditions

The experiment used M. aeruginosa strains, both MC-producing (FACHB-905) and MC-free (FACHB-526) strains, as reported by Zhou et al. [17]. Both strains were sourced from the Freshwater Algal Species Bank at the Institute of Aquatic Biology, Chinese Academy of Sciences, China. The strains were aseptically cultured in 500 mL culture flasks at 25 ± 1 °C at a light intensity of 2000 lux and a photoperiod of 12:12 h. During the culture period, cells were manually shaken twice per day. The Colony Forming Units (CFUs) were measured at approximately 6.5 × 10⁶ cells/mL.

2.2. Preparation of Exogenous Microcystins and Exposure Test

The experiment used MC-LR obtained from Shanghai Macklin Company. To examine the impact of MC-LR on both MC-producing and MC-free strains of M. aeruginosa, algal cells in the logarithmic growth phase were centrifuged at 3000 rpm for 5 min. The original medium was replaced with fresh BG11 medium containing four different MC-LR concentrations. The contents of BG11 medium are listed in Table S1. The MC-LR concentration gradient was designed based on the range of actual MC concentrations in the water column: 0 µg L−1, 1 µg L−1, 10 µg L−1, and 50 µg L−1 [3,4,5]. For each of the two algal strains, a control group was established, and three treatment groups were incubated under constant light exposure for 120 h. Samples were collected every 24 h and cell density, chlorophyll a (Chl-a) content, and enzyme activity were assessed. The intracellular phycotoxin content was determined after 0, 24, 48, 72, and 120 h of treatment [2,18]. Cells from the 50 µg L−1 treatment group of both algal strains were collected at the end of the treatment. Morphological observations, photosynthetic efficiency assessments, and non-targeted metabolomics analyses were conducted. Table S2 presents the abbreviations of treatment groups.

2.3. Observation of Density and Morphology of Cells

Cell density was counted every 24 h using a flow cytometer (CytoFLEX, Beckman Coulter, Brea, CA, USA). Post-treatment, algal cells were fixed with 2.5% glutaraldehyde for 30 min at room temperature, shielded from light, and then stored at 4 °C. Samples were resin-embedded, sectioned, and stained for cell morphology observation using transmission electron microscopy (TEM, HITACHI, HT7800, Tokyo, Japan).

2.4. Measurement of Chlorophyll a Content and Photosynthetic System Efficiency

Cell cultures were collected and Chl-a was extracted in 90% acetone at 4 °C in the dark for 24 h. The supernatant was used for the determination of Chl-a content. The content of chlorophyll a was calculated according to the following formula [19]:
Chlorophyll a = 11.85 (A664 − A750) − 1.54 (A647 − A750) − 0.08 (A630 − A750)
After adequate light acclimatization of cell cultures, dark acclimatization was carried out for 20 min. To assess photosynthetic efficiency, algal cell rapid chlorophyll fluorescence dynamics (OJIP induction curves) were measured using a hand-held chlorophyll fluorometer (AquaPen-C, AP-C 100, Photon System Instruments, Brno, Czech Republic).

2.5. Determination of Enzyme Activity

Intracellular superoxide dismutase (SOD) activity and malondialdehyde (MDA) level were assessed every 24 h using SOD and MDA assay kits, respectively, following the manufacturer’s instructions (Nanjing Jiancheng Bioengineering Institute, Nanjing, China). Algal cells were collected and rinsed three times with phosphate-buffer solution, resuspended in phosphate-buffer solution, and frozen and thawed repeatedly in liquid nitrogen. The homogenate was centrifuged at 8000 rpm for 10 min at 4 °C and the supernatant was used for enzyme activity assay.

2.6. Determination of Intracellular Microcystin Content

The MC within the cells of M. aeruginosa is called the intracellular MC (IMC). IMC was extracted using the same extraction method that was used for enzyme activity. The IMC concentration in the samples was measured using a Microcystin ELISA Kit (Shanghai Hengyuan Biological Technology Co., Ltd., Shanghai, China).

2.7. Non-Targeted Metabolomics Analysis

Following the exposure experiment, algal cells were centrifuged, the supernatant discarded, and samples transferred to a centrifuge tube. A 300 µL extraction solution (methanol:acetonitrile, 1:1, v/v) with four internal standards, including 0.02 mg/mL L-2-chlorophenylalanine, was subsequently added. The sample was vortexed for 30 s and then extracted using low-temperature ultrasonication at 5 °C and 40 KHz for 30 min. The sample was cooled to −20 °C, then centrifuged at 12,000 rpm and 4 °C for 15 min. The supernatant was evaporated under nitrogen gas, and 100 μL of a 1:1 acetonitrile-water solution was added for re-dissolution. The sample underwent a 30 s vortex followed by a 5 min low-temperature ultrasonication at 5 °C and 40 KHz. The sample underwent centrifugation at 12,000 rpm and 4 °C for 10 min, after which the supernatant was collected into sampling vials for analysis. Additionally, 20 µL of supernatant from each sample was pooled to form quality control (QC) samples [20].
The LC-MS analysis employed a Thermo Fisher Scientific UHPLC-Q Exactive HF-X system, integrating ultra-high performance liquid chromatography with Fourier transform mass spectrometry. Progenesis QI v3.0 (Waters Corporation, Milford, MA, USA) was utilized for data extraction, alignment, and identification, producing a matrix with retention times, peak areas, mass-to-charge ratios, and identification details for further post-processing and bioconfidence analysis. Strict quality control measures were implemented during data processing, including the removal of features with >30% missing values across samples and RSD filtering of QC samples below 20%. Untargeted metabolomics profiling was performed by Shanghai Majorbio Bio-pharm Technology Co., Ltd. (Shanghai, China) [21].

2.8. Statistical Analysis

Data were processed and plotted using Origin 2021. Statistical analysis was performed using IBM SPSS 26. Tukey’s test, used after one-way ANOVA, was used to evaluate the statistical significance of differences among groups. A p-value of less than 0.05 was considered statistically significant. Metabolomics data were analyzed using the Major Cloud Platform (www.majorbio.com). Metabolites were identified through univariate (t-test) and multivariate (OPLS-DA/PLS-DA) statistical analyses, alongside fold-change assessments, using criteria of p < 0.05, VIP > 1, and a fold change ≠1.

3. Results

3.1. Physiological Responses

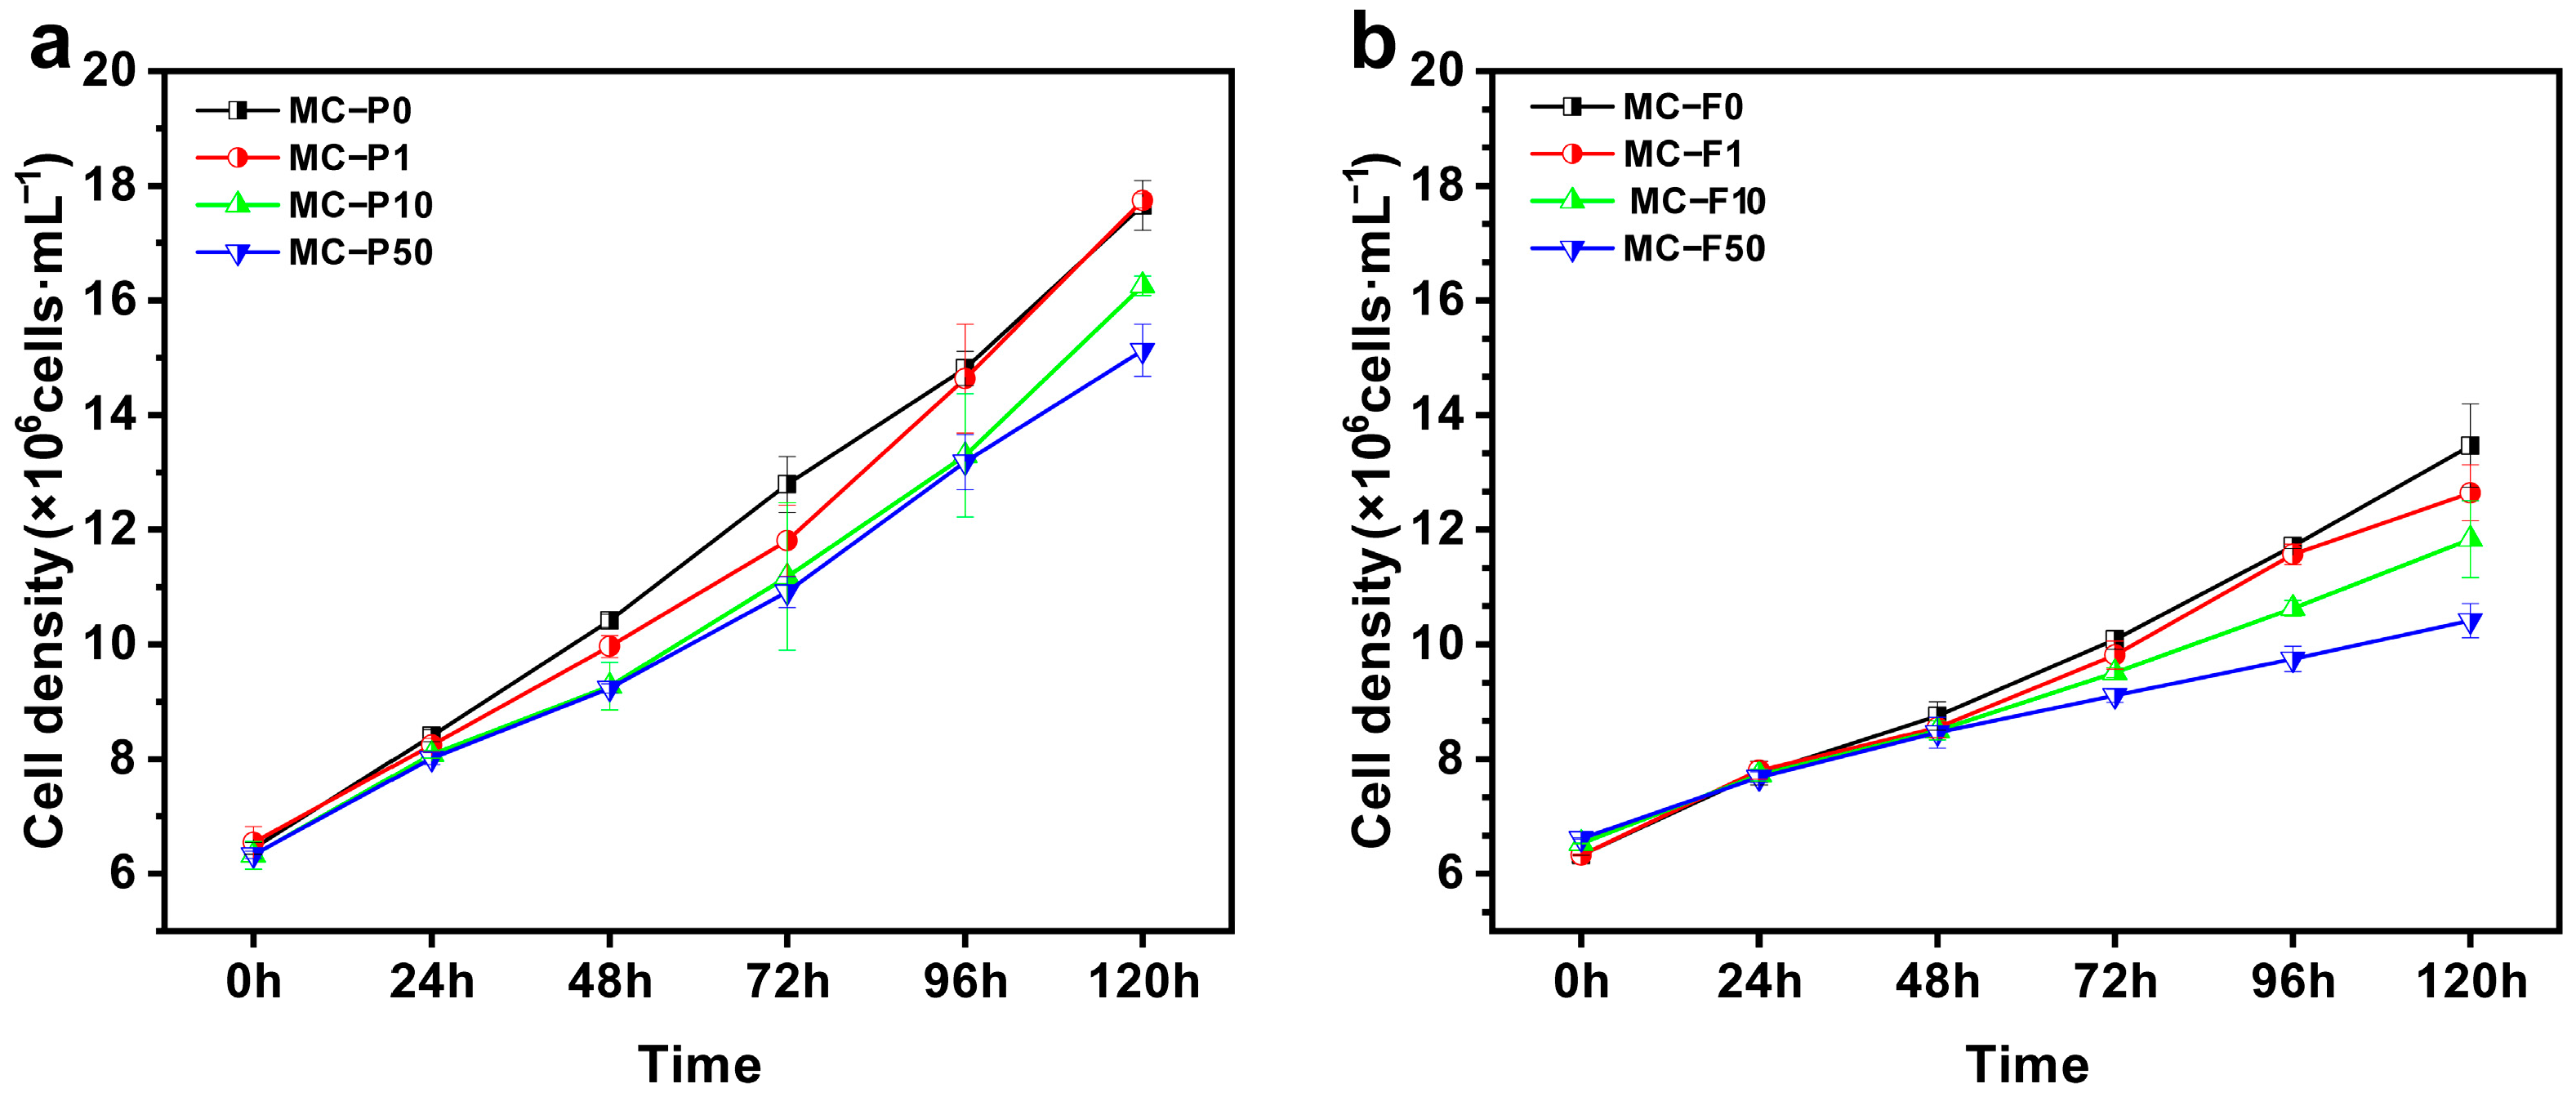
3.1.1. Effects of Exogenous Microcystin Exposure on the Growth of Microcystin-Producing and Microcystin-Free M. aeruginosa Strains

The effect of MC-LR exposure on the growth of algal cells in both MC-producing and MC-free strains of M. aeruginosa was assessed by measuring cell numbers through flow cytometry (Figure 1). CFU increased notably over time. After 120 h of incubation, the density of MC-producing strains in the MC-P50 group reached 1.51 × 10⁷ cells/mL; compared to the control group value of 1.77 × 10⁷ cells/mL, there was 85.5% decrease (Figure 1a). The MC-free strains of the MC-F50 group had a density of 1.04 × 10⁷ cells/mL, which was 77.5% of that in the control group (1.34 × 10⁷ cells/mL) (Figure 1b). In MC-producing M. aeruginosa strains, cell densities in the MC-F0 and MC-F1 groups remained comparable up to 120 h of culture. Low concentrations of MC-LR impacted algal cell growth minimally, whereas higher concentrations of MC-LR inhibited growth, and the effect was more pronounced in MC-free strains.

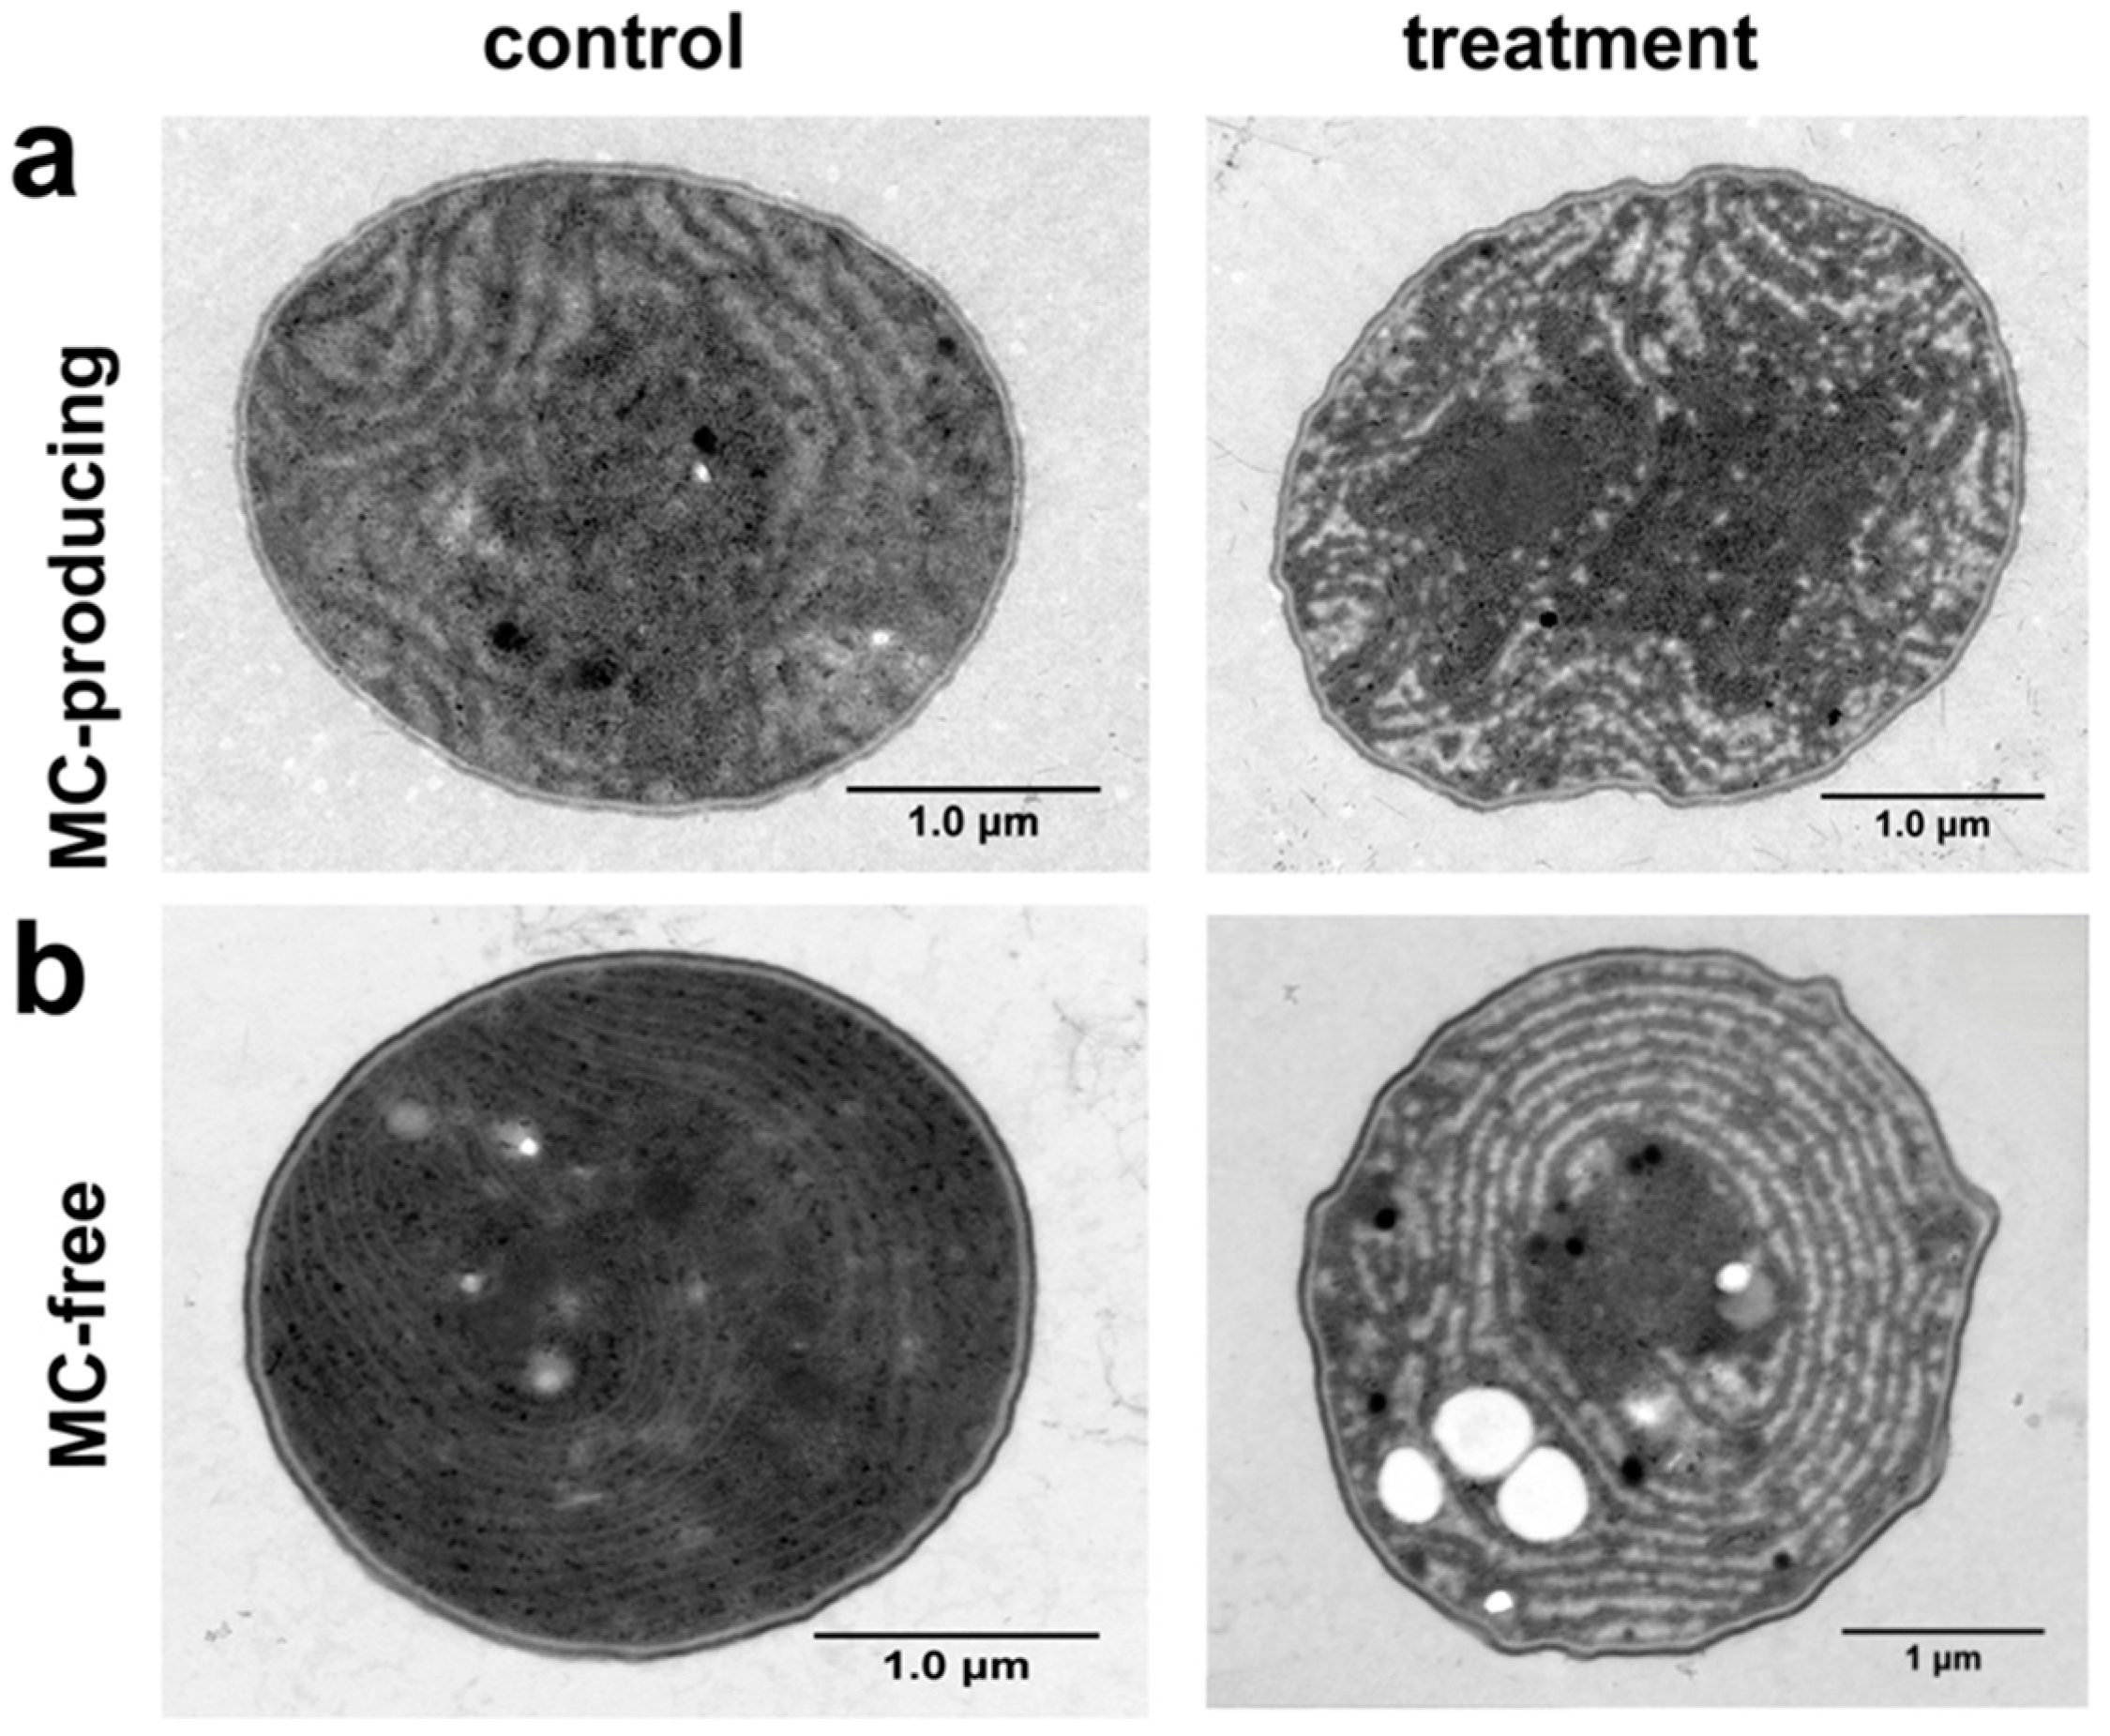
3.1.2. Effects on Cell Morphology

The impact of MC-LR on the cell morphology of both MC-producing and MC-free strains was examined using transmission electron microscopy to analyze morphological changes in the MC-P50 and MC-F50 groups after 120 h of MC-LR exposure (Figure 2).
MC-LR exposure caused slight lysis of cell membranes in MC-producing strains and led to minor distortion of the thylakoid. However, it had a stronger effect on the cell morphology of MC-free strains, with cells changing from normal spherical shape to irregular oval shape, showing crumpled cell walls, ruptured cell membranes, collapsed thylakoid membrane stacks, and the emergence of vacuolization. These findings suggest that higher concentrations of MC-LR disrupt cell morphology and inhibit growth in both MC-producing and MC-free strains; this effect is more pronounced in MC-free strains.

3.1.3. Effects on Chlorophyll a and Photosynthetic System

Chlorophyll a concentration is a key indicator of algal growth and photosynthesis, as its trend aligns with cell density changes [22], as the Chl-a trend responds to the cell density trend [23]. With increasing MC-LR concentration, the Chl-a content generally decreased (Figure 3a). After 120 h of treatment, both the MC-P50 and MC-F50 groups showed significantly lower values than the control group (p < 0.05; Figure 3a,b), matching the observed cell density trend. Photosynthesis plays an important role in algal growth [24], and chlorophyll fluorescence parameters respond to different stages of photosynthesis [23]. Figure 3c,d show radar plots of fluorescence parameters after 120 h of MC-LR treatment. Table S3 presents the meaning of each parameter. Compared with the control, the FV/FM value decreased to 36.9% of the control value in the MC-P50 group and 30.5% in the MC-F50 group. The MC-P50 group exhibited significantly higher ABS/RC and DIO/RC values (Figure 3c). In the MC-free group, ABS/RC and DIO/RC were significantly elevated in MC-F10 and MC-F50 (Figure 3d). With increasing MC-LR concentrations, Vj increased in both MC-P and MC-F groups, reaching 132% of the control value in MC-P50 and 200% in both MC-F50 and MC-F10. Furthermore, as indicated by the findings of Sm (Figure S1), Sm significantly decreased in the MC-F group (p < 0.05) with increasing MC-LR concentration, whereas the MC-P group did not exhibit this trend. In conclusion, MC-LR affected the photosynthesis of M. aeruginosa.

3.1.4. Impact on Lipid Peroxidation and Antioxidant Enzyme Activities

Lipid peroxidation and antioxidant enzyme activities were evaluated to examine oxidative stress in M. aeruginosa treated with MC-LR (Figure 4). SOD activity was significantly elevated (p < 0.05) in both MC-P10 and MC-P50 groups after 96 h of treatment, which continued until 120 h (Figure 4a). SOD activity was significantly elevated (p < 0.05) in MC-F10 and MC-F50 groups after 24 h of treatment and then decreased (Figure 4b). The overall MDA level trend in the MC-P50 group was increasing and peaked after 120 h of treatment (Figure 4c). In the MC-F50 group, the MDA level first increased and then decreased, and peaked after 24 h of treatment (Figure 4d). The MDA level was positively correlated with the extent of structural damage of the cell membrane. In summary, MC-LR can cause oxidative stress and different degrees of membrane damage in cells, as well as strengthen their own defense by increasing the activity of antioxidant enzymes.

3.2. Changes in Intracellular Microcystin Concentration

In both strains, the IMC of the group without MC-LR treatment remained relatively stable. In the MC-free strain, IMC was significantly increased in the MC-F10 and MC-F50 treatment groups (p < 0.05; Figure 5b). Notably, in MC-producing strains, the MC-P50 group showed significantly decreased levels (Figure 5a). The IMC decreased 1.2-fold compared to the control group. It is possible that MC-LR treatment affected the synthesis of MCs in MC-producing strains and promoted the release of MCs from MC-free strains.

3.3. Effects of Exogenous Microcystin on the Metabolism of M. aeruginosa

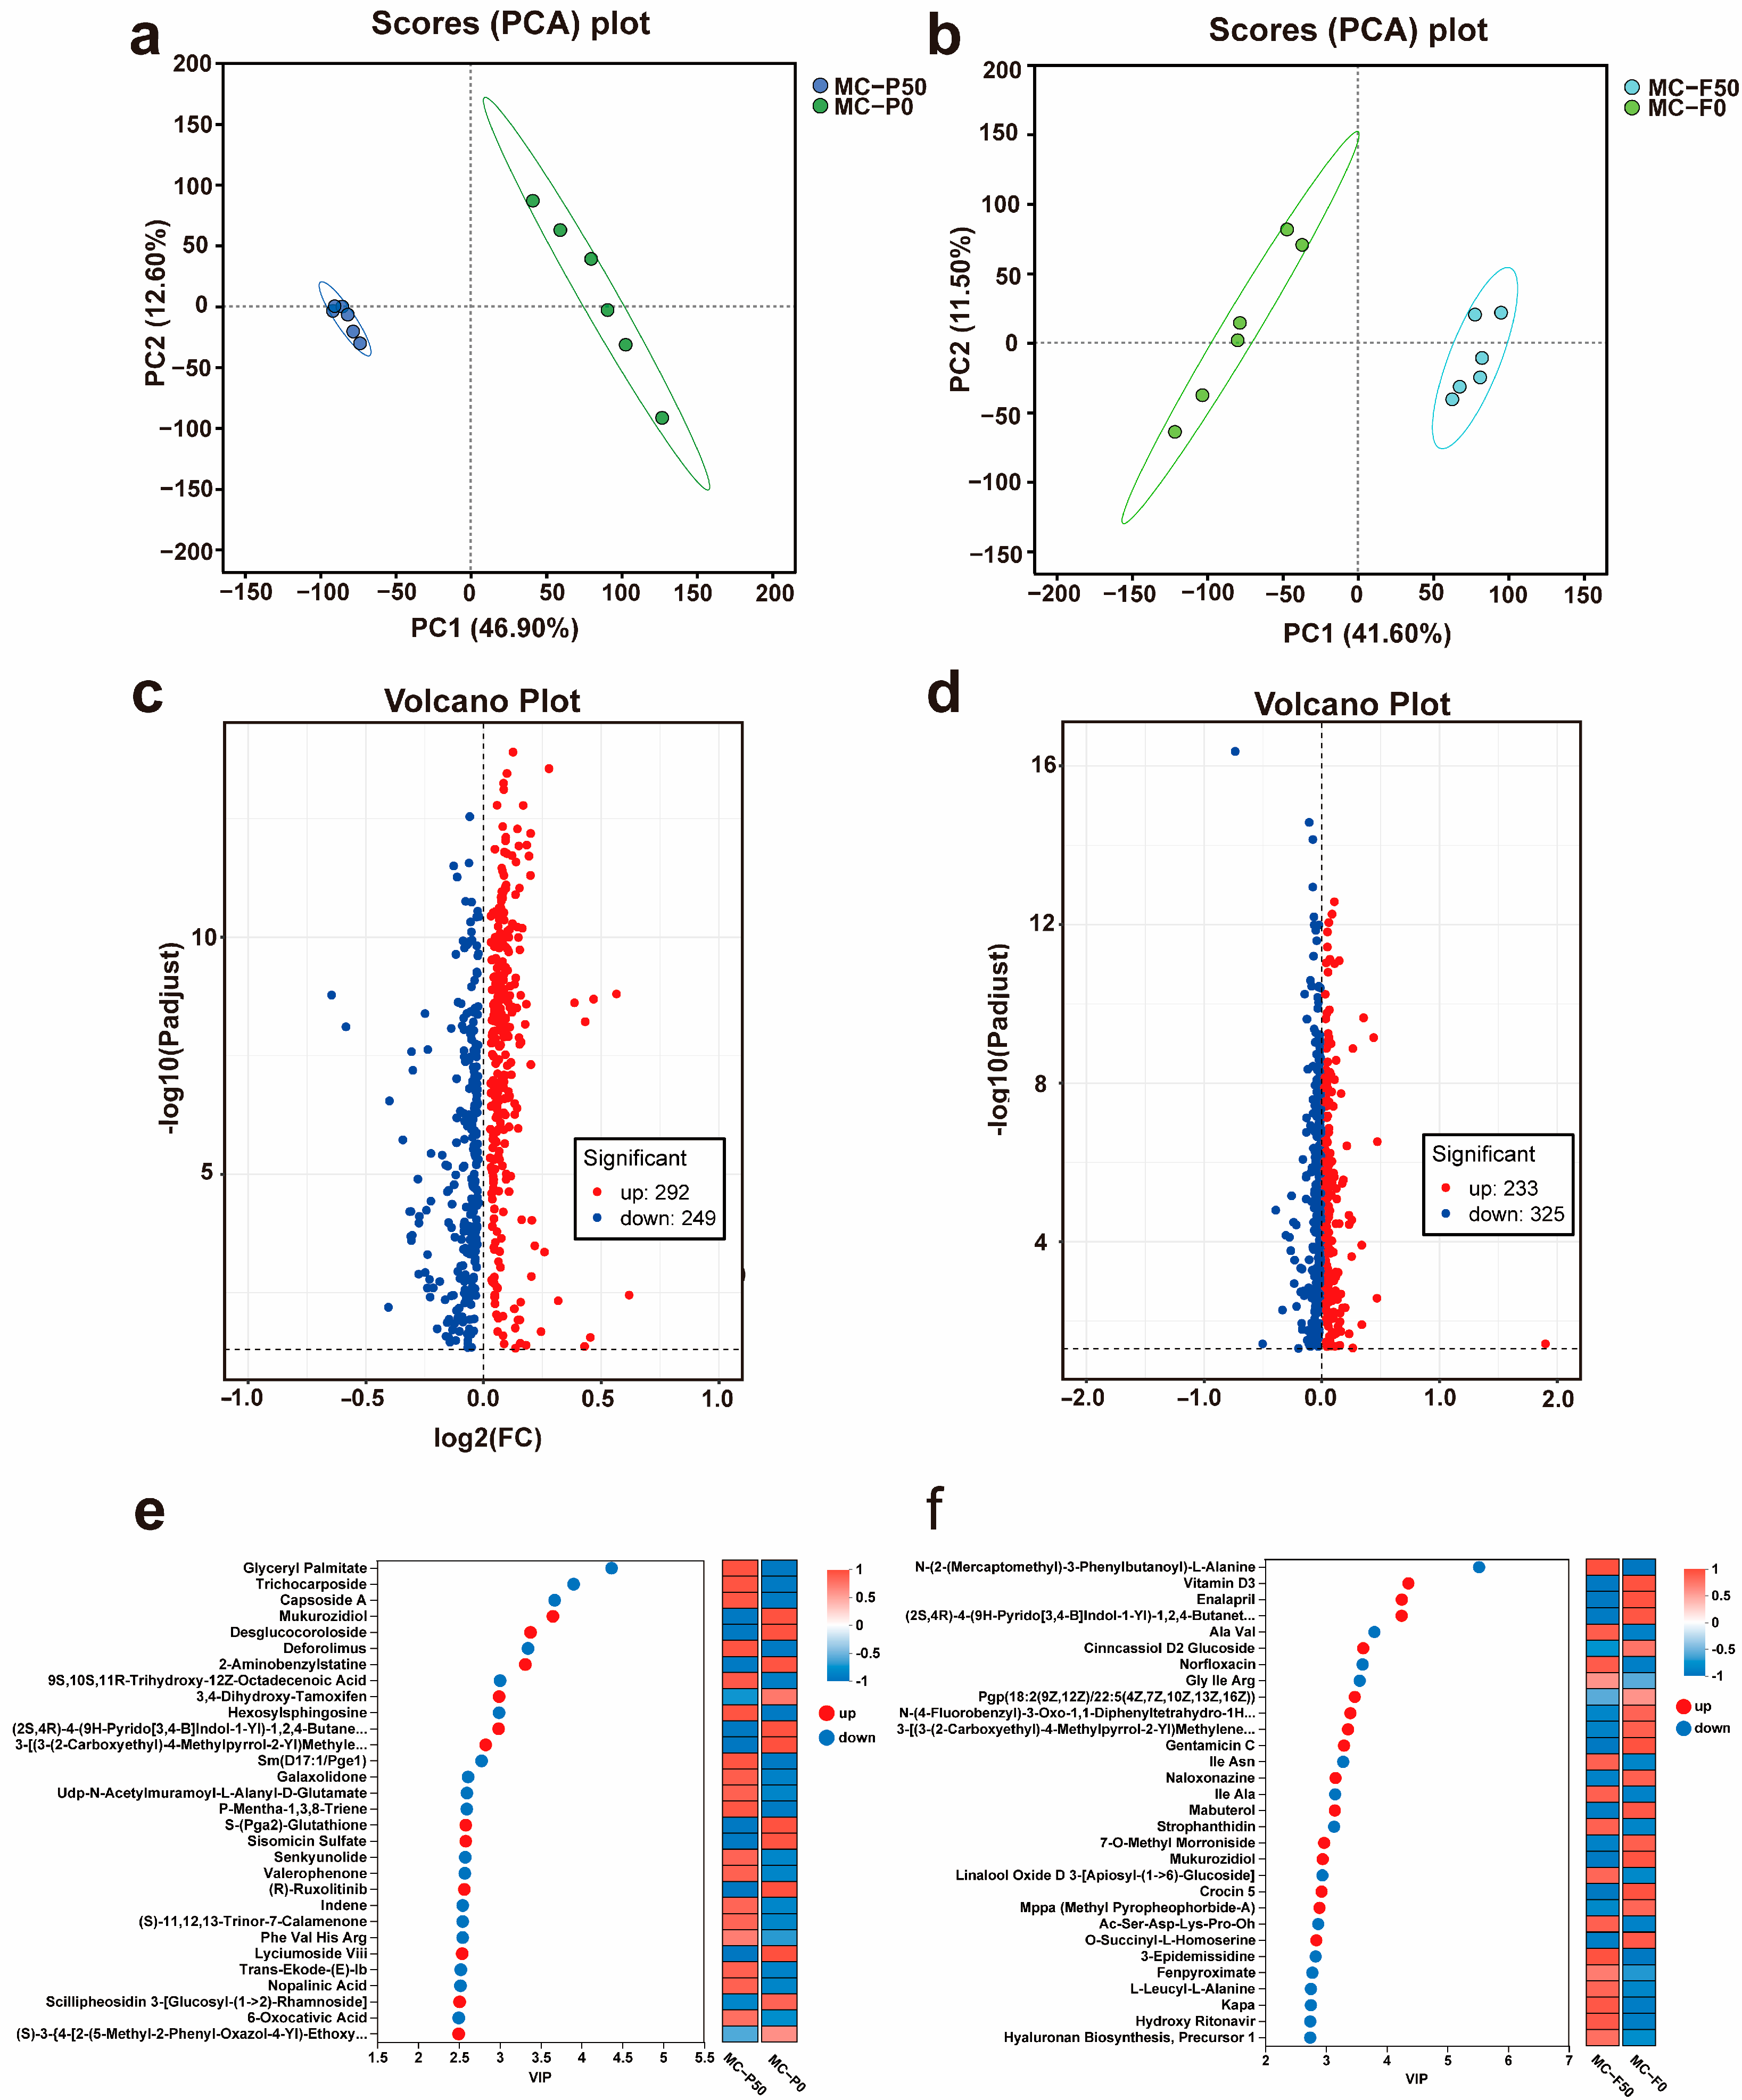
3.3.1. Differentially Expressed Metabolites

For non-targeted metabolomics analysis, the control group and the group exposed to 50 μg L−1 MC-LR were selected as they showed considerable physiological differences. Therefore, metabolomic analysis was performed on two sample groups of MC-producing strains as well as two sample groups of MC-free strains, testing a total of 36 samples.
Principal component analysis was used for comparisons between samples, repeatability analyses between repeated samples within groups, and differences between samples between groups. The results of principal component analysis identified notable distinctions between treatment and control groups in both the MC-producing category (Figure 6a) and MC-free strains (Figure 6b). This result indicates that MC treatment interfered with global metabolic profiles. The PLS-DA plots (Figure S2) exhibit a comparable trend. LC-MS/MS analysis identified 541 distinct metabolites (VIP > 1, p < 0.05) in MC-producing strains, of which 292 metabolites were upregulated and 249 were downregulated (Figure 6c). In MC-free strains, 558 differentially expressed metabolites were identified (VIP > 1, p < 0.05), 233 of which were upregulated and 325 were downregulated. The VIP graph ranks a total of 30 metabolites. The VIP values of Glyceryl Palmitate, Trichocarposide, Capsoside A, Mukurozidiol, Desglucocoroloside, Ridaforolismus, 2-Aminobenzylstatine, 9S,10S,11R-Trihydroxy-12Z-Octadecenoic Acid, 3,4-Dihydroxy-Tamoxifen, and Hexosylsphingosine were higher in MC-producing strains (Figure 6e). The VIP values for several compounds, including N-(2-(mercaptomethyl)-3-phenylbutanoyl)-L-Alanine, Vitamin D3, Enalapril, (2S,4R)-4-(9H-pyrido [3,4-b]indol-1-yl)-1,2,4-butanetriol, Ala-Val, Cinncassiol D2 Glucoside, Norfloxacin, Gly-Ile-Arg, Pgp(18:2(9Z,12Z)/22:5(4Z,7Z,10Z,13Z,16Z)), and N-(4-fluorobenzyl)-3-oxo-1,1-diphenyltetrahydro-1H-oxazolo [3,4-A]pyrazine-7(3H)-carboxamide, were elevated in MC-free strains (Figure 6f).
MC-LR exposure influenced the metabolism of both MC-producing and MC-free M. aeruginosa strains.

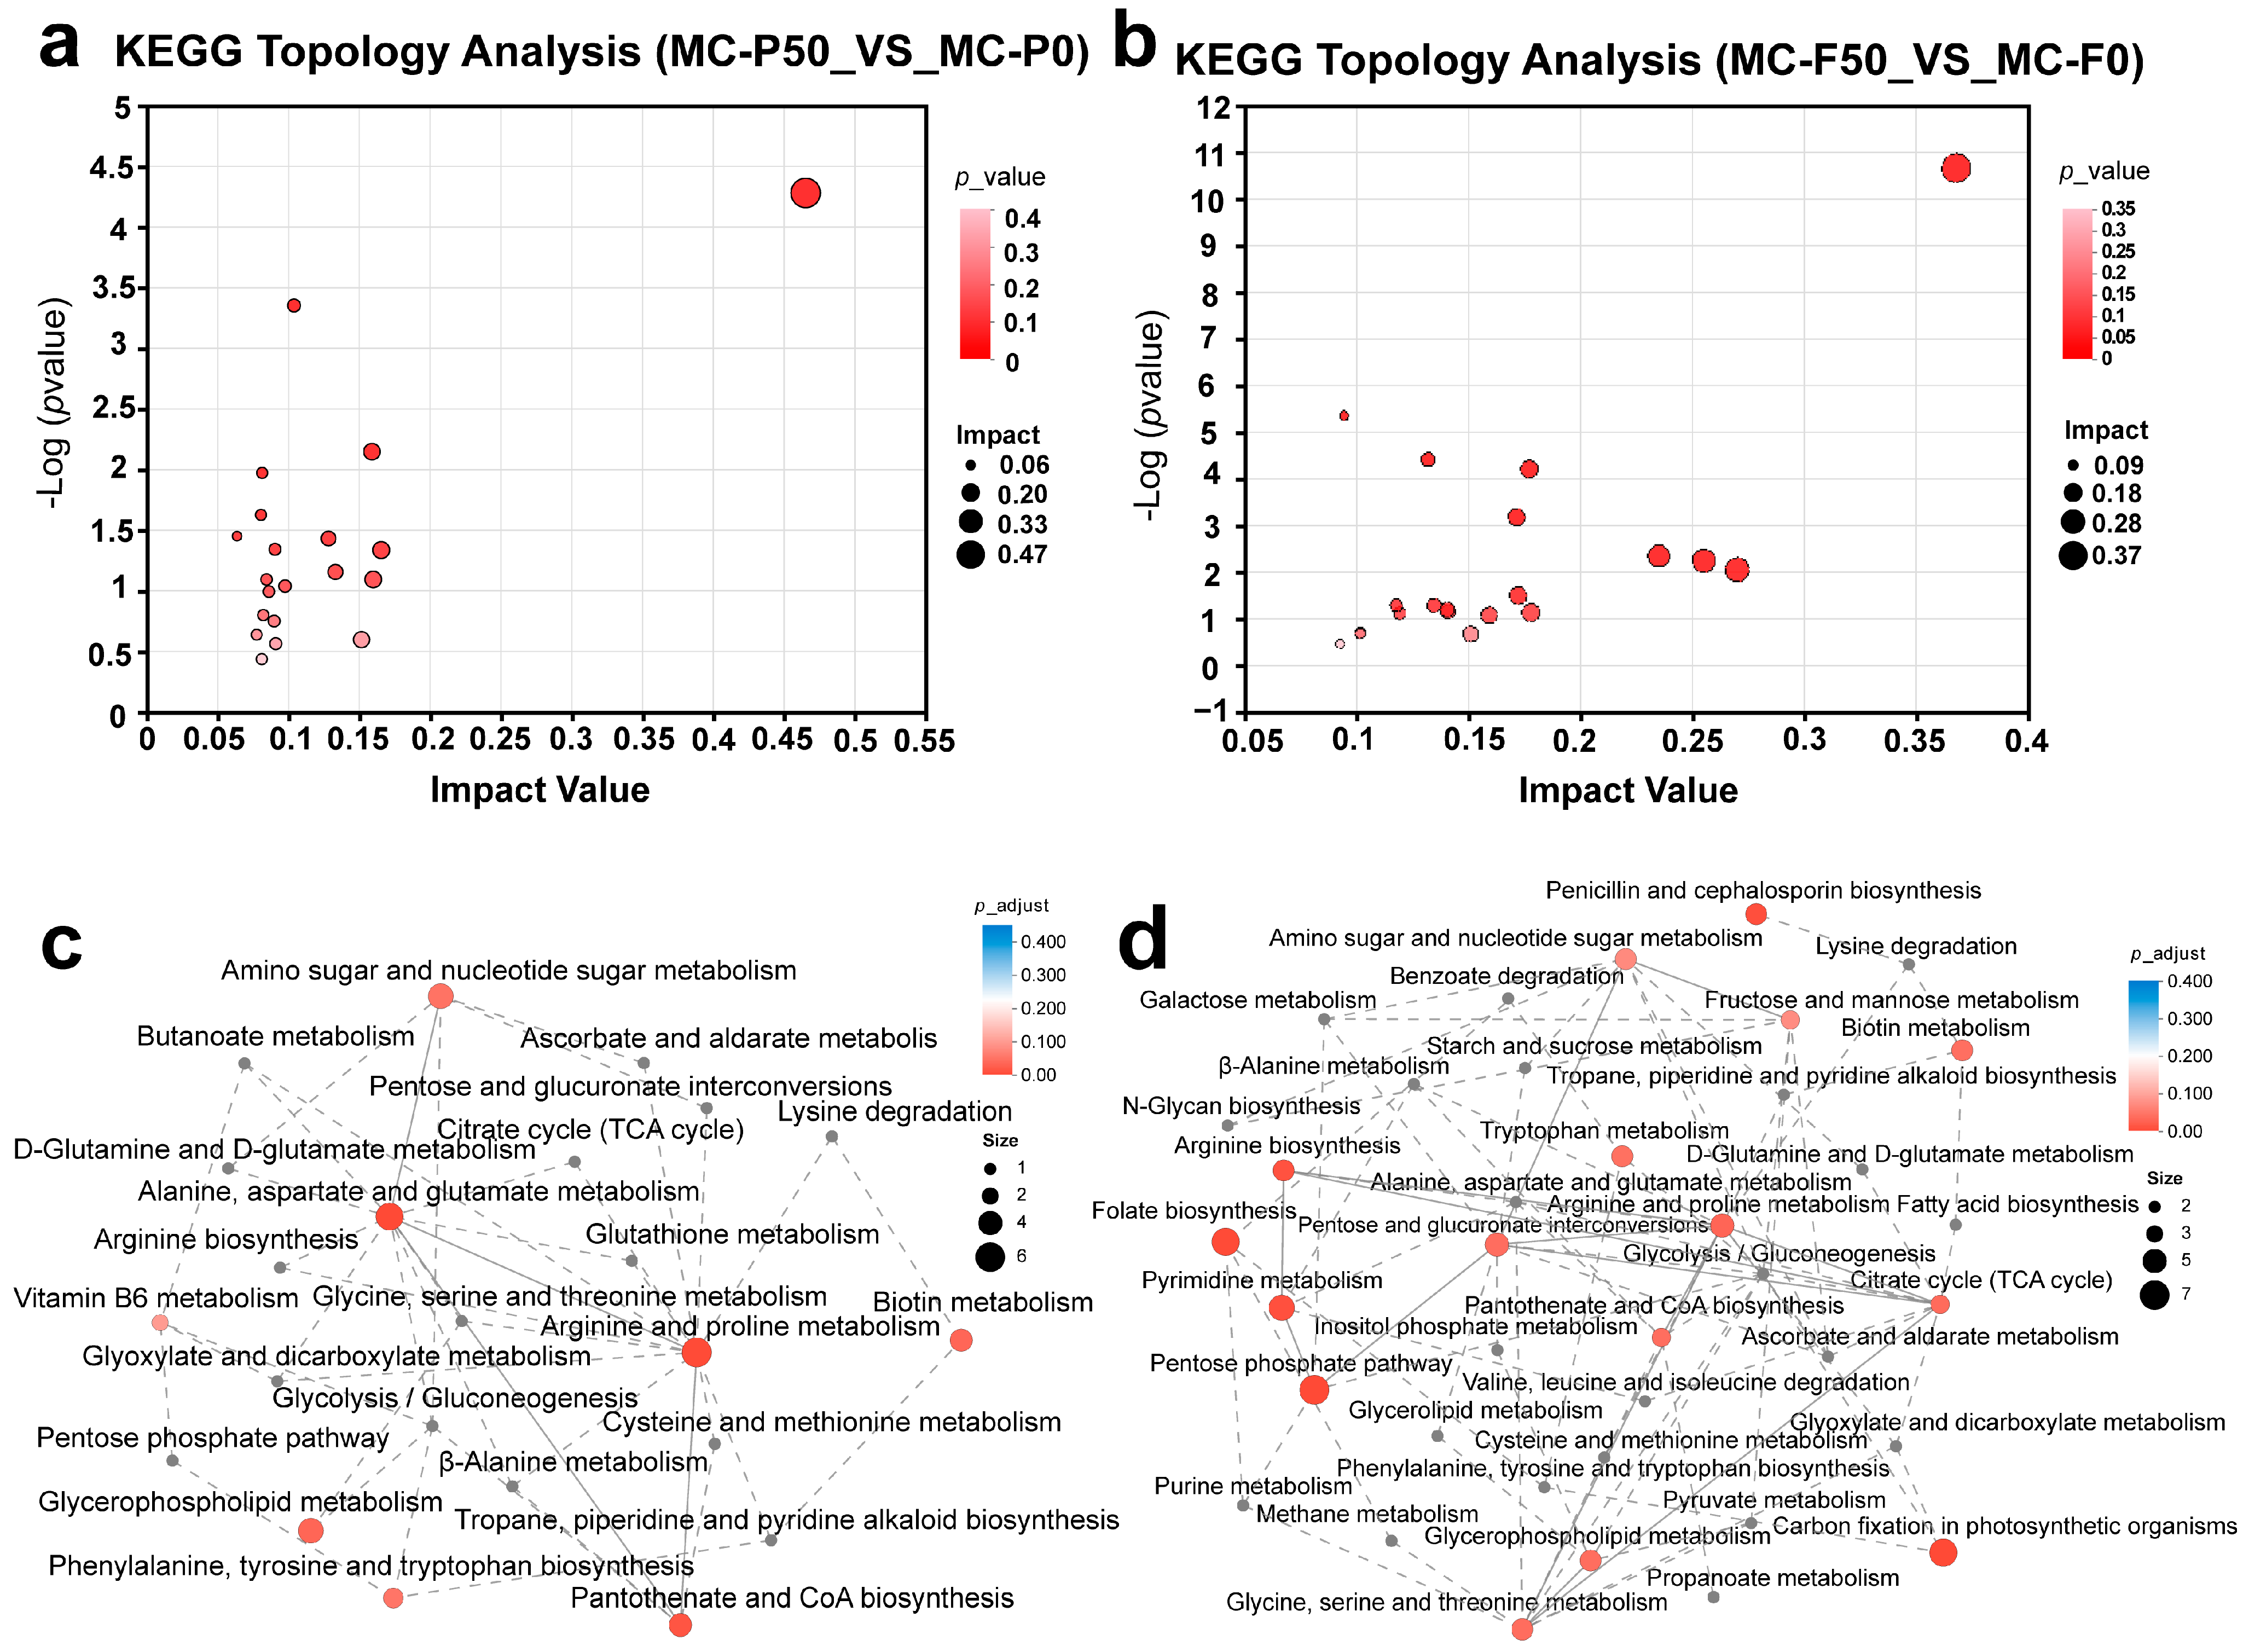
3.3.2. Metabolic Pathway Analysis

KEGG enrichment analysis was conducted on differentially expressed metabolites to identify significantly altered pathways. Differential metabolite analysis served as the foundation of the KEGG enrichment analysis. The metabolic pathways of differentially expressed metabolites were identified by pathway enrichment and pathway topology analyses. In the MC-P (Figure 7a) and MC-F (Figure 7b) groups, 8 and 18 metabolic pathways had a large effect value (PI > 0.1), respectively. Biotin metabolism, pantothenate and CoA biosynthesis, amino sugar and nucleotide sugar metabolism, glycerophospholipid metabolism, and arginine and proline metabolism exhibited significant impact values across both groups. An enrichment analysis network diagram was constructed with PI > 0.1 to disclose the interrelationships between enriched metabolic pathways by complementing interrupted pathways (Figure 7c). The enriched pathways of differentially expressed metabolites are shown in the differential abundance score plot (Figure S3). MC-LR exposure inhibited arginine biosynthesis in MC-producing strains, while it significantly enhanced arginine biosynthesis in MC-free strains compared to the control group. In the MC-P group, arginine and proline metabolism, carbon fixation in photosynthetic organisms, and cofactor biosynthesis were significantly downregulated, whereas in the MC-F group, these processes were upregulated. In addition, glycerophospholipid metabolism was significantly upregulated in the MC-P group, while it tended to be downregulated in the MC-F group. The expressions of alanine, aspartate, and glutamate metabolism were downregulated, while the expression of ABC transporters was upregulated in both MC-P and MC-F groups.
The biosynthetic pathways for arginine biosynthesis and arginine and proline metabolism are shown in Figure 8. In arginine biosynthesis, the MC-P group showed significant downregulation of aspartate and N-Acetyl-L-Ornithine, whereas the MC-F group exhibited significant upregulation of N-Acetyl-L-Ornithine, citrulline, and ornithine. In arginine and proline metabolism, octopine was significantly downregulated in the MC-P group and upregulated in the MC-F group, while 4-Hydroxyproline was significantly upregulated in the MC-P group and downregulated in the MC-F group. In addition, the expressions of agmatine, 2-Oxoarginine, and 4-Aminobutanoate were downregulated in the MC-P group and N2-Succinyl-L-omithine was upregulated in the MC-P group. In photosynthetic carbon fixation, the MC-F group showed downregulation of malate and upregulation of xylulose-5P. In cofactor biosynthesis, both groups exhibited downregulation of L-Gulonate and nicotinamide, while pantothenate was upregulated. Additionally, porphobilinogen expression was upregulated in the MC-P group and downregulated in the MC-F group.

4. Discussion

4.1. Impact of Exogenous Microcystin Exposure on Physiological Responses of Microcystin-Producing and Microcystin-Free M. aeruginosa Strains

Microalgae can produce and release MCs that are harmful to other organisms in the aquatic environment and affect their growth and survival [25]. To study the mechanism of action and clarify the function of MCs on M. aeruginosa itself, two strains of M. aeruginosa were chosen, namely an MC-producing strain and MC-free strain. Both were exposed to different concentrations of MC-LR. The findings indicated that 1 μg L−1 of MC-LR had no impact on the growth of M. aeruginosa. With increasing MC-LR concentration and treatment duration, its inhibitory effects varied between MC-producing and MC-free strains, and the impact on MC-free strains was more pronounced.
Both MC-producing and MC-free strains of M. aeruginosa showed slow cell growth after treatment with MC-LR (Figure 1), which may be caused by damage to the cell membrane structure. Similarly, a study by He et al. reported inhibited cell growth in the treated group with damaged cell membranes [26]. These findings are consistent with the results of the present study. Furthermore, Chl-a is an important pigment in photosynthesis and an important indicator for estimating algal biomass [27]. Decreased Chl-a content indirectly reflects an inhibition of algal cell growth (Figure 3a,b). In photosynthesis, the role of the vast majority of chlorophyll is to absorb and transfer light energy [28]. The observed decrease in the maximum efficiency of PSII (FV/FM) is mainly caused by the decrease in the conversion rate of light energy in the electron transfer process of PSII as a result of photoinhibition [29]. Compared with the control, FV/FM decreased 2.71-fold in the MC-P50 group and 3.28-fold in the MC-F50 group. The results showed that PSII electron transfer was inhibited in M. aeruginosa exposed to higher concentrations of MC-LR. ABS/RC reflects the energy absorbed per unit of reaction center [30], and the observed significant increase in ABS/RC indicates that certain photochemical reaction centers in PSII were inactivated (Figure 3c,d). DIo/RC represents the energy dissipated per reaction center [31]. A notable rise in DIo/RC suggests that the inactivation of photoreaction centers leads to substantial dissipation of excitation energy in the form of heat. PI is the most sensitive chlorophyll fluorescence parameter [32], and a reduction in Pi_Abs in M. aeruginosa suggests inhibited photosynthetic activity. A significant increase in Vj indicates a large accumulation of QA [33]. Inhibition of electron transfer from QA to QB results in an increase in Vj. Presumably, MC-LR affects the electron transfer pathway from QA to QB. The PSII reaction center becomes inactive, resulting in the degradation of D1 protein. Sm indicates the energy needed for full QA reduction and represents the PQ pool size on the receptor side of the PSII reaction center [34]. An increase in electrons entering the electron transfer chain from QA- prolongs the time they need to reach Fm and thereby elevates the Sm value. When subjected to photodamage, the degradation of D1 protein is intensified, as a result of which electron carriers, especially QB, easily detach from the protein complex. Their detachment results in a decrease in the receptor pool capacity, which is expressed as a decrease in Sm [35]. In the MC-F group, an increase in MC-LR concentration led to a significant decrease in Sm. This finding suggests that in the MC-F group, in addition to hindering electron transfer from QA to QB, MC-LR may act as a signaling molecule that affects the targeting of QB on the D1 protein. This leads to the detachment of QB from the protein complex and the degradation of the D1 protein, thereby affecting the efficiency of photosynthesis. This may be related to the thylakoid membrane damage (Figure 2).
SOD is an antioxidant metalloenzyme that catalyzes the conversion of superoxide anion radicals into oxygen and hydrogen peroxide, thereby maintaining the oxidative-antioxidant balance in organisms [36]. Lower MC-LR concentrations did not induce oxidative stress in M. aeruginosa, whereas higher concentrations increased SOD activity (Figure 4a,b). This result indicates that at this concentration, MC-LR induced the production of reactive oxygen species (ROS) [37]. M. aeruginosa responded to the resulting accumulation of ROS by increasing the activity of SOD to minimize damage to itself. MDA is a hallmark product of lipid peroxidation [38]. Changes in the MDA level corresponded to the damage to the structure of the cell membrane. In the MC-free strain, both SOD activity (Figure 4b) and MDA level (Figure 4d) peaked after 24 h of treatment followed by a decrease. This finding indicates that the MC-free strain suffered oxidative damage earlier than the MC-producing strain. Further, the imbalance between antioxidant enzyme activity and ROS accumulation over increasing time led to enzyme inactivation as well as cell lysis and death.

4.2. Metabolomics Analysis

In this study, a series of metabolic profiles that occurred after exposure to the exogenous toxin MC-LR were examined by non-targeted metabolomics in both MC-producing and MC-free strains of M. aeruginosa. According to the findings, exposure to higher concentrations of exogenous microcystins destabilized M. aeruginosa. These algae exhibited a positive response to exogenous MC stress, initiating physiological and biochemical reactions that disrupted their metabolism. Metabolomics analysis identified differentially expressed metabolites primarily categorized into carbohydrates, lipids, nucleic acids, organic acids, peptides, vitamins, and cofactors. Trichocarposide is a terpenoid with antioxidant properties that helps to protect cells from oxidative damage. Trichocarposide has also been found to decrease swimming behavior in M. aeruginosa and reduce its protein hydrolysis, thereby attenuating its toxicity [39]. In this study, Trichocarposide was significantly downregulated in the MC-P group, while it was significantly upregulated in the MC-F group. This result proves that the toxic effects of M. aeruginosa may be related to its expression level. In addition, a number of compounds related to the maintenance of the cellular steady state were found in the upregulated differentially expressed metabolites. Desglucocoroloside is an antioxidant as well as a membrane stabilizer [40,41,42]. The MC-producing strain improves their antioxidant capacity and stability by upregulating desglucocoroloside expression. In addition, glutathione traps free radicals and helps other enzymes to maintain the reduced state [43]. The observed significant upregulation of glutathione (Figure 6e) indicates improved free radical scavenging ability and enhanced cellular tolerance. In addition, the glycerophospholipid metabolism was significantly enriched according to KEGG. This enrichment suggests that MC-LR exposure affects the structural stabilization of cell membranes in M. aeruginosa, which responds to stresses by regulating the formation of cellular membranes [44]. Malate, a C4 dicarboxylic acid, plays a crucial role in the citric acid cycle during carbon fixation in photosynthetic organisms [45]. The malate shuttle is crucial for plant photorespiration and may also be involved in algal CO2 enrichment mechanisms [46]. Downregulation of malate expression in the MC-F group decreased the rate of photosynthetic respiration in M. aeruginosa. Rubisco, the primary enzyme for carbon sequestration in photosynthesis, limits the CO2 assimilation rate and uses ribulose 1,5-bisphosphate as a substrate [47,48]. Sedoheptulose-1,7-bisphosphate has been proposed as a key factor in terms of ribulose 1,5-bisphosphate regeneration capacity [49]. The downregulated expression of Sedoheptulose-1,7-bisphosphate in the MC-P group affected the efficiency of the photosynthetic system of algal cells, which is consistent with the physiological results.
Arginine is integral to the molecular structure of MC, and significantly contributes to its synthesis and release [23,50]. Studies have shown that arginine can, to some extent, promote the increase in algal biomass and the synthesis of MC-LR [51]. Its mechanism of action may involve regulating the content of chlorophyll a and phycobiliproteins, thereby influencing photosynthetic efficiency [50]. This study found significant enrichment and overall upregulation of Arginine biosynthesis and Arginine and proline metabolism in the MC-F group according to KEGG; however, these pathways were downregulated in the MC-P group (Figure S3). This result is consistent with the IMC concentration demonstrated in Figure 5. It can be speculated that the MC-producing strain sensed the external stimulus, causing it to reduce MC release and cell death by decreasing arginine synthesis. However, arginine biosynthesis was upregulated, which disturbed the growth of MC-free cells, leading to algal cell lysis and thus MC release. This may be one of the reasons why the MC-producing strain is more likely to be the dominant species in the bloom.
The regulation of differentially expressed metabolites aligned with physiological findings, indicating that increased MC exposure impacts cell growth in both MC-producing and MC-free strains; the MC-producing strain demonstrated greater resilience to oxidative damage.

5. Conclusions

In this study, the effect and mechanism of action of MC-LR on the MC-producing and MC-free strains of M. aeruginosa were examined. The results showed that higher MC-LR concentrations inhibited the growth of M. aeruginosa, which was more apparent in the MC-free strain. The main manifestations were reduced cell density, an impaired cell membrane structure, decreased photosynthetic efficiency, and the induction of oxidative damage. For the MC-producing strain, MC-LR reduced the efficiency of PSII by blocking electron transfer from QA to QB; for the MC-free strain, MC-LR not only inhibited electron transfer, but also may have acted as a signaling molecule affecting the targeting of QB on the D1 protein. This would have led to the detachment of QB from the protein complex, thus affecting the efficiency of photosynthesis. Non-targeted metabolomics demonstrated that elevated MC-LR concentrations downregulated arginine synthesis and metabolism in the MC-producing strain, leading to decreased MCs synthesis. In contrast, in the MC-free strain, arginine synthesis was upregulated, which promoted the release of MCs. The MC-producing strain enhanced self-regulation and defense mechanisms by elevating SOD and glutathione antioxidant enzyme activities. This study clarified the functions of MCs and proposed novel strategies for cyanobacterial bloom control, including suppressing MC-LR production through targeted disruption of the arginine biosynthesis pathway and developing synthetic MC analogs to mitigate the dominance of toxigenic cyanobacteria.

Supplementary Materials

The following supporting information can be downloaded at https://www.mdpi.com/article/10.3390/w17070993/s1, Table S1: The content of BG11 medium; Table S2: Abbreviations of various treatment groups; Table S3: Meaning of OJIP related parameters; Figure S1: Sm following 120 h of exposure to 50 μg L-1 MC-LR; Figure S2: Plot of PLS-DA scores for MC-producing and MC-free strains of Microcystis aeruginosa; Figure S3: Differential abundance score reflects overall changes in all metabolites in metabolic pathway.

Author Contributions

Author Contributions: writing—original draft, L.C. and C.C.; data curation, L.C., C.C., B.W. (Bingqing Wang) and G.X.; investigation, L.C., C.C., B.W. (Bingqing Wang), G.X. and B.W. (Baicai Wang); formal analysis, L.C. and C.C.; methodology, L.C., C.C., B.W. (Bingqing Wang), B.W. (Baicai Wang) and W.W.; funding acquisition, W.W. and X.L.; project administration, X.L.; supervision, X.L.; writing—review and editing, X.L. All authors have read and agreed to the published version of the manuscript.

Funding

This research was supported by the National Natural Science Foundation of China (32101373), State Key Laboratory of Lake Science and Environment (2022SKL017), The Youth Innovation Team Plan of Colleges and Universities in Shandong Province (2024KJG059), and the Open Fund Project of Shandong Underground Water Environmental Protection and Remediation Engineering Technology Research Center (Grant No. 801KF2022-6).

Data Availability Statement

The original contributions presented in this study are included in the article/Supplementary Material. Further inquiries can be directed to the corresponding author.

Conflicts of Interest

The authors declare no conflict of interest.

References

  1. Paerl, H.W.; Xu, H.; McCarthy, M.J.; Zhu, G.; Qin, B.; Li, Y.; Gardner, W.S. Controlling harmful cyanobacterial blooms in a hyper-eutrophic lake (Lake Taihu, China): The need for a dual nutrient (N & P) management strategy. Water Res. 2011, 45, 1973–1983. [Google Scholar] [CrossRef] [PubMed]
  2. Feng, L.-J.; Sun, X.-D.; Zhu, F.-P.; Feng, Y.; Duan, J.-L.; Xiao, F.; Li, X.-Y.; Shi, Y.; Wang, Q.; Sun, J.-W.; et al. Nanoplastics Promote Microcystin Synthesis and Release from Cyanobacterial Microcystis aeruginosa. Environ. Sci. Technol. 2020, 54, 3386–3394. [Google Scholar] [CrossRef]
  3. Loftin, K.A.; Clark, J.M.; Journey, C.A.; Kolpin, D.W.; Van Metre, P.C.; Carlisle, D.; Bradley, P.M. Spatial and temporal variation in microcystin occurrence in wadeable streams in the southeastern United States. Toxicol. Environ. Chem. 2016, 35, 2281–2287. [Google Scholar] [CrossRef]
  4. Wang, Q.; Niu, Y.; Xie, P.; Chen, J.; Ma, Z.; Tao, M.; Qi, M.; Wu, L.; Guo, L. Factors Affecting Temporal and Spatial Variations of Microcystins in Gonghu Bay of Lake Taihu, with Potential Risk of Microcystin Contamination to Human Health. Sci. World J. 2010, 10, 1795–1809. [Google Scholar] [CrossRef]
  5. Lahti, K.; Rapala, J.; Kivimäki, A.L.; Kukkonen, J.; Niemelä, M.; Sivonen, K. Occurrence of microcystins in raw water sources and treated drinking water of Finnish waterworks. Water Sci. Technol. 2018, 43, 225–228. [Google Scholar] [CrossRef]
  6. Griffith, A.W.; Doherty, O.M.; Gobler, C.J. Ocean warming along temperate western boundaries of the Northern Hemisphere promotes an expansion of Cochlodinium polykrikoides blooms. Proc. R. Soc. B. 2019, 286, 20190340. [Google Scholar] [CrossRef]
  7. Brêda-Alves, F.; de Oliveira Fernandes, V.; Cordeiro-Araújo, M.K.; Chia, M.A. The combined effect of clethodim (herbicide) and nitrogen variation on allelopathic interactions between Microcystis aeruginosa and Raphidiopsis raciborskii. Environ. Sci. Pollut. 2020, 28, 11528–11539. [Google Scholar] [CrossRef]
  8. Wang, S.; Brenner, M.; Curtis, J.H.; Romero-Oliva, C.S.; Dix, M.; Cano, M. Simultaneous Removal of the Freshwater Bloom-Forming Cyanobacterium Microcystis and Cyanotoxin Microcystins via Combined Use of Algicidal Bacterial Filtrate and the Microcystin-Degrading Enzymatic Agent, MlrA. Microorganisms 2021, 9, 1594. [Google Scholar] [CrossRef]
  9. Waters, M.N.; Brenner, M.; Curtis, J.H.; Romero-Oliva, C.S.; Dix, M.; Cano, M. Harmful algal blooms and cyanotoxins in Lake Amatitlán, Guatemala, coincided with ancient Maya occupation in the watershed. PNAS 2021, 118, e2109919118. [Google Scholar] [CrossRef]
  10. Cai, W.; MacIsaac, H.J.; Xu, R.; Zhang, J.; Pan, X.; Zhang, Y.; Yang, J.; Dixon, B.; Li, J.; Zi, Y.; et al. Abnormal neurobehavior in fish early life stages after exposure to cyanobacterial exudates. Ecotoxicol. Environ. Saf. 2022, 245, 114119. [Google Scholar] [CrossRef]
  11. Omidi, A.; Pflugmacher, S.; Kaplan, A.; Kim, Y.J.; Esterhuizen, M. Reviewing Interspecies Interactions as a Driving Force Affecting the Community Structure in Lakes via Cyanotoxins. Microorganisms 2021, 9, 1583. [Google Scholar] [CrossRef]
  12. Zilliges, Y.; Kehr, J.-C.; Meissner, S.; Ishida, K.; Mikkat, S.; Hagemann, M.; Kaplan, A.; Börner, T.; Dittmann, E. The Cyanobacterial Hepatotoxin Microcystin Binds to Proteins and Increases the Fitness of Microcystis under Oxidative Stress Conditions. PLoS ONE 2011, 6, e17615. [Google Scholar] [CrossRef] [PubMed]
  13. García-Espín, L.; Cantoral, E.A.; Asencio, A.D.; Aboal, M. Microcystins and cyanophyte extracts inhibit or promote the photosynthesis of fluvial algae. Ecological and management implications. Ecotoxicology 2017, 26, 658–666. [Google Scholar] [CrossRef]
  14. Li, Z.; Zheng, Y.; Ma, H.; Cui, F. Microcystin-LR (MC-LR) inhibits green algae growth by regulating antioxidant and photosynthetic systems. Harmful Algae 2024, 134, 102623. [Google Scholar] [CrossRef] [PubMed]
  15. Kurmayer, R.; Christiansen, G.; Chorus, I. The Abundance of Microcystin-Producing Genotypes Correlates Positively with Colony Size in Microcystis sp. and Determines Its Microcystin Net Production in Lake Wannsee. Appl. Environ. 2003, 69, 787–795. [Google Scholar] [CrossRef]
  16. Phelan, R.R.; Downing, T.G. The localization of exogenous microcystin LR taken up by a non-microcystin producing cyanobacterium. Toxicon 2014, 89, 87–90. [Google Scholar] [CrossRef]
  17. Zhou, Y.; Xu, J.; MacIsaac, H.J.; McKay, R.M.; Xu, R.; Pei, Y.; Zi, Y.; Li, J.; Qian, Y.; Chang, X. Comparative metabolomic analysis of exudates of microcystin-producing and microcystin-free Microcystis aeruginosa strains. Front. Microbiol. 2023, 13, 1075621. [Google Scholar] [CrossRef] [PubMed]
  18. Meng, X.; Ban, M.; Wu, Z.; Huang, L.; Wang, Z.; Cheng, Y. Morchella Effectively Removes Microcystins Produced by Microcystis aeruginosa. Microbes Environ. 2024, 39, 23101. [Google Scholar] [CrossRef]
  19. Luter, H.M.; Gibb, K.; Webster, N.S. Eutrophication has no short-term effect on the Cymbastela stipitata holobiont. Front. Microbiol. 2014, 5, 216. [Google Scholar] [CrossRef]
  20. Wang, X.; Luo, Y.; Zhang, S.; Zhou, L. Acetylacetone effectively controlled the secondary metabolites of Microcystis aeruginosa under simulated sunlight irradiation. J. Environ. Sci. 2022, 135, 285–295. [Google Scholar] [CrossRef]
  21. Dai, R.; Li, Z.; Yan, F.; An, L.; Du, W.; Li, X. Evaluation of changes in M. aeruginosa growth and microcystin production under phosphorus starvation via transcriptomic surveys. Sci. Total Environ. 2023, 893, 164848. [Google Scholar] [CrossRef]
  22. Maqbool, A.; Ali, S.; Rizwan, M.; Ishaque, W.; Rasool, N.; Rehman, M.Z.U.; Bashir, A.; Abid, M.; Wu, L. Management of tannery wastewater for improving growth attributes and reducing chromium uptake in spinach through citric acid application. Environ. Sci. Pollut. 2018, 25, 10848–10856. [Google Scholar] [CrossRef]
  23. Sang, W.; Du, C.; Ni, L.; Li, S.; Hamad, A.A.A.; Xu, C.; Shao, C. Physiological and molecular mechanisms of the inhibitory effects of artemisinin on Microcystis aeruginosa and Chlorella pyrenoidosa. J. Hazard. Mater. 2024, 470, 134241. [Google Scholar] [CrossRef] [PubMed]
  24. Metzler, D.M.; Erdem, A.; Tseng, Y.H.; Huang, C.P. Responses of Algal Cells to Engineered Nanoparticles Measured as Algal Cell Population, Chlorophyll a, and Lipid Peroxidation: Effect of Particle Size and Type. J. Nanotechnol. 2012, 2012, 237284. [Google Scholar] [CrossRef]
  25. Li, B.; Yin, Y.; Kang, L.; Feng, L.; Liu, Y.; Du, Z.; Tian, Y.; Zhang, L. A review: Application of allelochemicals in water ecological restoration—Algal inhibition. Chemosphere 2021, 267, 128869. [Google Scholar] [CrossRef] [PubMed]
  26. He, Y.; Liu, M.; Wang, R.; Salam, M.; Yang, Y.; Zhang, Z.; He, Q.; Hu, X.; Li, H. Potassium regulates cadmium toxicity in Microcystis aeruginosa. J. Hazard. Mater. 2021, 413, 125374. [Google Scholar] [CrossRef]
  27. García–Nieto, P.J.; García–Gonzalo, E.; Alonso Fernández, J.R.; Díaz Muñiz, C. Forecast of chlorophyll-a concentration as an indicator of phytoplankton biomass in El Val reservoir by utilizing various machine learning techniques: A case study in Ebro river basin, Spain. J. Hydrol. 2024, 639, 131639. [Google Scholar] [CrossRef]
  28. Sun, Z.-C.; Geng, W.J.; Ren, B.Z.; Zhao, B.; Liu, P.; Zhang, J.W. Responses of the photosynthetic characteristics of summer maize to shading stress. J. Agron. Crop Sci. 2023, 209, 330–344. [Google Scholar] [CrossRef]
  29. Zhou, J.; Chen, G.F.; Ying, K.Z.; Jin, H.; Song, J.T.; Cai, Z.H. Phycosphere Microbial Succession Patterns and Assembly Mechanisms in a Marine Dinoflagellate Bloom. Appl. Environ. 2019, 85, e00349-19. [Google Scholar] [CrossRef]
  30. Tang, G.-L.; Li, X.-Y.; Lin, L.-S.; Gu, Z.-Y.; Zeng, F.-J. The Chlorophyll a Fluorescence Characteristic in Different Types of Leaf Senescence in Alhagi sparsifolia. J. Plant Growth Regul. 2016, 35, 952–964. [Google Scholar] [CrossRef]
  31. Maliba, B.G.; Inbaraj, P.M.; Berner, J.M. The effect of ozone and drought on the photosynthetic performance of canola. J. Integr. Agric. 2018, 17, 1137–1144. [Google Scholar] [CrossRef]
  32. Hermans, C.; Smeyers, M.; Rodriguez, R.M.; Eyletters, M.; Strasser, R.J.; Delhaye, J.-P. Quality assessment of urban trees: A comparative study of physiological characterisation, airborne imaging and on site fluorescence monitoring by the OJIP-test. J. Plant Physiol. 2003, 160, 81–90. [Google Scholar] [CrossRef]
  33. Todorenko, D.; Timofeev, N.; Kovalenko, I.; Kukarskikh, G.; Matorin, D.; Antal, T. Chromium effects on photosynthetic electron transport in pea (Pisum sativum L.). Planta 2019, 251, 11. [Google Scholar] [CrossRef]
  34. Giorio, P.; Sellami, M.H. Polyphasic OKJIP Chlorophyll a Fluorescence Transient in a Landrace and a Commercial Cultivar of Sweet Pepper (Capsicum annuum L.) under Long-Term Salt Stress. Plants 2021, 10, 887. [Google Scholar] [CrossRef]
  35. Yusuf, M.A.; Kumar, D.; Rajwanshi, R.; Strasser, R.J.; Tsimilli-Michael, M.; Govindjee, n.; Sarin, N.B. Overexpression of γ-tocopherol methyl transferase gene in transgenic Brassica juncea plants alleviates abiotic stress: Physiological and chlorophyll a fluorescence measurements. BBA-Bioenergetics 2010, 1797, 1428–1438. [Google Scholar] [CrossRef]
  36. Kesheri, M.; Kanchan, S.; Sinha, R.P. Responses of antioxidants for resilience to temporal variations in the cyanobacterium Microcystis aeruginosa. S. Afr. J. Bot. 2022, 148, 190–199. [Google Scholar] [CrossRef]
  37. Ikeda, S.; Matsushima, S.; Okabe, K.; Ishikita, A.; Tadokoro, T.; Enzan, N.; Yamamoto, T.; Sada, M.; Deguchi, H.; Ikeda, M.; et al. P6283Downregulation of Tim44 exacerbates oxidative stress-induced ROS production and cardiomyocytes death by reducing mitochondrial SOD2. Eur. Heart J. 2019, 40 (Suppl. S1), ehz746.0881. [Google Scholar] [CrossRef]
  38. Wang, S.; Zhao, Y.; Guo, J.; Liu, Y. Antioxidative response in leaves and allelochemical changes in root exudates of Ricinus communis under Cu, Zn, and Cd stress. Environ. Sci. Pollut. 2018, 25, 32747–32755. [Google Scholar] [CrossRef]
  39. Mostafa, I.; Abbas, H.A.; Ashour, M.L.; Yasri, A.; El-Shazly, A.M.; Wink, M.; Sobeh, M. Polyphenols from Salix tetrasperma Impair Virulence and Inhibit Quorum Sensing of Pseudomonas aeruginosa. Molecules 2020, 25, 1341. [Google Scholar] [CrossRef]
  40. Bosak, T.; Losick, R.M.; Pearson, A. A polycyclic terpenoid that alleviates oxidative stress. PNAS 2008, 105, 6725–6729. [Google Scholar] [CrossRef]
  41. Wishart, D.S.; Feunang, Y.D.; Marcu, A.; Guo, A.C.; Liang, K.; Vázquez-Fresno, R.; Sajed, T.; Johnson, D.; Li, C.; Karu, N.; et al. HMDB 4.0: The human metabolome database for 2018. Nucleic Acids Res. 2018, 46, D608–D617. [Google Scholar] [CrossRef] [PubMed]
  42. Zhang, X.; Wang, G.; Xue, H.; Zhang, J.; Wang, Q.; Zhang, Z.; Zhang, B. Metabolite Profile of Xylem Sap in Cotton Seedlings Is Changed by K Deficiency. Front. Plant Sci. 2020, 11, 592591. [Google Scholar] [CrossRef]
  43. Du, Y.; Wang, J.; Zhu, F.; Mai, D.; Xiang, Z.; Chen, J.; Guo, R. Comprehensive assessment of three typical antibiotics on cyanobacteria (Microcystis aeruginosa): The impact and recovery capability. Ecotoxicol. Environ. Saf. 2018, 160, 84–93. [Google Scholar] [CrossRef]
  44. Zhang, X.-l.; Zhu, Q.-Q.; Chen, C.-Y.; Xie, B.; Tang, B.-G.; Fan, M.-H.; Hu, Q.-J.; Liao, Z.; Yan, X.-J. The growth inhibitory effects and non-targeted metabolomic profiling of Microcystis aeruginosa treated by Scenedesmus sp. Chemosphere 2023, 338, 139446. [Google Scholar] [CrossRef] [PubMed]
  45. Katayama, N.; Iwazumi, K.; Suzuki, H.; Osanai, T.; Ito, S. Malic Enzyme, not Malate Dehydrogenase, Mainly Oxidizes Malate That Originates from the Tricarboxylic Acid Cycle in Cyanobacteria. mBio 2022, 13, e02187-22. [Google Scholar] [CrossRef]
  46. Dao, O.; Kuhnert, F.; Weber, A.P.M.; Peltier, G.; Li-Beisson, Y. Physiological functions of malate shuttles in plants and algae. Trends Plant Sci. 2022, 27, 488–501. [Google Scholar] [CrossRef] [PubMed]
  47. Evans, J.R. The relationship between carbon-dioxide-limited photosynthetic rate and ribulose-1,5-bisphosphate-carboxylase content in two nuclear-cytoplasm substitution lines of wheat, and the coordination of ribulose-bisphosphate-carboxylation and electron-transport capacities. Planta 1986, 167, 351–358. [Google Scholar] [CrossRef]
  48. Makino, A.; Mae, T.; Ohira, K. Differences between wheat and rice in the enzymic properties of ribulose-1,5-bisphosphate carboxylase/oxygenase and the relationship to photosynthetic gas exchange. Planta 1988, 174, 30–38. [Google Scholar] [CrossRef]
  49. Suzuki, Y.; Wada, S.; Kondo, E.; Yamori, W.; Makino, A. Effects of co-overproduction of sedoheptulose-1,7-bisphosphatase and Rubisco on photosynthesis in rice. Soil Sci. Plant Nutr. 2018, 65, 36–40. [Google Scholar] [CrossRef]
  50. Guo, Y.; Zhao, X.; Yao, Z.; Qian, Z.; Wang, Y.; Xian, Q. The effects of exogenous amino acids on production of microcystin variants in Microcystis aeruginosa. Aquat. Toxicol. 2023, 259, 106525. [Google Scholar] [CrossRef]
  51. Dai, R.; Zhou, Y.; Chen, Y.; Zhang, X.; Yan, Y.; An, D. Effects of arginine on the growth and microcystin-LR production of Microcystis aeruginosa in culture. Sci. Total Environ. 2019, 651, 706–712. [Google Scholar] [CrossRef] [PubMed]
Figure 1. Changes in CFU over 120 h. Changes in cell density of microcystin (MC)-producing strains over time (a); changes in cell density of MC-free strains over time (b).
Water 17 00993 g001
Figure 2. Transmission electron microscopic images of MC-producing (a,b) MC-free M. aeruginosa strains exposed to exogenous MC (MC-LR).
Water 17 00993 g002
Figure 3. Variations in chlorophyll a (Chl-a) levels across various MC-LR concentrations (a,b) and fluorescence parameter plots following 120 h of exposure to 50 μg L−1 MC-LR (c,d). Different lowercase letters in the bar chart indicate significant differences between treatment groups (p < 0.05).
Water 17 00993 g003
Figure 4. Analysis of oxidative stimulation in both MC-producing and MC-free strains under MC-LR exposure, focusing on activity of superoxide dismutase (a,b) and lipid peroxidation (malondialdehyde (c,d)). Different lowercase letters in the bar chart indicate significant differences between treatment groups (p < 0.05).
Water 17 00993 g004
Figure 5. Changes in intracellular MC content of MC-producing (a) and MC-free strains (b) of M. aeruginosa.
Water 17 00993 g005
Figure 6. Differentially expressed metabolites were identified in the group exposed to 50 μg L−1 MC-LR and were compared to the control group. Results of principal component analysis indicating differences under different MC-LR concentrations in MC-producing (a) and MC-free (b) strains. Volcano plots illustrating different metabolites that were upregulated and downregulated in both MC-producing (c) and MC-free (d) M. aeruginosa strains. A variable importance (VIP) graph displaying the top 30 VIP values alongside a heat map illustrating metabolite content (e,f). Metabolites are ordered by VIP value from highest to lowest. Adjacent to the result, a heat map displays metabolite expression, where each column corresponds to one sample, as labeled below. Each row represents a metabolite, where color intensity reflects its relative expression across samples, as indicated by the gradient color scale.
Water 17 00993 g006
Figure 7. The results of enrichment analysis of differentially expressed metabolites using KEGG pathways. The KEGG topology analysis bubble diagram was obtained based on the p value and impact value of the metabolite enrichment pathway; larger bubbles in the diagram indicate a greater importance of the pathway (a,b). An enrichment analysis network diagram with PI > 0 was constructed to represent the interrelationships between enrichment pathways (c,d). Dots represent metabolite enrichment pathways, the size of which reflects the number of differentially expressed metabolites involved. Gray dots denote complementary connectivity pathways.
Water 17 00993 g007
Figure 8. Arginine and proline metabolism as well as arginine biosynthesis pathways.
Water 17 00993 g008
Disclaimer/Publisher’s Note: The statements, opinions and data contained in all publications are solely those of the individual author(s) and contributor(s) and not of MDPI and/or the editor(s). MDPI and/or the editor(s) disclaim responsibility for any injury to people or property resulting from any ideas, methods, instructions or products referred to in the content.

