
Time Series Analysis and Temporal Stability of Shallow Soil Moisture in a High-Fill Slope of the Loess Plateau, China

 , ,
, ,
Abstract
1. Introduction
2. Materials and Methods
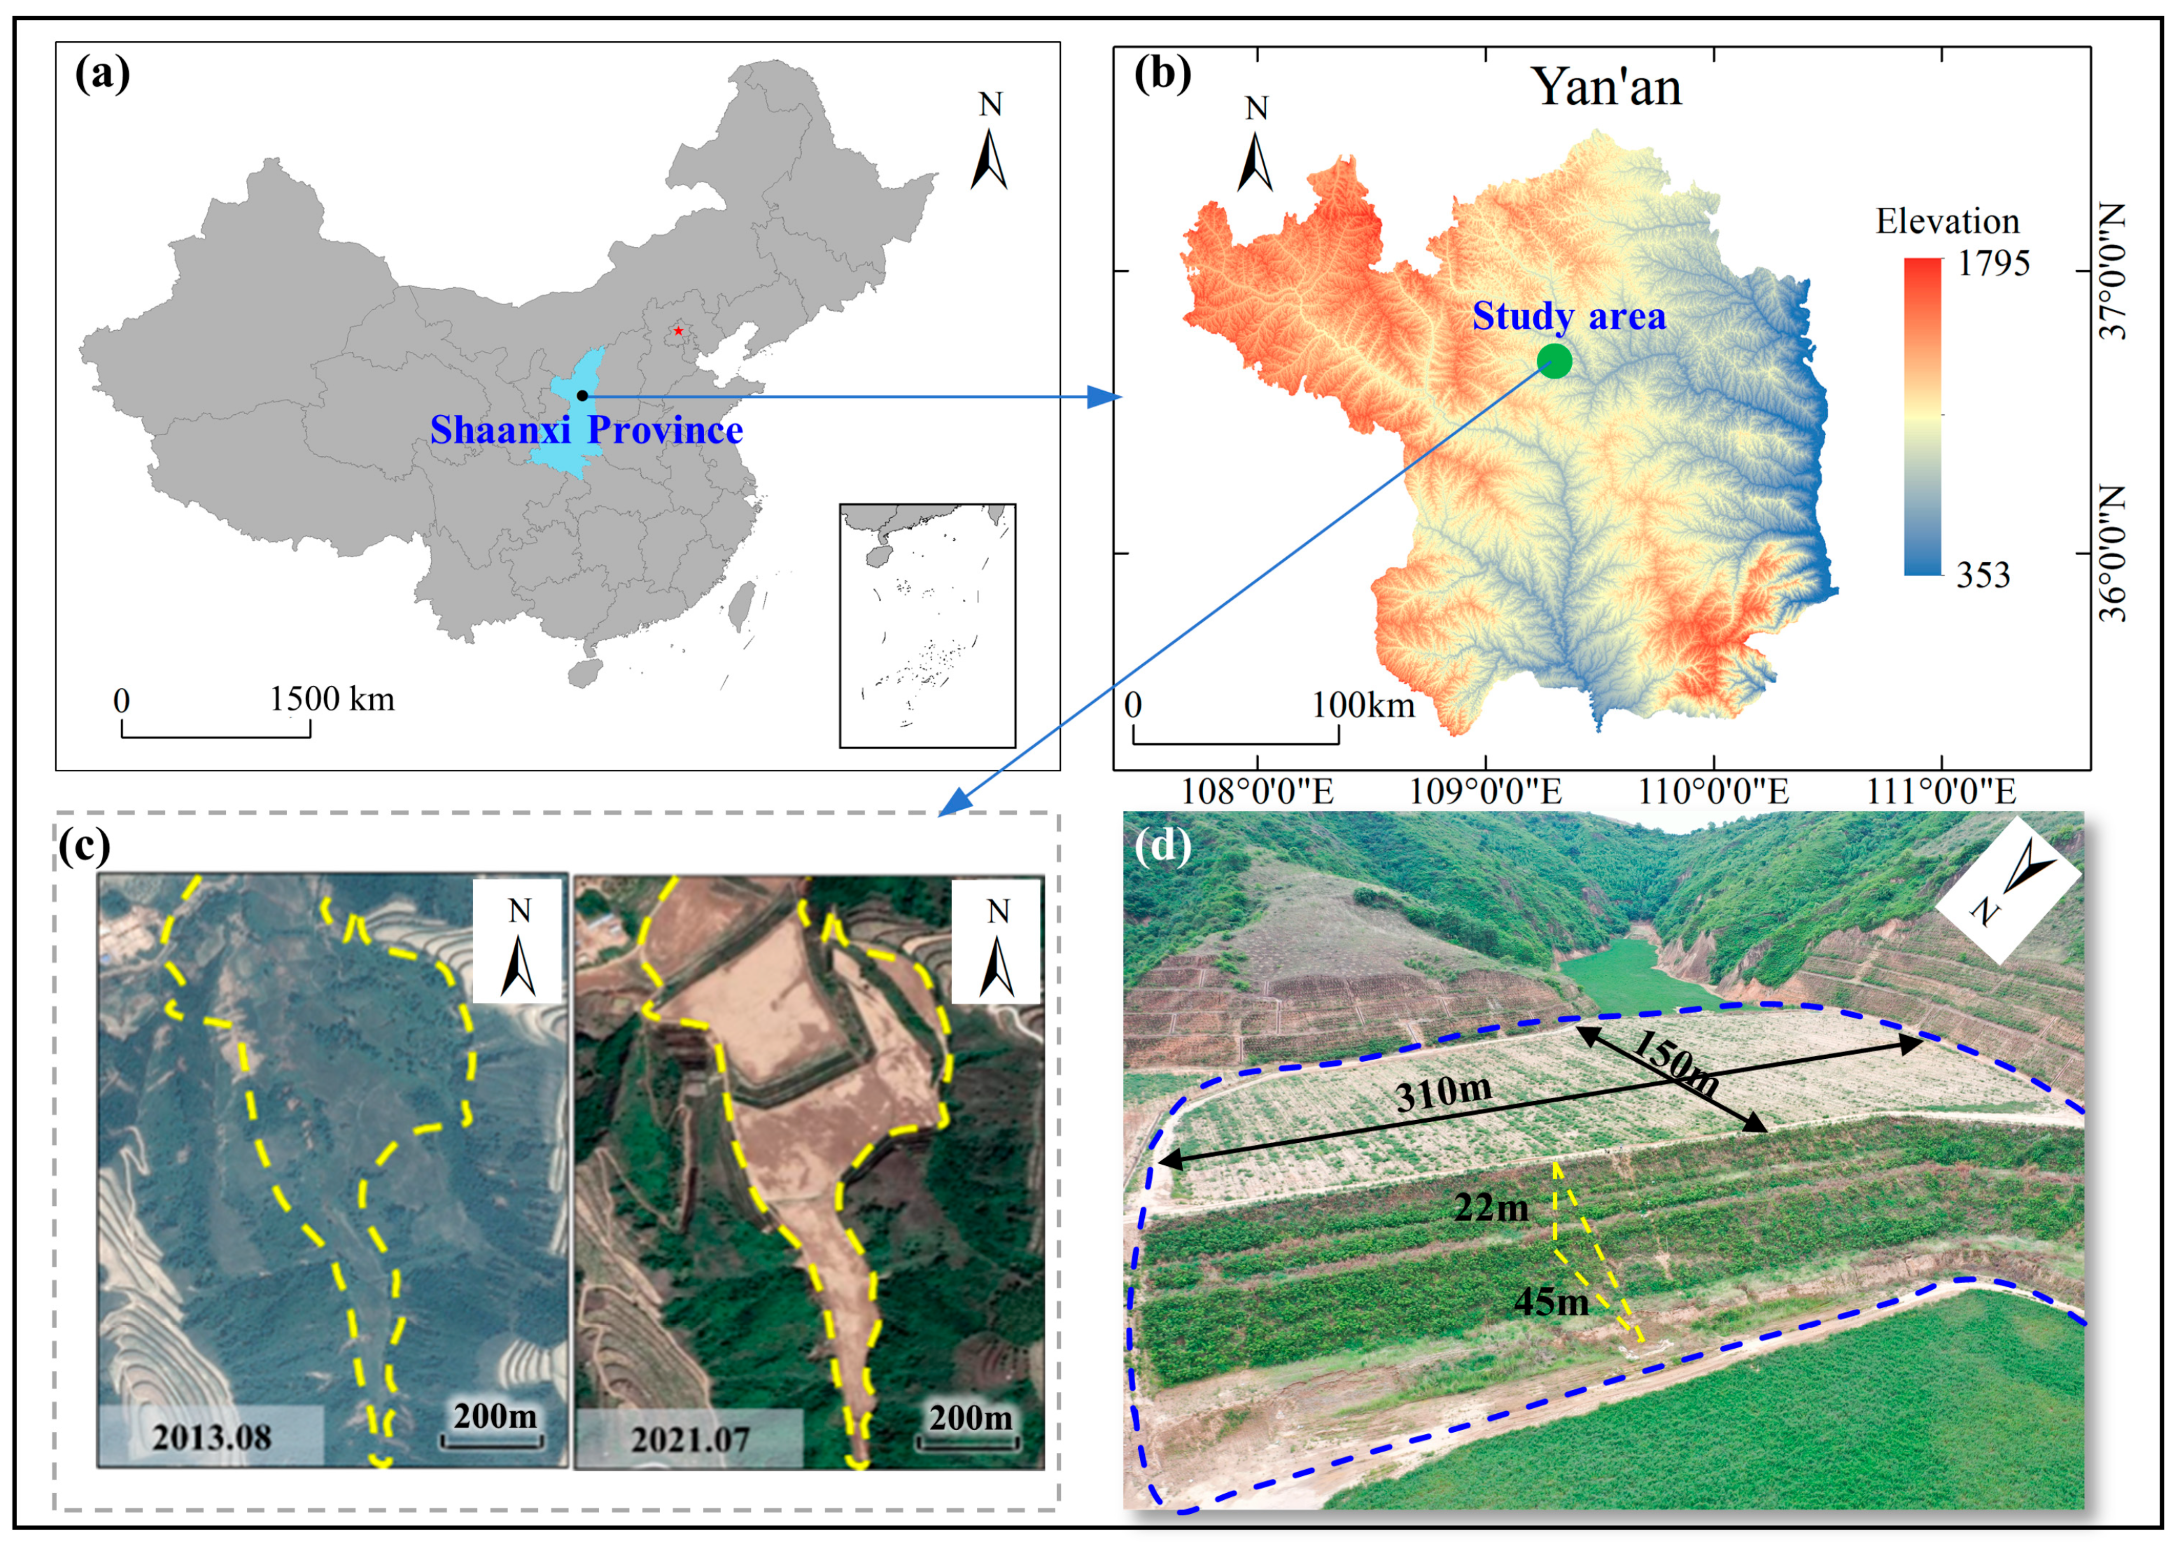
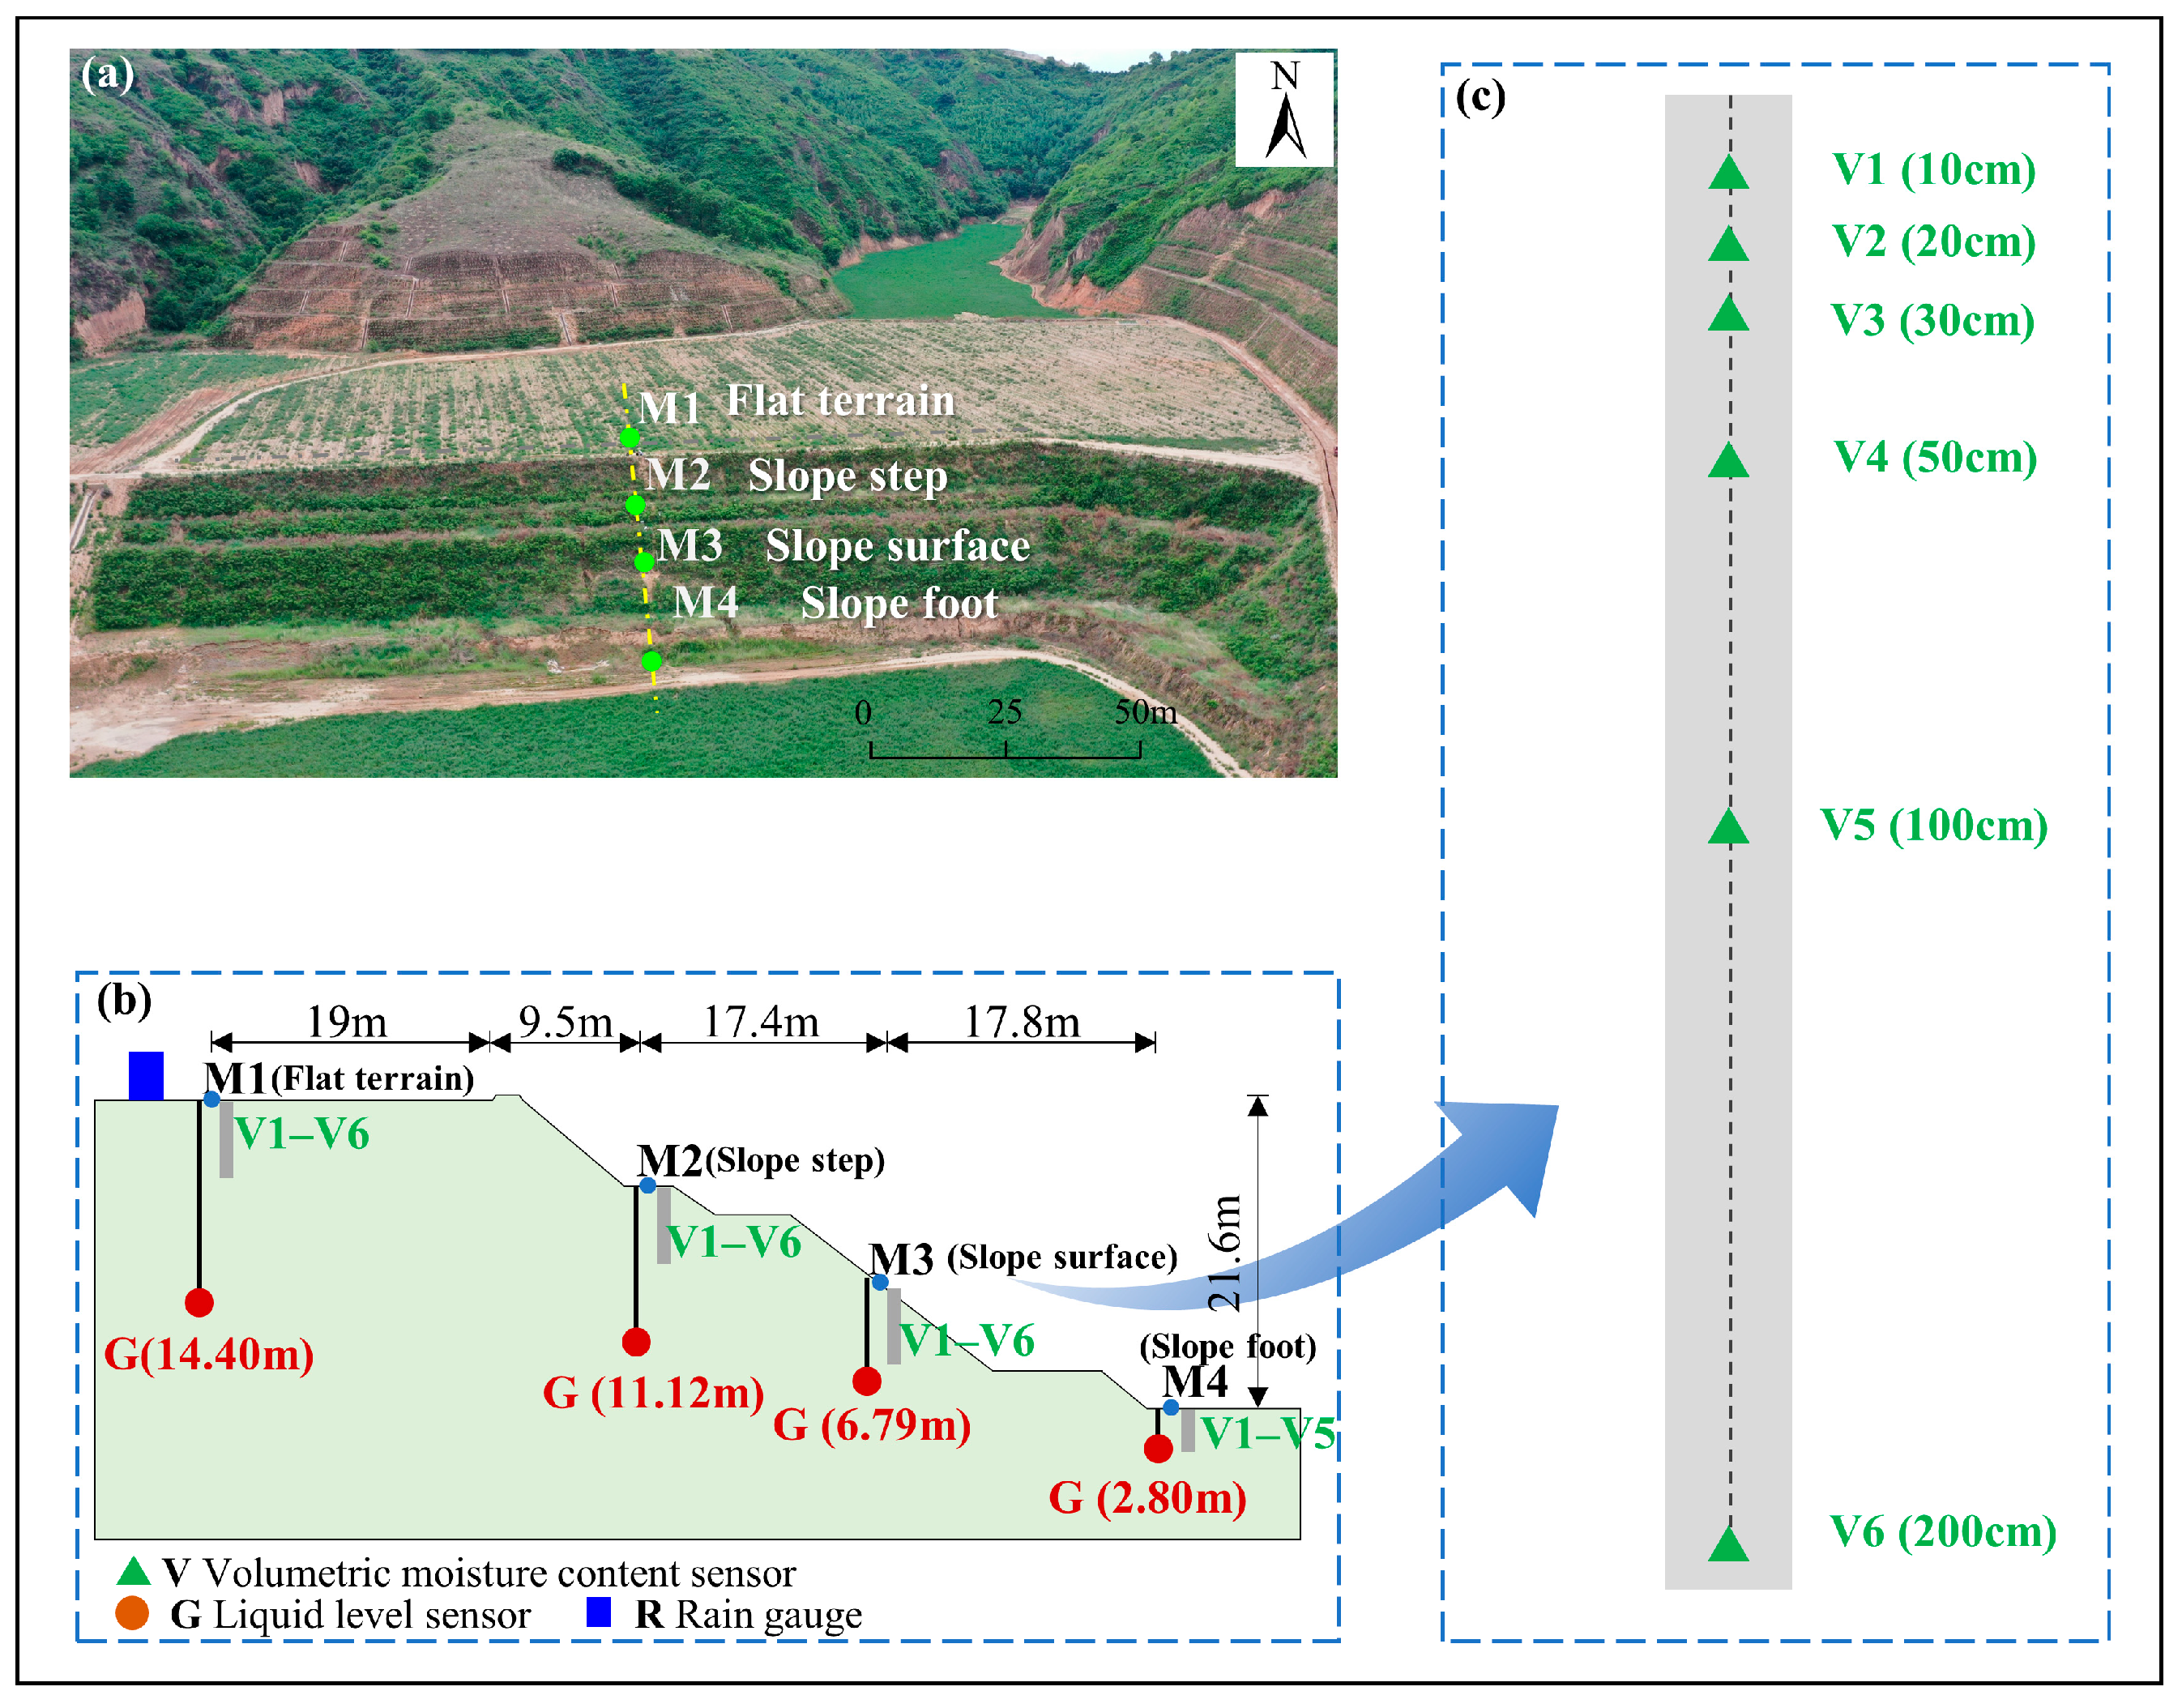
2.1. Study Area
2.2. Research Methods
2.2.1. In Situ Soil Moisture Dynamic Monitoring
2.2.2. Principles of Classical Statistical Methods
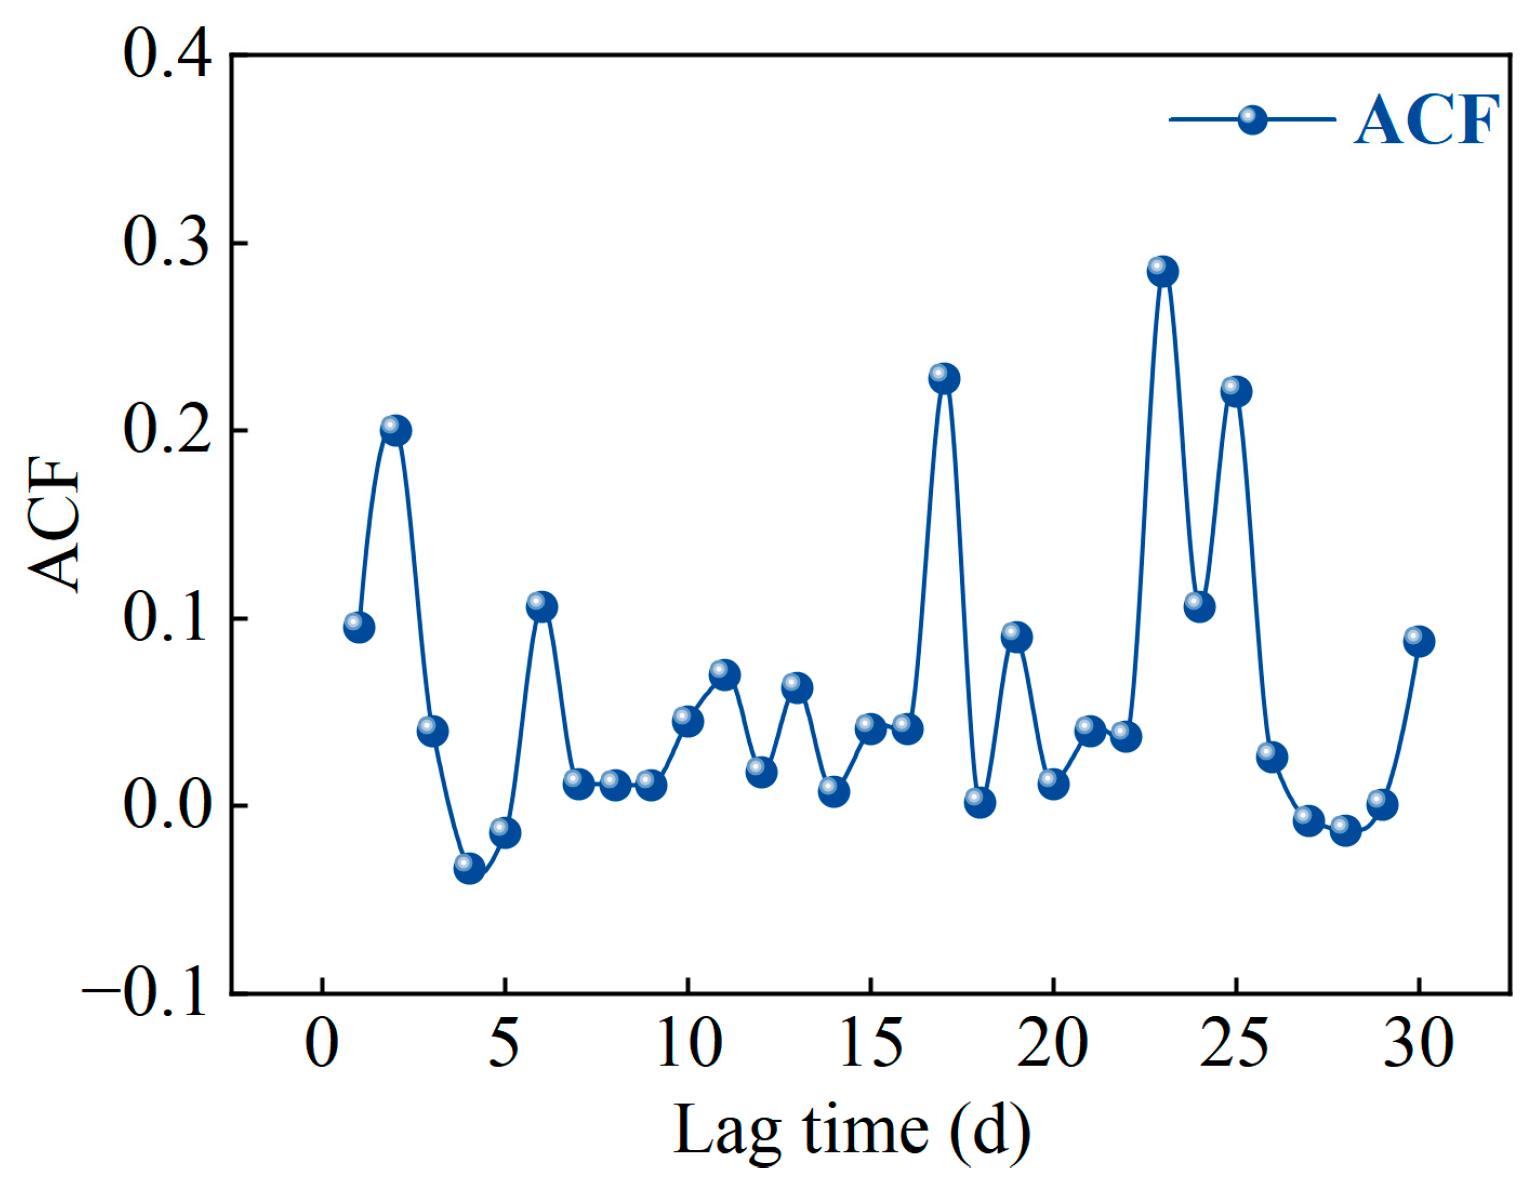
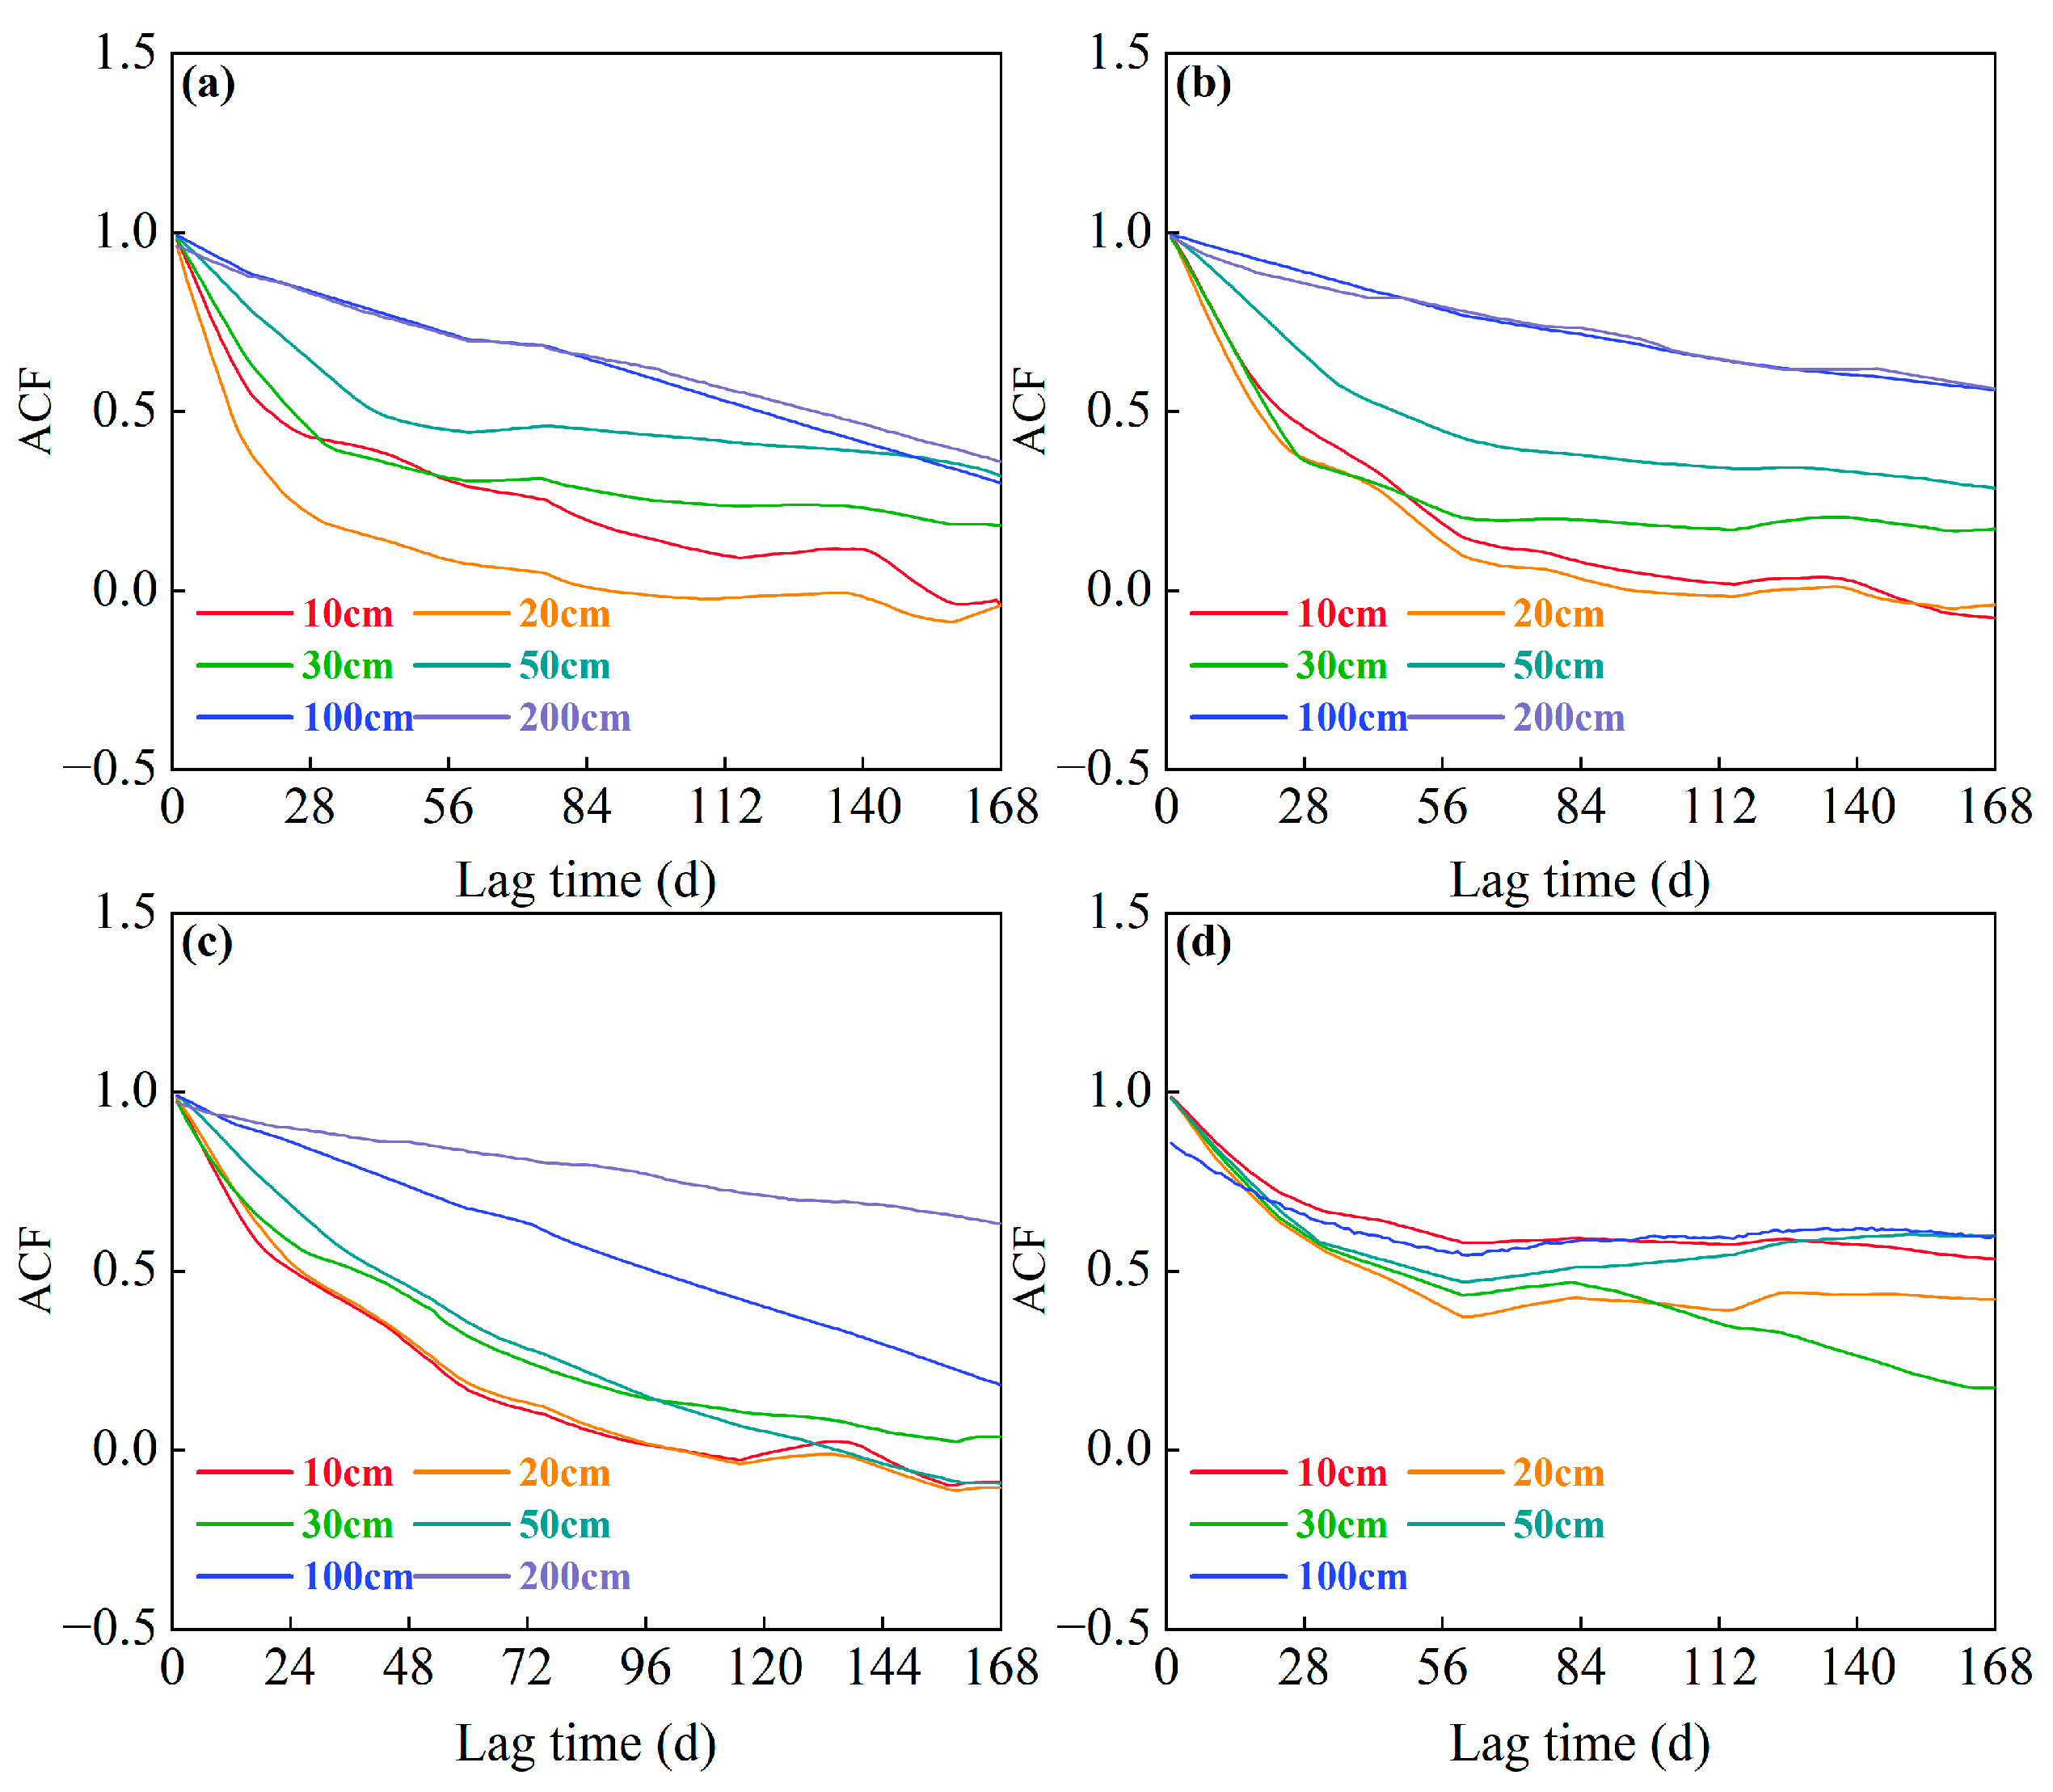
2.2.3. Principles of Time Series Analysis
2.2.4. Principles of Temporal Stability
3. Results
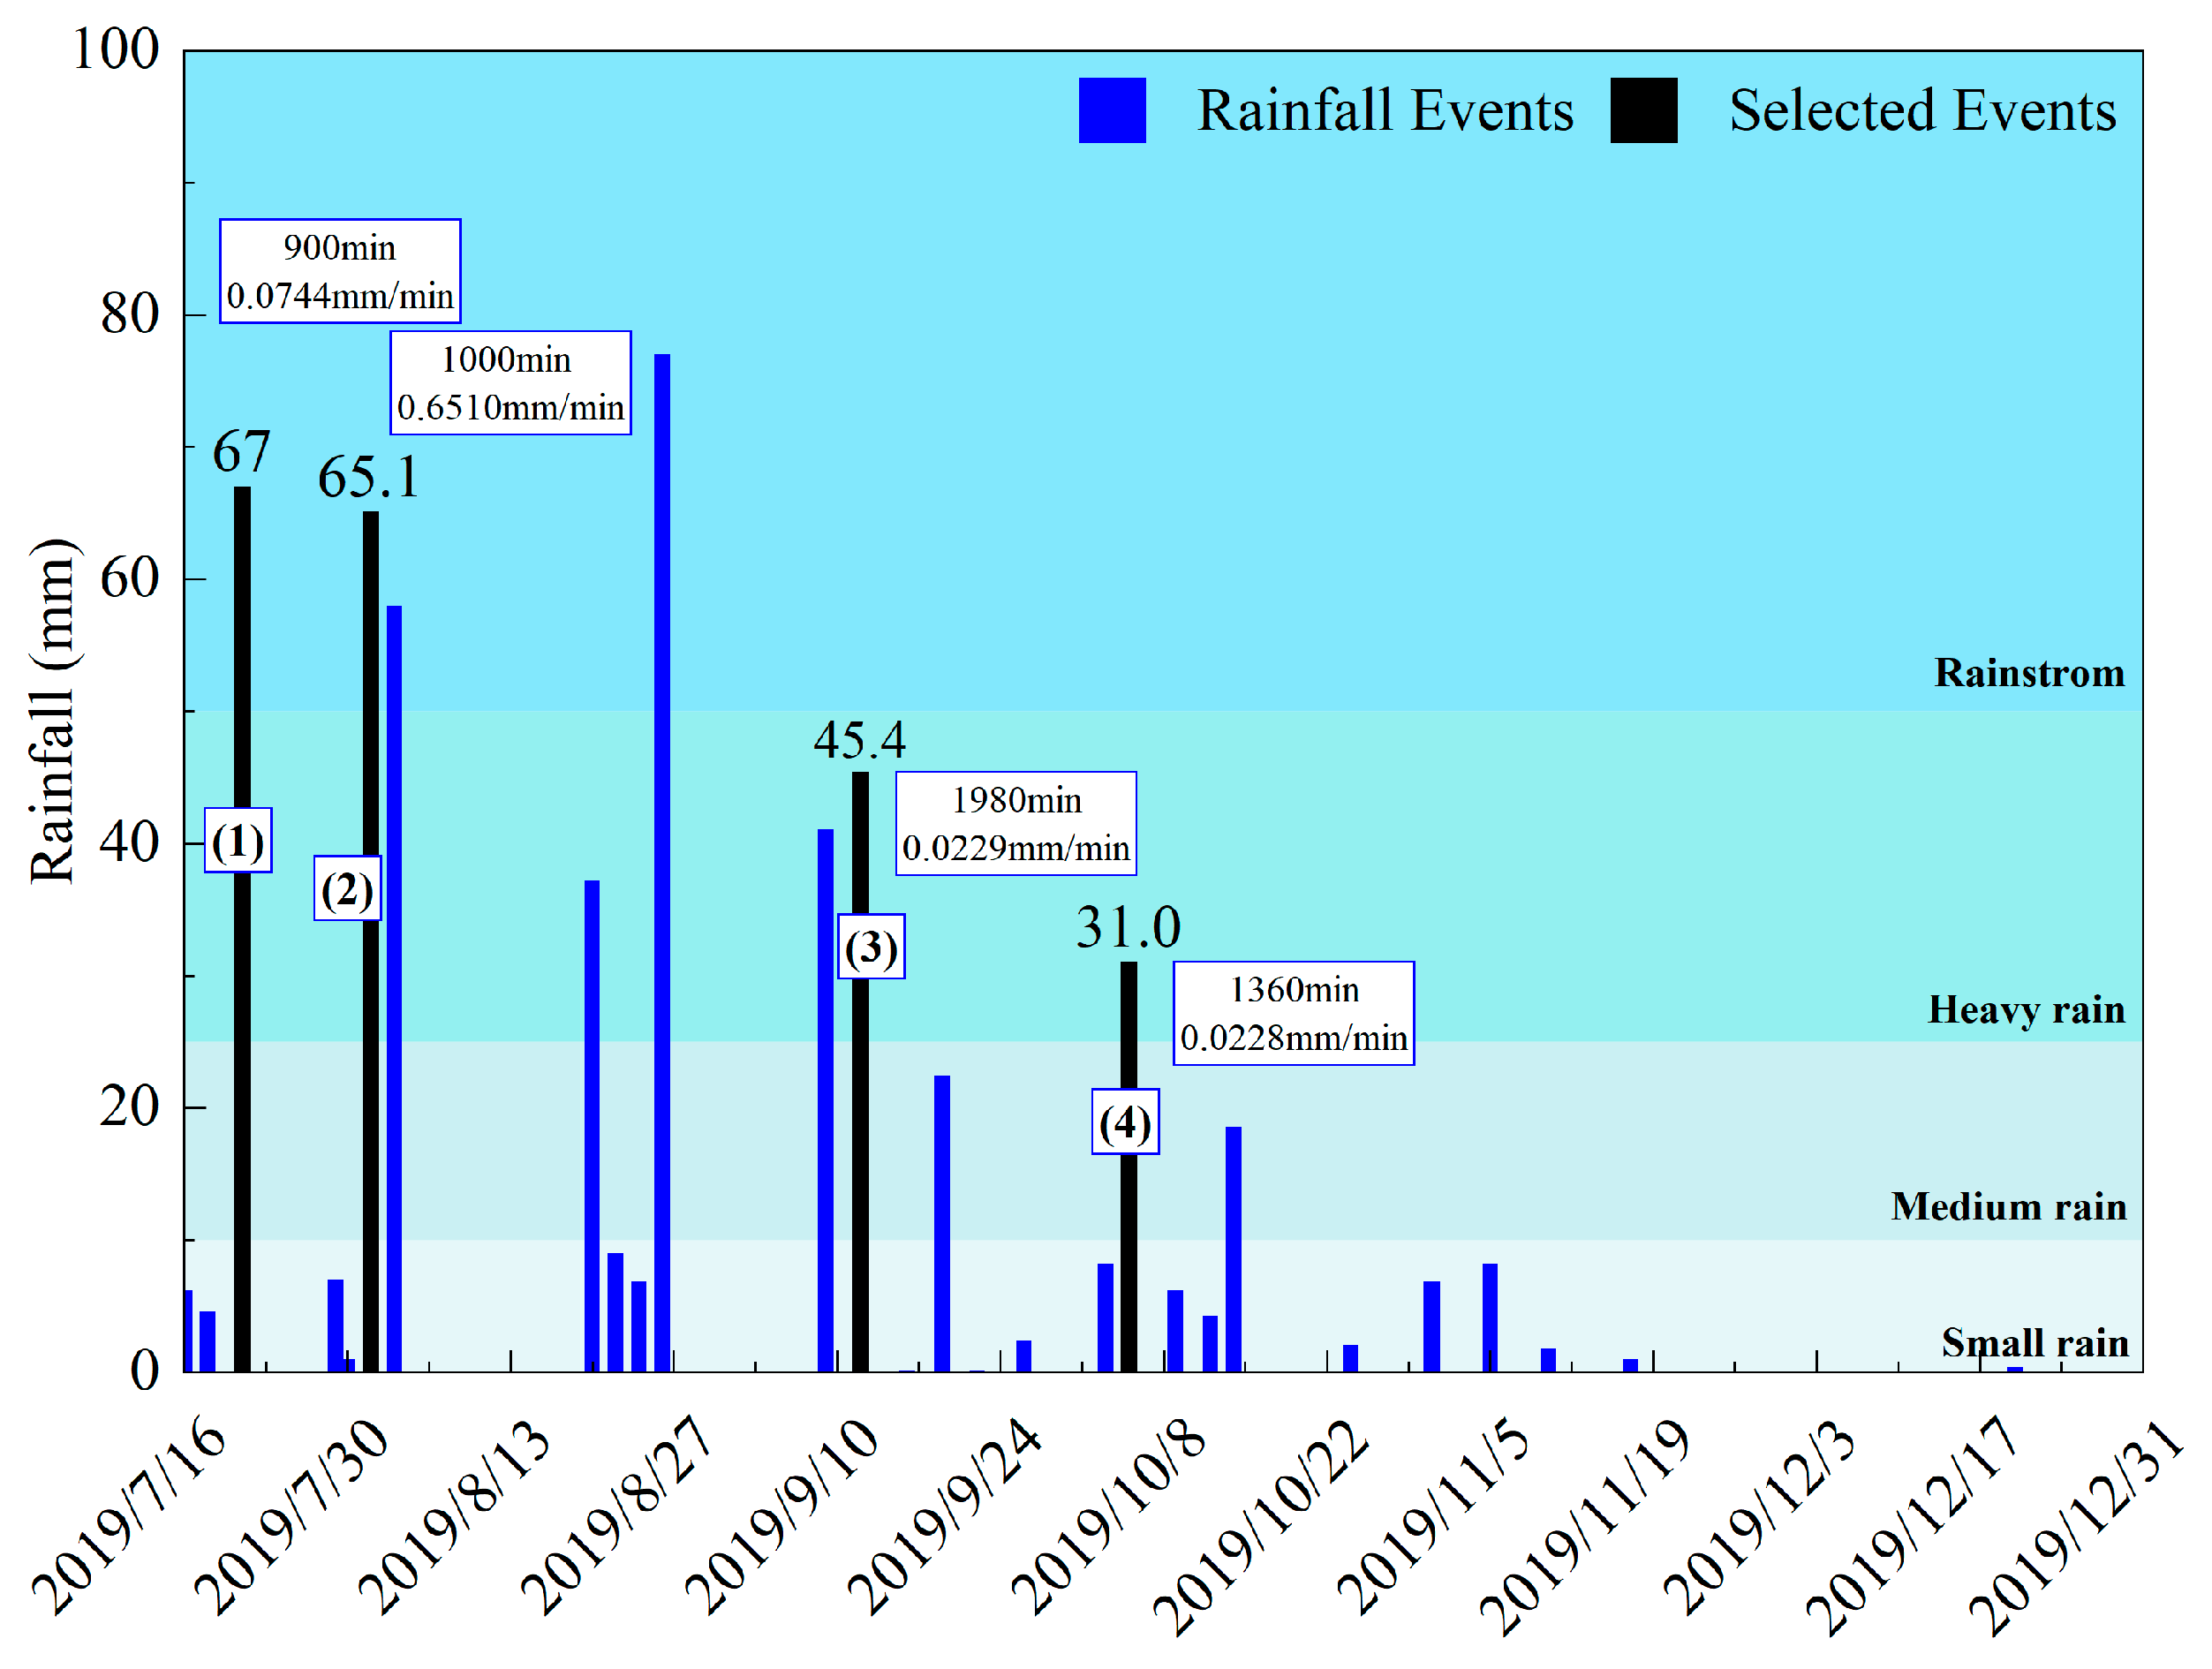
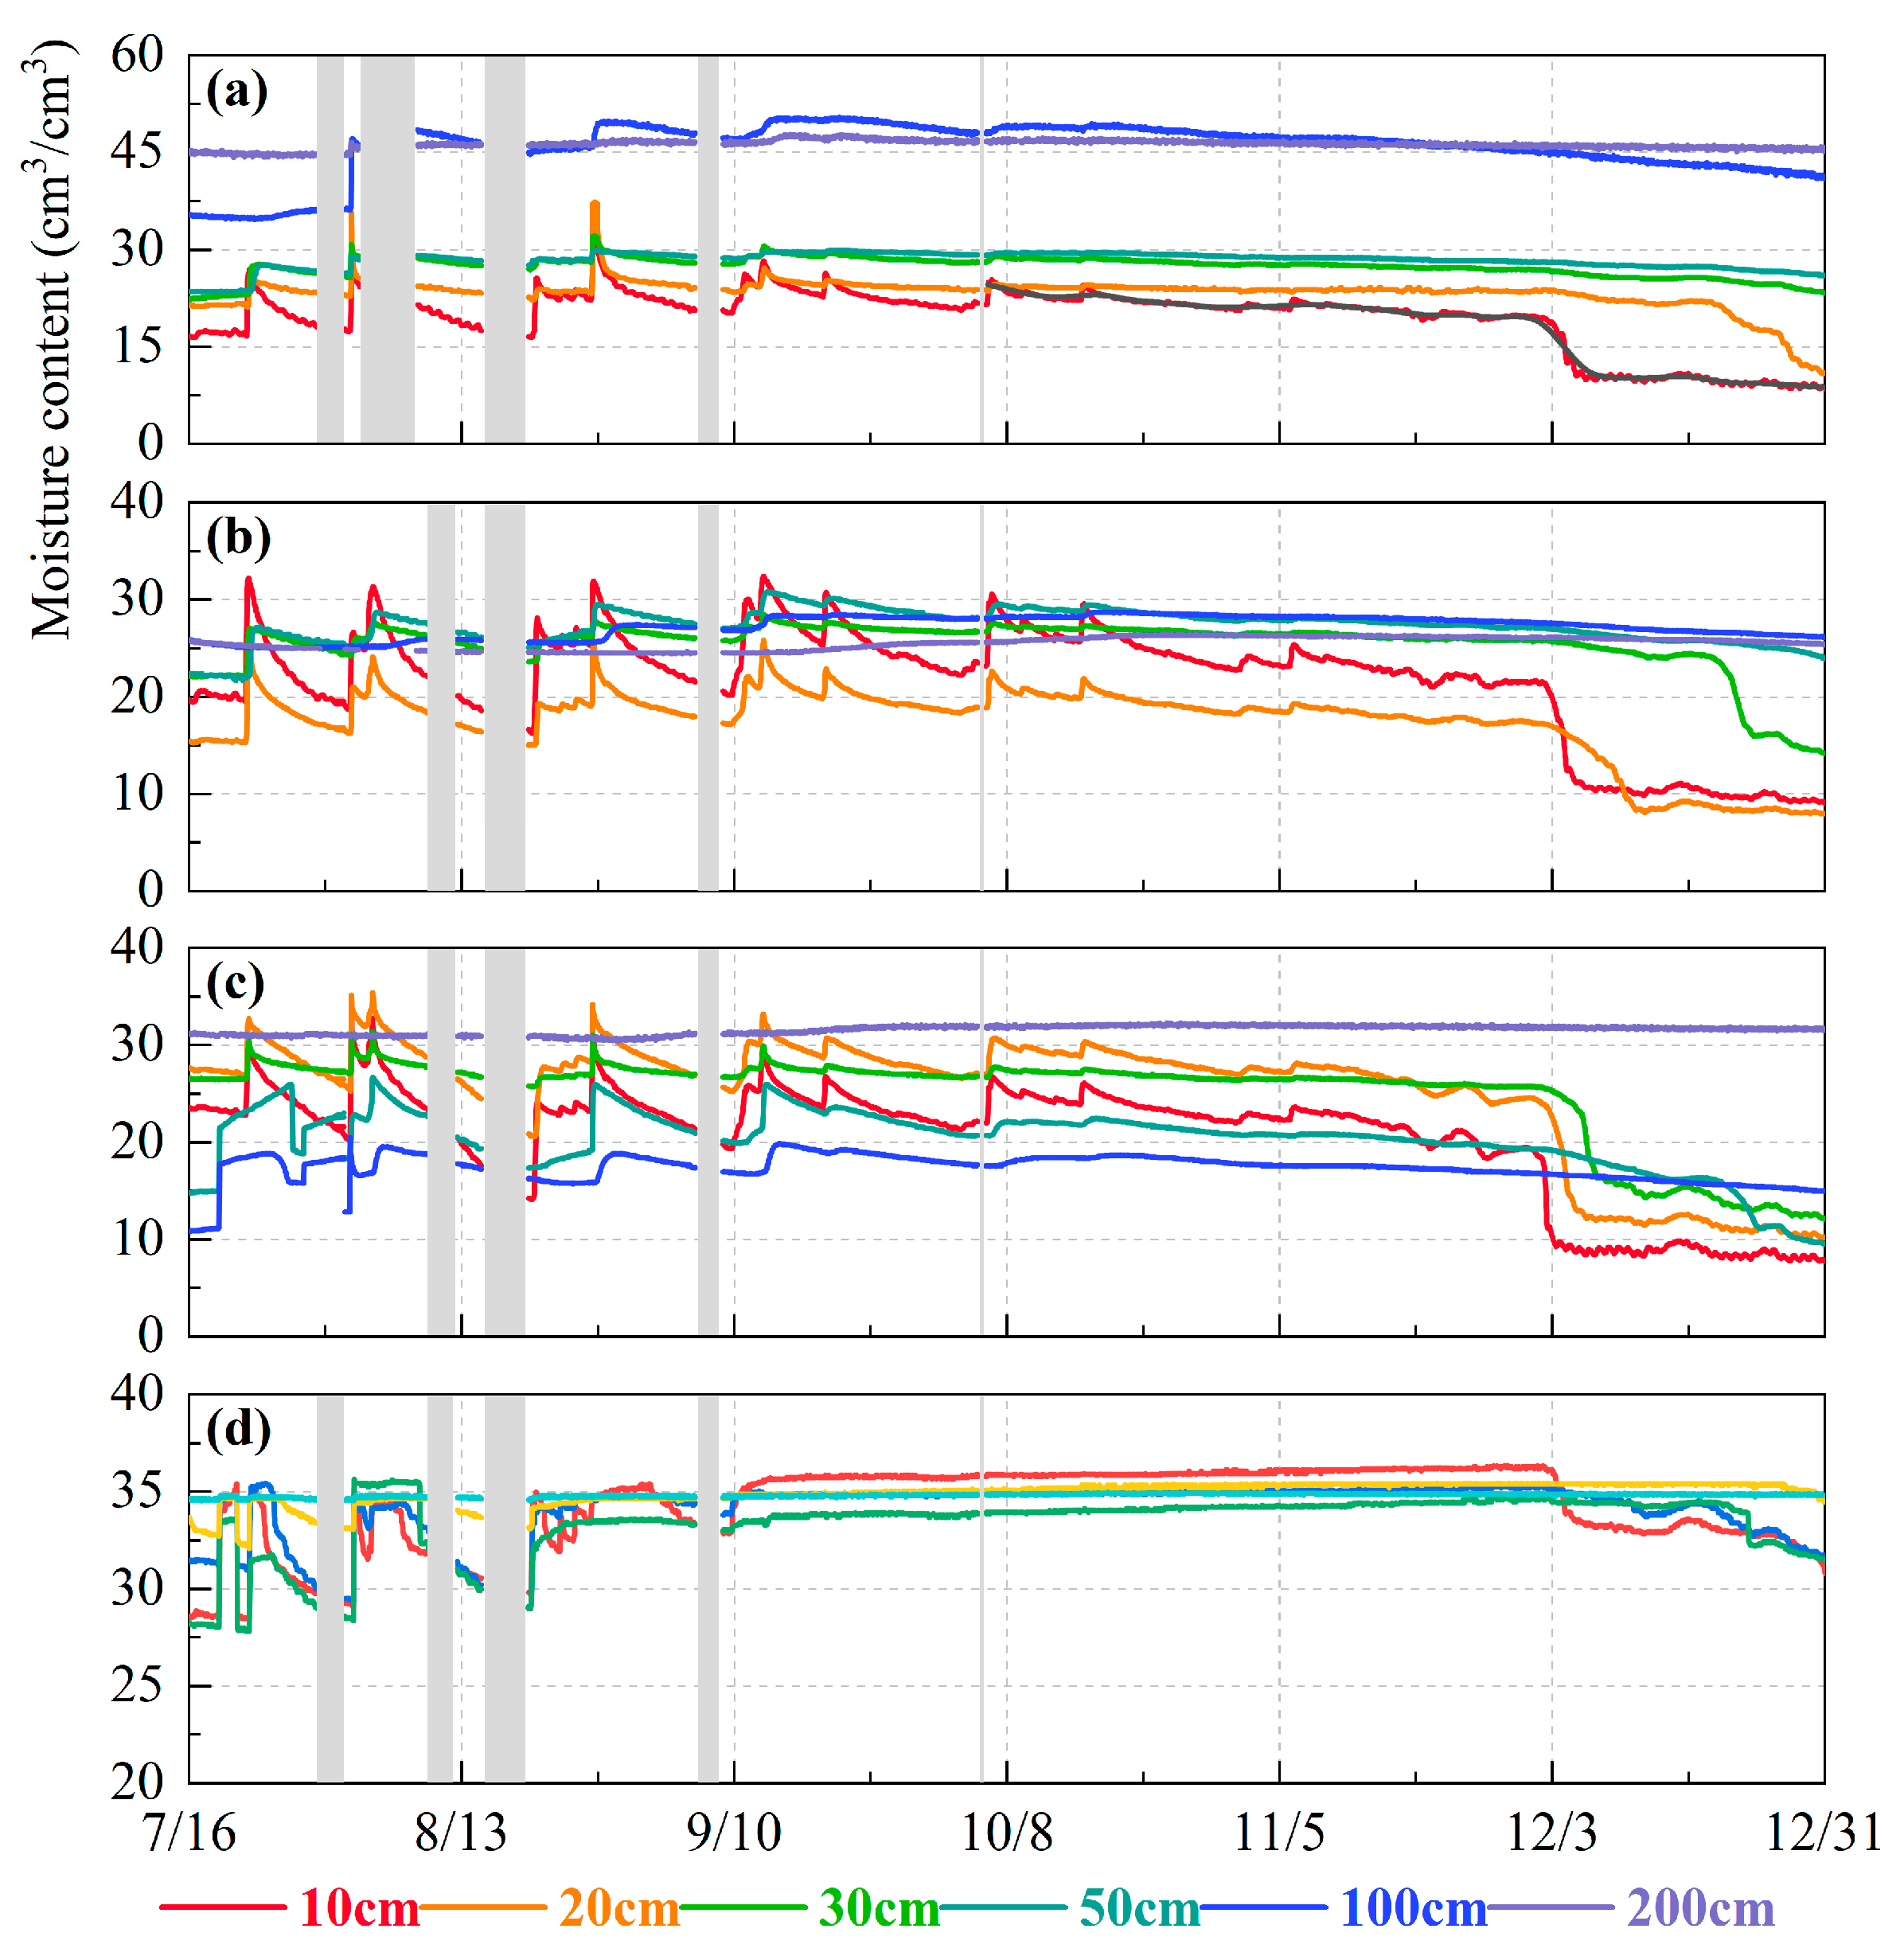
3.1. Rainfall Events and Soil Moisture Dynamics
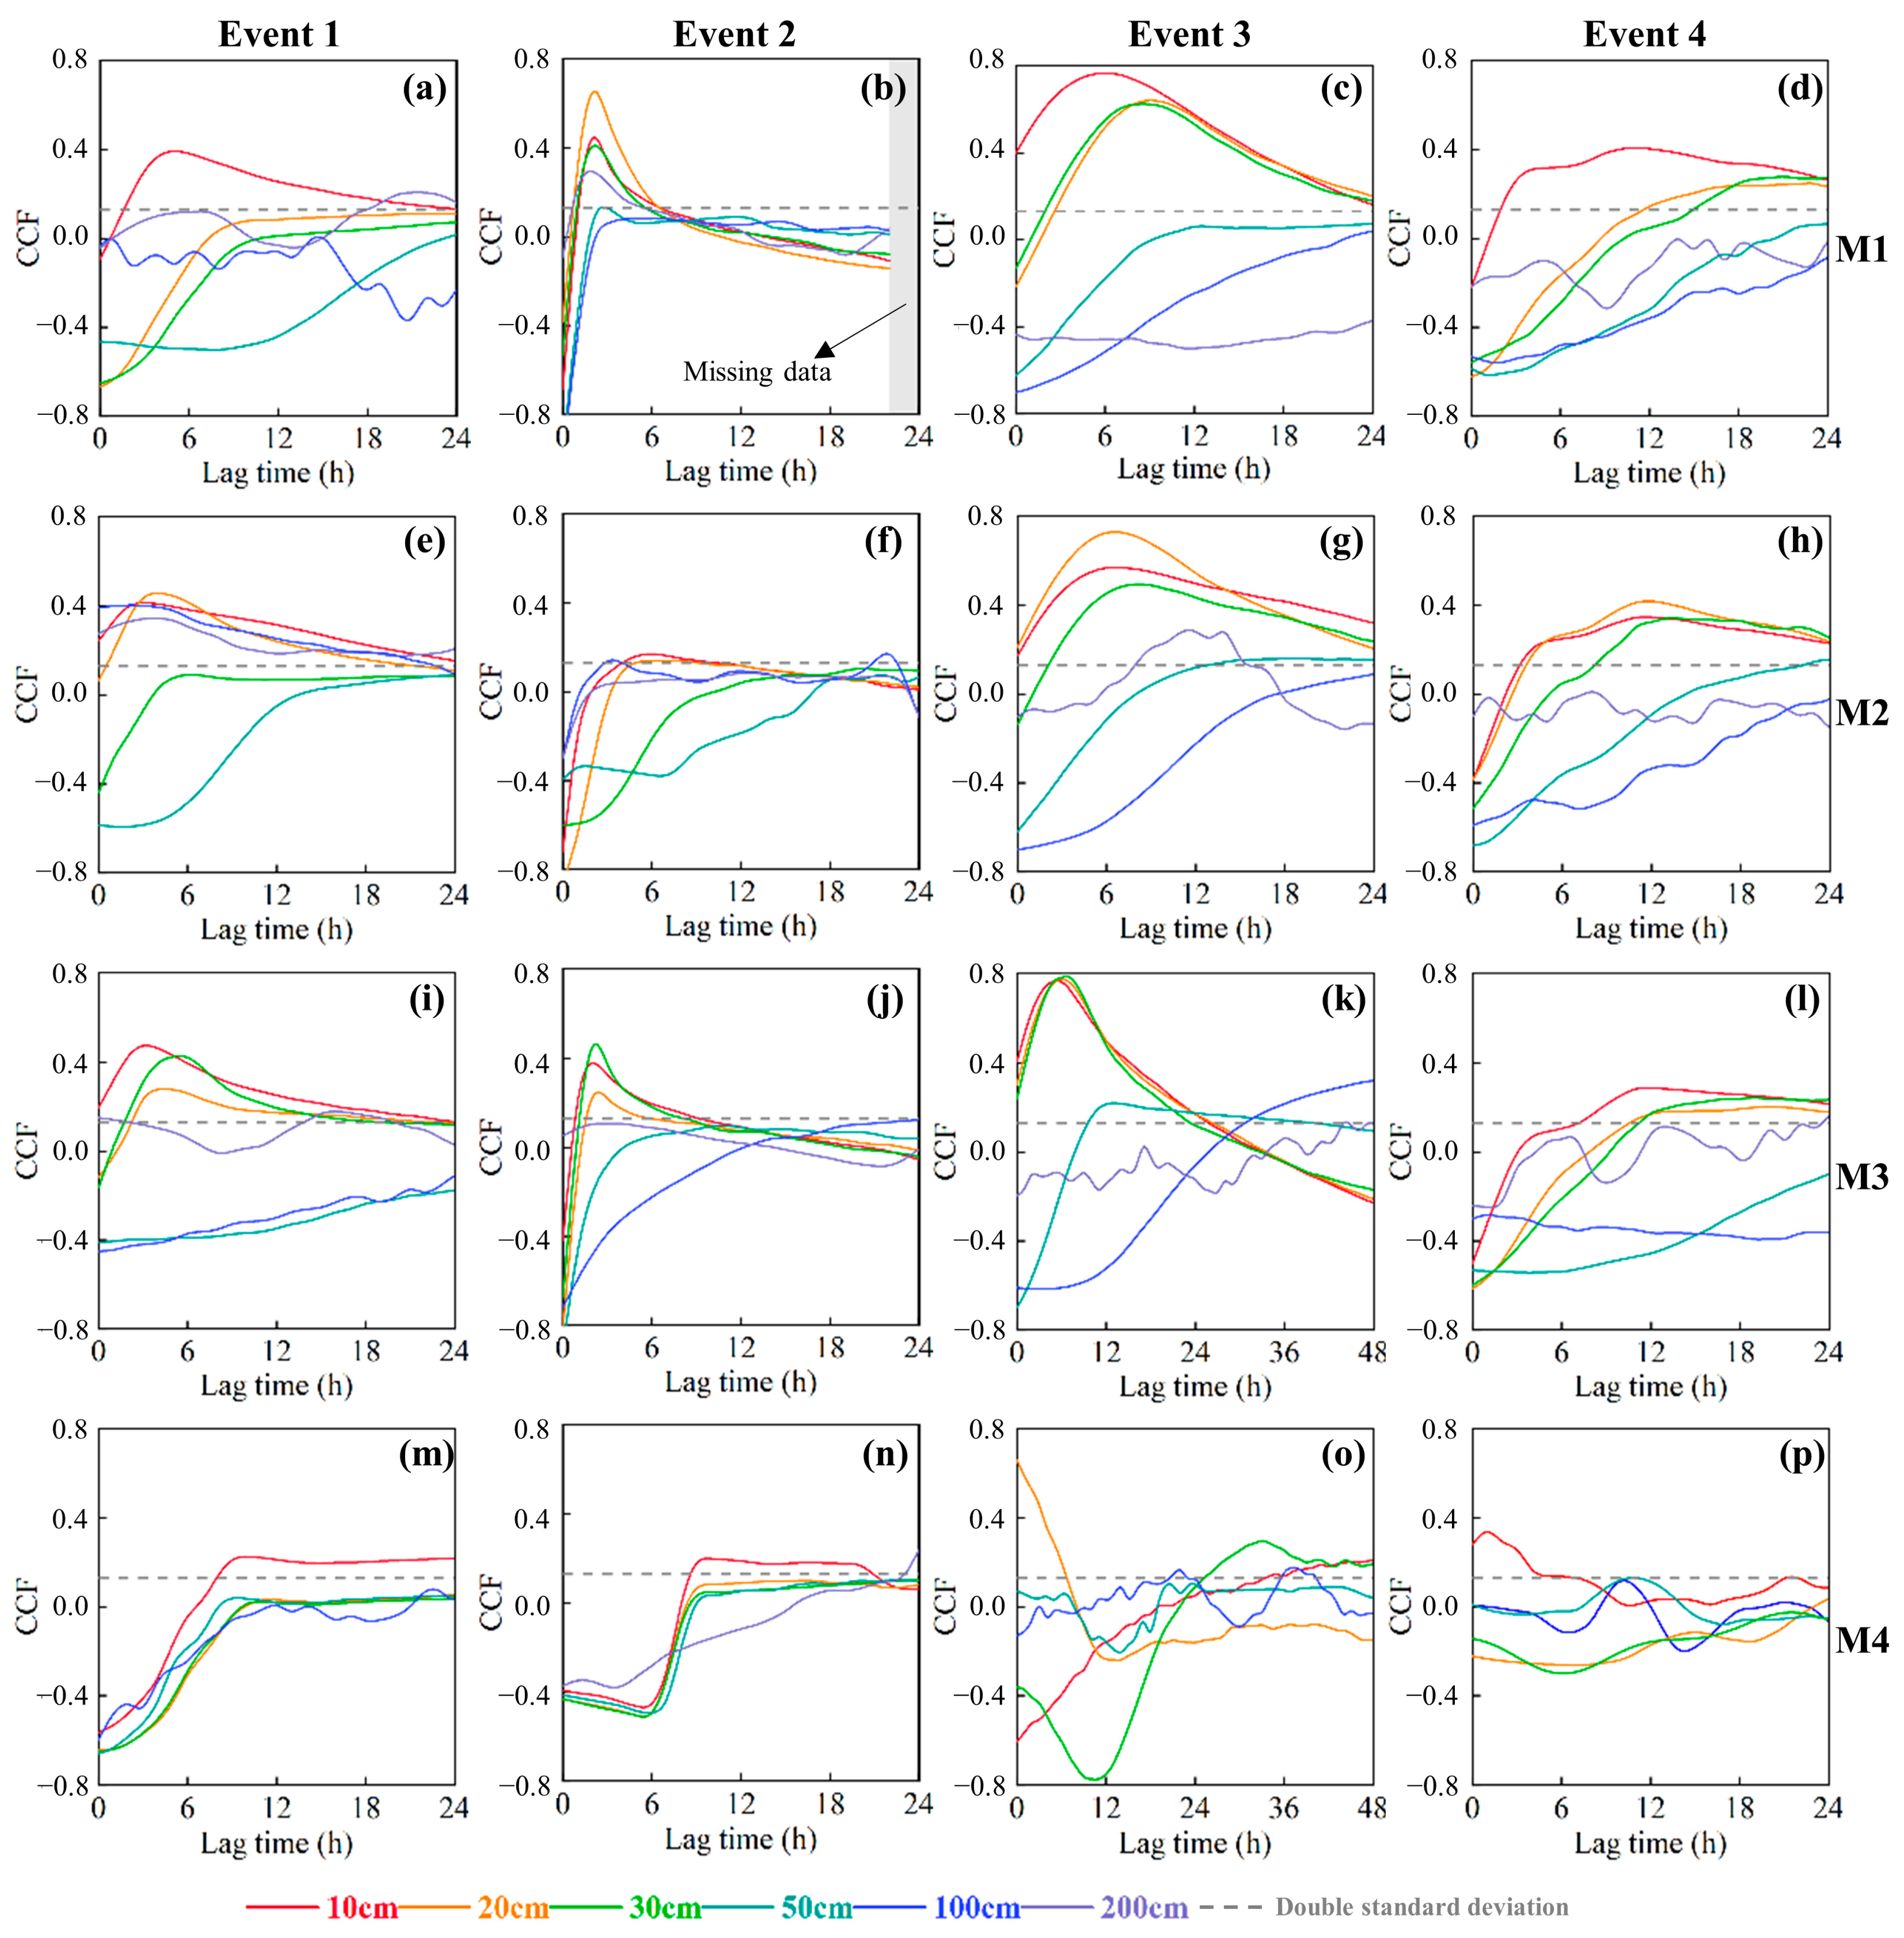
3.2. Analysis of the Correlation Between Rainfall and Soil Moisture
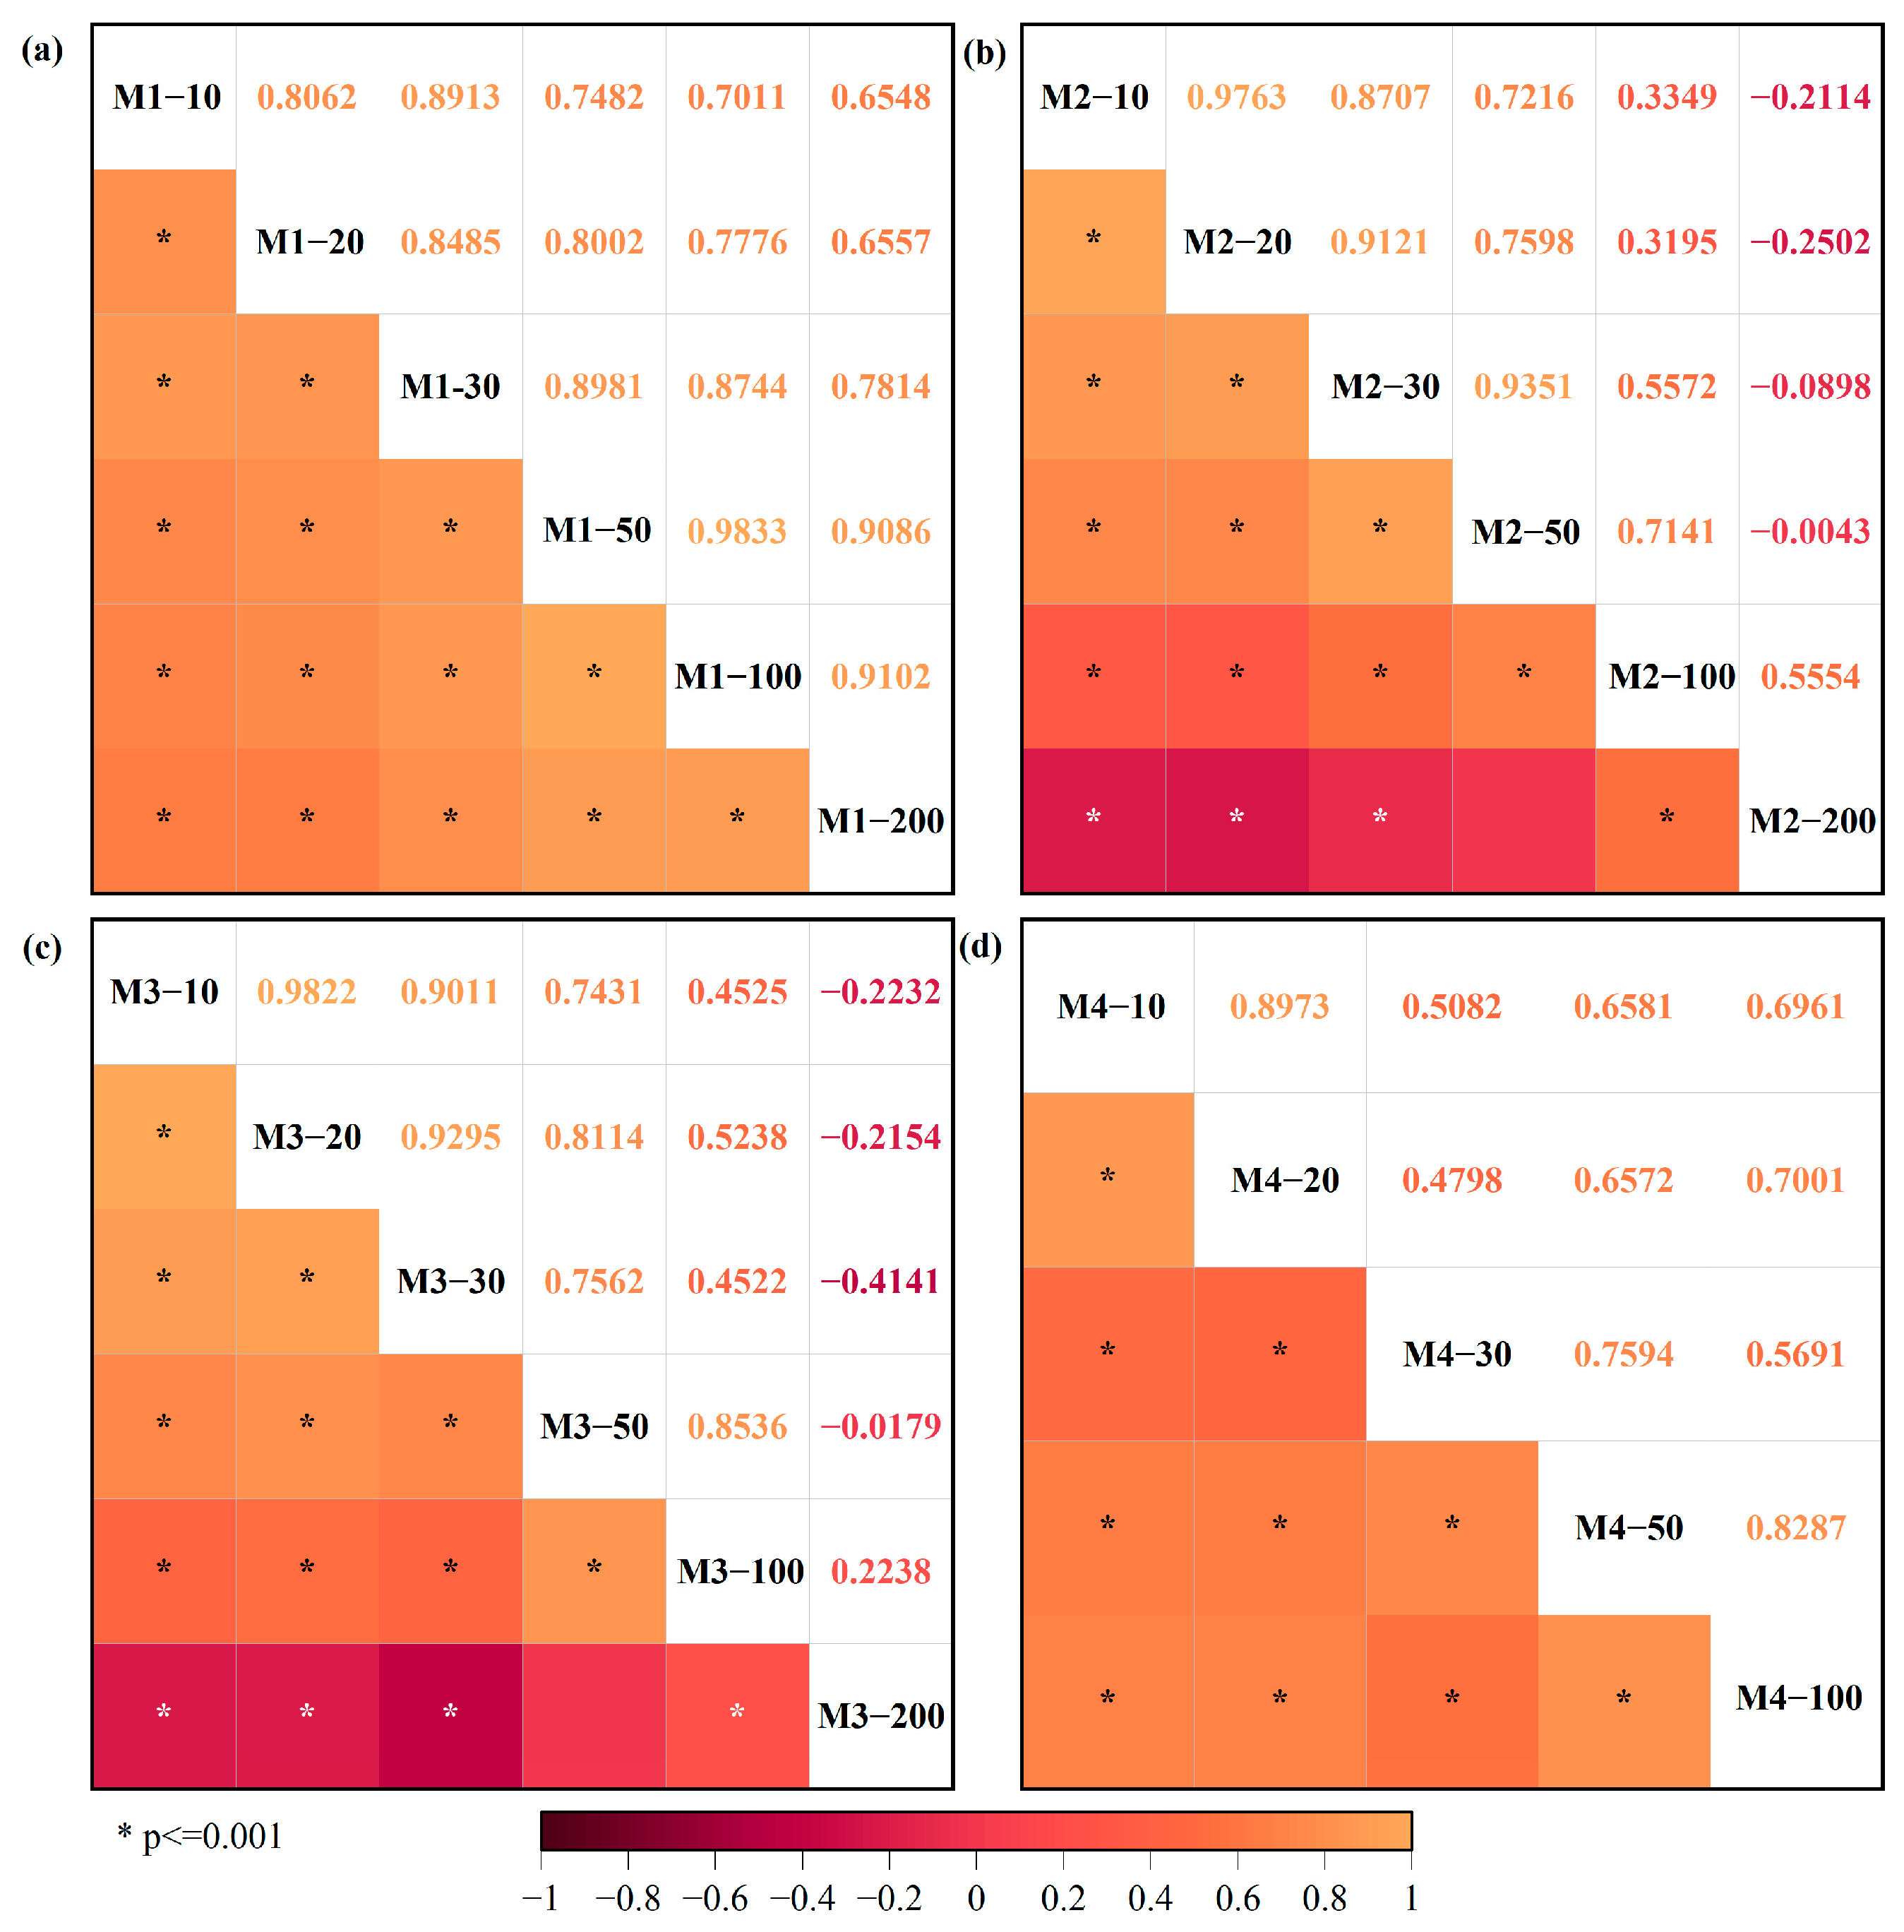
3.3. Temporal Stability Analysis of Soil Moisture
4. Discussion
4.1. Influence of Topographic Conditions on Soil Moisture Dynamics
4.2. Influence of Rainfall Characteristics on Soil Moisture Response
4.3. Soil Moisture Temporal Stability Distribution Characteristics
4.4. Engineering Significance and Applications
4.5. Future Research Objectives
- (1)
- Future studies can comprehensively consider the influence of environmental factors. The dynamics of soil moisture in slopes are influenced by multiple environmental factors, including rainfall, the air temperature, the wind speed, and more. In this study, we considered only rainfall and did not account for the interactions among other environmental factors. Future research should integrate multiple influencing factors and quantitatively analyze their relative contributions.
- (2)
- In future research, the integration of laboratory experiments with in situ monitoring data can be involved. Laboratory model experiments can provide an effective approach to analyzing the impacts of individual influencing factors. Future studies can conduct orthogonal experimental designs to investigate the effects of different rainfall characteristics on soil moisture movement and quantify rainfall thresholds. This would allow for a more precise understanding of the soil moisture responses to rainfall processes.
- (3)
- When conducting in situ experiments, the monitoring period can be appropriately extended. The study period of this research was six months, which may not fully capture the long-term characteristics of seasonal variations. Future studies should extend the monitoring period to analyze the evolution of soil moisture under seasonal factors (e.g., temperature, atmospheric humidity, and rainfall) from multiple temporal scales.
5. Conclusions
- (1)
- The topographic conditions significantly affect the spatial variability in the soil moisture, with the relative order being slope surface > slope step > flat terrain > slope foot. The vertical spatial variability in the soil moisture at different positions exhibits a decreasing trend with increasing depths.
- (2)
- When the rainfall intensity is similar, the PLT of the soil moisture is negatively correlated with the rainfall amount; when the rainfall amount is similar, an increase in the rainfall intensity can shorten the PLT at all positions except the step.
- (3)
- On the slope scale, the time stability of the soil moisture follows the relative order of flat terrain > slope surface > slope step > slope foot. The time stability of the soil moisture in the vertical profile is positively correlated with the depth.
- (4)
- When constructing high-fill slopes for agricultural use, it is advisable to construct steps to improve soil moisture conservation. As for soil moisture monitoring, it is recommended to conduct high-frequency monitoring in the shallow layer. The observation timie should be adjusted based on the rainfall conditions: after heavy rainfall events, monitoring should be conducted as soon as possible, while, during light or continuous rainfall events, sampling can be appropriately delayed.
Author Contributions
Funding
Data Availability Statement
Acknowledgments
Conflicts of Interest
References
- Huang, L.; Shao, M. Advances and Perspectives on Soil Water Research in China’s Loess Plateau. Earth-Sci. Rev. 2019, 199, 102962. [Google Scholar] [CrossRef]
- Kang, Y.; Gao, J.; Shao, H.; Zhang, Y.; Li, J.; Gao, Z. Evaluating the Flow and Sediment Effects of Gully Land Consolidation on the Loess Plateau, China. J. Hydrol. 2021, 600, 126535. [Google Scholar] [CrossRef]
- Guo, Z.; Huang, Q.; Liu, Y.; Wang, Q.; Chen, Y. Model Experimental Study on the Failure Mechanisms of a Loess-Bedrock Fill Slope Induced by Rainfall. Eng. Geol. 2023, 313, 106979. [Google Scholar] [CrossRef]
- Bao, H.; Liu, L.; Lan, H.; Peng, J.; Yan, C.; Tang, M.; Guo, G.; Zheng, H. Evolution of High-Filling Loess Slope under Long-Term Seasonal Fluctuation of Groundwater. Catena 2024, 238, 107898. [Google Scholar] [CrossRef]
- Huo, J.; Yu, X.; Liu, C.; Chen, L.; Zheng, W.; Yang, Y.; Tang, Z. Effects of Soil and Water Conservation Management and Rainfall Types on Runoff and Soil Loss for a Sloping Area in North China. Land Degrad. Dev. 2020, 31, 2117–2130. [Google Scholar] [CrossRef]
- Yuan, K.; Wang, H.; Ni, W.; Ren, S.; Guo, Y. New Insights into the Dynamic Changes of Loess Collapsibility under Climate-Induced Wetting–Drying Cycles: A Case Study of the Loess Plateau of China. CATENA 2025, 250, 108782. [Google Scholar] [CrossRef]
- Wang, L.; Shao, S.; She, F. A New Method for Evaluating Loess Collapsibility and Its Application. Eng. Geol. 2020, 264, 105376. [Google Scholar] [CrossRef]
- Zhang, S.; Shao, S.; Shao, S.; Wu, H.; Wang, Z. Change in the Microstructure and Fractal Characteristics of Intact and Compacted Loess Due to Its Collapsibility. Water 2024, 16, 228. [Google Scholar] [CrossRef]
- Zheng, Y.; Li, T.; Qi, D.; Xi, X.; Peng, F.; Ding, S.; Nie, Z.; Hu, X.; Zhao, G.; Xiao, B.; et al. Eco-Friendly Improvement of Comprehensive Engineering Properties of Collapsible Loess Using Guar Gum Biopolymer. Buildings 2024, 14, 3804. [Google Scholar] [CrossRef]
- Mu, J.; Zhuang, J.; Kong, J.; Wang, S.; Wang, J.; Zheng, J.; Fu, Y.; Du, C. Study on Improving Loess Properties with Permeable Polymer Materials. Polymers 2022, 14, 2862. [Google Scholar] [CrossRef]
- Leng, Y.; Peng, J.; Wang, S.; Lu, F. Development of Water Sensitivity Index of Loess from Its Mechanical Properties. Engineering Geology 2021, 280, 105918. [Google Scholar] [CrossRef]
- He, Z.; Jia, G.; Liu, Z.; Zhang, Z.; Yu, X.; Xiao, P. Field Studies on the Influence of Rainfall Intensity, Vegetation Cover and Slope Length on Soil Moisture Infiltration on Typical Watersheds of the Loess Plateau, China. Hydrol. Process. 2020, 34, 4904–4919. [Google Scholar] [CrossRef]
- Li, Y.; LI, K.; Zhou, Q.; Zhao, Y.; Cai, L.; Yang, Z. Spatiotemporal Dynamics and Similarity in Soil Moisture in Shallow Soils on Karst Slopes. J. Hydrol. 2024, 639, 131655. [Google Scholar] [CrossRef]
- Jin, Z.; Guo, L.; Lin, H.; Wang, Y.; Yu, Y.; Chu, G.; Zhang, J. Soil Moisture Response to Rainfall on the Chinese Loess Plateau after a Long-term Vegetation Rehabilitation. Hydrol. Process. 2018, 32, 1738–1754. [Google Scholar] [CrossRef]
- Ge, F.; Xu, M.; Gong, C.; Zhang, Z.; Tan, Q.; Pan, X. Land Cover Changes the Soil Moisture Response to Rainfall on the Loess Plateau. Hydrol. Process. 2022, 36, e14714. [Google Scholar] [CrossRef]
- Zhang, J.; Lan, Z.; Li, H.; Jaffar, M.T.; Li, X.; Cui, L.; Han, J. Coupling Effects of Soil Organic Carbon and Moisture under Different Land Use Types, Seasons and Slope Positions in the Loess Plateau. Catena 2023, 233, 107520. [Google Scholar] [CrossRef]
- Li, X.; Xu, X.; Liu, W.; He, L.; Zhang, R.; Xu, C.; Wang, K. Similarity of the Temporal Pattern of Soil Moisture across Soil Profile in Karst Catchments of Southwestern China. J. Hydrol. 2017, 555, 659–669. [Google Scholar] [CrossRef]
- Zhu, Q.; Nie, X.; Zhou, X.; Liao, K.; Li, H. Soil Moisture Response to Rainfall at Different Topographic Positions along a Mixed Land-Use Hillslope. CATENA 2014, 119, 61–70. [Google Scholar] [CrossRef]
- Zhu, P.; Zhang, G.; Wang, H.; Zhang, B.; Liu, Y. Soil Moisture Variations in Response to Precipitation Properties and Plant Communities on Steep Gully Slope on the Loess Plateau. Agric. Water Manag. 2021, 256, 107086. [Google Scholar] [CrossRef]
- Lan, H.; Zhao, Z.; Li, L.; Li, J.; Fu, B.; Tian, N.; Lai, R.; Zhou, S.; Zhu, Y.; Zhang, F.; et al. Climate Change Drives Flooding Risk Increases in the Yellow River Basin. Geogr. Sustain. 2024, 5, 193–199. [Google Scholar] [CrossRef]
- Yin, H.; Cao, Y.; Marelli, B.; Zeng, X.; Mason, A.J.; Cao, C. Soil Sensors and Plant Wearables for Smart and Precision Agriculture. Adv. Mater. 2021, 33, 2007764. [Google Scholar] [CrossRef] [PubMed]
- Mane, S.; Das, N.; Singh, G.; Cosh, M.; Dong, Y. Advancements in Dielectric Soil Moisture Sensor Calibration: A Comprehensive Review of Methods and Techniques. Comput. Electron. Agr. 2024, 218, 108686. [Google Scholar] [CrossRef]
- Bandaru, L.; Irigireddy, B.C.; Pvnr, K.; Davis, B. DeepQC: A Deep Learning System for Automatic Quality Control of in-Situ Soil Moisture Sensor Time Series Data. Smart Agric. Technol. 2024, 8, 100514. [Google Scholar] [CrossRef]
- Pijl, A.; Quarella, E.; Vogel, T.A.; D’Agostino, V.; Tarolli, P. Remote Sensing vs. Field-Based Monitoring of Agricultural Terrace Degradation. Int. Soil Water Conserv. Res. 2021, 9, 1–10. [Google Scholar] [CrossRef]
- Zhang, D.; Zhou, G. Estimation of Soil Moisture from Optical and Thermal Remote Sensing: A Review. Sensors 2016, 16, 1308. [Google Scholar] [CrossRef]
- Sun, L.; Guo, H.; Chen, Z.; Yin, Z.; Feng, H.; Wu, S.; Siddique, K.H.M. Check Dam Extraction from Remote Sensing Images Using Deep Learning and Geospatial Analysis: A Case Study in the Yanhe River Basin of the Loess Plateau, China. J. Arid Land 2023, 15, 34–51. [Google Scholar] [CrossRef]
- Li, M.; Sun, H.; Zhao, R. A Review of Root Zone Soil Moisture Estimation Methods Based on Remote Sensing. Remote Sens. 2023, 15, 5361. [Google Scholar] [CrossRef]
- Li, X.; Wang, X.; Wu, J.; Luo, W.; Tian, L.; Wang, Y.; Liu, Y.; Zhang, L.; Zhao, C.; Zhang, W. Soil Moisture Monitoring and Evaluation in Agricultural Fields Based on NDVI Long Time Series and CEEMDAN. Remote Sens. 2023, 15, 5008. [Google Scholar] [CrossRef]
- Zhang, P.; Shao, M. Temporal Stability of Surface Soil Moisture in a Desert Area of Northwestern China. J. Hydrol. 2013, 505, 91–101. [Google Scholar] [CrossRef]
- Wang, Y.; Zhao, H.; Fan, J.; Wang, C.; Ji, X.; Jin, D.; Chen, J. A Review of Earth’s Surface Soil Moisture Retrieval Models via Remote Sensing. Water 2023, 15, 3757. [Google Scholar] [CrossRef]
- Li, Z.; Leng, P.; Zhou, C.; Chen, K.; Zhou, F.; Shang, G. Soil Moisture Retrieval from Remote Sensing Measurements: Current Knowledge and Directions for the Future. Earth-Sci. Rev. 2021, 218, 103673. [Google Scholar] [CrossRef]
- Romano, N. Soil Moisture at Local Scale: Measurements and Simulations. J. Hydrol. 2014, 516, 6–20. [Google Scholar] [CrossRef]
- Cosh, M.H.; Caldwell, T.G.; Baker, C.B.; Bolten, J.D.; Edwards, N.; Goble, P.; Hofman, H.; Ochsner, T.E.; Quiring, S.; Schalk, C.; et al. Developing a Strategy for the National Coordinated Soil Moisture Monitoring Network. Vadose Zone J. 2021, 20, e20139. [Google Scholar] [CrossRef]
- Hou, X.; Qi, S.; Yu, Y.; Zheng, J. Long-Term Settlement Characterization of High-Filling Foundation in the Mountain Excavation and City Construction Area of the Yan’an New District, China. J. Earth Sci. 2023, 34, 1908–1915. [Google Scholar] [CrossRef]
- Zhao, Y.; Yi, J.; Yao, R.; Li, F.; Hill, R.L.; Gerke, H.H. Dimensionality and Scales of Preferential Flow in Soils of Shale Hills Hillslope Simulated Using HYDRUS. Vadose Zone J. 2024, 23, e20367. [Google Scholar] [CrossRef]
- Zhou, X.; Hu, K.; Xiao, H.; Yang, Y.; Chen, J.; Cheng, Y. Effects of Vegetation on the Spatiotemporal Distribution of Soil Water Content in Re-Vegetated Slopes Using Temporal Stability Analysis. CATENA 2024, 234, 107570. [Google Scholar] [CrossRef]
- Li, X.; Shao, M.; Jia, X.; Wei, X.; He, L. Depth Persistence of the Spatial Pattern of Soil–Water Storage along a Small Transect in the Loess Plateau of China. J. Hydrol. 2015, 529, 685–695. [Google Scholar] [CrossRef]
- Li, L.; Wang, Z.; Yin, S.; Wang, W.; Yu, Z.; Fan, W.; Zhang, Z. Selection and Application of Wavelet Transform in High-Frequency Sequence Stratigraphy Analysis of Coarse-Grained Sediment in Rift Basin. Petrol. Sci. 2024, 21, 3016–3028. [Google Scholar] [CrossRef]
- Sang, Y. A Review on the Applications of Wavelet Transform in Hydrology Time Series Analysis. Atmos. Res. 2013, 122, 8–15. [Google Scholar] [CrossRef]
- Yinglan, A.; Jiang, X.; Wang, Y.; Wang, L.; Zhang, Z.; Duan, L.; Fang, Q. Study on Spatio-Temporal Simulation and Prediction of Regional Deep Soil Moisture Using Machine Learning. J. Contam. Hydrol. 2023, 258, 104235. [Google Scholar] [CrossRef]
- Yao, S.; Zhao, C. Application of Time Series Analysis in Soil Moisture of Fixed Dune on Korqin Sandy Land, Northern China. Global. NEST J 2020, 22, 471–476. [Google Scholar] [CrossRef]
- Chen, L.; Sela, S.; Svoray, T.; Assouline, S. The Role of Soil-Surface Sealing, Microtopography, and Vegetation Patches in Rainfall-Runoff Processes in Semiarid Areas. Water Resour. Res. 2013, 49, 5585–5599. [Google Scholar] [CrossRef]
- Armenise, E.; Simmons, R.W.; Ahn, S.; Garbout, A.; Doerr, S.H.; Mooney, S.J.; Sturrock, C.J.; Ritz, K. Soil Seal Development under Simulated Rainfall: Structural, Physical and Hydrological Dynamics. J. Hydrol. 2018, 556, 211–219. [Google Scholar] [CrossRef] [PubMed]
- Zhao, C.; Jia, X.; Zhu, Y.; Shao, M. Long-Term Temporal Variations of Soil Water Content under Different Vegetation Types in the Loess Plateau, China. CATENA 2017, 158, 55–62. [Google Scholar] [CrossRef]
- Zhou, T.; Han, C.; Qiao, L.; Ren, C.; Wen, T.; Zhao, C. Seasonal Dynamics of Soil Water Content in the Typical Vegetation and Its Response to Precipitation in a Semi-Arid Area of Chinese Loess Plateau. J. Arid Land 2021, 13, 1015–1025. [Google Scholar] [CrossRef]
- Vachaud, G.; Passerat De Silans, A.; Balabanis, P.; Vauclin, M. Temporal Stability of Spatially Measured Soil Water Probability Density Function. Soil Sci. Soc. Am. J. 1985, 49, 822–828. [Google Scholar] [CrossRef]
- Deng, Z.; Lan, H.; Li, L.; Sun, W. Vegetation-Induced Modifications in Hydrological Processes and the Consequential Dynamic Effects of Slope Stability. CATENA 2025, 251, 108793. [Google Scholar] [CrossRef]
- QX/T 489-2019; Grade of Rainfall Process. China Meteorological Administration: Beijing, China, 2019.
- Gao, L.; Shao, M. Temporal Stability of Soil Water Storage in Diverse Soil Layers. CATENA 2012, 95, 24–32. [Google Scholar] [CrossRef]
- Morbidelli, R.; Saltalippi, C.; Flammini, A.; Govindaraju, R.S. Role of Slope on Infiltration: A Review. J. Hydrol. 2018, 557, 878–886. [Google Scholar] [CrossRef]
- Liu, M.; Wang, Q.; Guo, L.; Yi, J.; Lin, H.; Zhu, Q.; Fan, B.; Zhang, H. Influence of Canopy and Topographic Position on Soil Moisture Response to Rainfall in a Hilly Catchment of Three Gorges Reservoir Area, China. J. Geogr. Sci. 2020, 30, 949–968. [Google Scholar] [CrossRef]
- Xu, Y.; Zhu, G.; Wan, Q.; Yong, L.; Ma, H.; Sun, Z.; Zhang, Z.; Qiu, D. Effect of Terrace Construction on Soil Moisture in Rain-Fed Farming Area of Loess Plateau. J. Hydrol. Reg. Stud. 2021, 37, 100889. [Google Scholar] [CrossRef]
- Chang, Z.; Huang, F.; Huang, J.; Jiang, S.-H.; Zhou, C.; Zhu, L. Experimental Study of the Failure Mode and Mechanism of Loess Fill Slopes Induced by Rainfall. Eng. Geol. 2021, 280, 105941. [Google Scholar] [CrossRef]
- Chen, X.; Hu, Q. Groundwater Influences on Soil Moisture and Surface Evaporation. J. Hydrol. 2004, 297, 285–300. [Google Scholar] [CrossRef]
- Zhao, Z.; Shen, Y.; Wang, Q.; Jiang, R. The Temporal Stability of Soil Moisture Spatial Pattern and Its Influencing Factors in Rocky Environments. CATENA 2020, 187, 104418. [Google Scholar] [CrossRef]
- Han, L.; Chang, Y.; Chen, R.; Liu, Z.; Zhao, Y.; Zhu, H.; Zhao, Z.; Gao, Y.; Yang, M.; Li, Y.; et al. Response of Soil Moisture to Vegetation and Trade-off Analysis in the Hilly Area of the Loess Plateau, China. Ecol. Indic. 2022, 142, 109273. [Google Scholar] [CrossRef]
- Huang, J.; Wu, P.; Zhao, X. Effects of Rainfall Intensity, Underlying Surface and Slope Gradient on Soil Infiltration under Simulated Rainfall Experiments. CATENA 2013, 104, 93–102. [Google Scholar] [CrossRef]
- Liu, J.; Hu, F.; Xu, C.; Wang, Z.; Ma, R.; Zhao, S.; Liu, G. Comparison of Different Methods for Assessing Effects of Soil Interparticle Forces on Aggregate Stability. Geoderma 2021, 385, 114834. [Google Scholar] [CrossRef]
- Chen, M.; Yang, X.; Zhang, X.; Bai, Y.; Shao, M.; Wei, X.; Jia, Y.; Wang, Y.; Jia, X.; Zhu, Y.; et al. Response of Soil Water to Long-Term Revegetation, Topography, and Precipitation on the Chinese Loess Plateau. CATENA 2024, 236, 107711. [Google Scholar] [CrossRef]
- Wei, L.; Yang, M.; Li, Z.; Shao, J.; Li, L.; Chen, P.; Li, S.; Zhao, R. Experimental Investigation of Relationship between Infiltration Rate and Soil Moisture under Rainfall Conditions. Water 2022, 14, 1347. [Google Scholar] [CrossRef]
- Wu, S.; Ma, D.; Liu, Z.; Chen, L.; Chen, L.; Zhang, J. A Novel Approximate Solution to Slope Rainfall Infiltration. J. Hydrol. 2023, 625, 130039. [Google Scholar] [CrossRef]
- Wu, S.; Chui, T.F.M.; Chen, L. Modeling Slope Rainfall-Infiltration-Runoff Process with Shallow Water Table during Complex Rainfall Patterns. J. Hydrol. 2021, 599, 126458. [Google Scholar] [CrossRef]
- Zhu, P.; Zhang, G.; Zhang, B. Soil Saturated Hydraulic Conductivity of Typical Revegetated Plants on Steep Gully Slopes of Chinese Loess Plateau. Geoderma 2022, 412, 115717. [Google Scholar] [CrossRef]
- Chen, L.; Zhu, G.; Lin, X.; Li, R.; Lu, S.; Jiao, Y.; Qiu, D.; Meng, G.; Wang, Q. The Complexity of Moisture Sources Affects the Altitude Effect of Stable Isotopes of Precipitation in Inland Mountainous Regions. Water Resour. Res. 2024, 60, e2023WR036084. [Google Scholar] [CrossRef]
- He, Z.; Zhao, M.; Zhu, X.; Du, J.; Chen, L.; Lin, P.; Li, J. Temporal Stability of Soil Water Storage in Multiple Soil Layers in High-Elevation Forests. J. Hydrol. 2019, 569, 532–545. [Google Scholar] [CrossRef]
- Shan, Y.; Xie, J.; Han, J.; Lei, N.; Dong, Q. Soil Moisture Characteristics and Temporal Stability on the Slope of the Loess Plateau: A Case Study of Jiulongquan Ditch in Yan’an City. Sci. Soil. Water. Conserv. 2021, 19, 1–7. [Google Scholar] [CrossRef]
- Yong, X.; Zhang, Y.; Hou, Y.; Han, B.; An, N.; Zhang, H.; Ma, Y. Stability of Loess High-Fill Slope Based on Monitored Soil Moisture Changes. Res. Cold. Arid. Reg. 2023, 15, 191–201. [Google Scholar] [CrossRef]
- Wei, W.; Feng, X.; Yang, L.; Chen, L.; Feng, T.; Chen, D. The Effects of Terracing and Vegetation on Soil Moisture Retention in a Dry Hilly Catchment in China. Sci. Total. Environ. 2019, 647, 1323–1332. [Google Scholar] [CrossRef]

| Depth (cm) | Dry Density (g/cm3) | Void Ratio | Hydraulic Conductivity (10−3 cm/s) | Plastic Limit (%) | Plastic Index | Particle Size Distribution (%) | ||
|---|---|---|---|---|---|---|---|---|
| Clay | Silt | Sand | ||||||
| 10 | 1.42 | 0.87 | 0.39 | 16.59 | 12.98 | 12.62 | 77.41 | 9.97 |
| 50 | 1.60 | 0.69 | 0.09 | |||||
| Parameter | Sensor | Type | Period | Precision | Resolution | Quantity |
|---|---|---|---|---|---|---|
| Moisture content | Moisture content sensor | MS10 | 10 min | 2–3% | 0.03–1% | 72 |
| Groundwater level | Liquid level sensor | Onset HOBO U20L-01 | 10 min | ±0.1%FS, 1.0 cm | <0.02 kPa; 0.21 cm | 12 |
| Rainfall | Rain gauge | JDZ02-1 | 0.2 mm | 0.2 mm | ≤±4% | 1 |
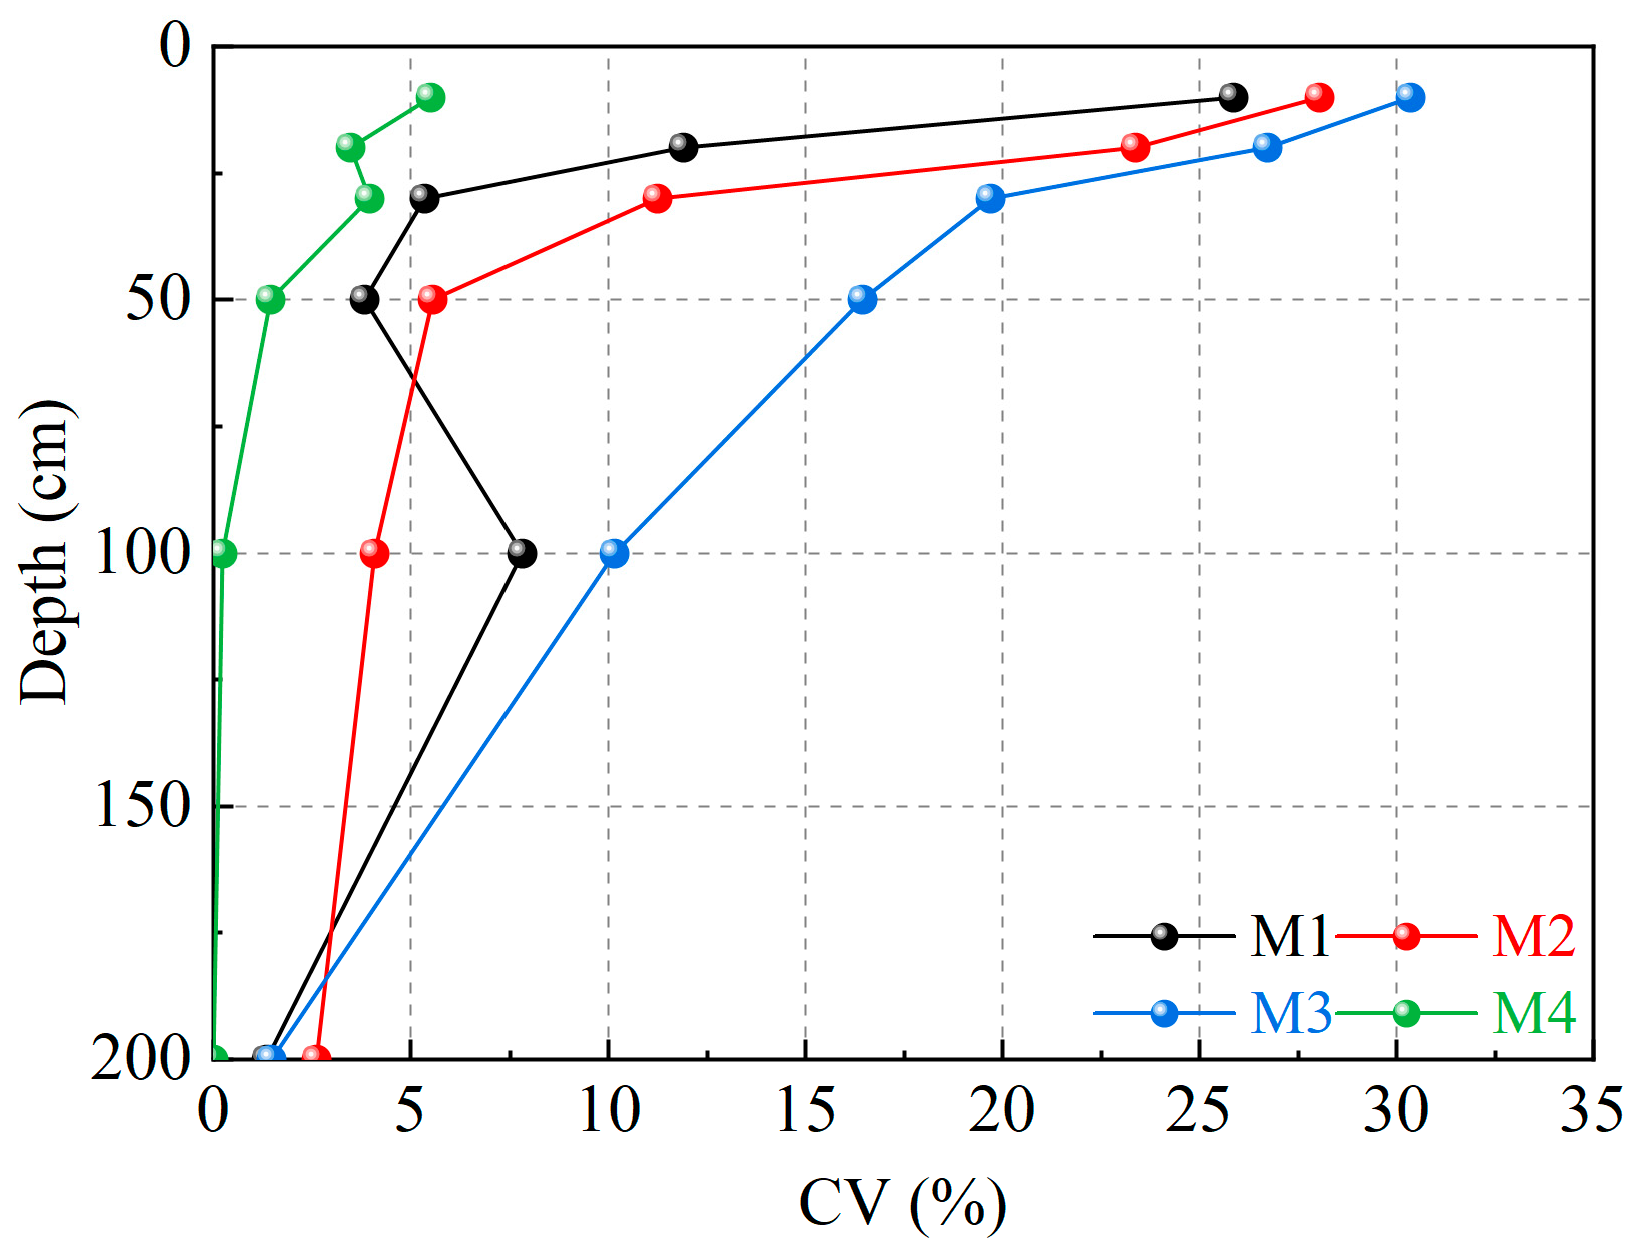
| Depth (cm) | Avg (cm3/cm3) | Max (cm3/cm3) | Min (cm3/cm3) | CV (%) | |
|---|---|---|---|---|---|
| M1 | 10 | 19.52 | 33.91 | 8.19 | 25.87 |
| 20 | 23.29 | 37.29 | 9.86 | 11.90 | |
| 30 | 27.48 | 32.15 | 22.22 | 5.35 | |
| 50 | 28.49 | 29.93 | 23.53 | 3.84 | |
| 100 | 46.16 | 50.46 | 34.65 | 7.83 | |
| 200 | 46.29 | 47.79 | 44.33 | 1.35 | |
| M2 | 10 | 21.76 | 32.43 | 8.78 | 28.05 |
| 20 | 17.42 | 25.84 | 7.73 | 23.38 | |
| 30 | 25.48 | 28.43 | 13.73 | 11.25 | |
| 50 | 27.49 | 30.79 | 21.71 | 5.56 | |
| 100 | 27.30 | 28.71 | 24.98 | 4.08 | |
| 200 | 25.56 | 26.38 | 24.44 | 2.60 | |
| M3 | 10 | 20.42 | 33.28 | 7.42 | 30.36 |
| 20 | 25.00 | 35.43 | 9.63 | 26.72 | |
| 30 | 24.80 | 31.41 | 11.63 | 19.69 | |
| 50 | 20.07 | 26.65 | 9.19 | 16.45 | |
| 100 | 17.11 | 20.49 | 11.17 | 10.16 | |
| 200 | 31.60 | 32.31 | 30.4 | 1.47 | |
| M4 | 10 | 34.55 | 36.34 | 25.03 | 5.50 |
| 20 | 34.35 | 35.43 | 28.99 | 3.47 | |
| 30 | 33.62 | 35.66 | 27.82 | 3.97 | |
| 50 | 35.00 | 35.43 | 32.09 | 1.45 | |
| 100 | 34.83 | 34.99 | 34.54 | 0.22 |
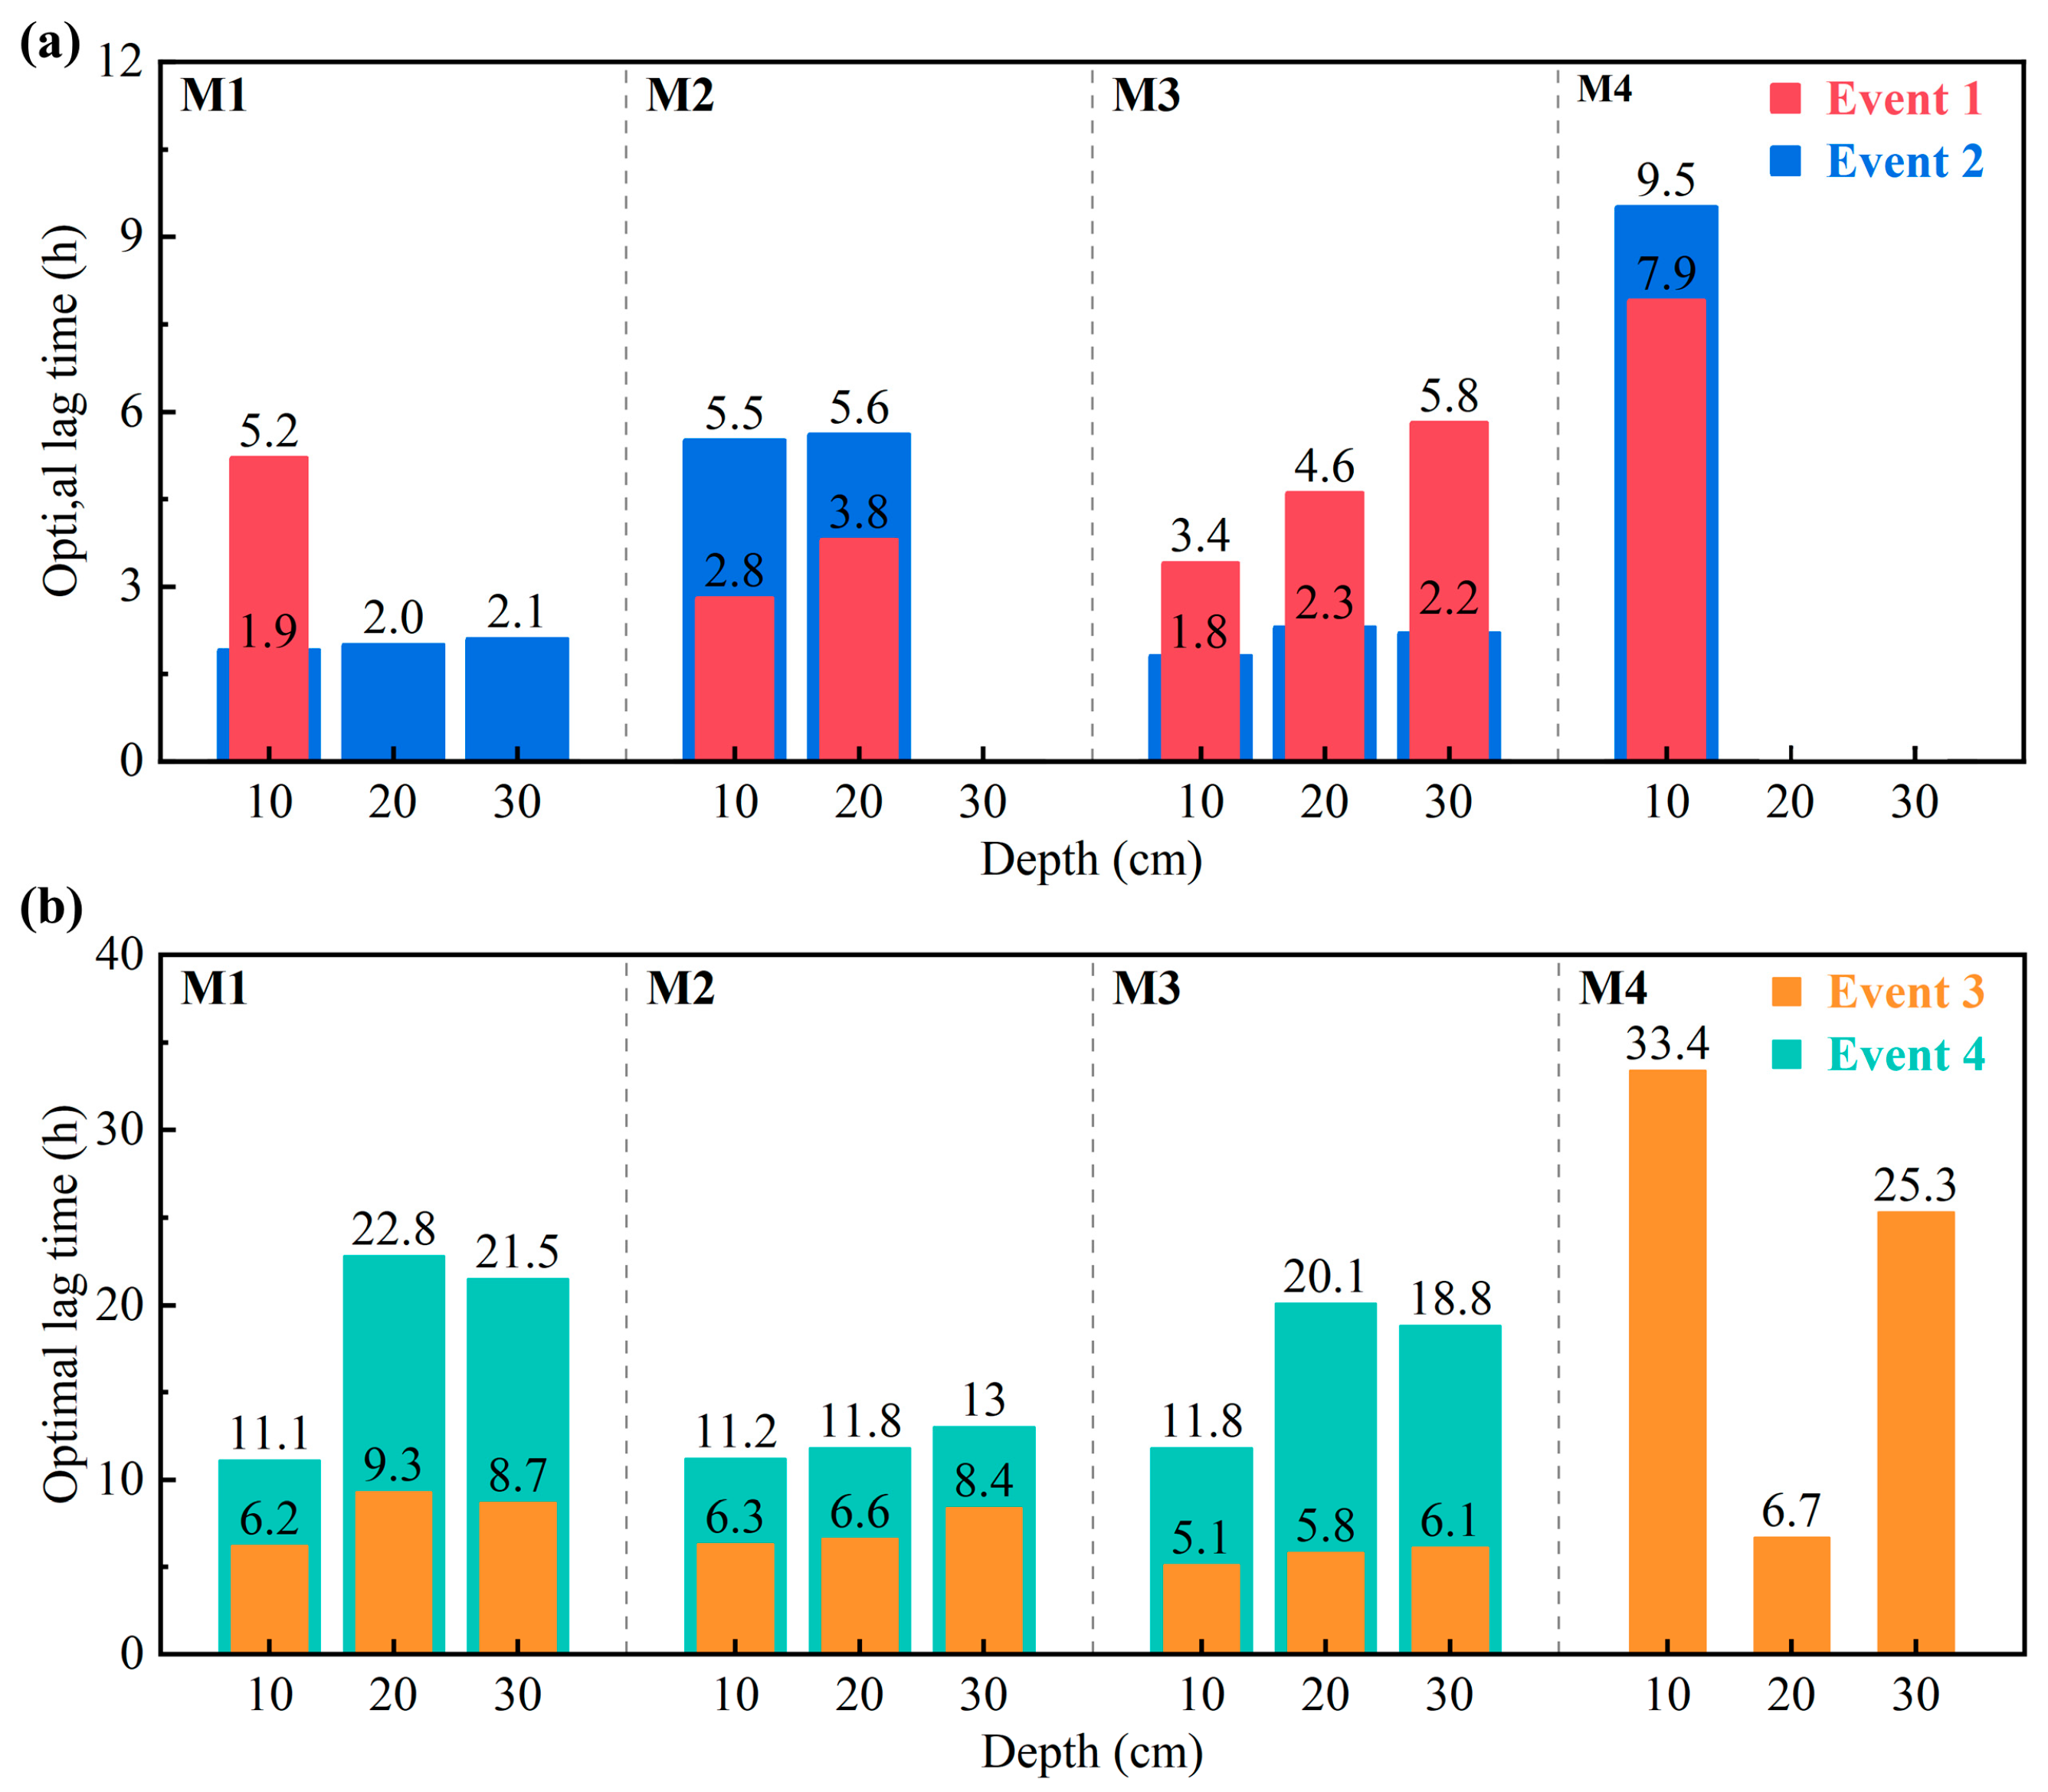
| Depth (cm) | M1 | M2 | M3 | M4 | |
|---|---|---|---|---|---|
| Event 1 | 10 | 5.2 | 2.8 | 3.4 | 7.9 |
| 20 | / | 3.8 | 4.6 | / | |
| 30 | / | / | 5.8 | / | |
| 50 | / | / | 44.2 | / | |
| Event 2 | 10 | 1.9 | 5.5 | 1.8 | 9.5 |
| 20 | 2 | 5.6 | 2.3 | / | |
| 30 | 2.1 | / | 2.2 | / | |
| 50 | / | / | / | / | |
| Event 3 | 10 | 6.2 | 6.3 | 5.1 | 33.4 |
| 20 | 9.3 | 6.6 | 5.8 | 6.7 | |
| 30 | 8.7 | 8.4 | 6.1 | 25.3 | |
| 50 | / | / | 12.2 | / | |
| Event 4 | 10 | 11.1 | 11.2 | 11.8 | / |
| 20 | 22.8 | 11.8 | 20.1 | / | |
| 30 | 21.5 | 13.0 | 18.8 | / | |
| 50 | / | 32.4 | / | / |
Disclaimer/Publisher’s Note: The statements, opinions and data contained in all publications are solely those of the individual author(s) and contributor(s) and not of MDPI and/or the editor(s). MDPI and/or the editor(s) disclaim responsibility for any injury to people or property resulting from any ideas, methods, instructions or products referred to in the content. |
© 2025 by the authors. Licensee MDPI, Basel, Switzerland. This article is an open access article distributed under the terms and conditions of the Creative Commons Attribution (CC BY) license (https://creativecommons.org/licenses/by/4.0/).
Share and Cite
Ji, C.; Wang, T.; Bao, H.; Lan, H.; Dong, Q.; Li, L.; Wang, J.; Yang, L. Time Series Analysis and Temporal Stability of Shallow Soil Moisture in a High-Fill Slope of the Loess Plateau, China. Water 2025, 17, 1140. https://doi.org/10.3390/w17081140
Ji C, Wang T, Bao H, Lan H, Dong Q, Li L, Wang J, Yang L. Time Series Analysis and Temporal Stability of Shallow Soil Moisture in a High-Fill Slope of the Loess Plateau, China. Water. 2025; 17(8):1140. https://doi.org/10.3390/w17081140
Chicago/Turabian StyleJi, Chenlin, Tianyi Wang, Han Bao, Hengxing Lan, Qi Dong, Langping Li, Juntian Wang, and Liya Yang. 2025. "Time Series Analysis and Temporal Stability of Shallow Soil Moisture in a High-Fill Slope of the Loess Plateau, China" Water 17, no. 8: 1140. https://doi.org/10.3390/w17081140
APA StyleJi, C., Wang, T., Bao, H., Lan, H., Dong, Q., Li, L., Wang, J., & Yang, L. (2025). Time Series Analysis and Temporal Stability of Shallow Soil Moisture in a High-Fill Slope of the Loess Plateau, China. Water, 17(8), 1140. https://doi.org/10.3390/w17081140